-

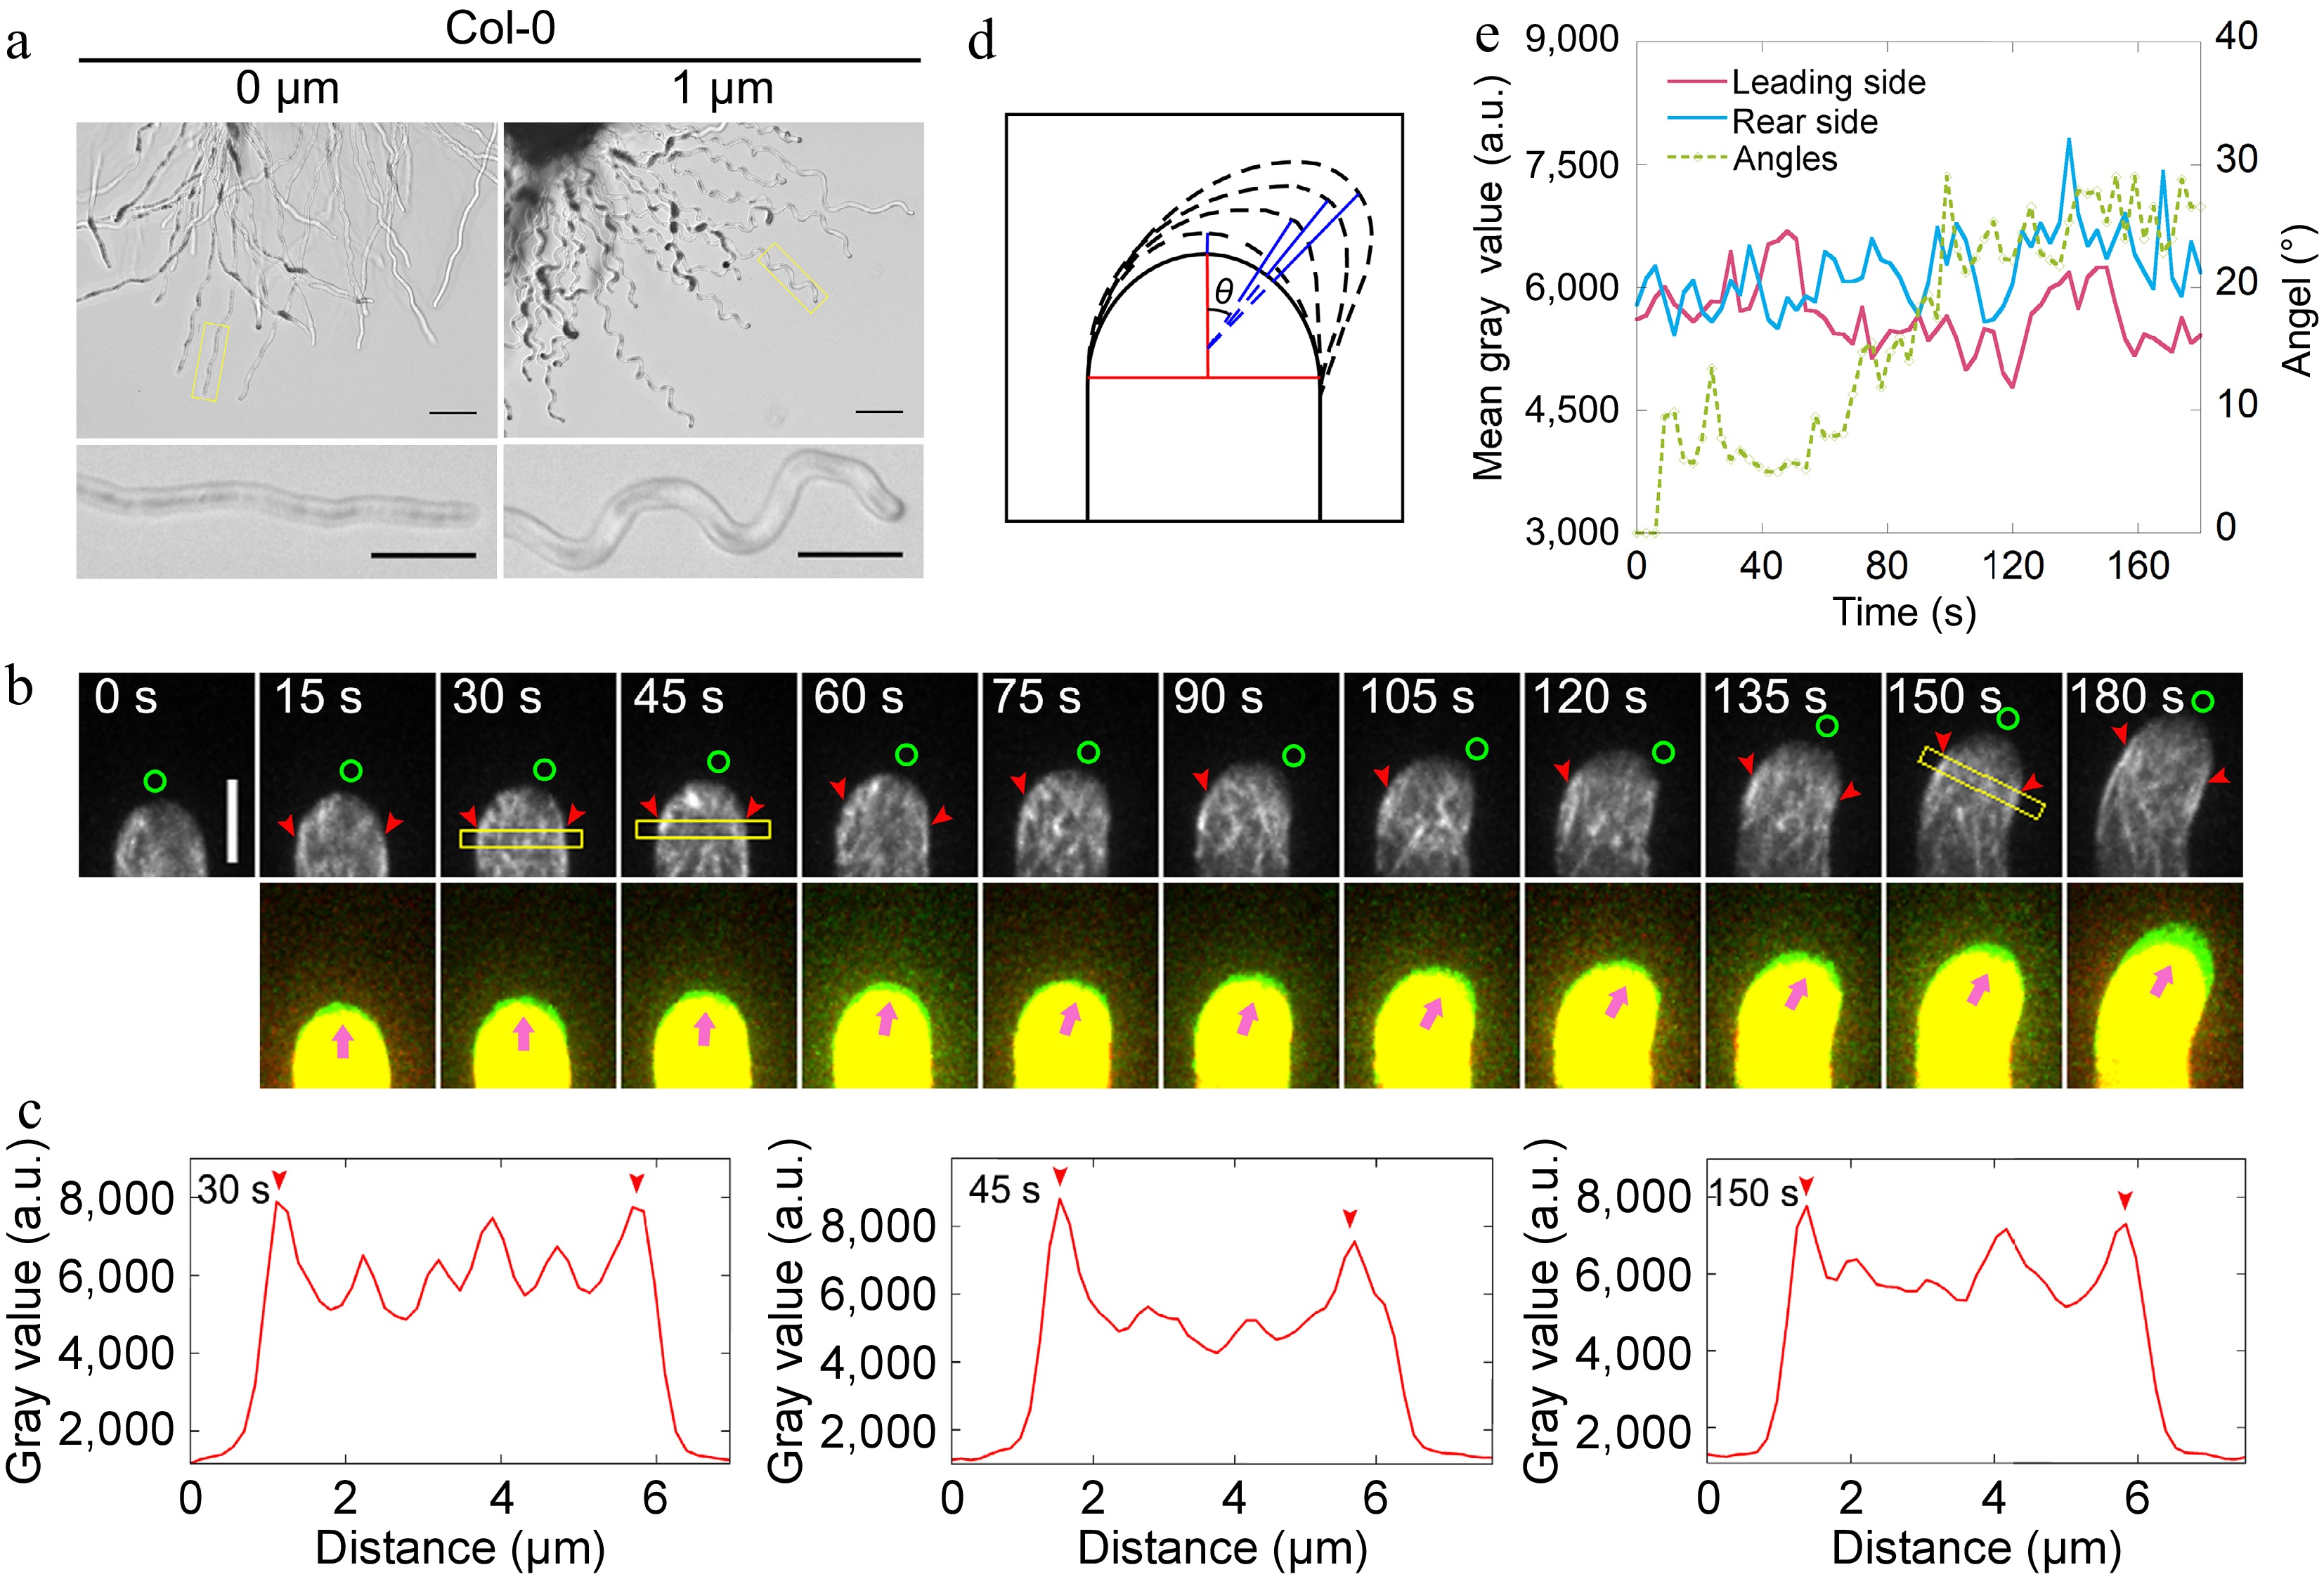
Figure 1.
Actin filaments undergo depolymerization and repolymerization at the leading side of the pollen tube during AtLURE1.2-induced turning. (a) Semi-in vitro AtLURE1.2-responsive wavy assay for wild-type (Col-0) 4−6 h after pollination (HAP). The pollen tubes of wild-type show wavy tip growth on the solid PGM containing 1 μM AtLURE1.2 peptides. Scale bars, 50 μm (top) and 20 μm (bottom). The micrographs are representative of three samples. (b) Time-lapse images of actin filaments during AtLURE1.2-induced turning of a semi-in vitro growth wild-type pollen tube. The lower panel shows the merged images from two time points, in which the newly grown portion of pollen tubes between two time points was green colored. Green circles in the upper panel and pink arrowheads in the lower panel indicate the pollen tube growth direction, red arrowheads indicate the cortical apical actin filaments. Scale bar, 5 μm. (c) Quantification of the fluorescence intensity of apical actin filaments within yellow boxed square in (b). Red arrowheads indicate the peaks of fluorescence. (d) Schematic describing the quantification of the turning angles. The red vertical line shows the initial tube growth direction and the blue lines show the new growth direction, θ is the included angle of each blue line with the red line, θ change indicates the turning of the pollen tube. (e) Analysis of the fluorescence intensity of the pollen tube in (b) on both sides of the top region 2.5 to 3.5 μm away from the tip and the tube turning over time.
-

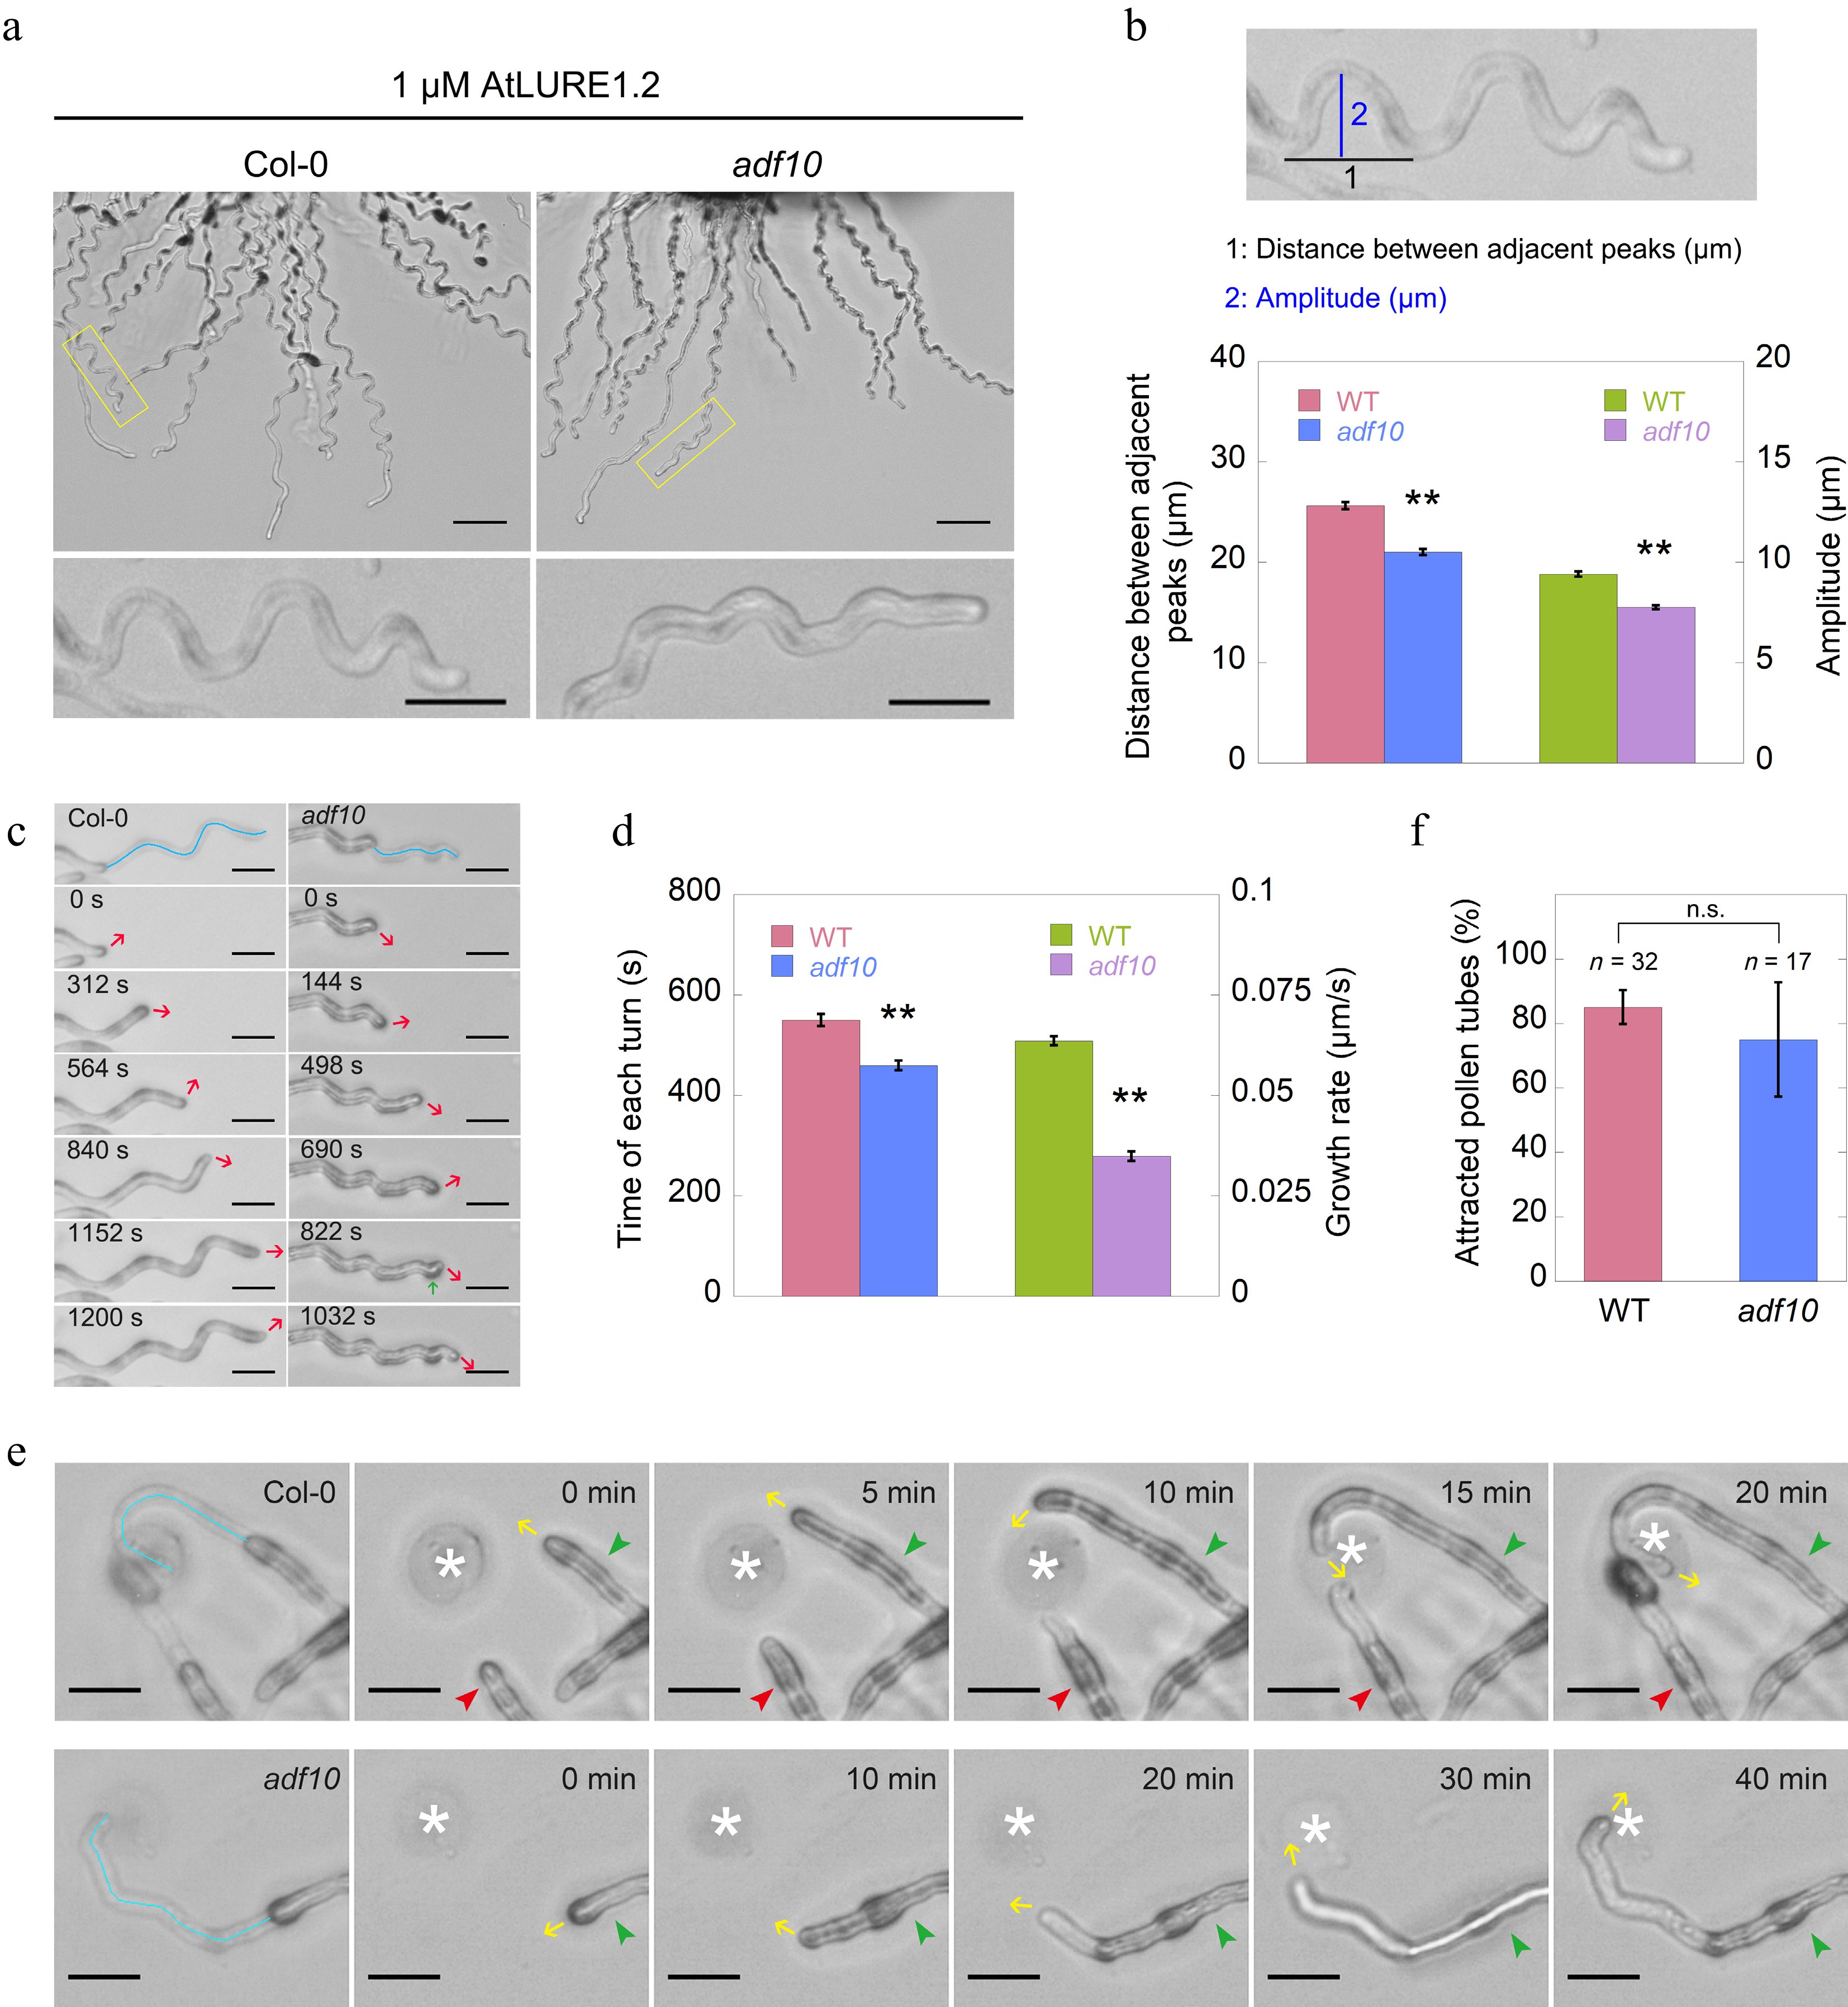
Figure 2.
Loss of function of ADF10 alters AtLURE1.2-induced tube turning behavior. (a) A semi-in vitro AtLURE1.2-responsive wavy assay was performed on wild-type (Col-0) and adf10 mutant pollen tubes. Compared to the wild-type, the pollen tubes of the adf10 mutant exhibited irregular wavy tip growth on solid GM containing 1 μM AtLURE1.2 peptides. Scale bars, 50 μm (top) and 20 μm (bottom). The micrographs presented are representative of three samples. (b) Quantification of the morphological characteristics of wild-type and adf10 pollen tubes was conducted. The upper panel depicts a schematic representation of how pollen tube morphology is quantified. The black line represents the distance between adjacent turns, while the blue line indicates the height of one turn. The lower panel displays the quantification results of tube morphology. Data are presented as mean ± SE. ** p < 0.01 (Student's t-test). (c) and (d) Visualization and quantification of AtLURE1.2-induced tube turning in wild-type and adf10 mutant pollen tubes were performed. Blue lines in the upper panel of (c) depict the growth track of pollen tubes, red arrows indicate the new growth direction, and the green arrow highlights an abnormal turn in the adf10 mutant. Data in (d) are presented as mean ± SE. ** p < 0.01 (Student's t-test). (e) Time-lapse images were captured of WT (upper panel) and adf10 (lower panel) pollen tubes growing towards AtLURE1.2-beads. The green arrowhead indicates a pollen tube initially growing along the side of an AtLURE1.2-bead, subsequently changing direction to grow towards it. The red arrowhead points to a pollen tube growing straightly towards an AtLURE1.2-bead. Yellow arrows indicate the direction of pollen tube growth. White asterisks mark the position of AtLURE1.2-beads. The entire series of images can be found in Supplemental Videos S1 & S2. Scale bar, 5 μm. (f) Quantification of the percentage of pollen tubes attracted by AtLURE1.2-beads was conducted. Data are presented as mean ± SE. n.s., no significant difference (Student's t-test).
-

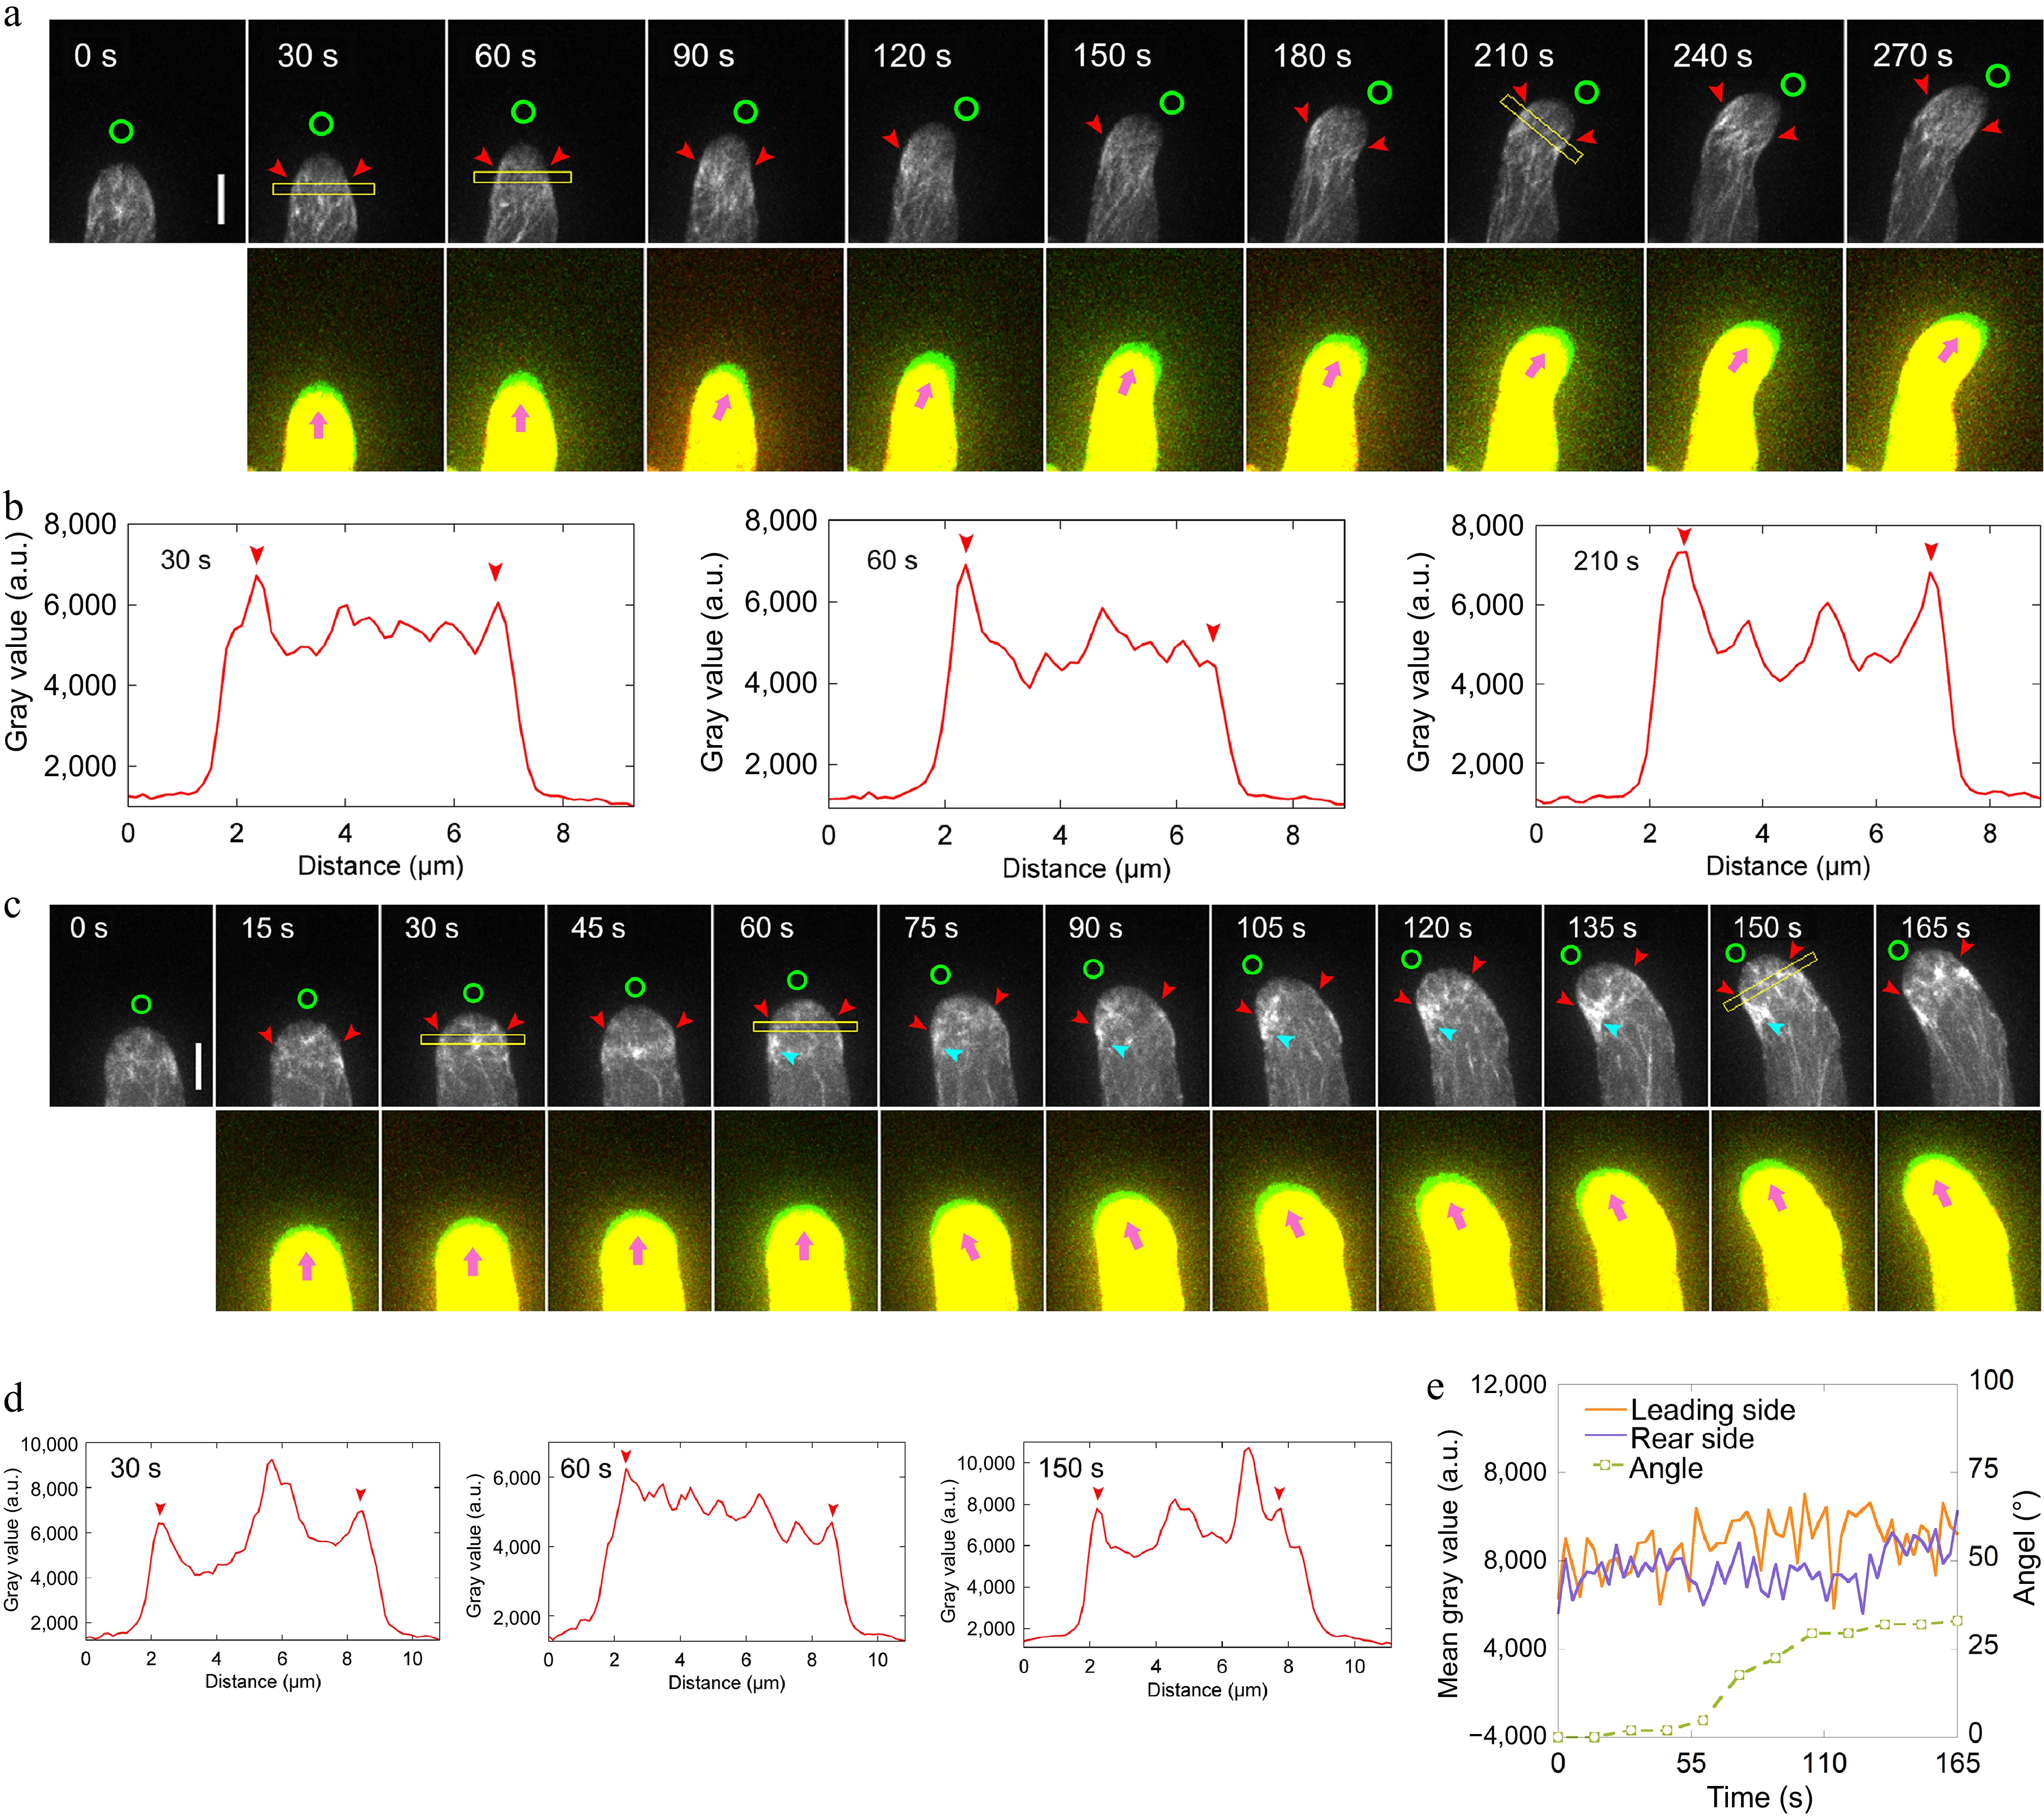
Figure 3.
Loss of function of ADF10 induces accumulation of actin filaments at the leading side in turning pollen tubes growing in vitro. (a) Time-lapse images of actin filaments during the turning of in vitro growing wild-type pollen tube. The lower panel shows the merged images from two time points, in which the newly grown portion of pollen tubes between two time points was green colored. Green circles in the upper panel and pink arrowheads in the lower panel indicate the new tube growth direction, while red arrowheads in the upper panel highlight the cortical apical actin filaments. Scale bar, 5 μm. (b) Quantification of the fluorescence intensity of apical actin filaments, as indicated by the yellow square in (a). Red arrowheads mark the peaks of fluorescence. (c) Time-lapse images of actin filaments during random turning of an in vitro growing adf10 pollen tube. The lower panel shows the merged images from two time points, in which the newly grown portion of pollen tubes between two time points was green colored. Green circles in the upper panel and pink arrowheads in the lower panel indicate the new tube growth direction, and red arrowheads in the upper panel highlight the cortical apical actin filaments. Scale bar, 5 μm. (d) Quantification of the fluorescence intensity of apical actin filaments, as indicated by the yellow square in (c). Red arrowheads mark the peaks of fluorescence. (e) Analysis of the fluorescence intensity of the pollen tube in (c) on both sides at the region 2.5 to 3.5 μm away from the tip, along with the tube turning angles over time.
-

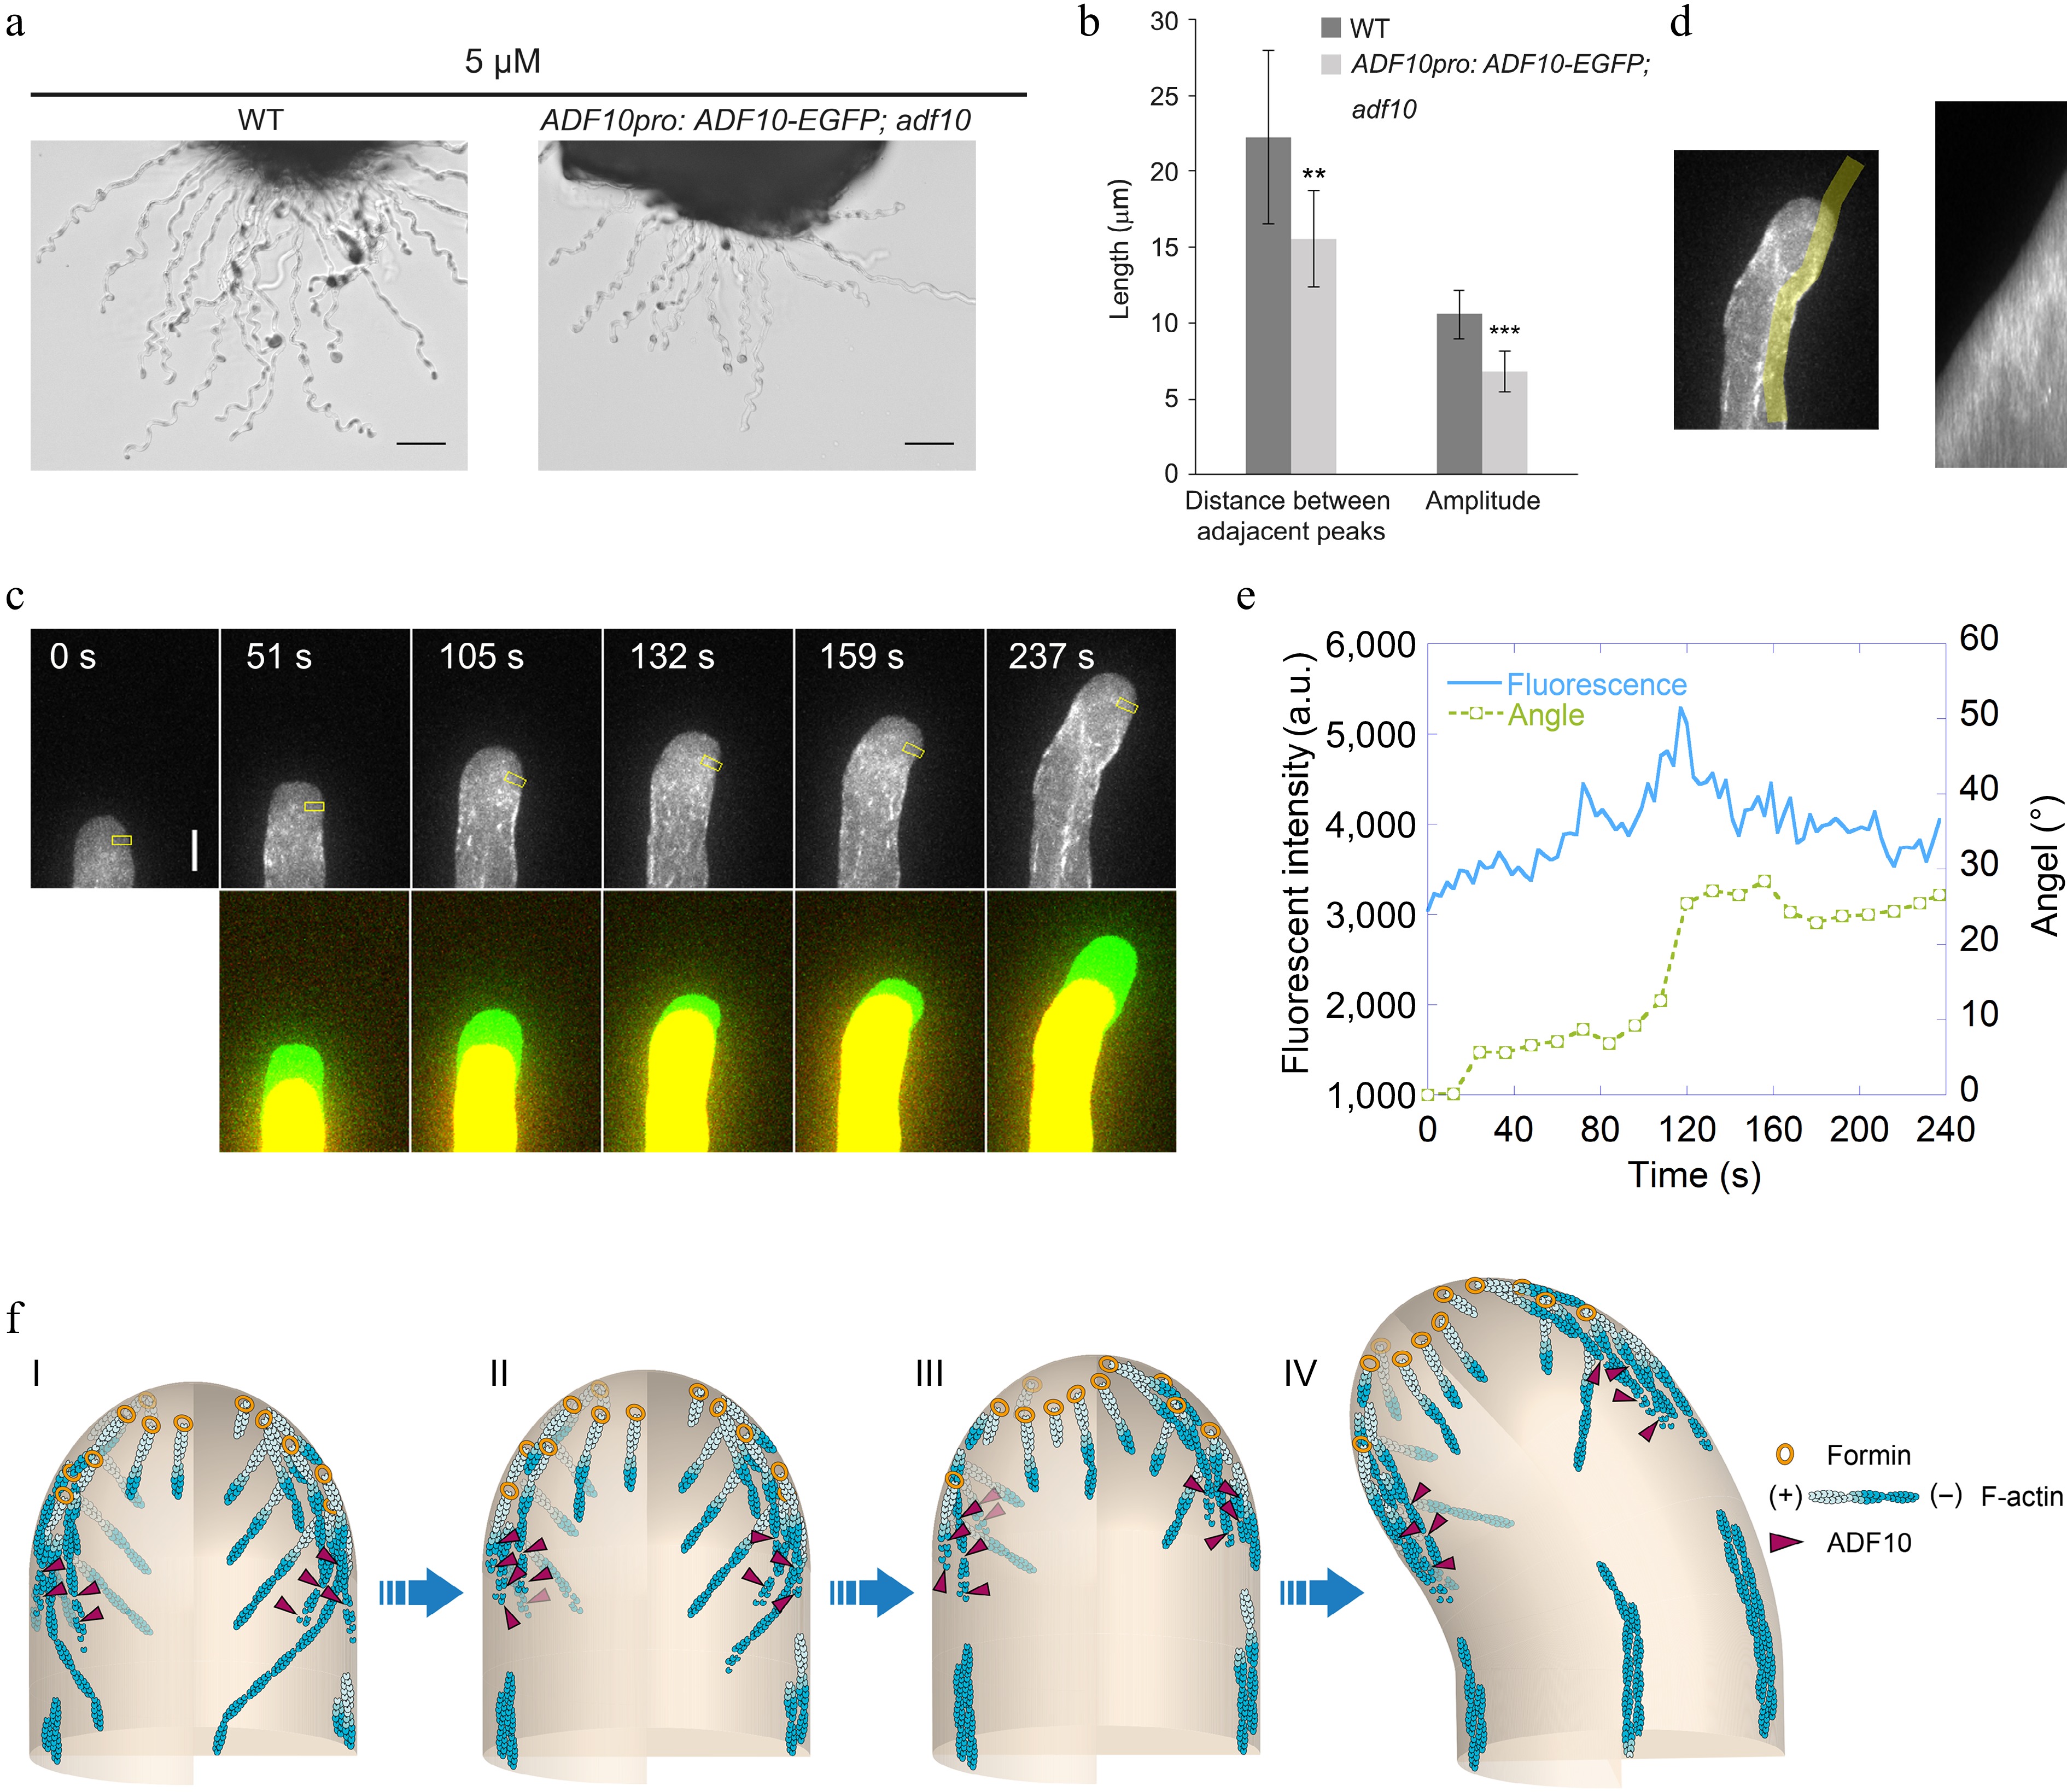
Figure 4.
ADF10 undergoes asymmetric localization during random tube turning. (a) Images of WT and ADF10pro: ADF10-EGFP pollen tubes growing out from the cut style. Scale bars, 50 μm. The micrographs are representative of three samples. (b) Quantification of the morphological characteristics of wild-type and ADF10pro: ADF10-EGFP; adf10 pollen tubes in (a) was conducted. Data are presented as mean ± SE. ** p < 0.01 (Student's t-test). (c) Time-lapse images of ADF10pro: ADF10-EGFP pollen tubes growing in vitro. The upper panel shows the time-lapse images. The lower panel shows the merged images from two time points, in which the newly grown portion of pollen tubes between two time points was green colored. Scale bars, 5 μm. (d) The kymograph analysis of ADF10-EGFP in the pollen tube shown in (c). The region of interest used for the kymograph measurement is outlined in the left panel. (e) Analysis of the average fluorescence pixel intensity of apical ADF10-EGFP at the leading side and tube turning angle over time. The fluorescence intensity within the yellow square on the leading side shown in the upper panel of (c), which is 2.5 to 3.5 μm away from the tip, was measured and plotted over time. Meanwhile, the turning angle of the pollen tube was measured and plotted overtime. (f) Schematic depiction of the relationship between apical actin filaments and ADF10 during AtLURE1.2-induced pollen tube turning. At the initial stage, apical actin filaments appear similar on both sides, and ADF10 exhibits a uniform distribution (I). Prior to the onset of pollen tube turning (II and III), ADF10 begins to accumulate at the leading side (IV), resulting in the depolymerization of actin filaments there. Subsequently, repolymerization of apical actin filaments mediated by formins from plasma membrane occurs at the leading side and a new apical actin structure forms, determining the new growth direction of the pollen tube (III). Once the turn is completed, ADF10 returns to a uniform distribution on both sides of the pollen tube tip. Subsequently, the pollen tube grows straight towards the new direction. "+" and "-" refer to the barbed end and pointed end of actin filament, respectively.
Figures
(4)
Tables
(0)