-
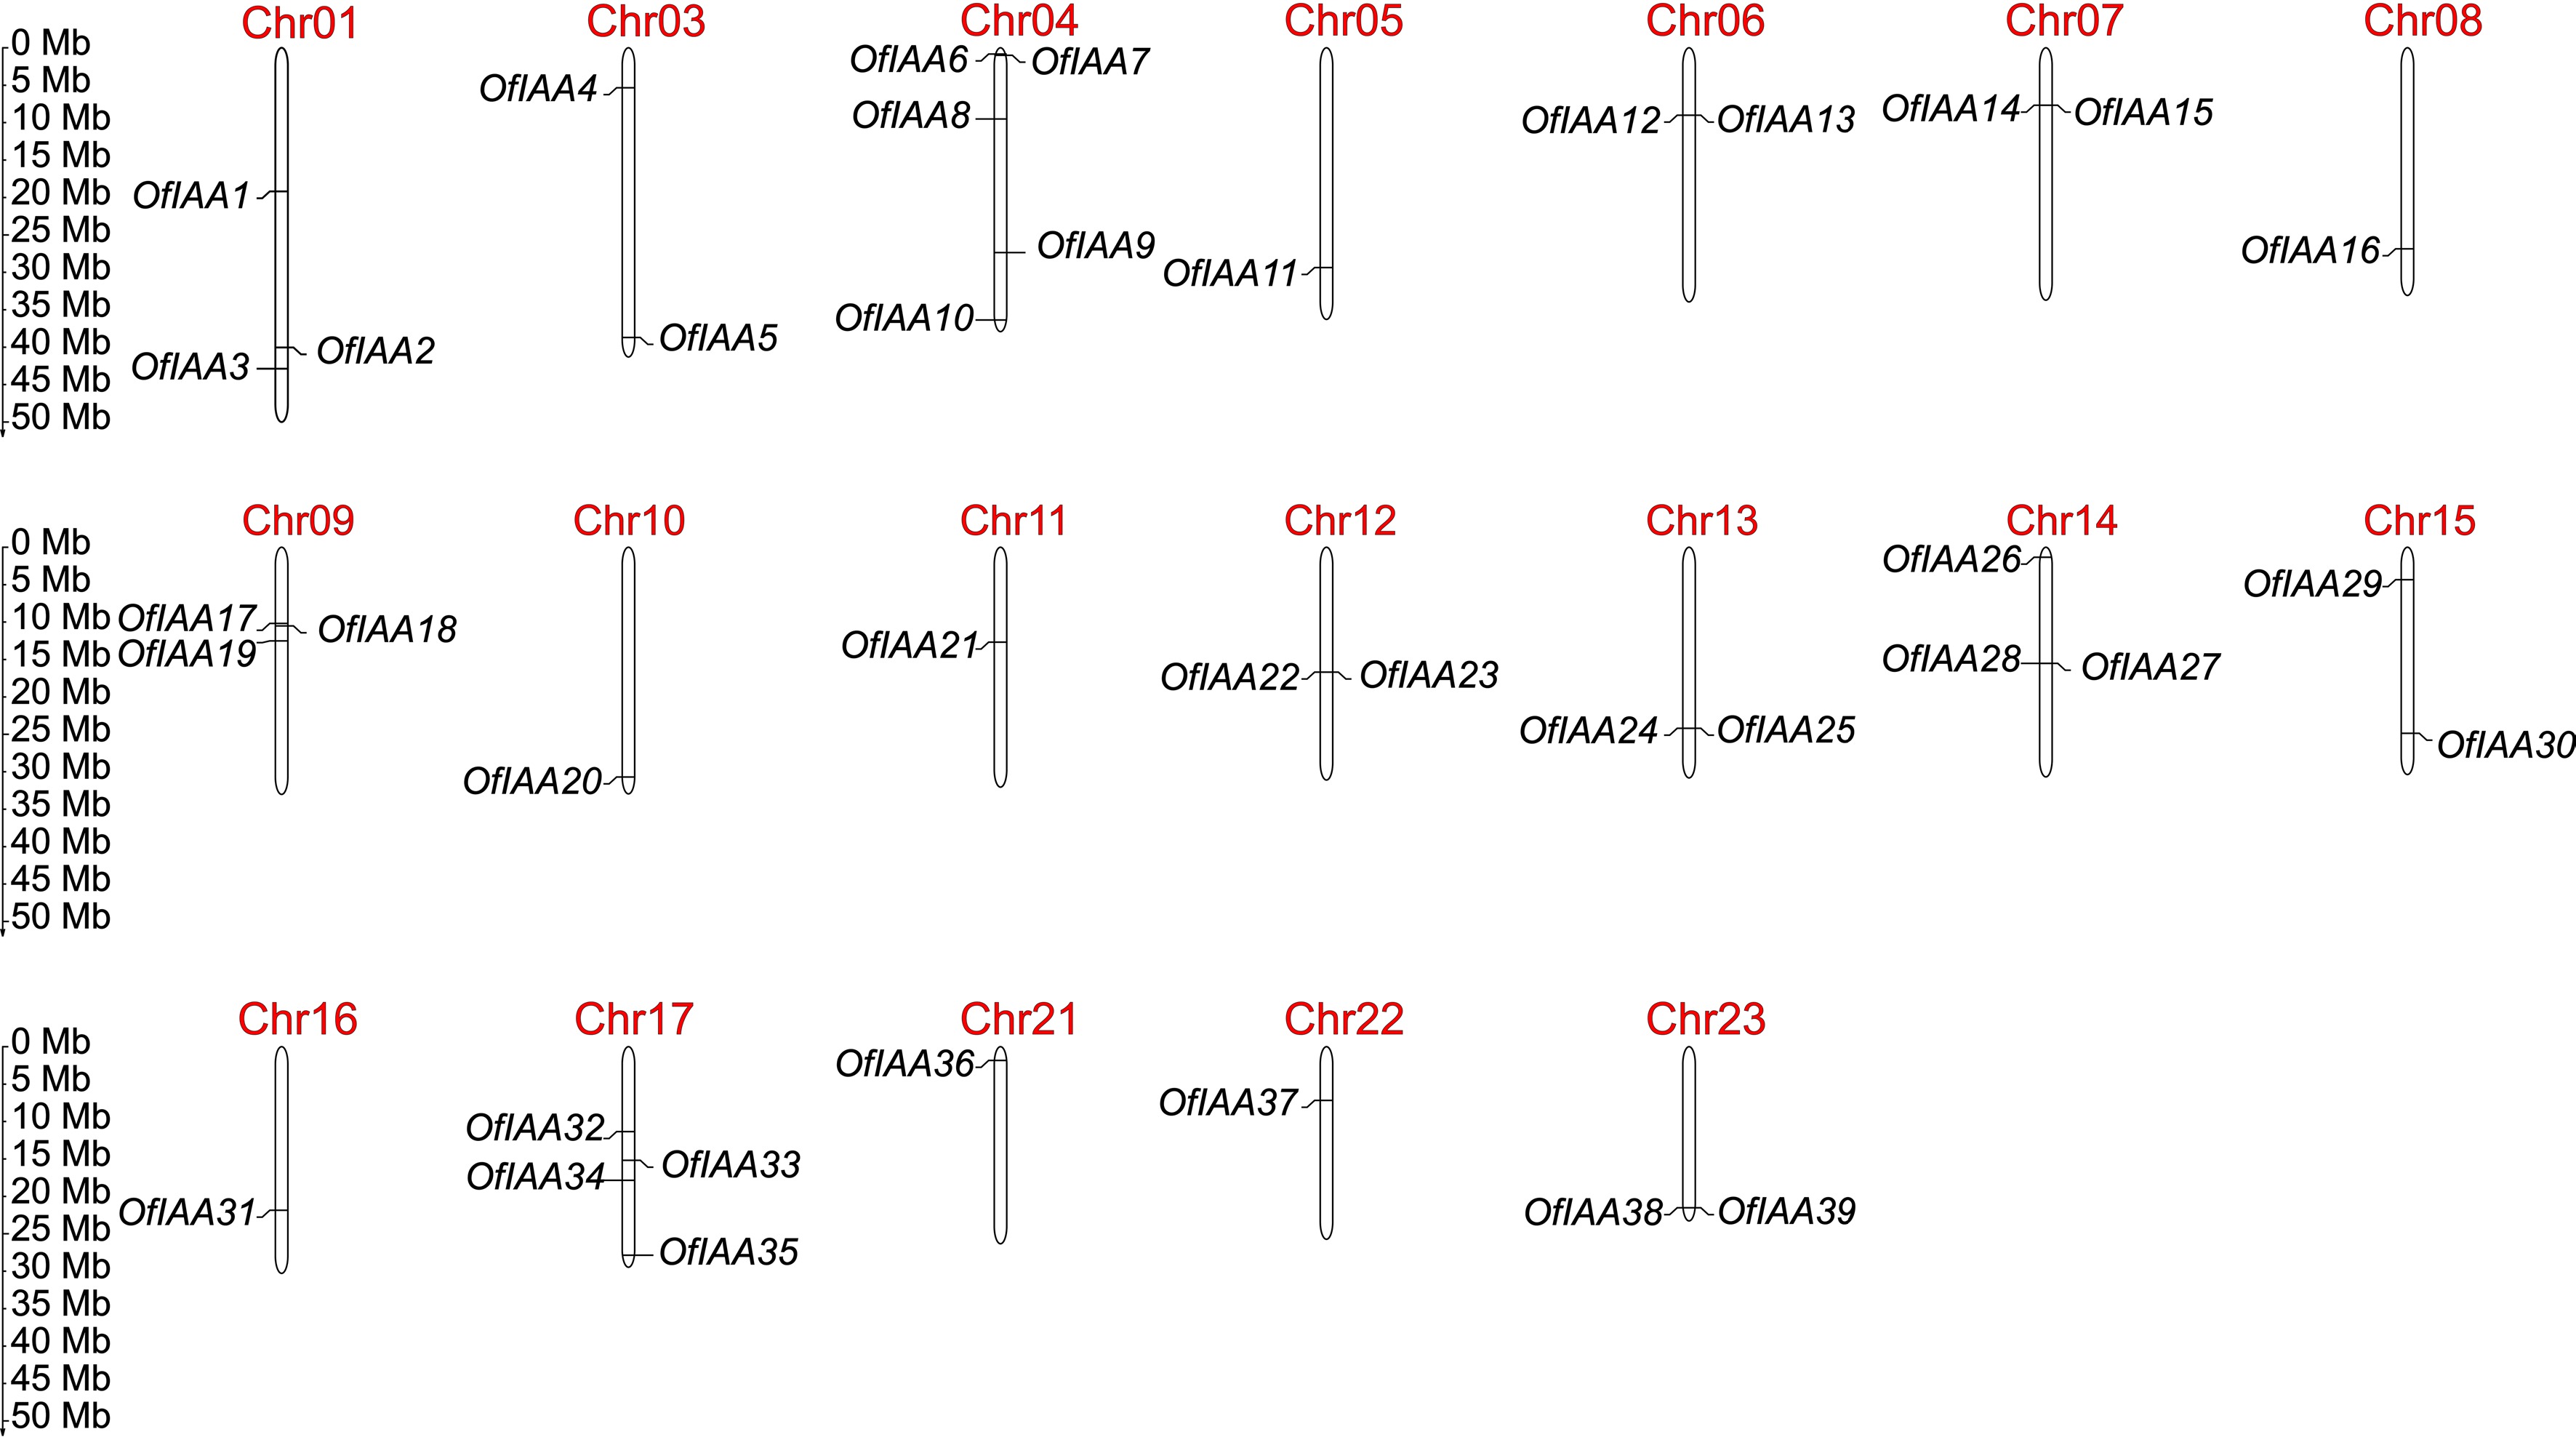
Figure 1.
Chromosomal distribution of OfIAA genes in O. fragrans.
-
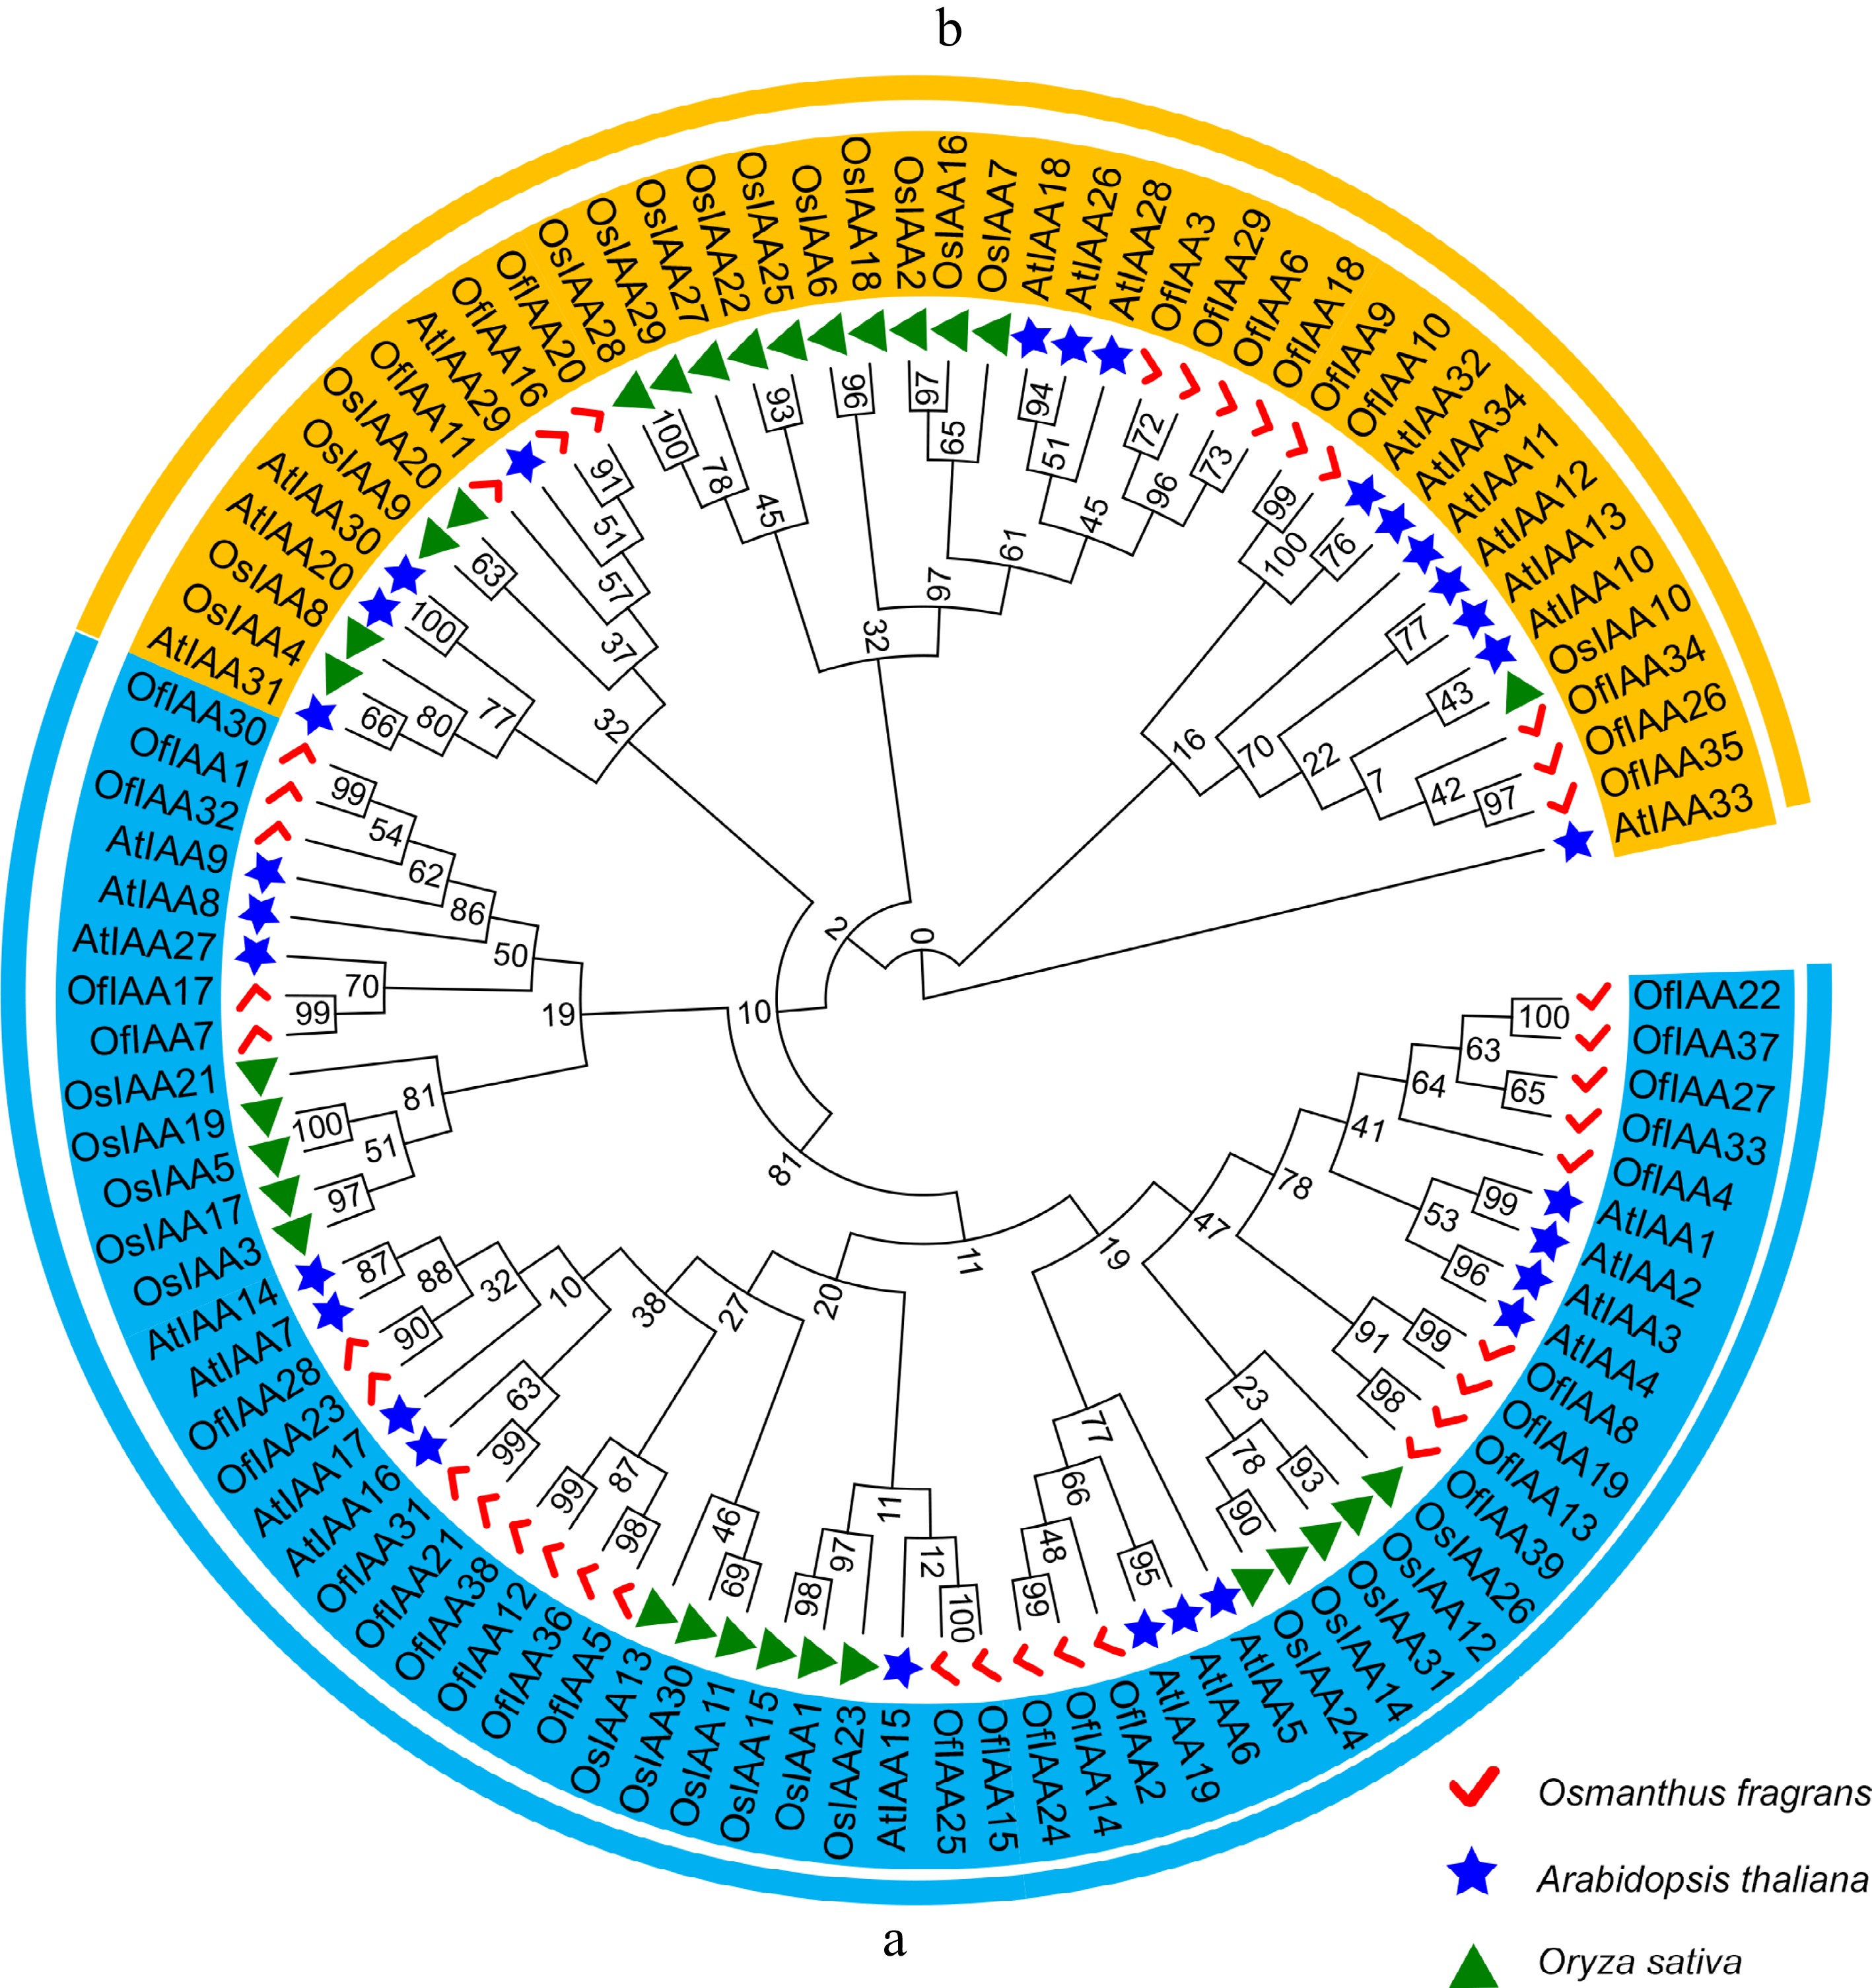
Figure 2.
Phylogenetic relationship of the IAAs among O. fragrans, A. thaliana, and O. sativa. The IAA proteins in O. fragrans are represented by the red ticks, the IAA proteins in A. thaliana are represented by the blue stars, the IAA proteins in O. sativa are represented by the green triangles. Two main groups (a) and (b) were displayed by colored arcs.
-
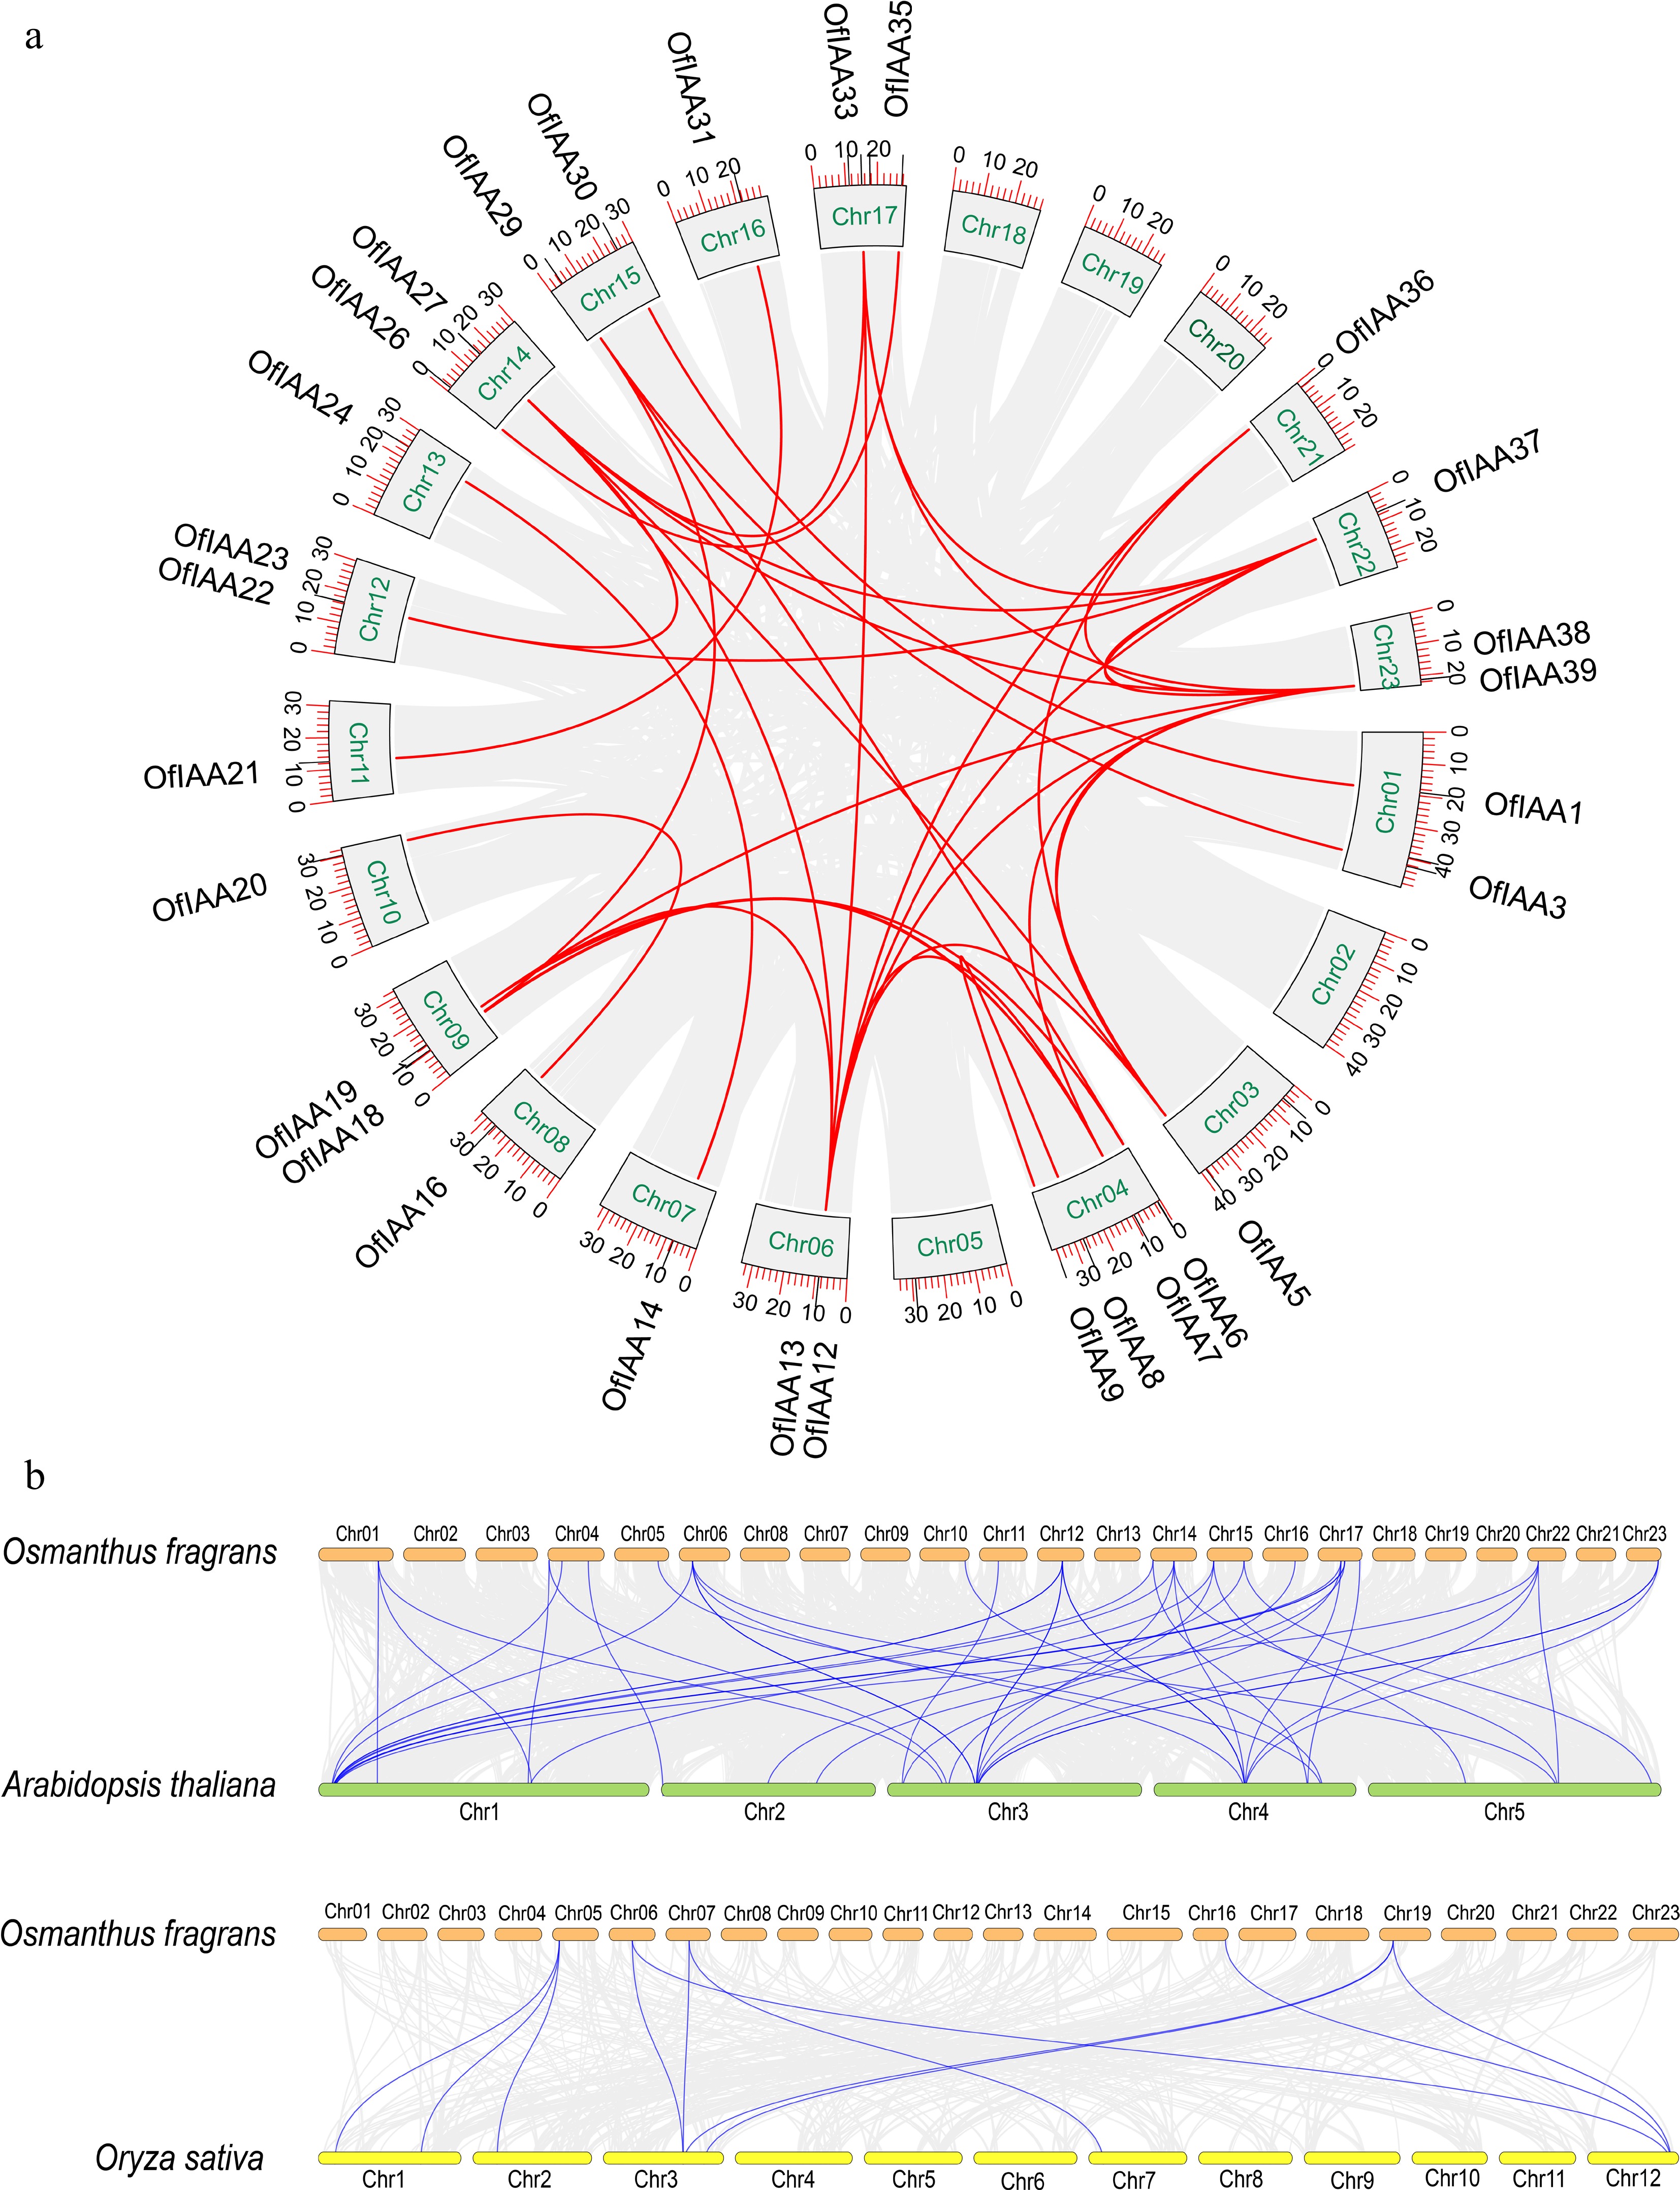
Figure 3.
Synteny analysis of the IAA genes. (a) Synteny analysis of the OfIAA genes in O. fragrans. (b) Synteny analysis of the OfIAA genes between A. thaliana and O. sativa.
-
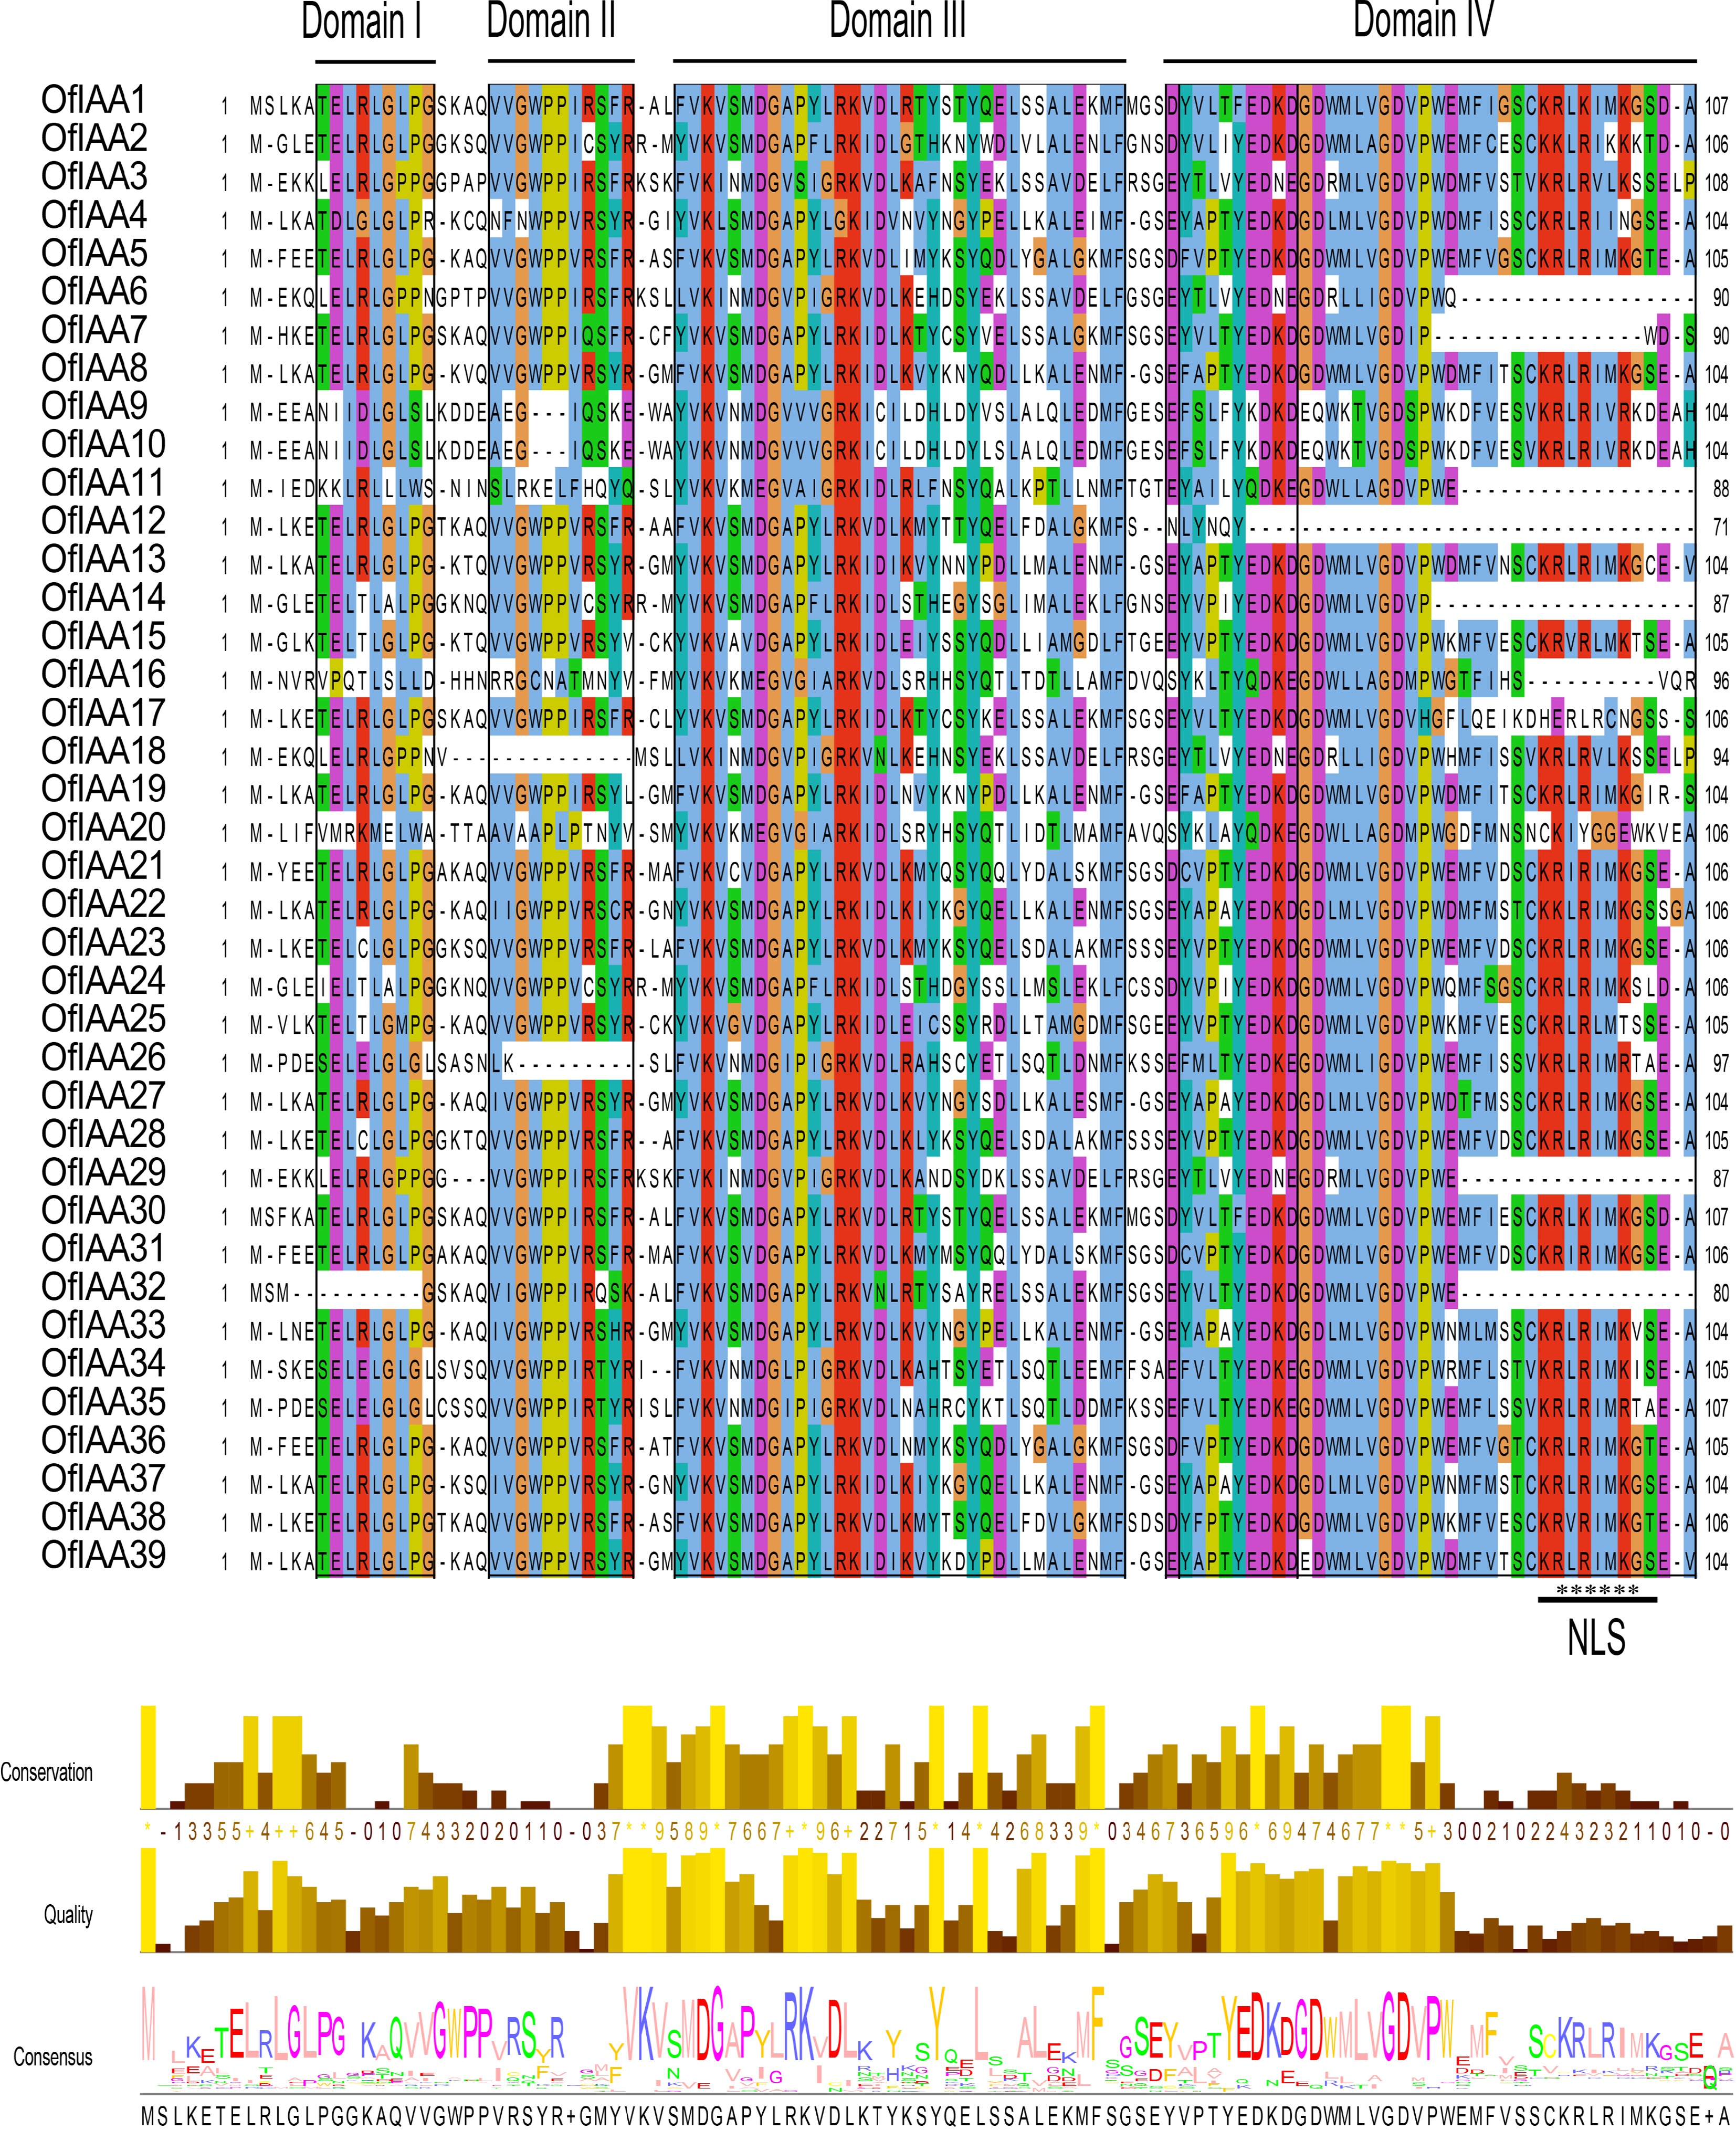
Figure 4.
Multiple sequence alignment of the OfIAA proteins. The conserved domains (I, II, III, and IV) of the OfIAA gene family are underlined. Nuclear localization signals (NLS) are indicated with black asterisks. Bits indicate amino acid conservation at each position.
-
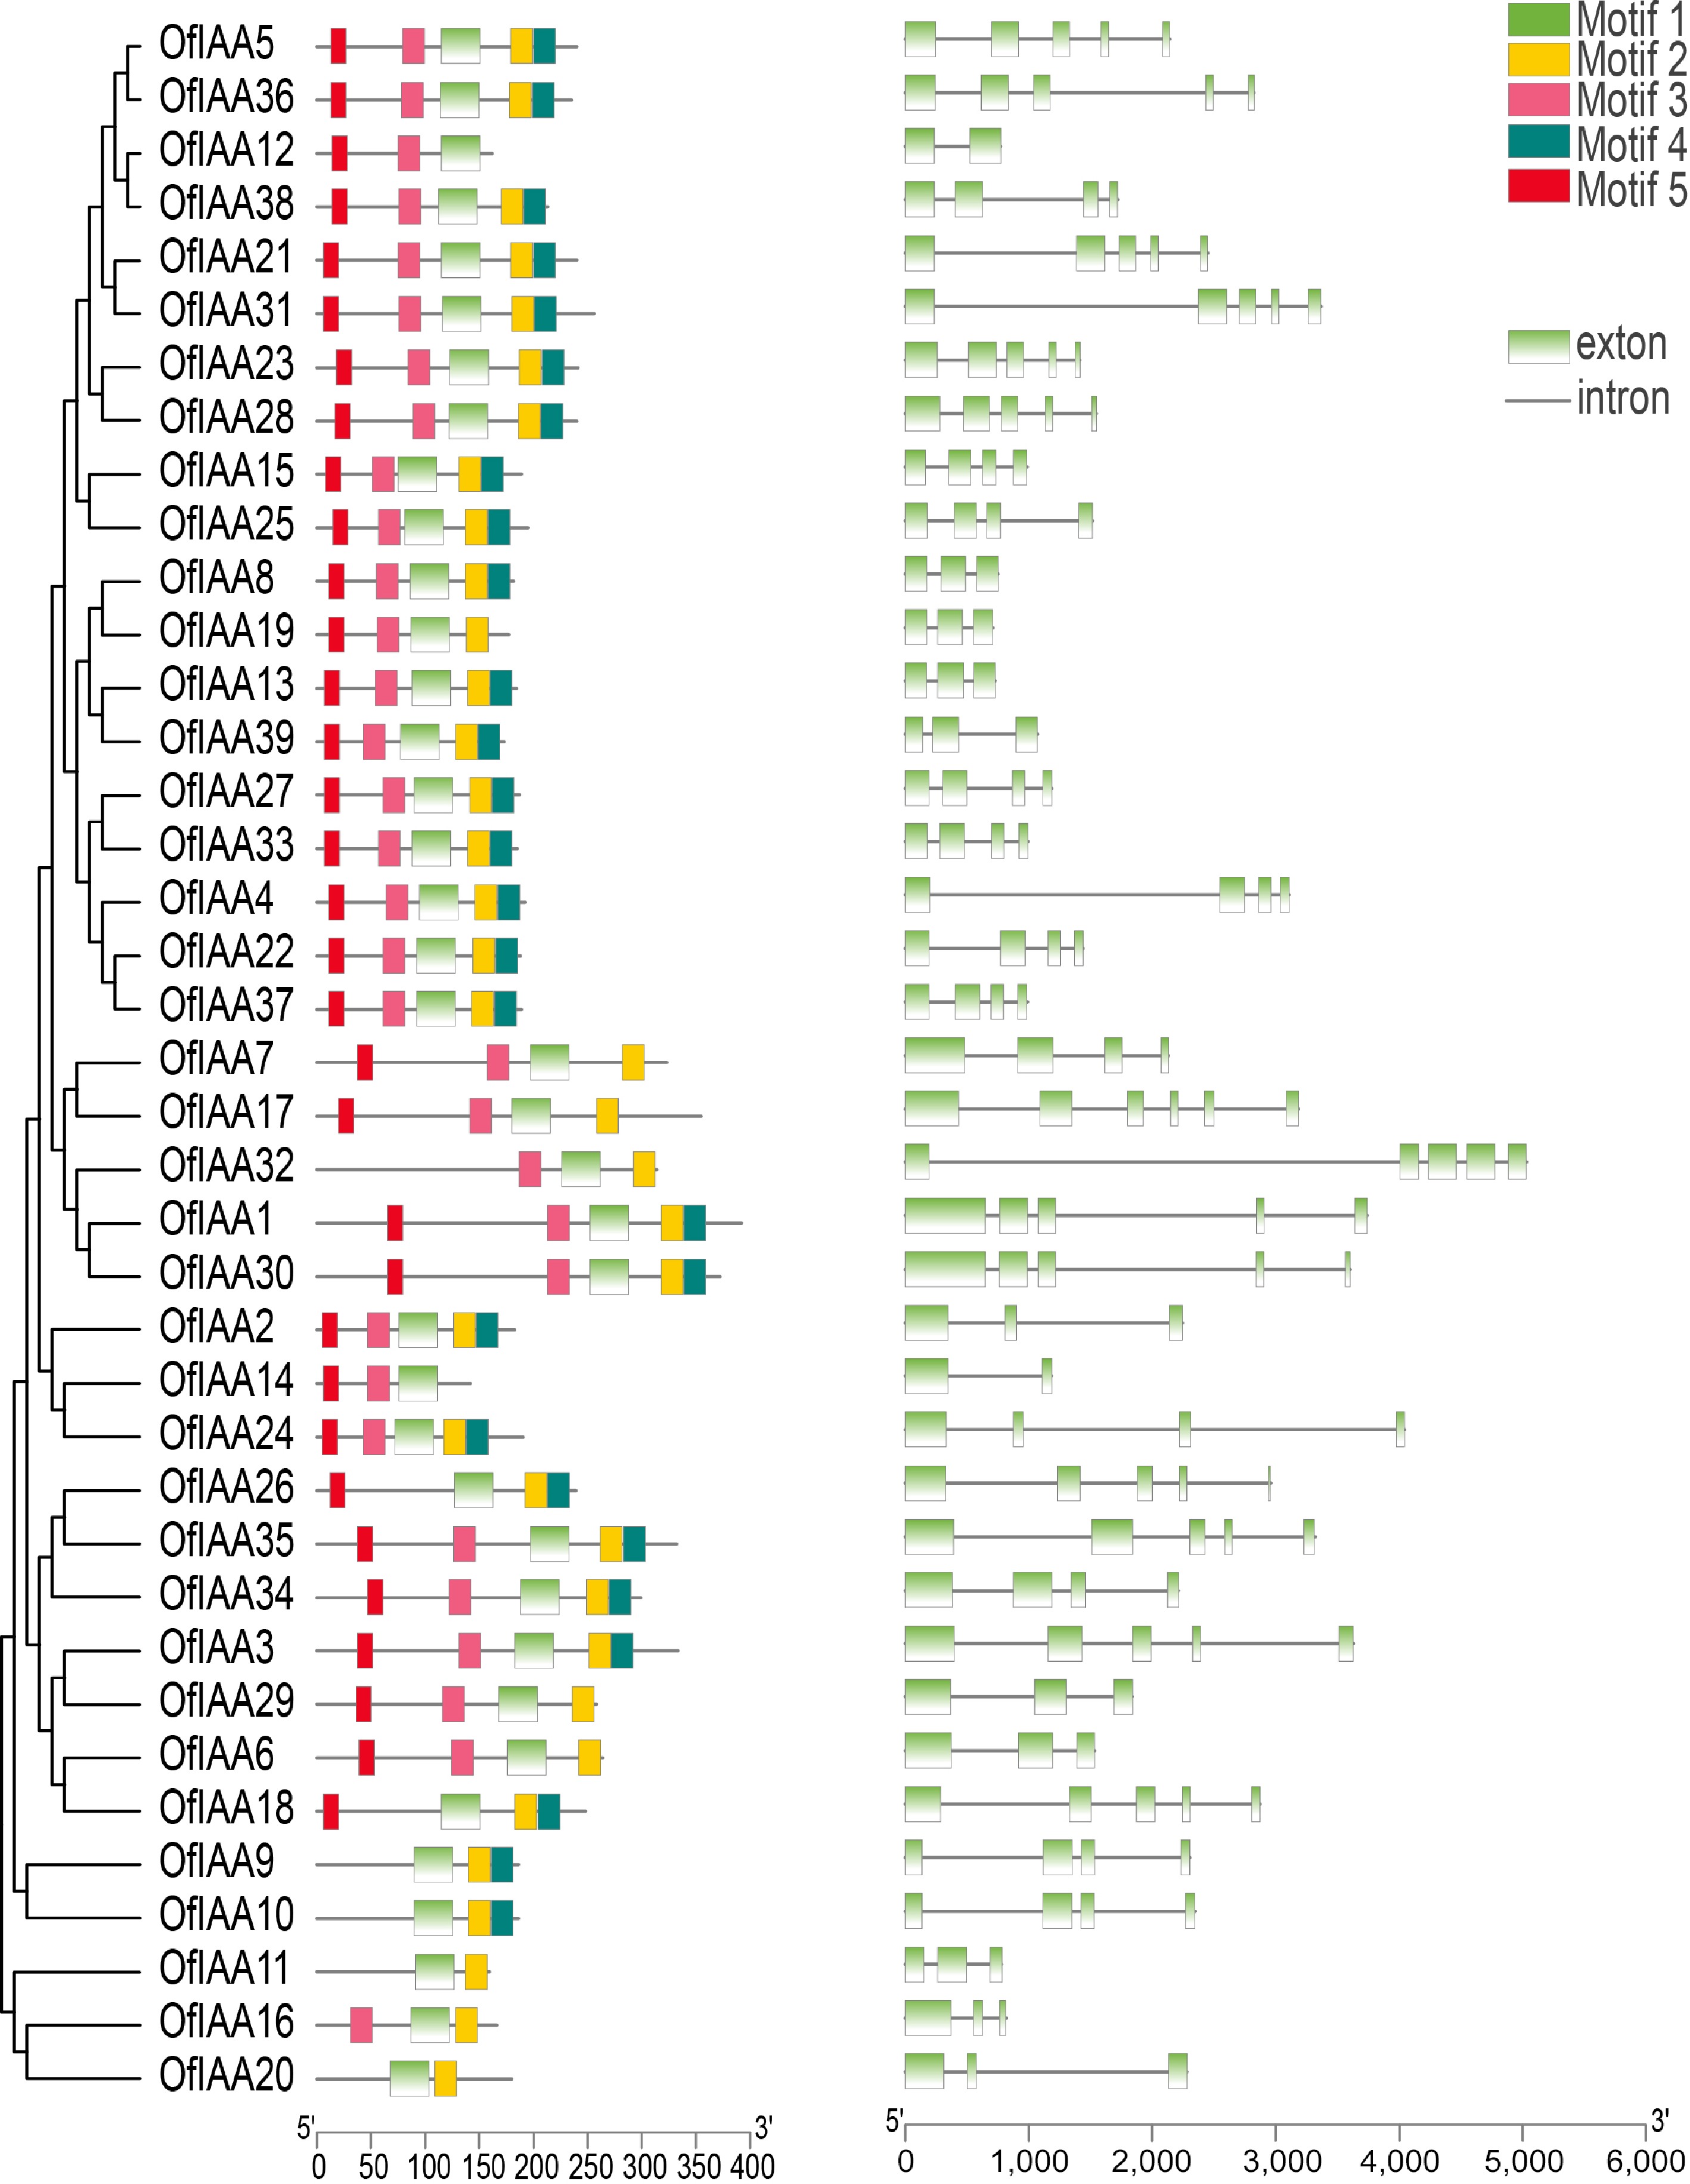
Figure 5.
Motif and gene structure analysis of OfIAAs.
-
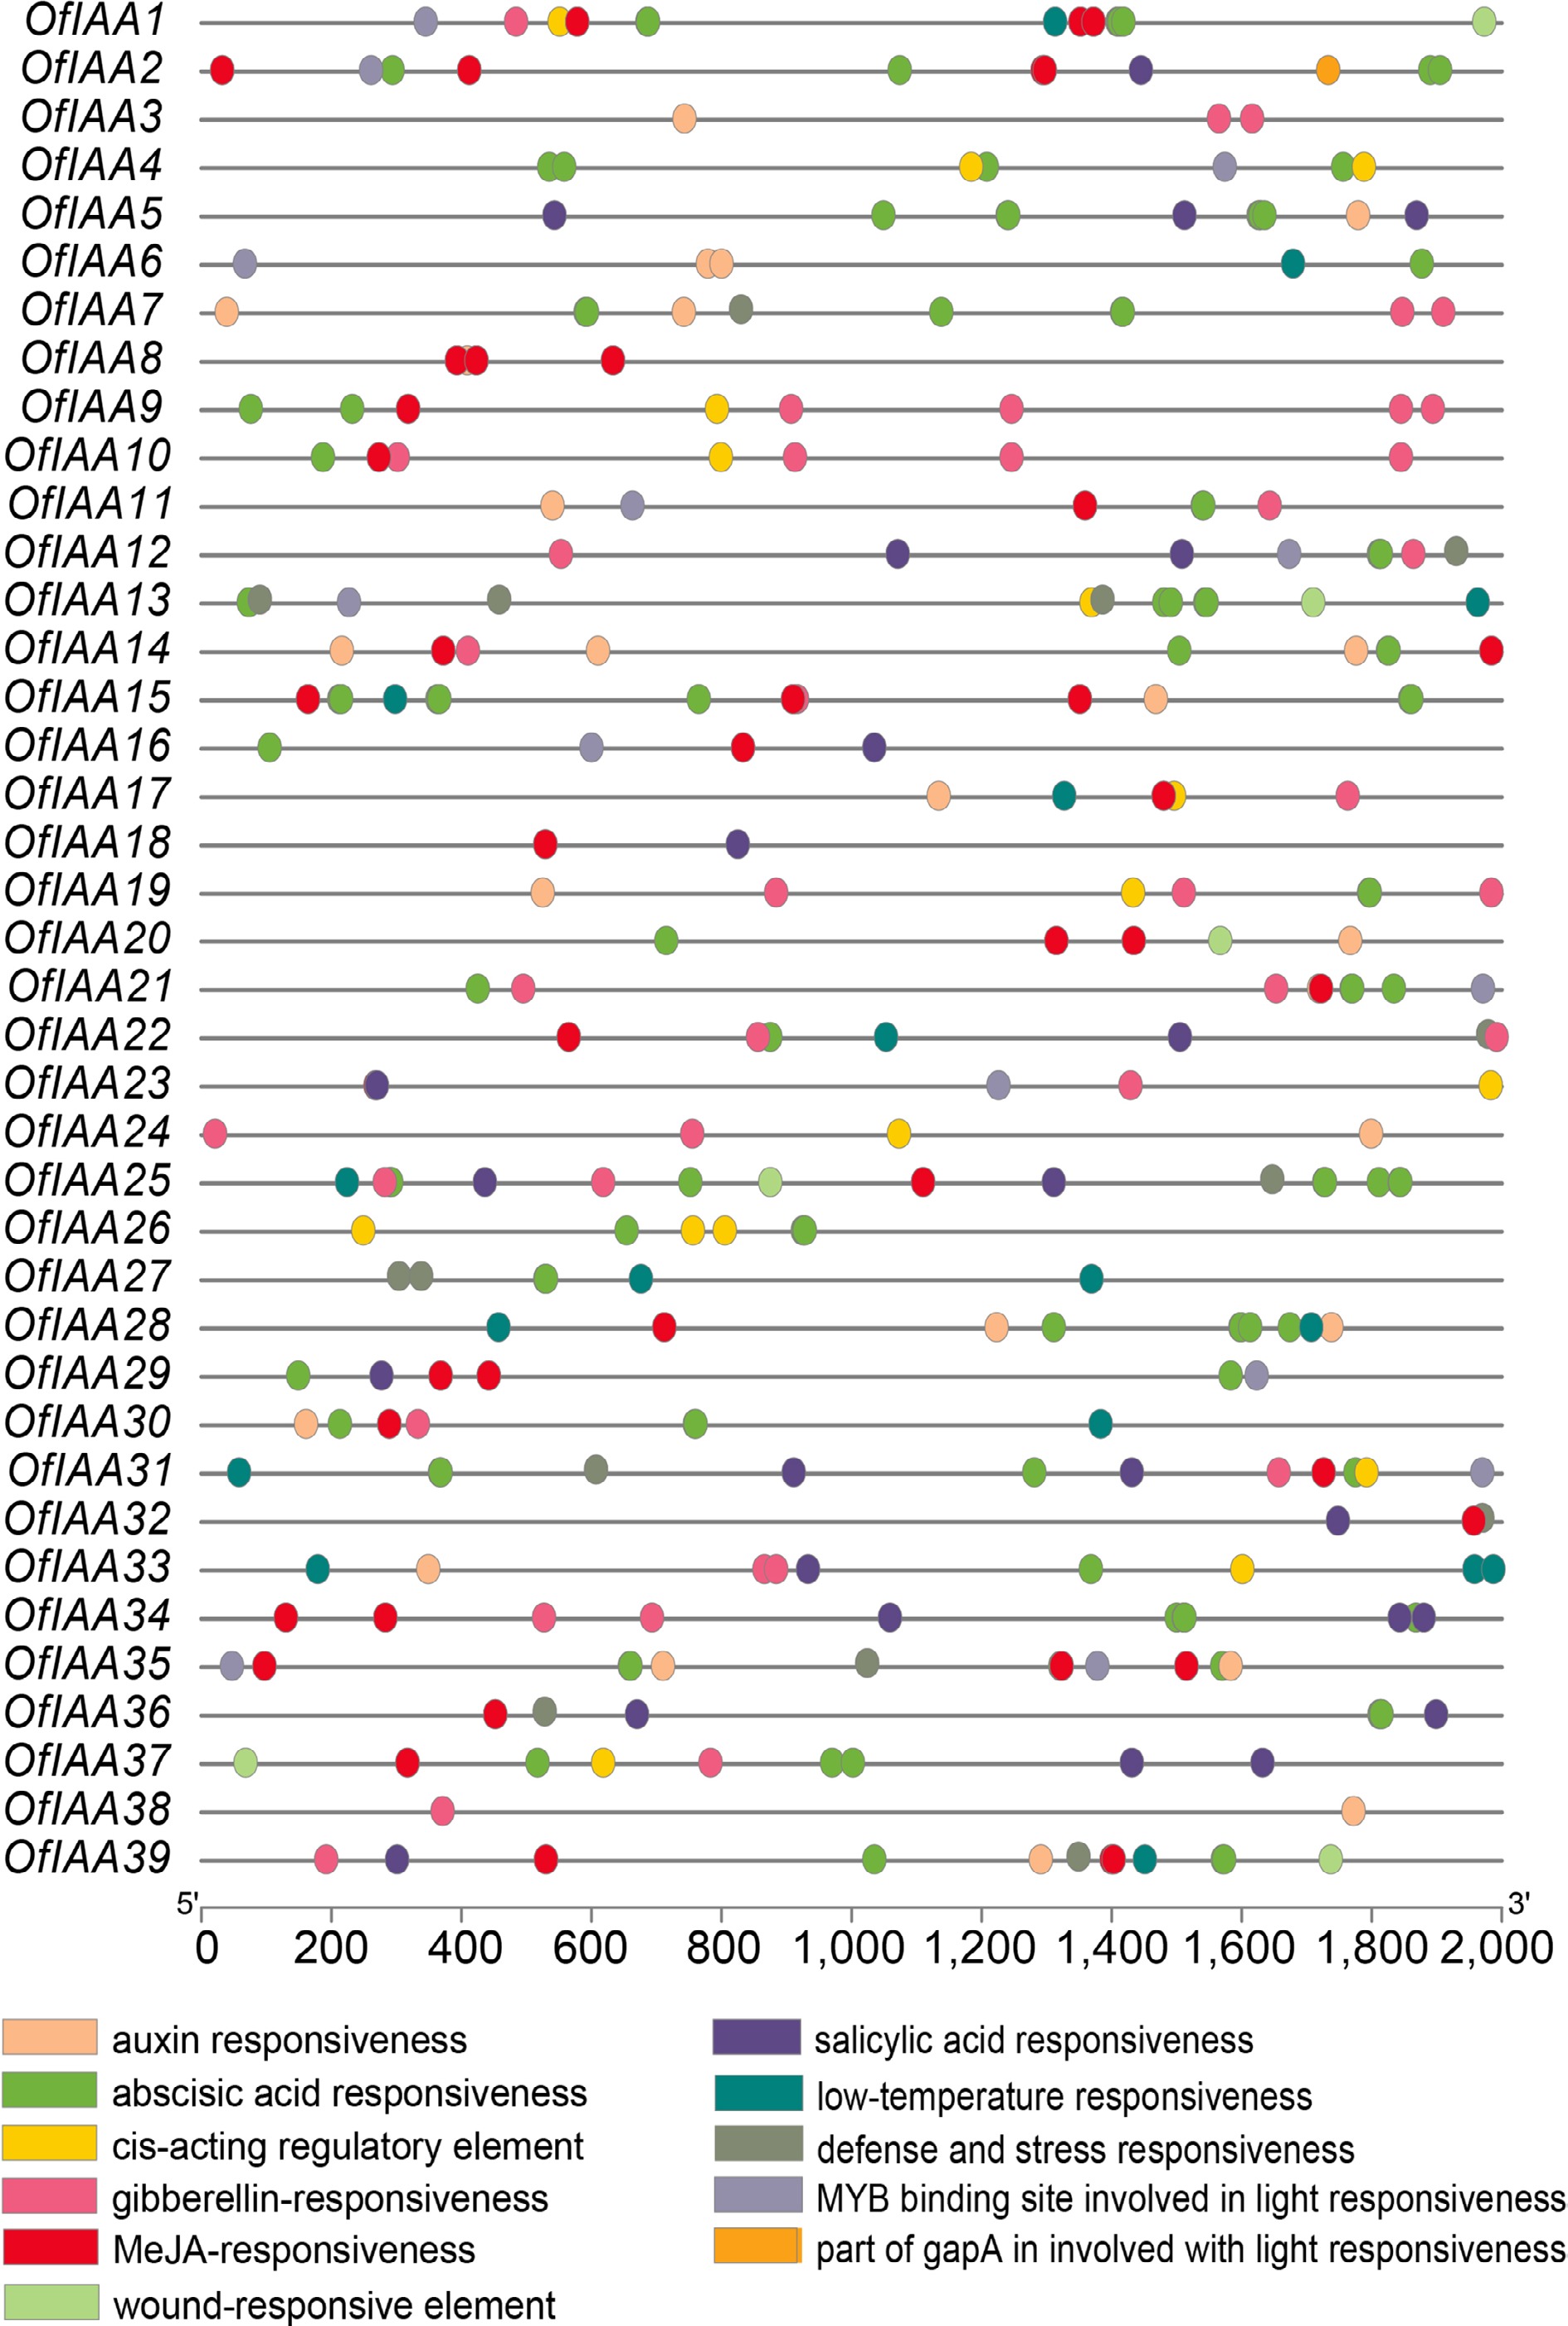
Figure 6.
Cis-elements distribution of OfIAA genes.
-
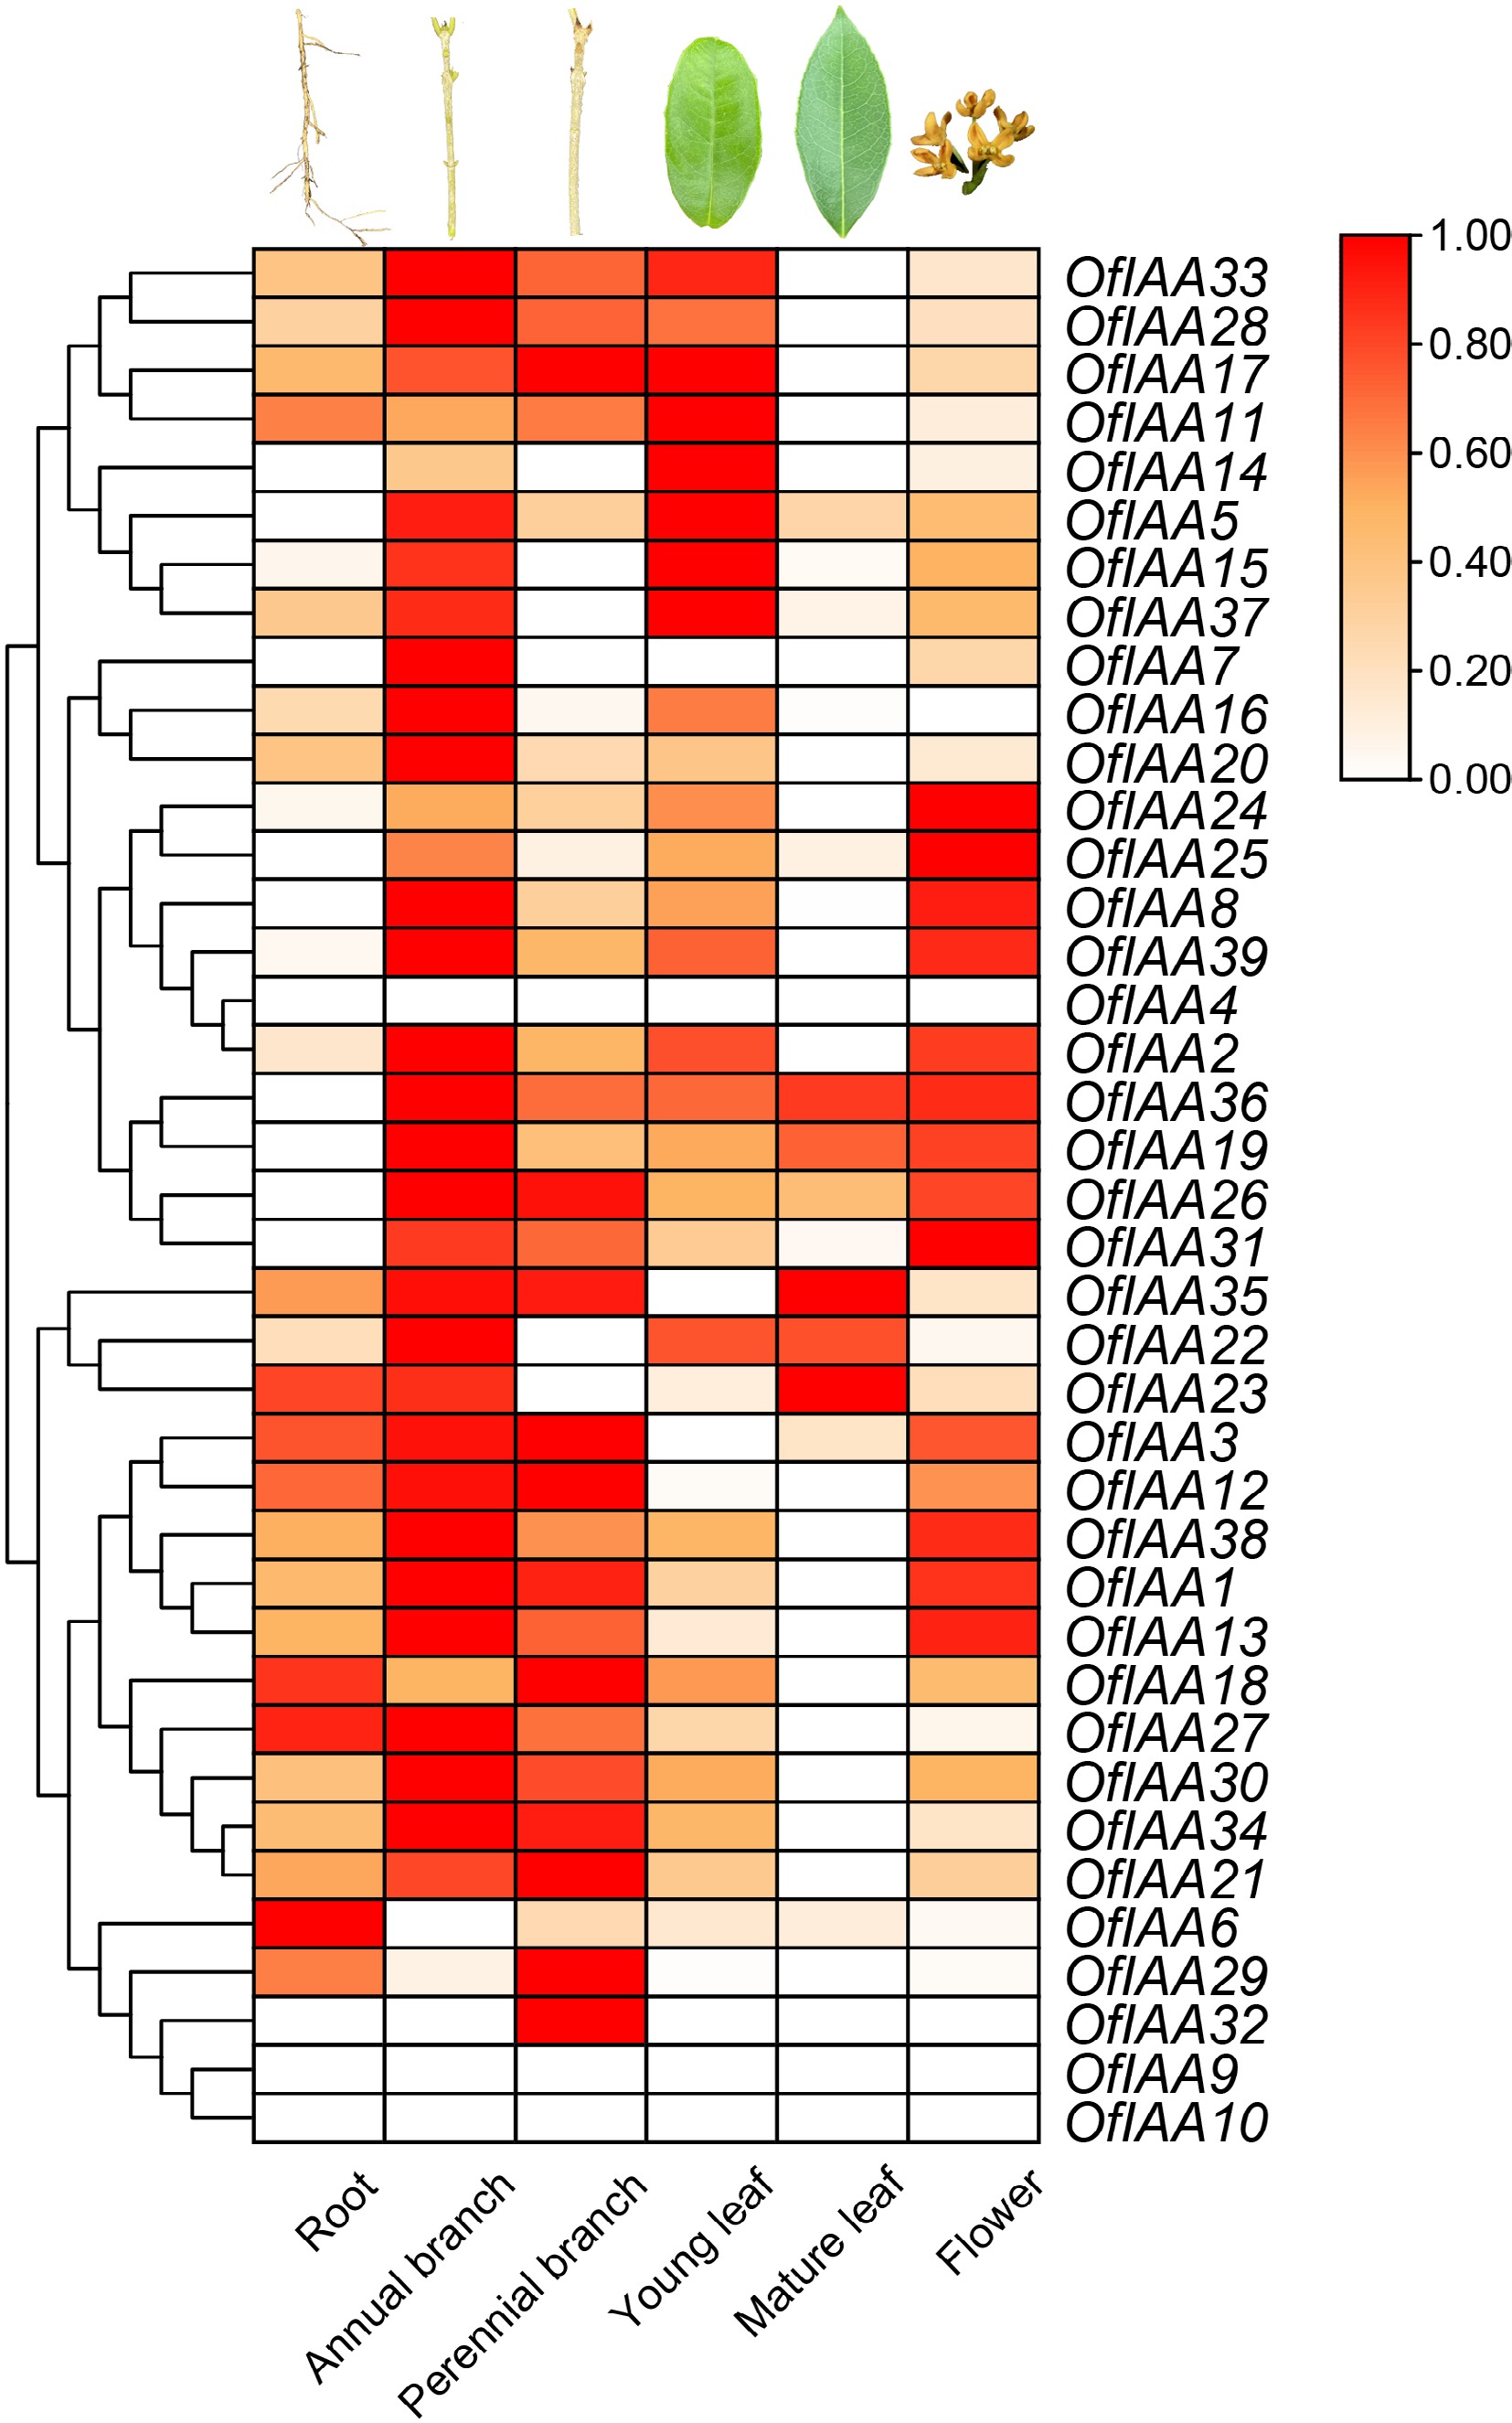
Figure 7.
Expression analysis of OfIAAs in different tissues.
-
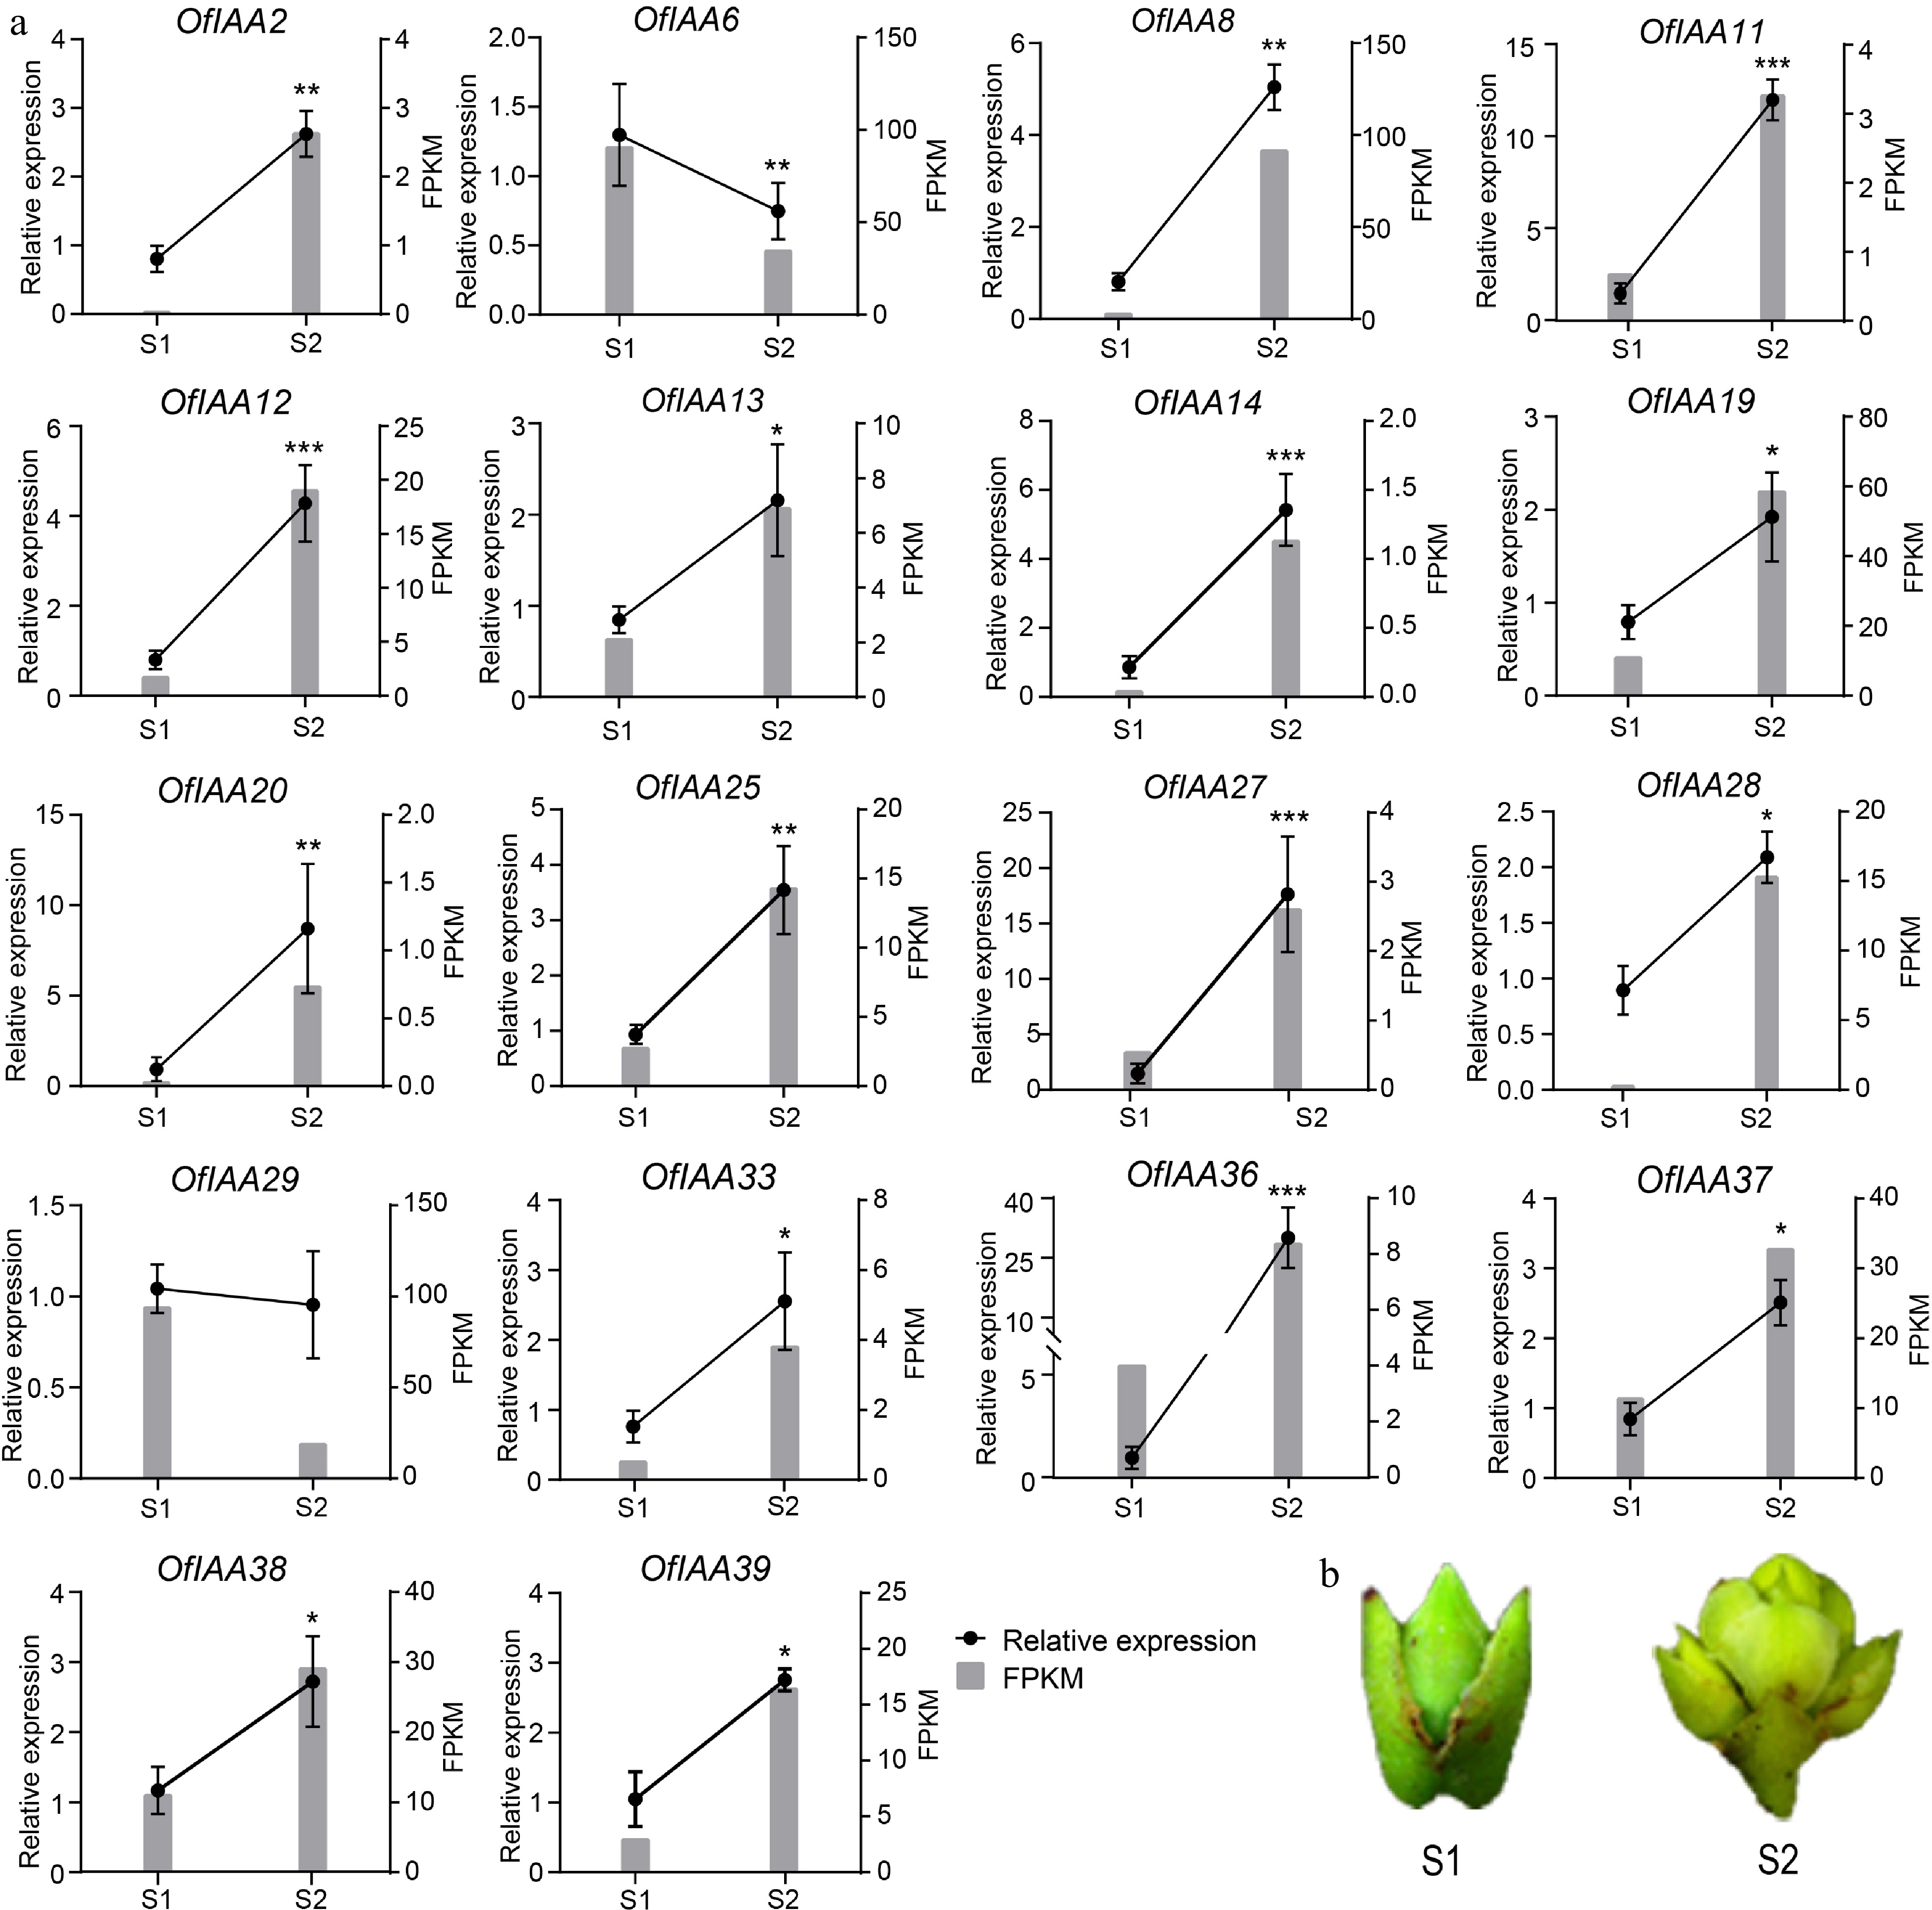
Figure 8.
Expression analysis of the differently expressed OfIAA genes during flower opening processes in O. fragrans. (a) FPKM and qRT‒PCR analysis of the differentially expressed OfIAA genes at stage S1 and S2. Error bars represent the standard error of three replicates. (b) Phenotypes of flower buds at S1 and S2 stage. Significance was assessed by Duncan's multiple-range test (DMRT) at p < 0.001 (***), p < 0.01 (**) and p < 0.05 (*).
-
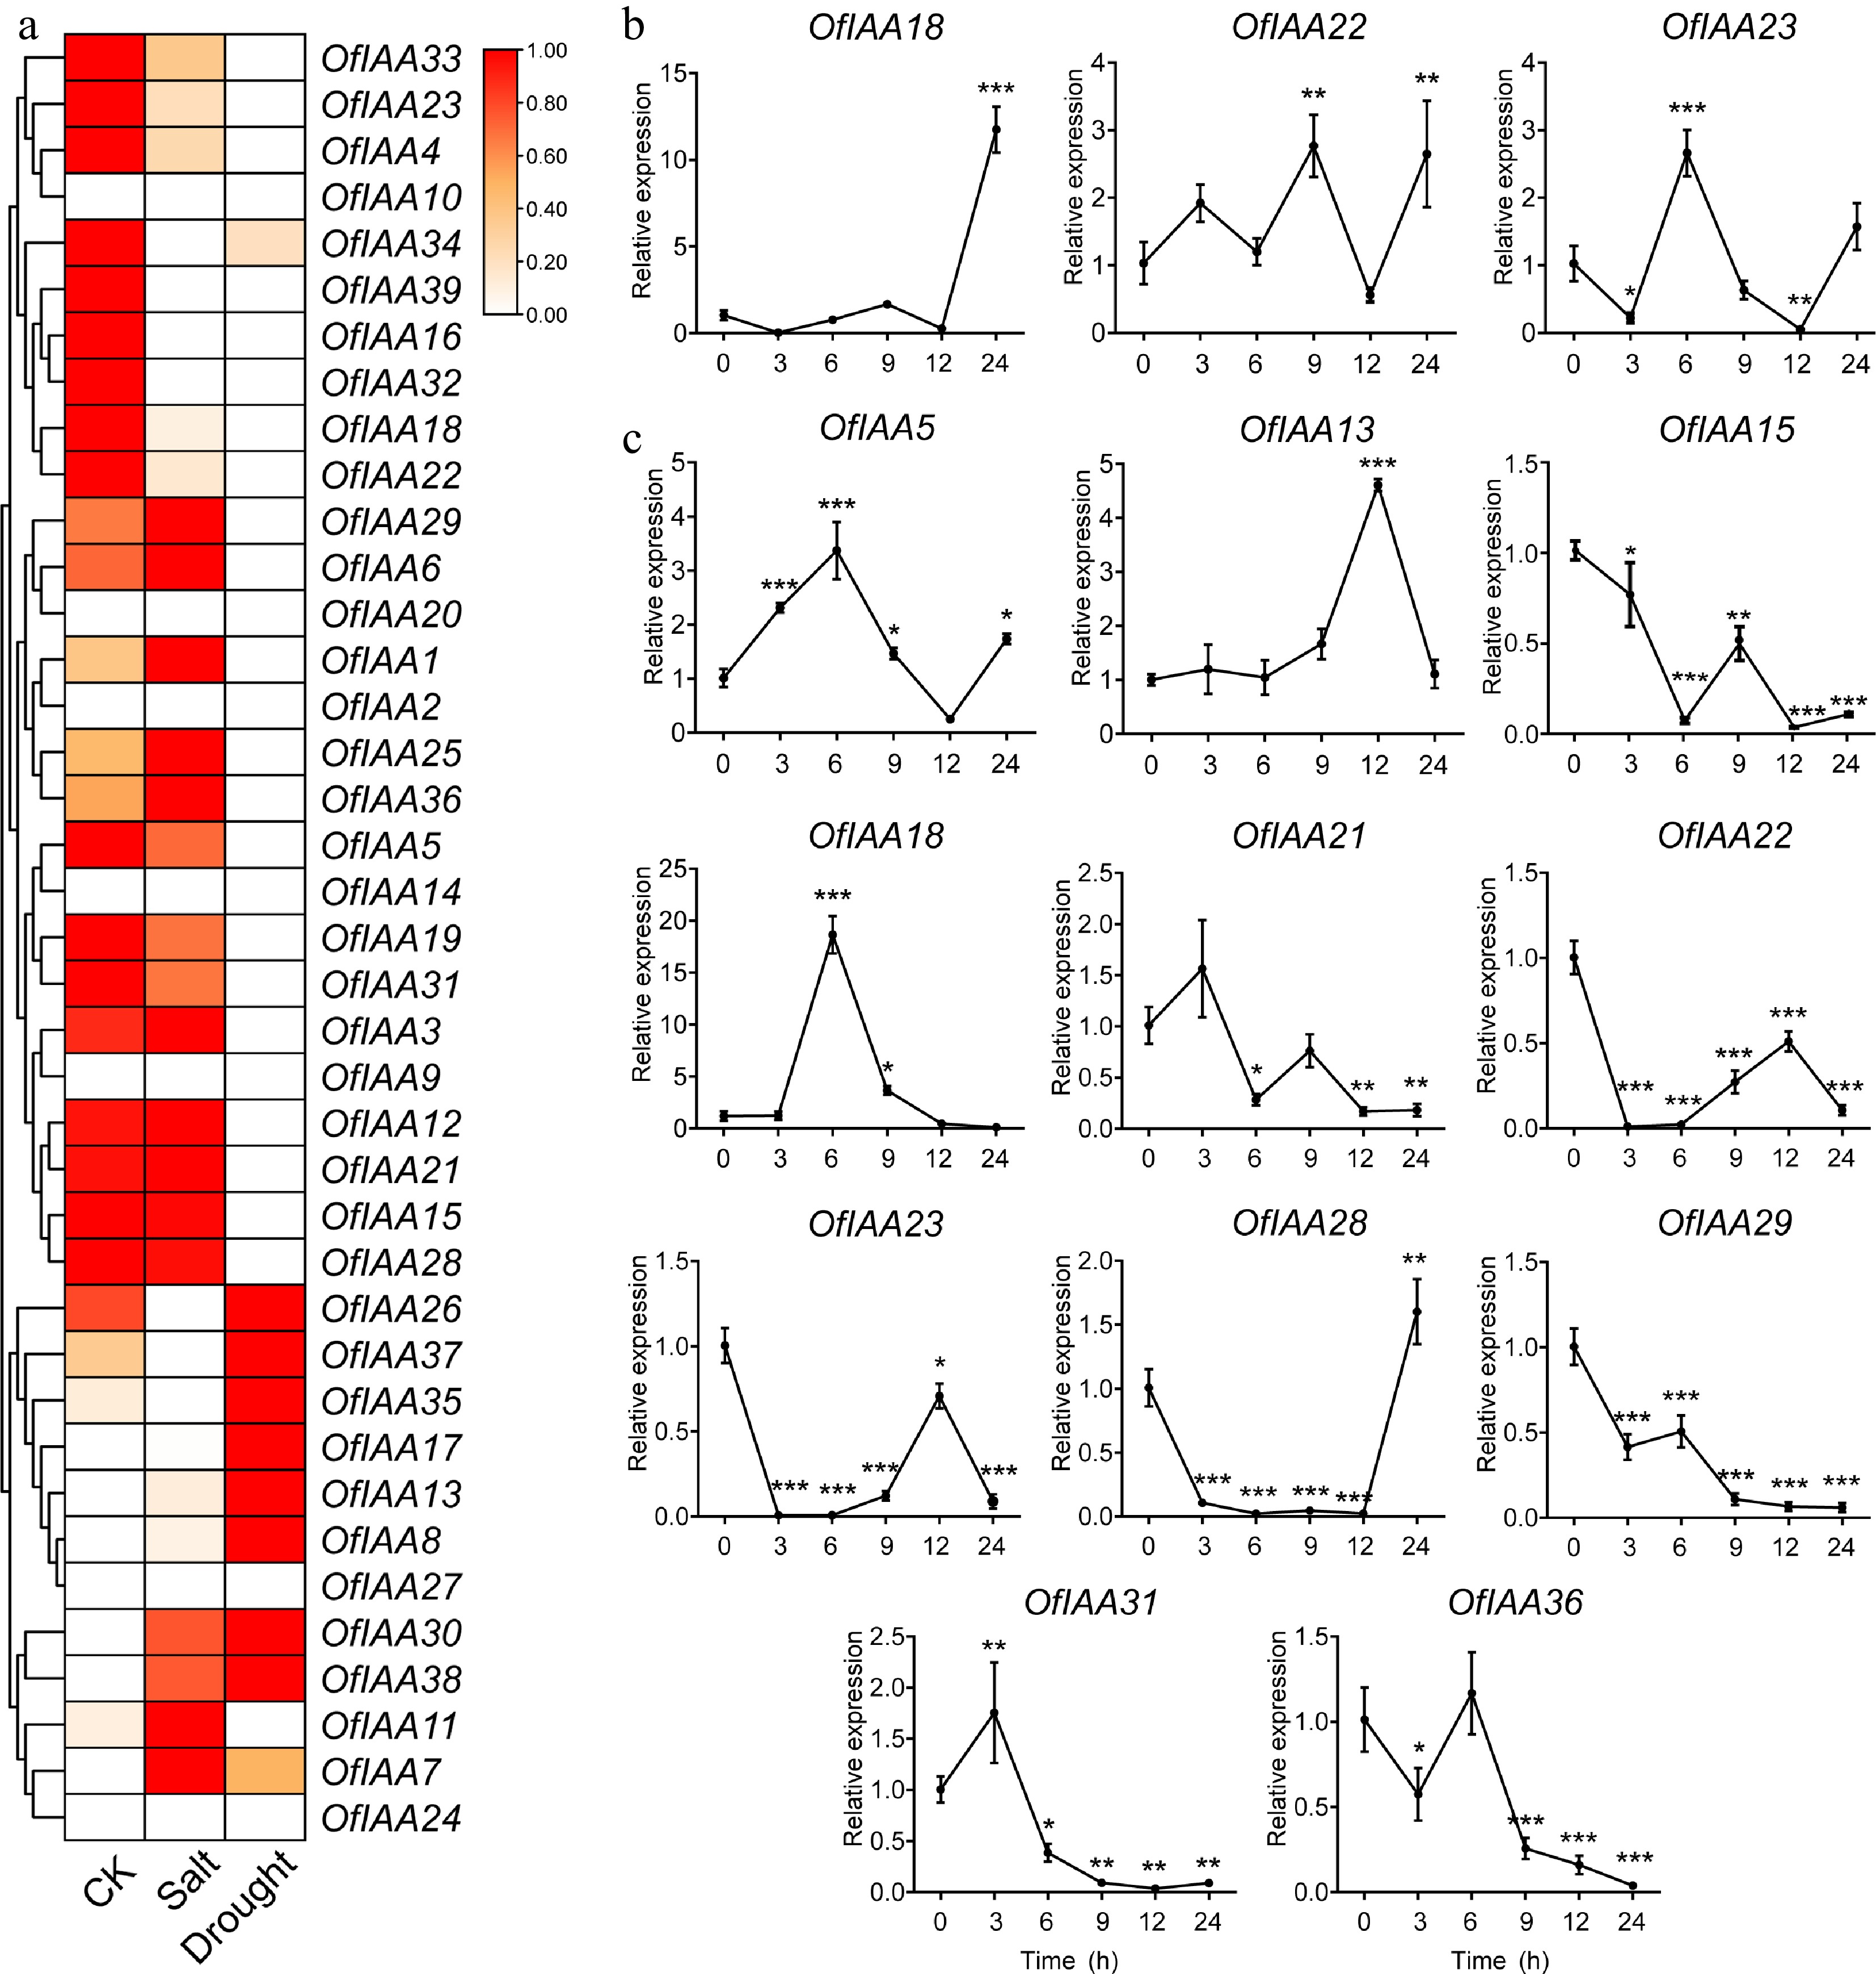
Figure 9.
Expression profiles of the differentially expressed OfIAA genes after (a) salt and (b) drought treatments by qRT‒PCR in O. fragrans. Error bars represent the standard error for three replicates. Significance was assessed by Duncan's multiple-range test (DMRT) at p < 0.001 (***), p < 0.01 (**) and p < 0.05 (*).
-
Duplicated gene pairs Ka Ks Ka/Ks Divergence time
(Mya)OfIAA1 & OfIAA30 0.07 0.25 0.29 8.46 OfIAA3 & OfIAA29 0.18 0.45 0.41 15.02 OfIAA5 & OfIAA12 0.22 0.92 0.24 30.57 OfIAA5 & OfIAA28 0.22 1.67 0.13 55.65 OfIAA5 & OfIAA36 0.04 0.22 0.21 7.27 OfIAA5 & OfIAA38 0.18 0.73 0.25 24.38 OfIAA9 & OfIAA10 0.01 0.02 0.69 0.56 OfIAA8 & OfIAA13 0.1 0.67 0.16 22.2 OfIAA8 & OfIAA19 0.07 0.12 0.62 3.89 OfIAA6 & OfIAA18 0.11 0.28 0.41 9.26 OfIAA7 & OfIAA17 0.08 0.24 0.35 8.16 OfIAA6 & OfIAA29 0.27 0.72 0.37 23.97 OfIAA8 & OfIAA38 0.36 2.28 0.16 75.9 OfIAA13 & OfIAA19 0.16 0.72 0.22 24.03 OfIAA13 & OfIAA27 0.2 1.65 0.12 55.07 OfIAA13 & OfIAA33 0.21 1.16 0.19 38.59 OfIAA12 & OfIAA36 0.21 0.76 0.28 25.36 OfIAA13 & OfIAA37 0.25 1.7 0.15 56.59 OfIAA12 & OfIAA38 0.1 0.2 0.48 6.59 OfIAA14 & OfIAA24 0.07 0.19 0.39 6.34 OfIAA15 & OfIAA25 0.09 0.28 0.3 9.44 OfIAA16 & OfIAA20 0.18 0.43 0.43 14.39 OfIAA18 & OfIAA29 0.3 0.97 0.31 32.19 OfIAA21 & OfIAA31 0.07 0.19 0.35 6.36 OfIAA22 & OfIAA27 0.14 0.52 0.27 17.18 OfIAA23 & OfIAA28 0.07 0.75 0.1 24.89 OfIAA23 & OfIAA28 0.07 0.75 0.1 24.89 OfIAA22 & OfIAA37 0.06 0.23 0.27 7.69 OfIAA26 & OfIAA35 0.07 0.24 0.3 8.15 OfIAA27 & OfIAA33 0.07 0.25 0.27 8.41 OfIAA27 & OfIAA37 0.12 0.72 0.17 24.12 OfIAA33 & OfIAA37 0.14 0.86 0.16 28.59 OfIAA36 & OfIAA38 0.17 0.67 0.26 22.23 OfIAA37 & OfIAA39 0.22 1.48 0.15 49.41 Ka, nonsynonymous; Ks, synonymous. Table 1.
Ka/Ks analysis and estimated divergence time of OfIAA genes.
-
Gene Expression FoldChange Padj value S1 S2 OfIAA2 0.00 22.82 7.00 6.69 × 10⁻⁷ OfIAA6 1,121.83 435.01 −1.37 3.97 × 10⁻²⁹ OfIAA8 28.68 789.65 4.79 1.93 × 10−99 OfIAA11 5.05 24.49 2.26 1.20 × 10⁻³ OfIAA12 13.62 145.78 3.42 2.75 × 10⁻²¹ OfIAA13 18.45 60.19 1.70 8.14 × 10⁻⁵ OfIAA14 0.32 7.61 4.45 9.80 × 10⁻³ OfIAA19 92.29 490.40 2.41 1.30 × 10−41 OfIAA20 0.30 6.22 4.15 4.90 × 10⁻² OfIAA25 25.79 131.80 2.36 1.76 × 10⁻¹⁵ OfIAA27 4.82 23.02 2.25 5.20 × 10⁻³ OfIAA28 3.73 173.53 5.60 5.41 × 10⁻²⁸ OfIAA29 1,136.52 235.71 −2.27 4.41 × 10−60 OfIAA33 4.68 33.32 2.86 9.99 × 10⁻⁵ OfIAA36 44.20 92.87 1.06 7.90 × 10⁻⁴ OfIAA37 101.89 292.73 1.52 1.54 × 10⁻¹⁵ OfIAA38 110.89 292.85 1.40 1.45 × 10⁻¹³ OfIAA39 24.51 134.72 2.44 2.23 × 10⁻¹¹ Table 2.
Identification of DEGs in the flower opening processes of O. fragrans.
-
Stress Gene Expression FoldChange Padj value CK Treatment Salt OfIAA18 1.24 0.28 −2.18 2.2 × 10⁻³ OfIAA22 4.047 0.67 −2.59 3.6 × 10⁻⁵ OfIAA23 6.47 1.92 −1.75 1.5 × 10⁻⁴ Drought OfIAA5 35.73 12.14 −1.54 1.6 × 10⁻¹⁷ OfIAA13 0.38 6.59 4.15 8.1 × 10⁻¹² OfIAA15 2.87 0.41 −2.80 2.3 × 10⁻⁴ OfIAA18 1.24 0.23 −2.41 6.4 × 10⁻³ OfIAA21 79.82 29.78 −1.41 3.3 × 10⁻²⁶ OfIAA22 4.05 0.20 −4.30 4.1 × 10⁻⁹ OfIAA23 6.47 1.06 −2.59 2.9 × 10⁻⁷ OfIAA28 2.07 0.71 −1.53 3.7 × 10⁻² OfIAA29 13.73 6.75 −1.01 4.9 × 10⁻⁵ OfIAA31 60.42 15.61 −1.94 1.9 × 10⁻²⁶ OfIAA36 52.94 16.89 −1.63 3.1 × 10⁻¹⁷ Table 3.
Identification of DEGs under salt and drought treatments in O. fragrans.
Figures
(9)
Tables
(3)