2024 Volume 4
Article Contents
About this article
ARTICLE   Open Access    

Aux/IAA gene family identification and analysis reveals roles in flower opening and abiotic stress response in Osmanthus fragrans

  • # Authors contributed equally: Shanshan Cao, Yong Ye

More Information
  • The Aux/IAA (auxin/indole-3-acetic acid) gene family plays a crucial role in regulating various aspects of plant growth, development, and abiotic tolerance in the auxin transduction pathway. However, limited information is available about the Aux/IAA family in Osmanthus fragrans. This study aims to comprehensively analyze the Aux/IAA gene family on a genome-wide scale. A total of 39 OfIAA genes containing four conserved domains were identified. These genes were unevenly distributed across 19 chromosomes and grouped into six clades based on phylogenetic analysis, showing conserved gene structure and motif composition. The expansion of OfIAA genes in the O. fragrans genome was partially due to segmental duplication events. Analysis of cis-regulatory elements (CREs) in the promoters of the OfIAA genes revealed the presence of many CREs related to different hormones and abiotic stresses. Through transcriptome and expression pattern analysis, we found that the majority of OfIAA genes were expressed in the stem tissue. Moreover, during the flower opening process, 18 OfIAA genes exhibited differential expression, while three and 11 OfIAA genes, respectively, showed altered expression patterns after salt and drought treatments. These differentially expressed genes are likely involved in the regulation of flower opening and abiotic stress response. This study provides new insights into the potential roles of OfIAAs and contributes to a better understanding of the regulatory mechanisms of flower opening and abiotic stress tolerance in O. fragrans.
  • Aquaporins (AQPs) constitute a large family of transmembrane channel proteins that function as regulators of intracellular and intercellular water flow[1,2]. Since their first discovery in the 1990s, AQPs have been found not only in three domains of life, i.e., bacteria, eukaryotes, and archaea, but also in viruses[3,4]. Each AQP monomer is composed of an internal repeat of three transmembrane helices (i.e., TM1–TM6) as well as two half helixes that are formed by loop B (LB) and LE through dipping into the membrane[5]. The dual Asn-Pro-Ala (NPA) motifs that are located at the N-terminus of two half helixes act as a size barrier of the pore via creating an electrostatic repulsion of protons, whereas the so-called aromatic/arginine (ar/R) selectivity filter (i.e., H2, H5, LE1, and LE2) determines the substrate specificity by rendering the pore constriction site diverse in both size and hydrophobicity[59]. Based on sequence similarity, AQPs in higher plants could be divided into five subfamilies, i.e., plasma membrane intrinsic protein (PIP), tonoplast intrinsic protein (TIP), NOD26-like intrinsic protein (NIP), X intrinsic protein (XIP), and small basic intrinsic protein (SIP)[1017]. Among them, PIPs, which are typically localized in the cell membrane, are most conserved and play a central role in controlling plant water status[12,1822]. Among two phylogenetic groups present in the PIP subfamily, PIP1 possesses a relatively longer N-terminus and PIP2 features an extended C-terminus with one or more conserved S residues for phosphorylation modification[5,15,17].

    Tigernut (Cyperus esculentus L.), which belongs to the Cyperaceae family within Poales, is a novel and promising herbaceous C4 oil crop with wide adaptability, large biomass, and short life period[2327]. Tigernut is a unique species accumulating up to 35% oil in the underground tubers[2830], which are developed from stolons and the process includes three main stages, i.e., initiation, swelling, and maturation[3133]. Water is essential for tuber development and tuber moisture content maintains a relatively high level of approximately 85% until maturation when a significant drop to about 45% is observed[28,32]. Thereby, uncovering the mechanism of tuber water balance is of particular interest. Despite crucial roles of PIPs in the cell water balance, to date, their characterization in tigernut is still in the infancy[21]. The recently available genome and transcriptome datasets[31,33,34] provide an opportunity to address this issue.

    In this study, a global characterization of PIP genes was conducted in tigernut, including gene localizations, gene structures, sequence characteristics, and evolutionary patterns. Moreover, the correlation of CePIP mRNA/protein abundance with water content during tuber development as well as subcellular localizations were also investigated, which facilitated further elucidating the water balance mechanism in this special species.

    PIP genes reported in Arabidopsis (Arabidopsis thaliana)[10] and rice (Oryza sativa)[11] were respectively obtained from TAIR11 (www.arabidopsis.org) and RGAP7 (http://rice.uga.edu), and detailed information is shown in Supplemental Table S1. Their protein sequences were used as queries for tBLASTn[35] (E-value, 1e–10) search of the full-length tigernut transcriptome and genome sequences that were accessed from CNGBdb (https://db.cngb.org/search/assembly/CNA0051961)[31,34]. RNA sequencing (RNA-seq) reads that are available in NCBI (www.ncbi.nlm.nih.gov/sra) were also adopted for gene structure revision as described before[13], and presence of the conserved MIP (major intrinsic protein, Pfam accession number PF00230) domain in candidates was confirmed using MOTIF Search (www.genome.jp/tools/motif). To uncover the origin and evolution of CePIP genes, a similar approach was also employed to identify homologs from representative plant species, i.e., Carex cristatella (v1, Cyperaceae)[36], Rhynchospora breviuscula (v1, Cyperaceae)[37], and Juncus effusus (v1, Juncaceae)[37], whose genome sequences were accessed from NCBI (www.ncbi.nlm.nih.gov). Gene structure of candidates were displayed using GSDS 2.0 (http://gsds.gao-lab.org), whereas physiochemical parameters of deduced proteins were calculated using ProtParam (http://web.expasy.org/protparam). Subcellular localization prediction was conducted using WoLF PSORT (www.genscript.com/wolf-psort.html).

    Nucleotide and protein multiple sequence alignments were respectively conducted using ClustalW and MUSCLE implemented in MEGA6[38] with default parameters, and phylogenetic tree construction was carried out using MEGA6 with the maximum likelihood method and bootstrap of 1,000 replicates. Systematic names of PIP genes were assigned with two italic letters denoting the source organism and a progressive number based on sequence similarity. Conserved motifs were identified using MEME Suite 5.5.3 (https://meme-suite.org/tools/meme) with optimized parameters as follows: Any number of repetitions, maximum number of 15 motifs, and a width of 6 and 250 residues for each motif. TMs and conserved residues were identified using homology modeling and sequence alignment with the structure resolved spinach (Spinacia oleracea) SoPIP2;1[5].

    Synteny analysis was conducted using TBtools-II[39] as described previously[40], where the parameters were set as E-value of 1e-10 and BLAST hits of 5. Duplication modes were identified using the DupGen_finder pipeline[41], and Ks (synonymous substitution rate) and Ka (nonsynonymous substitution rate) of duplicate pairs were calculated using codeml in the PAML package[42]. Orthologs between different species were identified using InParanoid[43] and information from synteny analysis, and orthogroups (OGs) were assigned only when they were present in at least two species examined.

    Plant materials used for gene cloning, qRT-PCR analysis, and 4D-parallel reaction monitoring (4D-PRM)-based protein quantification were derived from a tigernut variety Reyan3[31], and plants were grown in a greenhouse as described previously[25]. For expression profiling during leaf development, three representative stages, i.e., young, mature, and senescing, were selected and the chlorophyll content was checked using SPAD-502Plus (Konica Minolta, Shanghai, China) as previously described[44]. Young and senescing leaves are yellow in appearance, and their chlorophyll contents are just half of that of mature leaves that are dark green. For diurnal fluctuation regulation, mature leaves were sampled every 4 h from the onset of light at 8 a.m. For gene regulation during tuber development, fresh tubers at 1, 5, 10, 15, 20, 25, and 35 d after tuber initiation (DAI) were collected as described previously[32]. All samples with three biological replicates were quickly frozen with liquid nitrogen and stored at −80 °C for further use. For subcellular localization analysis, tobacco (Nicotiana benthamiana) plants were grown as previously described[20].

    Tissue-specific expression profiles of CePIP genes were investigated using Illumina RNA-seq samples (150 bp paired-end reads) with three biological replicates for young leaf, mature leaf, sheath of mature leaf, shoot apex, root, rhizome, and three stages of developmental tuber (40, 85, and 120 d after sowing (DAS)), which are under the NCBI accession number of PRJNA703731. Raw sequence reads in the FASTQ format were obtained using fastq-dump, and quality control was performed using fastQC (www.bioinformatics.babraham.ac.uk/projects/fastqc). Read mapping was performed using HISAT2 (v2.2.1, https://daehwankimlab.github.io/hisat2), and relative gene expression level was presented as FPKM (fragments per kilobase of exon per million fragments mapped)[45].

    For qRT-PCR analysis, total RNA extraction and synthesis of the first-strand cDNA were conducted as previously described[24]. Primers used in this study are shown in Supplemental Table S2, where CeUCE2 and CeTIP41[25,33] were employed as two reference genes. PCR reaction in triplicate for each biological sample was carried out using the SYBR-green Mix (Takara) on a Real-time Thermal Cycler Type 5100 (Thermal Fisher Scientific Oy). Relative gene abundance was estimated with the 2−ΔΔCᴛ method and statistical analysis was performed using SPSS Statistics 20 as described previously[13].

    Raw proteomic data for tigernut roots, leaves, freshly harvested, dried, rehydrated for 48 h, and sprouted tubers were downloaded from ProteomeXchange/PRIDE (www.proteomexchange.org, PXD021894, PXD031123, and PXD035931), which were further analyzed using Maxquant (v1.6.15.0, www.maxquant.org). Three dominant members, i.e., CePIP1;1, -2;1, and -2;8, were selected for 4D-PRM quantification analysis, and related unique peptides are shown in Supplemental Table S3. Protein extraction, trypsin digestion, and LC-MS/MS analysis were conducted as described previously[46].

    For subcellular localization analysis, the coding region (CDS) of CePIP1;1, -2;1, and -2;8 were cloned into pNC-Cam1304-SubN via Nimble Cloning as described before[30]. Then, recombinant plasmids were introduced into Agrobacterium tumefaciens GV3101 with the helper plasmid pSoup-P19 and infiltration of 4-week-old tobacco leaves were performed as previously described[20]. For subcellular localization analysis, the plasma membrane marker HbPIP2;3-RFP[22] was co-transformed as a positive control. Fluorescence observation was conducted using confocal laser scanning microscopy imaging (Zeiss LMS880, Germany): The wavelength of laser-1 was set as 730 nm for RFP observation, where the fluorescence was excited at 561 nm; the wavelength of laser-2 was set as 750 nm for EGFP observation, where the fluorescence was excited at 488 nm; and the wavelength of laser-3 was set as 470 nm for chlorophyll autofluorescence observation, where the fluorescence was excited at 633 nm.

    As shown in Table 1, a total of 14 PIP genes were identified from eight tigernut scaffolds (Scfs). The CDS length varies from 831 to 882 bp, putatively encoding 276–293 amino acids (AA) with a molecular weight (MW) of 29.16–31.59 kilodalton (kDa). The theoretical isoelectric point (pI) varies from 7.04 to 9.46, implying that they are all alkaline. The grand average of hydropathicity (GRAVY) is between 0.344 and 0.577, and the aliphatic index (II) ranges from 94.57 to 106.90, which are consistent with the hydrophobic characteristic of AQPs[47]. As expected, like SoPIP2;1, all CePIPs include six TMs, two typical NPA motifs, the invariable ar/R filter F-H-T-R, five conserved Froger's positions Q/M-S-A-F-W, and two highly conserved residues corresponding to H193 and L197 in SoPIP2;1 that were proven to be involved in gating[5,48], though the H→F variation was found in CePIP2;9, -2;10, and -2;11 (Supplemental Fig. S1). Moreover, two S residues, corresponding to S115 and S274 in SoPIP2;1[5], respectively, were also found in the majority of CePIPs (Supplemental Fig. S1), implying their posttranslational regulation by phosphorylation.

    Table 1.  Fourteen PIP genes identified in C. esculentus.
    Gene name Locus Position Intron no. AA MW (kDa) pI GRAVY AI TM MIP
    CePIP1;1 CESC_15147 Scf9:2757378..2759502(–) 3 288 30.76 8.82 0.384 95.28 6 47..276
    CePIP1;2 CESC_04128 Scf4:3806361..3807726(–) 3 291 31.11 8.81 0.344 95.95 6 46..274
    CePIP1;3 CESC_15950 Scf54:5022493..5023820(+) 3 289 31.06 8.80 0.363 94.57 6 49..278
    CePIP2;1 CESC_15350 Scf9:879960..884243(+) 3 288 30.34 8.60 0.529 103.02 6 33..269
    CePIP2;2 CESC_00011 Scf30:4234620..4236549(+) 3 293 31.59 9.27 0.394 101.57 6 35..268
    CePIP2;3 CESC_00010 Scf30:4239406..4241658(+) 3 291 30.88 9.44 0.432 98.97 6 31..266
    CePIP2;4 CESC_05080 Scf46:307799..309544(+) 3 285 30.44 7.04 0.453 100.32 6 28..265
    CePIP2;5 CESC_05079 Scf46:312254..314388(+) 3 286 30.49 7.04 0.512 101.68 6 31..268
    CePIP2;6 CESC_05078 Scf46:316024..317780(+) 3 288 30.65 7.68 0.475 103.06 6 31..268
    CePIP2;7 CESC_05077 Scf46:320439..322184(+) 3 284 30.12 8.55 0.500 100.00 6 29..266
    CePIP2;8 CESC_14470 Scf2:4446409..4448999(+) 3 284 30.37 8.30 0.490 106.90 6 33..263
    CePIP2;9 CESC_02223 Scf1:2543928..2545778(–) 3 283 30.09 9.46 0.533 106.47 6 31..262
    CePIP2;10 CESC_10007 Scf27:1686032..1688010(–) 3 276 29.16 9.23 0.560 106.05 6 26..256
    CePIP2;11 CESC_10009 Scf27:1694196..1696175(–) 3 284 29.71 9.10 0.577 105.49 6 33..263
    AA: amino acid; AI: aliphatic index; GRAVY: grand average of hydropathicity; kDa: kilodalton; MIP: major intrinsic protein; MW: molecular weight; pI: isoelectric point; PIP: plasma membrane intrinsic protein; Scf: scaffold; TM: transmembrane helix.
     | Show Table
    DownLoad: CSV

    To uncover the evolutionary relationships, an unrooted phylogenetic tree was constructed using the full-length protein sequences of CePIPs together with 11 OsPIPs and 13 AtPIPs. As shown in Fig. 1a, these proteins were clustered into two main groups, corresponding to PIP1 and PIP2 as previously defined[10,49], and each appears to have evolved into several subgroups. Compared with PIP1s, PIP2s possess a relatively shorter N-terminal but an extended C-terminal with one conserved S residue (Supplemental Fig. S1). Interestingly, a high number of gene repeats were detected, most of which seem to be species-specific, i.e., AtPIP1;1/-1;2/-1;3/-1;4/-1;5, AtPIP2;1/-2;2/-2;3/-2;4/-2;5/-2;6, AtPIP2;7/-2;8, OsPIP1;1/-1;2/-1;3, OsPIP2;1/-2;4/-2;5, OsPIP2;2/-2;3, CePIP1;1/-1;2, CePIP2;2/-2;3, CePIP2;4/-2;5/-2;6/-2;7, and CePIP2;9/-2;10/-2;11, reflecting the occurrence of more than one lineage-specific whole-genome duplications (WGDs) after their divergence[50,51]. In Arabidopsis that experienced three WGDs (i.e. γ, β, and α) after the split with the monocot clade[52], AtPIP1;5 in the PIP1 group first gave rise to AtPIP1;1 via the γ WGD shared by all core eudicots[50], which latter resulted in AtPIP1;3, -1;4, and -1;2 via β and α WGDs; AtPIP2;1 in the PIP2 group first gave rise to AtPIP2;6 via the γ WGD, and they latter generated AtPIP2;2, and -2;5 via the α WGD (Supplemental Table S1). In rice, which also experienced three WGDs (i.e. τ, σ, and ρ) after the split with the eudicot clade[51], OsPIP1;2 and -2;3 generated OsPIP1;1 and -2;2 via the Poaceae-specific ρ WGD, respectively. Additionally, tandem, proximal, transposed and dispersed duplications also played a role on the gene expansion in these two species (Supplemental Table S1).

    Figure 1.  Structural and phylogenetic analysis of PIPs in C. esculentus, O. sativa, and A. thaliana. (a) Shown is an unrooted phylogenetic tree resulting from full-length PIPs with MEGA6 (maximum likelihood method and bootstrap of 1,000 replicates), where the distance scale denotes the number of amino acid substitutions per site. (b) Shown are the exon-intron structures. (c) Shown is the distribution of conserved motifs among PIPs, where different motifs are represented by different color blocks as indicated and the same color block in different proteins indicates a certain motif. (At: A. thaliana; Ce: C. esculentus; PIP: plasma membrane intrinsic protein; Os: O. sativa).

    Analysis of gene structures revealed that all CePIP and AtPIP genes possess three introns and four exons in the CDS, in contrast to the frequent loss of certain introns in rice, including OsPIP1;2, -1;3, -2;1, -2;3, -2;4, -2;5, -2;6, -2;7, and -2;8 (Fig. 1b). The positions of three introns are highly conserved, which are located in sequences encoding LB (three residues before the first NPA), LD (one residue before the conserved L involved in gating), and LE (18 residues after the second NPA), respectively (Supplemental Fig. S1). The intron length of CePIP genes is highly variable, i.e., 109–993 bp, 115–1745 bp, and 95–866 bp for three introns, respectively. By contrast, the exon length is relatively less variable: Exons 2 and 3 are invariable with 296 bp and 141 bp, respectively, whereas Exons 1 and 4 are of 277–343 bp and 93–132 bp, determining the length of N- and C-terminus of PIP1 and PIP2, respectively (Fig. 1b). Correspondingly, their protein structures were shown to be highly conserved, and six (i.e., Motifs 1–6) out of 15 motifs identified are broadly present. Among them, Motif 3, -2, -6, -1, and -4 constitute the conserved MIP domain. In contrast to a single Motif 5 present in most PIP2s, all PIP1s possess two sequential copies of Motif 5, where the first one is located at the extended N-terminal. In CePIP2;3 and OsPIP2;7, Motif 5 is replaced by Motif 13; in CePIP2;2, it is replaced by two copies of Motif 15; and no significant motif was detected in this region of CePIP2;10. PIP1s and PIP2s usually feature Motif 9 and -7 at the C-terminal, respectively, though it is replaced by Motif 12 in CePIP2;6 and OsPIP2;8. PIP2s usually feature Motif 8 at the N-terminal, though it is replaced by Motif 14 in CePIP2;2 and -2;3 or replaced by Motif 11 in CePIP2;10 and -2;11 (Fig. 1c).

    As shown in Fig. 2a, gene localization of CePIPs revealed three gene clusters, i.e., CePIP2;2/-2;3 on Scf30, CePIP2;4/-2;5/-2;6/-2;7 on Scf46, and CePIP2;10/-2;11 on Scf27, which were defined as tandem repeats for their high sequence similarities and neighboring locations. The nucleotide identities of these duplicate pairs vary from 70.5% to 91.2%, and the Ks values range from 0.0971 to 1.2778 (Table 2), implying different time of their birth. According to intra-species synteny analysis, two duplicate pairs, i.e., CePIP1;1/-1;2 and CePIP2;2/-2;4, were shown to be located within syntenic blocks (Fig. 2b) and thus were defined as WGD repeats. Among them, CePIP1;1/-1;2 possess a comparable Ks value to CePIP2;2/-2;3, CePIP1;1/-1;3, and CePIP2;4/-2;8 (1.2522 vs 1.2287–1.2778), whereas CePIP2;2/-2;4 harbor a relatively higher Ks value of 1.5474 (Table 2), implying early origin or fast evolution of the latter. While CePIP1;1/-1;3 and CePIP2;1/-2;8 were characterized as transposed repeats, CePIP2;1/-2;2, CePIP2;9/-2;10, and CePIP2;8/-2;10 were characterized as dispersed repeats (Fig. 2a). The Ks values of three dispersed repeats vary from 0.8591 to 3.0117 (Table 2), implying distinct times of origin.

    Figure 2.  Duplication events of CePIP genes and synteny analysis within and between C. esculentus, O. sativa, and A. thaliana. (a) Duplication events detected in tigernut. Serial numbers are indicated at the top of each scaffold, and the scale is in Mb. Duplicate pairs identified in this study are connected using lines in different colors, i.e., tandem (shown in green), transposed (shown in purple), dispersed (shown in gold), and WGD (shown in red). (b) Synteny analysis within and between C. esculentus, O. sativa, and A. thaliana. (c) Synteny analysis within and between C. esculentus, C. cristatella, R. breviuscula, and J. effusus. Shown are PIP-encoding chromosomes/scaffolds and only syntenic blocks that contain PIP genes are marked, i.e., red and purple for intra- and inter-species, respectively. (At: A. thaliana; Cc: C. cristatella; Ce: C. esculentus; Je: J. effusus; Mb: megabase; PIP: plasma membrane intrinsic protein; Os: O. sativa; Rb: R. breviuscula; Scf: scaffold; WGD: whole-genome duplication).
    Table 2.  Sequence identity and evolutionary rate of homologous PIP gene pairs identified in C. esculentus. Ks and Ka were calculated using PAML.
    Duplicate 1 Duplicate 2 Identity (%) Ka Ks Ka/Ks
    CePIP1;1 CePIP1;3 78.70 0.0750 1.2287 0.0610
    CePIP1;2 CePIP1;1 77.20 0.0894 1.2522 0.0714
    CePIP2;1 CePIP2;4 74.90 0.0965 1.7009 0.0567
    CePIP2;3 CePIP2;2 70.50 0.1819 1.2778 0.1424
    CePIP2;4 CePIP2;2 66.50 0.2094 1.5474 0.1353
    CePIP2;5 CePIP2;4 87.30 0.0225 0.4948 0.0455
    CePIP2;6 CePIP2;5 84.90 0.0545 0.5820 0.0937
    CePIP2;7 CePIP2;6 78.70 0.0894 1.0269 0.0871
    CePIP2;8 CePIP2;4 72.90 0.1401 1.2641 0.1109
    CePIP2;9 CePIP2;10 76.40 0.1290 0.8591 0.1502
    CePIP2;10 CePIP2;8 64.90 0.2432 3.0117 0.0807
    CePIP2;11 CePIP2;10 91.20 0.0562 0.0971 0.5783
    Ce: C. esculentus; Ka: nonsynonymous substitution rate; Ks: synonymous substitution rate; PIP: plasma membrane intrinsic protein.
     | Show Table
    DownLoad: CSV

    According to inter-species syntenic analysis, six out of 14 CePIP genes were shown to have syntelogs in rice, including 1:1, 1:2, and 2:2 (i.e. CePIP1;1 vs OsPIP1;3, CePIP1;3 vs OsPIP1;2/-1;1, CePIP2;1 vs OsPIP2;4, CePIP2;2/-2;4 vs OsPIP2;3/-2;2, and CePIP2;8 vs OsPIP2;6), in striking contrast to a single one found in Arabidopsis (i.e. CePIP1;2 vs AtPIP1;2). Correspondingly, only OsPIP1;2 in rice was shown to have syntelogs in Arabidopsis, i.e., AtPIP1;3 and -1;4 (Fig. 2b). These results are consistent with their taxonomic relationships that tigernut and rice are closely related[50,51], and also imply lineage-specific evolution after their divergence.

    As described above, phylogenetic and syntenic analyses showed that the last common ancestor of tigernut and rice is more likely to possess only two PIP1s and three PIP2s. However, it is not clear whether the gene expansion observed in tigernut is species-specific or Cyperaceae-specific. To address this issue, recently available genomes were used to identify PIP subfamily genes from C. cristatella, R. breviuscula, and J. effuses, resulting in 15, 13, and nine members, respectively. Interestingly, in contrast to a high number of tandem repeats found in Cyperaceae species, only one pair of tandem repeats (i.e., JePIP2;3 and -2;4) were identified in J. effusus, a close outgroup species to Cyperaceae in the Juncaceae family[36,37]. According to homologous analysis, a total of 12 orthogroups were identified, where JePIP genes belong to PIP1A (JePIP1;1), PIP1B (JePIP1;2), PIP1C (JePIP1;3), PIP2A (JePIP2;1), PIP2B (JePIP2;2), PIP2F (JePIP2;3 and -2;4), PIP2G (JePIP2;5), and PIP2H (JePIP2;6) (Table 3). Further intra-species syntenic analysis revealed that JePIP1;1/-1;2 and JePIP2;2/-2;3 are located within syntenic blocks, which is consistent with CePIP1;1/-1;2, CePIP2;2/-2;4, CcPIP1;1/-1;2, CcPIP2;3/-2;4, RbPIP1;1/-1;2, and RbPIP2;2/-2;5 (Fig. 2c), implying that PIP1A/PIP1B and PIP2B/PIP2D were derived from WGDs occurred sometime before Cyperaceae-Juncaceae divergence. After the split with Juncaceae, tandem duplications frequently occurred in Cyperaceae, where PIP2B/PIP2C and PIP2D/PIP2E/PIP2F retain in most Cyperaceae plants examined in this study. By contrast, species-specific expansion was also observed, i.e., CePIP2;4/-2;5, CePIP2;10/-2;11, CcPIP1;2/-1;3, CcPIP2;4/-2;5, CcPIP2;8/-2;9, CcPIP2;10/-2;11, RbPIP2;3/-2;4, and RbPIP2;9/-2;10 (Table 3 & Fig. 2c).

    Table 3.  Twelve proposed orthogroups based on comparison of representative plant species.
    Orthogroup C. esculentus C. cristatella R. breviuscula J. effusus O. sativa A. thaliana
    PIP1A CePIP1;1 CcPIP1;1 RbPIP1;1 JePIP1;1 OsPIP1;3 AtPIP1;1, AtPIP1;2,
    AtPIP1;3, AtPIP1;4,
    AtPIP1;5
    PIP1B CePIP1;2 CcPIP1;2, CcPIP1;3 RbPIP1;2 JePIP1;2
    PIP1C CePIP1;3 CcPIP1;4 RbPIP1;3 JePIP1;3 OsPIP1;1, OsPIP1;2
    PIP2A CePIP2;1 CcPIP2;1 RbPIP2;1 JePIP2;1 OsPIP2;1, OsPIP2;4,
    OsPIP2;5
    AtPIP2;1, AtPIP2;2,
    AtPIP2;3, AtPIP2;4,
    AtPIP2;5, AtPIP2;6
    PIP2B CePIP2;2 CcPIP2;2 RbPIP2;2 JePIP2;2 OsPIP2;2, OsPIP2;3
    PIP2C CePIP2;3 CcPIP2;3 RbPIP2;3, RbPIP2;4
    PIP2D CePIP2;4, CePIP2;5 CcPIP2;4, CcPIP2;5 RbPIP2;5
    PIP2E CePIP2;5 CcPIP2;5 RbPIP2;6
    PIP2F CePIP2;6 CcPIP2;6
    PIP2G CePIP2;7 CcPIP2;7 RbPIP2;7 JePIP2;3, JePIP2;4
    PIP2H CePIP2;8 CcPIP2;8, CcPIP2;9 RbPIP2;8 JePIP2;5 OsPIP2;6 AtPIP2;7, AtPIP2;8
    PIP2I CePIP2;9, CePIP2;10,
    CePIP2;11
    CcPIP2;10, CcPIP2;11 RbPIP2;9, RbPIP2;10 JePIP2;6 OsPIP2;7, OsPIP2;8
    At: A. thaliana; Cc: C. cristatella; Ce: C. esculentus; Je: J. effuses; Os: O. sativa; Rb: R. breviuscula; PIP: plasma membrane intrinsic protein.
     | Show Table
    DownLoad: CSV

    Tissue-specific expression profiles of CePIP genes were investigated using transcriptome data available for young leaf, mature leaf, sheath, root, rhizome, shoot apex, and tuber. As shown in Fig. 3a, CePIP genes were mostly expressed in roots, followed by sheaths, moderately in tubers, young leaves, rhizomes, and mature leaves, and lowly in shoot apexes. In most tissues, CePIP1;1, -2;1, and -2;8 represent three dominant members that contributed more than 90% of total transcripts. By contrast, in rhizome, these three members occupied about 80% of total transcripts, which together with CePIP1;3 and -2;4 contributed up to 96%; in root, CePIP1;1, -1;3, -2;4, and -2;7 occupied about 84% of total transcripts, which together with CePIP2;1 and -2;8 contributed up to 94%. According to their expression patterns, CePIP genes could be divided into five main clusters: Cluster I includes CePIP1;1, -2;1, and -2;8 that were constitutively and highly expressed in all tissues examined; Cluster II includes CePIP2;2, -2;9, and -2;10 that were lowly expressed in all tested tissues; Cluster III includes CePIP1;2 and -2;11 that were preferentially expressed in young leaf and sheath; Cluster IV includes CePIP1;3 and -2;4 that were predominantly expressed in root and rhizome; and Cluster V includes remains that were typically expressed in root (Fig. 3a). Collectively, these results imply expression divergence of most duplicate pairs and three members (i.e. CePIP1;1, -2;1, and -2;8) have evolved to be constitutively co-expressed in most tissues.

    Figure 3.  Expression profiles of CePIP genes in various tissues, different stages of leaf development, and mature leaves of diurnal fluctuation. (a) Tissue-specific expression profiles of 14 CePIP genes. The heatmap was generated using the R package implemented with a row-based standardization. Color scale represents FPKM normalized log2 transformed counts, where blue indicates low expression and red indicates high expression. (b) Expression profiles of CePIP1;1, -2;1, and -2;8 at different stages of leaf development. (c) Expression profiles of CePIP1;1, -2;1, and -2;8 in mature leaves of diurnal fluctuation. Bars indicate SD (N = 3) and uppercase letters indicate difference significance tested following Duncan's one-way multiple-range post hoc ANOVA (p< 0.01). (Ce: C. esculentus; FPKM: Fragments per kilobase of exon per million fragments mapped; PIP: plasma membrane intrinsic protein)

    As shown in Fig. 3a, compared with young leaves, transcriptome profiling showed that CePIP1;2, -2;3, -2;7, -2;8, and -2;11 were significantly down-regulated in mature leaves, whereas CePIP1;3 and -2;1 were up-regulated. To confirm the results, three dominant members, i.e., CePIP1;1, -2;1, and -2;8, were selected for qRT-PCR analysis, which includes three representative stages, i.e., young, mature, and senescing leaves. As shown in Fig. 3b, in contrast to CePIP2;1 that exhibited a bell-like expression pattern peaking in mature leaves, transcripts of both CePIP1;1 and -2;8 gradually decreased during leaf development. These results were largely consistent with transcriptome profiling, and the only difference is that CePIP1;1 was significantly down-regulated in mature leaves relative to young leaves. However, this may be due to different experiment conditions used, i.e., greenhouse vs natural conditions.

    Diurnal fluctuation expression patterns of CePIP1;1, -2;1, and -2;8 were also investigated in mature leaves and results are shown in Fig. 3c. Generally, transcripts of all three genes in the day (8, 12, 16, and 20 h) were higher than that in the night (24 and 4 h). During the day, both CePIP1;1 and -2;8 exhibited an unimodal expression pattern that peaked at 12 h, whereas CePIP2;1 possessed two peaks (8 and 16 h) and their difference was not significant. Nevertheless, transcripts of all three genes at 20 h (onset of night) were significantly lower than those at 8 h (onset of day) as well as 12 h. In the night, except for CePIP2;1, no significant difference was observed between the two stages for both CePIP1;1 and -2;8. Moreover, their transcripts were comparable to those at 20 h (Fig. 3c).

    To reveal the expression patterns of CePIP genes during tuber development, three representative stages, i.e., 40 DAS (early swelling stage), 85 DAS (late swelling stage), and 120 DAS (mature stage), were first profiled using transcriptome data. As shown in Fig. 4a, except for rare expression of CePIP1;2, -2;2, -2;9, and -2;10, most genes exhibited a bell-like expression pattern peaking at 85 DAS, in contrast to a gradual decrease of CePIP2;3 and -2;8. Notably, except for CePIP2;4, other genes were expressed considerably lower at 120 DAS than that at 40 DAS. For qRT-PCR confirmation of CePIP1;1, -2;1, and -2;8, seven stages were examined, i.e., 1, 5, 10, 15, 20, 25, and 35 DAI, which represent initiation, five stages of swelling, and maturation as described before[32]. As shown in Fig. 4b, two peaks were observed for all three genes, though their patterns were different. As for CePIP1;1, compared with the initiation stage (1 DAI), significant up-regulation was observed at the early swelling stage (5 DAI), followed by a gradual decrease except for the appearance of the second peak at 20 DAI, which is something different from transcriptome profiling. As for CePIP2;1, a sudden drop of transcripts first appeared at 5 DAI, then gradually increased until 20 DAI, which was followed by a gradual decrease at two late stages. The pattern of CePIP2;8 is similar to -1;1, two peaks appeared at 5 and 20 DAI and the second peak was significantly lower than the first. The difference is that the second peak of CePIP2;8 was significantly lower than the initiation stage. By contrast, the second peak (20 DAI) of CePIP2;1 was significantly higher than that of the first one (1 DAI). Nevertheless, the expression patterns of both CePIP2;1 and -2;8 are highly consistent with transcriptome profiling.

    Figure 4.  Transcript and protein abundances of CePIP genes during tuber development. (a) Transcriptome-based expression profiling of 14 CePIP genes during tuber development. The heatmap was generated using the R package implemented with a row-based standardization. Color scale represents FPKM normalized log2 transformed counts, where blue indicates low expression and red indicates high expression. (b) qRT-PCR-based expression profiling of CePIP1;1, -2;1, and -2;8 in seven representative stages of tuber development. (c) Relative protein abundance of CePIP1;1, -2;1, and -2;8 in three representative stages of tuber development. Bars indicate SD (N = 3) and uppercase letters indicate difference significance tested following Duncan's one-way multiple-range post hoc ANOVA (p < 0.01). (Ce: C. esculentus; DAI: days after tuber initiation; DAS: days after sowing; FPKM: Fragments per kilobase of exon per million fragments mapped; PIP: plasma membrane intrinsic protein).

    Since protein abundance is not always in agreement with the transcript level, protein profiles of three dominant members (i.e. CePIP1;1, -2;1, and -2;8) during tuber development were further investigated. For this purpose, we first took advantage of available proteomic data to identify CePIP proteins, i.e., leaves, roots, and four stages of tubers (freshly harvested, dried, rehydrated for 48 h, and sprouted). As shown in Supplemental Fig. S2, all three proteins were identified in both leaves and roots, whereas CePIP1;1 and -2;8 were also identified in at least one of four tested stages of tubers. Notably, all three proteins were considerably more abundant in roots, implying their key roles in root water balance.

    To further uncover their profiles during tuber development, 4D-PRM-based protein quantification was conducted in three representative stages of tuber development, i.e., 1, 25, and 35 DAI. As expected, all three proteins were identified and quantified. In contrast to gradual decrease of CePIP2;8, both CePIP1;1 and -2;1 exhibited a bell-like pattern that peaked at 25 DAI, though no significant difference was observed between 1 and 25 DAI (Fig. 4c). The trends are largely in accordance with their transcription patterns, though the reverse trend was observed for CePIP2;1 at two early stages (Fig. 4b & Fig. 4c).

    As predicted by WoLF PSORT, CePIP1;1, -2;1, and -2;8 may function in the cell membrane. To confirm the result, subcellular localization vectors named pNC-Cam1304-CePIP1;1, pNC-Cam1304-CePIP2;1, and pNC-Cam1304-CePIP2;8 were further constructed. When transiently overexpressed in tobacco leaves, green fluorescence signals of all three constructs were confined to cell membranes, highly coinciding with red fluorescence signals of the plasma membrane marker HbPIP2;3-RFP (Fig. 5).

    Figure 5.  (a) Schematic diagram of overexpressing constructs, (b) subcellular localization analysis of CePIP1;1, -2;1, and -2;8 in N. benthamiana leaves. (35S: cauliflower mosaic virus 35S RNA promoter; Ce: C. esculentus; EGFP: enhanced green fluorescent protein; kb: kilobase; NOS: terminator of the nopaline synthase gene; RFP: red fluorescent protein; PIP: plasma membrane intrinsic protein).

    Water balance is particularly important for cell metabolism and enlargement, plant growth and development, and stress responses[2,19]. As the name suggests, AQPs raised considerable interest for their high permeability to water, and plasma membrane-localized PIPs were proven to play key roles in transmembrane water transport between cells[1,18]. The first PIP was discovered in human erythrocytes, which was named CHIP28 or AQP1, and its homolog in plants was first characterized in Arabidopsis, which is known as RD28, PIP2c, or AtPIP2;3[3,7,53]. Thus far, genome-wide identification of PIP genes have been reported in a high number of plant species, including two model plants Arabidopsis and rice[10,11,1317,5456]. By contrast, little information is available on Cyperaceae, the third largest family within the monocot clade that possesses more than 5,600 species[57].

    Given the crucial roles of water balance for tuber development and crop production, in this study, tigernut, a representative Cyperaceae plant producing high amounts of oil in underground tubers[28,30,32], was employed to study PIP genes. A number of 14 PIP genes representing two phylogenetic groups (i.e., PIP1 and PIP2) or 12 orthogroups (i.e., PIP1A, PIP1B, PIP1C, PIP2A, PIP2B, PIP2C, PIP2D, PIP2E, PIP2F, PIP2G, PIP2H, and PIP2I) were identified from the tigernut genome. Though the family amounts are comparative or less than 13–21 present in Arabidopsis, cassava (Manihot esculenta), rubber tree (Hevea brasiliensis), poplar (Populus trichocarpa), C. cristatella, R. breviuscula, banana (Musa acuminata), maize (Zea mays), sorghum (Sorghum bicolor), barley (Hordeum vulgare), and switchgrass (Panicum virgatum), they are relatively more than four to 12 found in eelgrass (Zostera marina), Brachypodium distachyon, foxtail millet (Setaria italic), J. effuses, Aquilegia coerulea, papaya (Carica papaya), castor been (Ricinus communis), and physic nut (Jatropha curcas) (Supplemental Table S4). Among them, A. coerulea represents a basal eudicot that didn't experience the γ WGD shared by all core eudicots[50], whereas eelgrass is an early diverged aquatic monocot that didn't experience the τ WGD shared by all core monocots[56]. Interestingly, though both species possess two PIP1s and two PIP2s, they were shown to exhibit complex orthologous relationships of 1:1, 2:2, 1:0, and 0:1 (Supplemental Table S5). Whereas AcPIP1;1/AcPIP1;2/ZmPIP1;1/ZmPIP1;2 and ZmPIP2;1/AcPIP2;1 belong to PIP1A and PIP2A identified in this study, AcPIP2;2 and ZmPIP2;2 belong to PIP2H and PIP2I, respectively (Supplemental Table S5), implying that the last common ancestor of monocots and eudicots possesses only one PIP1 and two PIP2s followed by clade-specific expansion. A good example is the generation of AtPIP1;1 and -2;6 from AtPIP1;5 and -2;1 via the γ WGD, respectively[17].

    In tigernut, extensive expansion of the PIP subfamily was contributed by WGD (2), transposed (2), tandem (5), and dispersed duplications (3). It's worth noting that, two transposed repeats (i.e., CePIP1;1/-1;3 and CePIP2;1/-2;8) are shared by rice, implying their early origin that may be generated sometime after the split with the eudicot clade but before Cyperaceae-Poaceae divergence. By contrast, two WGD repeats (i.e., CePIP1;1/-1;2 and CePIP2;2/-2;4) are shared by C. cristatella, R. breviuscula, and J. effusus but not rice and Arabidopsis, implying that they may be derived from WGDs that occurred sometime after Cyperaceae-Poaceae split but before Cyperaceae-Juncaceae divergence. The possible WGD is the one that was described in C. littledalei[58], though the exact time still needs to be studied. Interestingly, compared with Arabidopsis (1) and rice (2), tandem/proximal duplications played a more important role in the expansion of PIP genes in tigernut (5) as well as other Cyperaceae species tested (5–6), which were shown to be Cyperaceae-specific or even species-specific. These tandem repeats may play a role in the adaptive evolution of Cyperaceae species as described in a high number of plant species[14,41]. According to comparative genomics analyses, tandem duplicates experienced stronger selective pressure than genes formed by other modes (WGD, transposed duplication, and dispersed duplication) and evolved toward biased functional roles involved in plant self-defense[41].

    As observed in most species such as Arabidopsis[10,1417], PIP genes in all Cyperaceae and Juncaceae species examined in this study, i.e., tigernut, C. cristatella, R. breviuscula, and J. effuses, feature three introns with conserved positions. By contrast, zero to three introns was not only found in rice but also in other Poaceae species such as maize, sorghum, foxtail millet, switchgrass, B. distachyon, and barley[54,55], implying lineage/species-specific evolution.

    Despite the extensive expansion of PIP genes (PIP2) in tigernut even after the split with R. breviuscula, CePIP1;1, -2;1, and -2;8 were shown to represent three dominant members in most tissues examined in this study, i.e., young leaf, mature leaf, sheath, rhizome, shoot apex, and tuber, though the situation in root is more complex. CePIP1;1 was characterized as a transposed repeat of CePIP1;3, which represents the most expressed member in root. Moreover, its recent WGD repeat CePIP1;2 was shown to be lowly expressed in most tested tissues, implying their divergence. The ortholog of CePIP1;1 in rice is OsPIP1;3 (RWC-3), which was shown to be preferentially expressed in roots, stems, and leaves, in contrast to constitutive expression of OsPIP1;1 (OsPIP1a) and -1;2[5961], two recent WGD repeats. Injecting the cRNA of OsPIP1;3 into Xenopus oocytes could increase the osmotic water permeability by 2–3 times[60], though the activity is considerably lower than PIP2s such as OsPIP2;2 and -2;2[6163]. Moreover, OsPIP1;3 was shown to play a role in drought avoidance in upland rice and its overexpression in lowland rice could increase root osmotic hydraulic conductivity, leaf water potential, and relative cumulative transpiration at the end of 10 h PEG treatment[64]. CePIP2;8 was characterized as a transposed repeat of CePIP2;1. Since their orthologs are present in both rice and Arabidopsis (Supplemental Table S3), the duplication event is more likely to occur sometime before monocot-eudicot split. Interestingly, their orthologs in rice, i.e., OsPIP2;1 (OsPIP2a) and -2;6, respectively, are also constitutively expressed[61], implying a conserved evolution with similar functions. When heterologously expressed in yeast, OsPIP2;1 was shown to exhibit high water transport activity[62,6466]. Moreover, root hydraulic conductivity was decreased by approximately four folds in OsPIP2;1 RNAi knock-down rice plants[64]. The water transport activity of OsPIP2;6 has not been tested, however, it was proven to be an H2O2 transporter that is involved in resistance to rice blast[61]. More work especially transgenic tests may improve our knowledge of the function of these key CePIP genes.

    Leaf is a photosynthetic organ that regulates water loss through transpiration. In tigernut, PIP transcripts in leaves were mainly contributed by CePIP1;1, -2;1, and -2;8, implying their key roles. During leaf development, in contrast to gradual decrease of CePIP1;1 and -2;8 transcripts in three stages (i.e. young, mature, and senescing) examined in this study, CePIP2;1 peaked in mature leaves. Their high abundance in young leaves is by cell elongation and enlargement at this stage, whereas upregulation of CePIP2;1 in mature leaves may inform its possible role in photosynthesis[67]. Thus far, a high number of CO2 permeable PIPs have been identified, e.g., AtPIP2;1, HvPIP2;1, HvPIP2;2, HvPIP2;3, HvPIP2;5, and SiPIP2;7[6870]. Moreover, in mature leaves, CePIP1;1, -2;1, and -2;8 were shown to exhibit an apparent diurnal fluctuation expression pattern that was expressed more in the day and usually peaked at noon, which reflects transpiration and the fact that PIP genes are usually induced by light[11,7173]. In rice, OsPIP2;4 and -2;5 also showed a clear diurnal fluctuation in roots that peaked at 3 h after the onset of light and dropped to a minimum 3 h after the onset of darkness[11]. Notably, further studies showed that temporal and dramatic induction of OsPIP2;5 around 2 h after light initiation was triggered by transpirational demand but not circadian rhythm[74].

    As an oil-bearing tuber crop, the main economic goal of tigernut cultivation is to harvest underground tubers, whose development is highly dependent on water available[32,75]. According to previous studies, the moisture content of immature tigernut tubers maintains more than 80.0%, followed by a seed-like dehydration process with a drop of water content to less than 50% during maturation[28,32]. Thereby, the water balance in developmental tubers must be tightly regulated. Like leaves, the majority of PIP transcripts in tubers were shown to be contributed by CePIP1;1, -2;1, and -2;8, which was further confirmed at the protein level. In accordance with the trend of water content during tuber development, mRNA, and protein abundances of CePIP1;1, -2;1, and -2;8 in initiation and swelling tubers were considerably higher than that at the mature stage. High abundances of CePIP1;1, -2;1, and -2;8 at the initiation stage reflects rapid cell division and elongation, whereas upregulation of CePIP1;1 and -2;1 at the swelling stage is in accordance with cell enlargement and active physiological metabolism such as rapid oil accumulation[28,30]. At the mature stage, downregulation of PIP transcripts and protein abundances resulted in a significant drop in the moisture content, which is accompanied by the significant accumulation of late embryogenesis-abundant proteins[23,32]. The situation is highly distinct from other tuber plants such as potato (Solanum tuberosum), which may contribute to the difference in desiccation resistance between two species[32,76]. It's worth noting that, in one study, CePIP2;1 was not detected in any of the four tested stages, i.e., freshly harvested, dried, rehydrated for 48 h, and sprouted tubers[23]. By contrast, it was quantified in all three stages of tuber development examined in this study, i.e., 1, 25, and 35 DAI (corresponding to freshly harvested tubers), which represent initiation, swelling, and maturation. One possible reason is that the protein abundance of CePIP2;1 in mature tubers is not high enough to be quantified by nanoLC-MS/MS, which is relatively less sensitive than 4D-PRM used in this study[30,46]. In fact, nanoLC-MS/MS-based proteomic analysis of 30 samples representing six tissues/stages only resulted in 2,257 distinct protein groups[23].

    Taken together, our results imply a key role of CePIP1;1, -2;1, and -2;8 in tuber water balance, however, the mechanism underlying needs to be further studied, e.g., posttranslational modifications, protein interaction patterns, and transcriptional regulators.

    To our knowledge, this is the first genome-wide characterization of PIP genes in tigernut, a representative Cyperaceae plant with oil-bearing tubers. Fourteen CePIP genes representing two phylogenetic groups or 12 orthogroups are relatively more than that present in two model plants rice and Arabidopsis, and gene expansion was mainly contributed by WGD and transposed/tandem duplications, some of which are lineage or even species-specific. Among these genes, CePIP1;1, -2;1, and -2;8 have evolved to be three dominant members that are constitutively expressed in most tissues, including leaf and tuber. Transcription of these three dominant members in leaves are subjected to development and diurnal regulation, whereas in tubers, their mRNA and protein abundances are positively correlated with the moisture content during tuber development. Moreover, their plasma membrane-localization was confirmed by subcellular localization analysis, implying that they may function in the cell membrane. These findings shall not only provide valuable information for further uncovering the mechanism of tuber water balance but also lay a solid foundation for genetic improvement by regulating these key PIP members in tigernut.

    The authors confirm contribution to the paper as follows: study conception and design, supervision: Zou Z; analysis and interpretation of results: Zou Z, Zheng Y, Xiao Y, Liu H, Huang J, Zhao Y; draft manuscript preparation: Zou Z, Zhao Y. All authors reviewed the results and approved the final version of the manuscript.

    All the relevant data is available within the published article.

    This work was supported by the Hainan Province Science and Technology Special Fund (ZDYF2024XDNY171 and ZDYF2024XDNY156), China; the National Natural Science Foundation of China (32460342, 31971688 and 31700580), China; the Project of Sanya Yazhou Bay Science and Technology City (SCKJ-JYRC-2022-66), China. The funders had no role in study design, data collection and analysis, decision to publish, or preparation of the manuscript.

  • The authors declare that they have no conflict of interest.

  • Supplemental Table S1 The characteristics of OfIAA proteins in Osmanthus fragrans.
    Supplemental Table S2 Information on IAA genes in Arabidopsis thaliana and Oryza sativa.
    Supplemental Table S3 The amino acid sequences of AtIAA, OsIAA, and OfIAA proteins.
    Supplemental Table S4 The sequence of primers.
  • [1]

    Du M, Spalding EP, Gray WM. 2020. Rapid auxin-mediated cell expansion. Annual Review of Plant Biology 71:379−402

    doi: 10.1146/annurev-arplant-073019-025907

    CrossRef   Google Scholar

    [2]

    Mazur E, Kulik I, Hajný J, Friml J. 2020. Auxin canalization and vascular tissue formation by TIR1/AFB-mediated auxin signaling in Arabidopsis. New Phytologist 226:1375−83

    doi: 10.1111/nph.16446

    CrossRef   Google Scholar

    [3]

    Thelander M, Landberg K, Muller A, Cloarec G, Cunniffe N, et al. 2022. Apical dominance control by TAR-YUC-mediated auxin biosynthesis is a deep homology of land plants. Current Biology 32:3838−3846.e5

    doi: 10.1016/j.cub.2022.06.064

    CrossRef   Google Scholar

    [4]

    Guo L, Luo X, Li M, Joldersma D, Plunkert M, Liu Z. 2022. Mechanism of fertilization-induced auxin synthesis in the endosperm for seed and fruit development. Nature Communications 13:3985

    doi: 10.1038/s41467-022-31656-y

    CrossRef   Google Scholar

    [5]

    Goldental-Cohen S, Israeli A, Ori N, Yasuor H. 2017. Auxin response dynamics during wild-type and entire flower development in tomato. Plant and Cell Physiology 58:1661−72

    doi: 10.1093/pcp/pcx102

    CrossRef   Google Scholar

    [6]

    Walker JC, Key JL. 1982. Isolation of cloned cDNAs to auxin-responsive poly(A)+RNAs of elongating soybean hypocotyl. Proceedings of the National Academy of Sciences of the United States of America 79:7185−89

    doi: 10.1073/pnas.79.23.7185

    CrossRef   Google Scholar

    [7]

    Guan D, Hu X, Diao D, Wang F, Liu Y. 2019. Genome-wide analysis and identification of the Aux/IAA gene family in peach. International Journal of Molecular Sciences 20:4703

    doi: 10.3390/ijms20194703

    CrossRef   Google Scholar

    [8]

    Overvoorde PJ, Okushima Y, Alonso JM, Chan A, Chang C, et al. 2005. Functional genomic analysis of the AUXIN/INDOLE-3-ACETIC ACID gene family members in Arabidopsis thaliana. The Plant Cell 17:3282−300

    doi: 10.1105/tpc.105.036723

    CrossRef   Google Scholar

    [9]

    Kalluri UC, Difazio SP, Brunner AM, Tuskan GA. 2007. Genome-wide analysis of Aux/IAA and ARF gene families in Populus trichocarpa. BMC Plant Biology 7:59

    doi: 10.1186/1471-2229-7-59

    CrossRef   Google Scholar

    [10]

    Su Y, He H, Wang P, Ma Z, Mao J, et al. 2021. Genome-wide characterization and expression analyses of the auxin/indole-3-acetic acid (Aux/IAA) gene family in apple (Malus domestica). Gene 768:145302

    doi: 10.1016/j.gene.2020.145302

    CrossRef   Google Scholar

    [11]

    Hu W, Zuo J, Hou X, Yan Y, Wei Y, et al. 2015. The auxin response factor gene family in banana: genome-wide identification and expression analyses during development, ripening, and abiotic stress. Frontiers in Plant Science 6:742

    doi: 10.3389/fpls.2015.00742

    CrossRef   Google Scholar

    [12]

    Lakehal A, Chaabouni S, Cavel E, Le Hir R, Ranjan A, et al. 2019. A molecular framework for the control of adventitious rooting by TIR1/AFB2-Aux/IAA-dependent auxin signaling in Arabidopsis. Molecular Plant 12:1499−514

    doi: 10.1016/j.molp.2019.09.001

    CrossRef   Google Scholar

    [13]

    Fendrych M, Leung J, Friml J. 2016. TIR1/AFB-Aux/IAA auxin perception mediates rapid cell wall acidification and growth of Arabidopsis hypocotyls. eLife 5:e19048

    doi: 10.7554/eLife.19048

    CrossRef   Google Scholar

    [14]

    Ding Y, Zeng W, Wang X, Wang Y, Niu L, et al. 2019. Over-expression of peach PpIAA19 in tomato alters plant growth, parthenocarpy, and fruit shape. Journal of Plant Growth Regulation 38:103−12

    doi: 10.1007/s00344-018-9813-z

    CrossRef   Google Scholar

    [15]

    Xu C, Shen Y, He F, Fu X, Yu H, et al. 2019. Auxin-mediated Aux/IAA-ARF-HB signaling cascade regulates secondary xylem development in Populus. New Phytologist 222:752−67

    doi: 10.1111/nph.15658

    CrossRef   Google Scholar

    [16]

    Li N, Huang B, Tang N, Jian W, Zou J, et al. 2017. The MADS-Box Gene SlMBP21 regulates sepal size mediated by ethylene and auxin in tomato. Plant and Cell Physiology 58:2241−56

    doi: 10.1093/pcp/pcx158

    CrossRef   Google Scholar

    [17]

    Ke M, Gao Z, Chen J, Qiu Y, Zhang L, et al. 2018. Auxin controls circadian flower opening and closure in the waterlily. BMC Plant Biology 18:143

    doi: 10.1186/s12870-018-1357-7

    CrossRef   Google Scholar

    [18]

    Jia Y, Chen C, Gong F, Jin W, Zhang H, et al. 2022. An Aux/IAA family member, RhIAA14, involved in ethylene-inhibited petal expansion in rose (Rosa hybrida). Genes 13:1041

    doi: 10.3390/genes13061041

    CrossRef   Google Scholar

    [19]

    Gao Y, Liu C, Li X, Xu H, Liang Y, et al. 2016. Transcriptome profiling of petal abscission zone and functional analysis of an Aux/IAA family gene RhIAA16 involved in petal shedding in rose. Frontiers in Plant Science 7:1375

    doi: 10.3389/fpls.2016.01375

    CrossRef   Google Scholar

    [20]

    Salehin M, Li B, Tang M, Katz E, Song L, et al. 2019. Auxin-sensitive Aux/IAA proteins mediate drought tolerance in Arabidopsis by regulating glucosinolate levels. Nature Communications 10:4021

    doi: 10.1038/s41467-019-12002-1

    CrossRef   Google Scholar

    [21]

    Wang Q, Shi H, Huang R, Ye R, Luo Y, et al. 2021. AIR12 confers cold tolerance through regulation of the CBF cold response pathway and ascorbate homeostasis. Plant, Cell & Environment 44:1522−33

    doi: 10.1111/pce.14020

    CrossRef   Google Scholar

    [22]

    Zhang A, Yang X, Lu J, Song F, Sun J, et al. 2021. OsIAA20, an Aux/IAA protein, mediates abiotic stress tolerance in rice through an ABA pathway. Plant Science 308:110903

    doi: 10.1016/j.plantsci.2021.110903

    CrossRef   Google Scholar

    [23]

    Jung H, Lee DK, Choi YD, Kim JK. 2015. OsIAA6, a member of the rice Aux/IAA gene family, is involved in drought tolerance and tiller outgrowth. Plant Science 236:304−12

    doi: 10.1016/j.plantsci.2015.04.018

    CrossRef   Google Scholar

    [24]

    Huang D, Wang Q, Duan D, Dong Q, Zhao S, et al. 2019. Overexpression of MdIAA9 confers high tolerance to osmotic stress in transgenic tobacco. PeerJ 7:e7935

    doi: 10.7717/peerj.7935

    CrossRef   Google Scholar

    [25]

    Jain M, Kaur N, Garg R, Thakur JK, Tyagi AK, et al. 2006. Structure and expression analysis of early auxin-responsive Aux/IAA gene family in rice (Oryza sativa). Functional & Integrative Genomics 6:47−59

    doi: 10.1007/s10142-005-0005-0

    CrossRef   Google Scholar

    [26]

    Jiang L, Li Z, Yu X, Liu C. 2021. Bioinformatics analysis of Aux/IAA gene family in maize. Agronomy Journal 113:932−42

    doi: 10.1002/agj2.20594

    CrossRef   Google Scholar

    [27]

    Liu R, Guo Z, Lu S. 2021. Genome-wide identification and expression analysis of the Aux/IAA and Auxin Response Factor gene family in Medicago truncatula. International Journal of Molecular Sciences 22:10494

    doi: 10.3390/ijms221910494

    CrossRef   Google Scholar

    [28]

    Weijers D, Wagner D. 2016. Transcriptional responses to the auxin hormone. Annual Review of Plant Biology 67:539−74

    doi: 10.1146/annurev-arplant-043015-112122

    CrossRef   Google Scholar

    [29]

    Dharmasiri N, Dharmasiri S, Estelle M. 2005. The F-box protein TIR1 is an auxin receptor. Nature 435:441−45

    doi: 10.1038/nature03543

    CrossRef   Google Scholar

    [30]

    Müllender M, Varrelmann M, Savenkov EI, Liebe S. 2021. Manipulation of auxin signalling by plant viruses. Molecular Plant Pathology 22:1449−58

    doi: 10.1111/mpp.13122

    CrossRef   Google Scholar

    [31]

    Wei S, Chen Y, Hou J, Yang Y, Yin T. 2021. Aux/IAA and ARF gene families in Salix suchowensis: identification, evolution, and dynamic transcriptome profiling during the plant growth process. Frontiers in Plant Science 12:666310

    doi: 10.3389/fpls.2021.666310

    CrossRef   Google Scholar

    [32]

    Luo J, Zhou JJ, Zhang JZ. 2018. Aux/IAA gene family in plants: molecular structure, regulation, and function. International Journal of Molecular Sciences 19:259

    doi: 10.3390/ijms19010259

    CrossRef   Google Scholar

    [33]

    Shi Q, Zhang Y, To VT, Shi J, Zhang D, et al. 2020. Genome-wide characterization and expression analyses of the auxin/indole-3-acetic acid (Aux/IAA) gene family in barley (Hordeum vulgare L.). Scientific Reports 10:10242

    doi: 10.1038/s41598-020-66860-7

    CrossRef   Google Scholar

    [34]

    Waseem M, Ahmad F, Habib S, Li Z. 2018. Genome-wide identification of the auxin/indole-3-acetic acid (Aux/IAA) gene family in pepper, its characterisation, and comprehensive expression profiling under environmental and phytohormones stress. Scientific Reports 8:12008

    doi: 10.1038/s41598-018-30468-9

    CrossRef   Google Scholar

    [35]

    Song S, Hao L, Zhao P, Xu Y, Zhong N, et al. 2019. Genome-wide identification, expression profiling and evolutionary analysis of Auxin Response Factor gene family in potato (Solanum tuberosum Group Phureja). Scientific Reports 9:1755

    doi: 10.1038/s41598-018-37923-7

    CrossRef   Google Scholar

    [36]

    Piya S, Shrestha SK, Binder B, Stewart CN Jr, Hewezi T. 2014. Protein-protein interaction and gene co-expression maps of ARFs and Aux/IAAs in Arabidopsis. Frontiers in Plant Science 5:744

    doi: 10.3389/fpls.2014.00744

    CrossRef   Google Scholar

    [37]

    Ye Y, Cao S, Shen L, Wang Y, Zhong S, et al. 2022. Comparative transcriptome analysis of CCCH family in roles of flower opening and abiotic stress in Osmanthus fragrans. International Journal of Molecular Sciences 23:15363

    doi: 10.3390/ijms232315363

    CrossRef   Google Scholar

    [38]

    Dong B, Wang Q, Zhou D, Wang Y, Miao Y, et al. 2024. Abiotic stress treatment reveals expansin like A gene OfEXLA1 improving salt and drought tolerance of Osmanthus fragrans by responding to abscisic acid. Horticultural Plant Journal 10:573−85

    doi: 10.1016/j.hpj.2022.11.007

    CrossRef   Google Scholar

    [39]

    Tamura K, Stecher G, Kumar S. 2021. MEGA11: Molecular Evolutionary Genetics Analysis Version 11. Molecular Biology and Evolution 38:3022−27

    doi: 10.1093/molbev/msab120

    CrossRef   Google Scholar

    [40]

    Chen C, Chen H, Zhang Y, Thomas HR, Frank MH, et al. 2020. TBtools: an integrative toolkit developed for interactive analyses of big biological data. Molecular Plant 13:1194−202

    doi: 10.1016/j.molp.2020.06.009

    CrossRef   Google Scholar

    [41]

    Yang Y, Miao Y, Zhong S, Fang Q, Wang Y, et al. 2022. Genome-wide identification and expression analysis of XTH gene family during flower-opening stages in Osmanthus fragrans. Plants 11:1015

    doi: 10.3390/plants11081015

    CrossRef   Google Scholar

  • Cite this article

    Cao S, Ye Y, Zheng Z, Zhong S, Wang Y, et al. 2024. Aux/IAA gene family identification and analysis reveals roles in flower opening and abiotic stress response in Osmanthus fragrans. Ornamental Plant Research 4: e027 doi: 10.48130/opr-0024-0025
    Cao S, Ye Y, Zheng Z, Zhong S, Wang Y, et al. 2024. Aux/IAA gene family identification and analysis reveals roles in flower opening and abiotic stress response in Osmanthus fragrans. Ornamental Plant Research 4: e027 doi: 10.48130/opr-0024-0025

Figures(9)  /  Tables(3)

Article Metrics

Article views(2405) PDF downloads(296)

ARTICLE   Open Access    

Aux/IAA gene family identification and analysis reveals roles in flower opening and abiotic stress response in Osmanthus fragrans

Ornamental Plant Research  4 Article number: e027  (2024)  |  Cite this article

Abstract: The Aux/IAA (auxin/indole-3-acetic acid) gene family plays a crucial role in regulating various aspects of plant growth, development, and abiotic tolerance in the auxin transduction pathway. However, limited information is available about the Aux/IAA family in Osmanthus fragrans. This study aims to comprehensively analyze the Aux/IAA gene family on a genome-wide scale. A total of 39 OfIAA genes containing four conserved domains were identified. These genes were unevenly distributed across 19 chromosomes and grouped into six clades based on phylogenetic analysis, showing conserved gene structure and motif composition. The expansion of OfIAA genes in the O. fragrans genome was partially due to segmental duplication events. Analysis of cis-regulatory elements (CREs) in the promoters of the OfIAA genes revealed the presence of many CREs related to different hormones and abiotic stresses. Through transcriptome and expression pattern analysis, we found that the majority of OfIAA genes were expressed in the stem tissue. Moreover, during the flower opening process, 18 OfIAA genes exhibited differential expression, while three and 11 OfIAA genes, respectively, showed altered expression patterns after salt and drought treatments. These differentially expressed genes are likely involved in the regulation of flower opening and abiotic stress response. This study provides new insights into the potential roles of OfIAAs and contributes to a better understanding of the regulatory mechanisms of flower opening and abiotic stress tolerance in O. fragrans.

    • Auxin, an important plant hormone, plays crucial roles in various aspects of plant growth and development processes, such as cell division, expansion, and differentiation[1], vascular tissue formation[2], apical dominance[3], and flower and fruit development[4,5]. During the initial stages of auxin signal transduction, specific gene families, including Auxin/IAA, GH3 (Gretchen Hagen3), and SAUR (small auxin up RNA), exhibit high responsiveness to fluctuations in auxin levels. The Auxin/IAA gene family was initially identified by Walker & Key in soybean[6]. This family consists of members with four highly conserved domains: domains I, II, III, and IV. Each domain has a distinct function: domain I is responsible for transcriptional repression, domain II is essential for auxin signal transduction, and domains III and IV enable proteins to form homo- and heterodimers. Aux/IAA proteins regulate auxin-responsive genes by interacting with ARFs (Auxin Response Factors), rather than directly binding to AuxREs (auxin-responsive cis-elements). So far, the Aux/IAA gene family has been identified in various plant species. For example, there are 23 members in Prunus persica[7], 29 in Arabidopsis[8], 35 in Populus euphratica[9], 42 in Malus domestica[10], and 44 in Musa nana[11].

      Several studies have reported the crucial roles of Auxin/IAA family genes in various aspects of plant growth and development. In Arabidopsis, AtIAA6, 9, and 17 inhibit root initiation by interacting with AtARF6 and AtARF8[12]. The TIR1/AFB-Aux/IAA module regulates hypocotyl growth[13]. Similarly, PpIAA19, which is mainly expressed in peach (Prunus persica) fruit, has been demonstrated to control lateral root number, stem elongation, parthenocarpy, and fruit shape[14]. In poplar (Populus tomentosa), PtIAA9 acts as a negative regulator of secondary xylem development and controls wood formation through the PtIAA9-PtARF5 module[15]. Additionally, the Auxin/IAA gene family significantly influences cell proliferation, and cell expansion, and plays a vital role in flower development and the opening process[16]. In waterlily (Nymphaeale), Auxin/IAA genes induce the constitutive flower opening and are involved in floral movement[17]. In Rosa hybrida, the suppression of RhIAA14 and RhIAA16 expression leads to reduced flower cell expansion and smaller petals[18,19]. Moreover, accumulating evidence suggests that the Aux/IAA gene family also participates in plant stress responses and defense. In Arabidopsis, the auxin-sensitive genes AtIAA5, 6, and 19 have been found to enhance drought tolerance by regulating glucosinolate levels, which protect plants from herbivory and pathogen attack[20]. In Medicago falcata, MfAIR12 (Auxin induced in root culture 12) contributes to cold tolerance by regulating the expression level of cold-responsive genes and ascorbate synthesis and redox state[21]. In rice, OsIAA20 plays an important role in drought and salt stress responses through the ABA-dependent pathway[22]. On the other hand, OsIAA6 enhances drought tolerance by regulating the expression of auxin biosynthesis genes[23]. Additionally, the overexpression of MdIAA9 from cultivated apple (Malus × domestica) significantly improved osmotic stress tolerance in transgenic tobacco (Nicotiana tabacum L.)[24].

      Osmanthus fragrans, one of the ten most traditional flowers in China, is widely cultivated as a garden tree in many countries because of its remarkable ornamental value and delightful fragrance. Although genome-wide analysis of the Aux/IAA gene family has been performed in various species, the identification, characterization, and functional analysis of Aux/IAA family genes in O. fragrans have remained unexplored. In this study, a thorough genome-wide identification of Aux/IAA family members in the O. fragrans genome was conducted. Subsequently, their chromosomal locations, domains, phylogenetic relationships, gene duplications, gene structures, motifs, and cis-regulatory elements (CREs) were analyzed. Additionally, transcriptome sequencing and quantitative real-time PCR (qRT-PCR) were used to investigate the involvement of Aux/IAA family genes in regulating flower opening processes and responding to abiotic stress in O. fragrans. The aim of these results is to provide a comprehensive understanding of the Auxin/IAA gene family in O. fragrans.

    • A total of 44 potential Aux/IAA gene sequences were identified in the O. fragrans genome. Five sequences were excluded from further analysis due to the presence of open reading frame (ORF). Subsequently, 39 OfAux/IAA (OfIAA) genes with a typical Aux/IAA domain were obtained and designated as OfIAA1 to OfIAA39. More details about these 39 OfIAAs are presented in Supplemental Table S1, including protein length, MW (molecular weight), pI (isoelectric point), instability index, aliphatic index, grand average of hydropathicity, and subcellular localization prediction. The identified OfIAAs have protein lengths ranging from 142 amino acids (OfIAA14) to 392 amino acids (OfIAA1), with MWs ranging from 15.5 to 42.5 kDa. The pI of the 39 OfIAA genes varies from 4.94 (OfIAA14) to 9.37 (OfIAA20). Additionally, chromosome mapping revealed that the 39 OfIAA genes are unevenly distributed across 19 chromosomes. Chromosome 4 contains the largest number of OfIAA genes (five members) (Fig. 1).
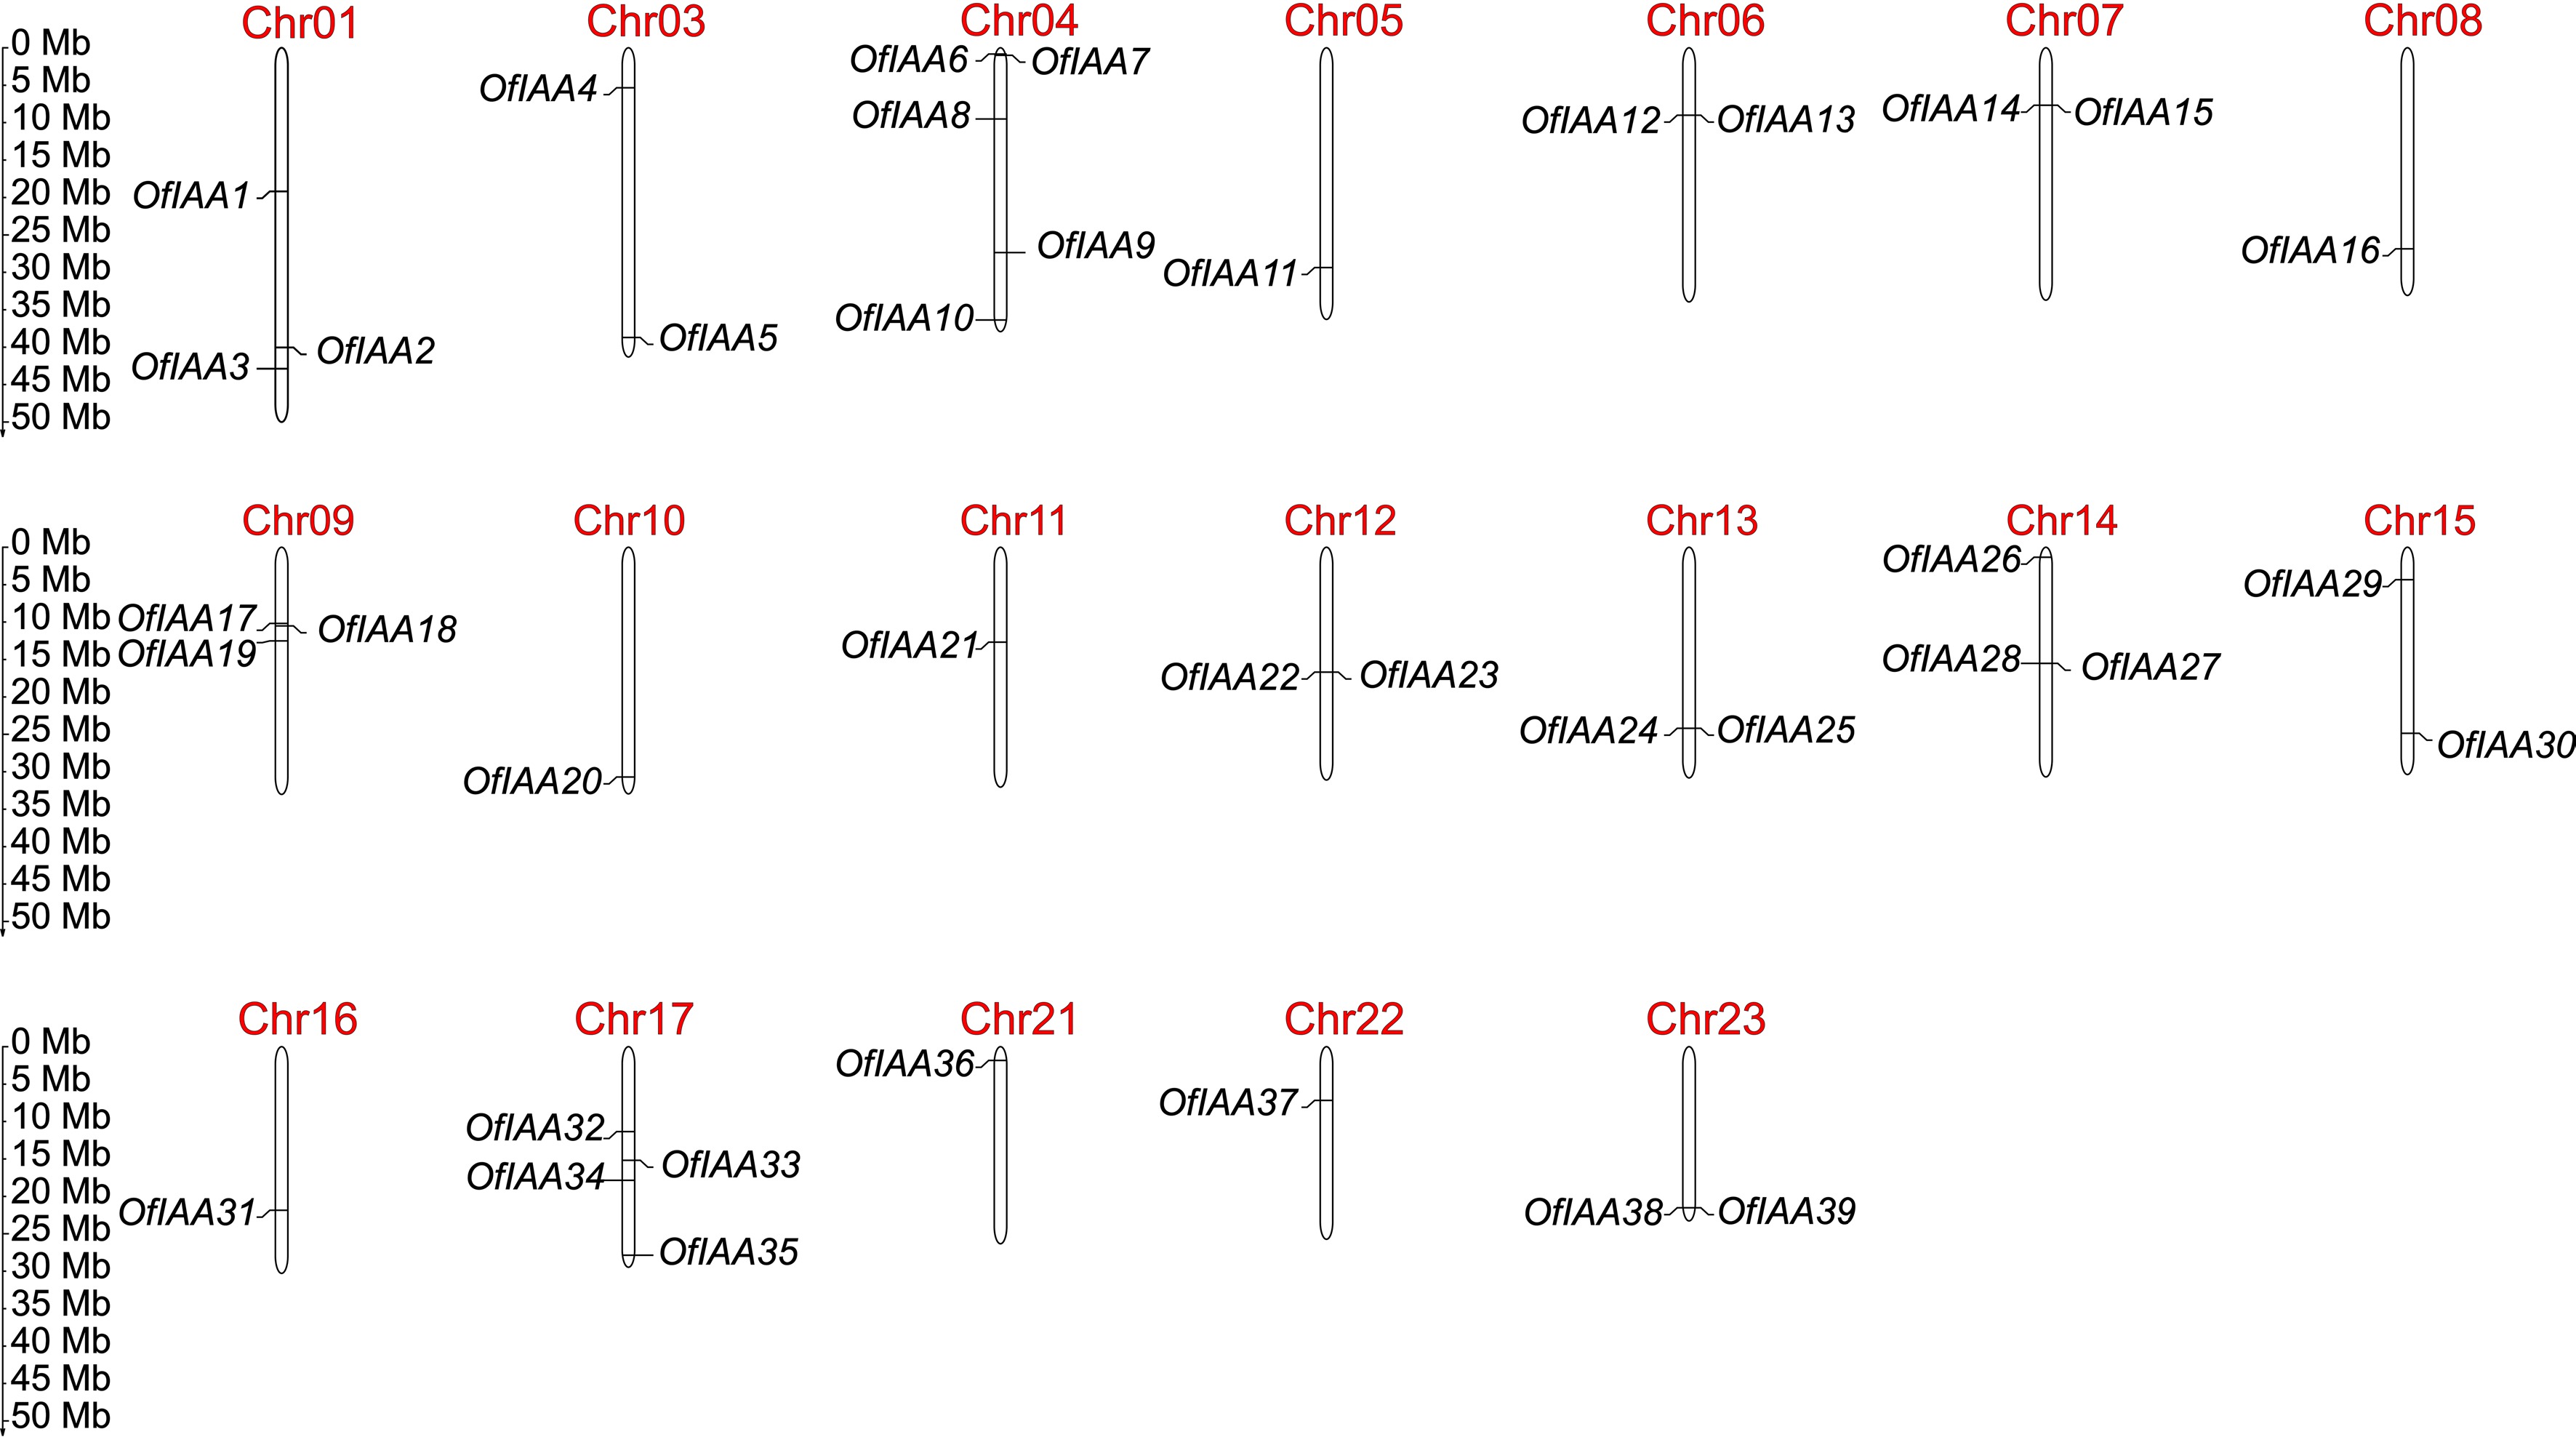
      Figure 1. 

      Chromosomal distribution of OfIAA genes in O. fragrans.

    • Based on the phylogenetic analysis, the IAA proteins (39 members) were grouped into two major clades (clades A and B), similar to Arabidopsis and Oryza sativa. Clade A consisted of 27 OfIAA genes and clade B consisted of 12 (Fig. 2). Synteny analysis of the OfIAA genes was conducted and 34 pairs of segmental duplications were identified distributed across 19 chromosomes (Fig. 3a). The divergence time indicated that the duplications of the OfIAA genes commenced 75.90 million years ago (Mya) and continued until 0.56 Mya. All OfIAA genes evolved under purifying selection (Ka/Ks < 1) (Table 1). In addition, the synteny analyses revealed that 20 and five pairs of OfIAA homologous genes were identified in Arabidopsis and rice, respectively (Fig. 3b).
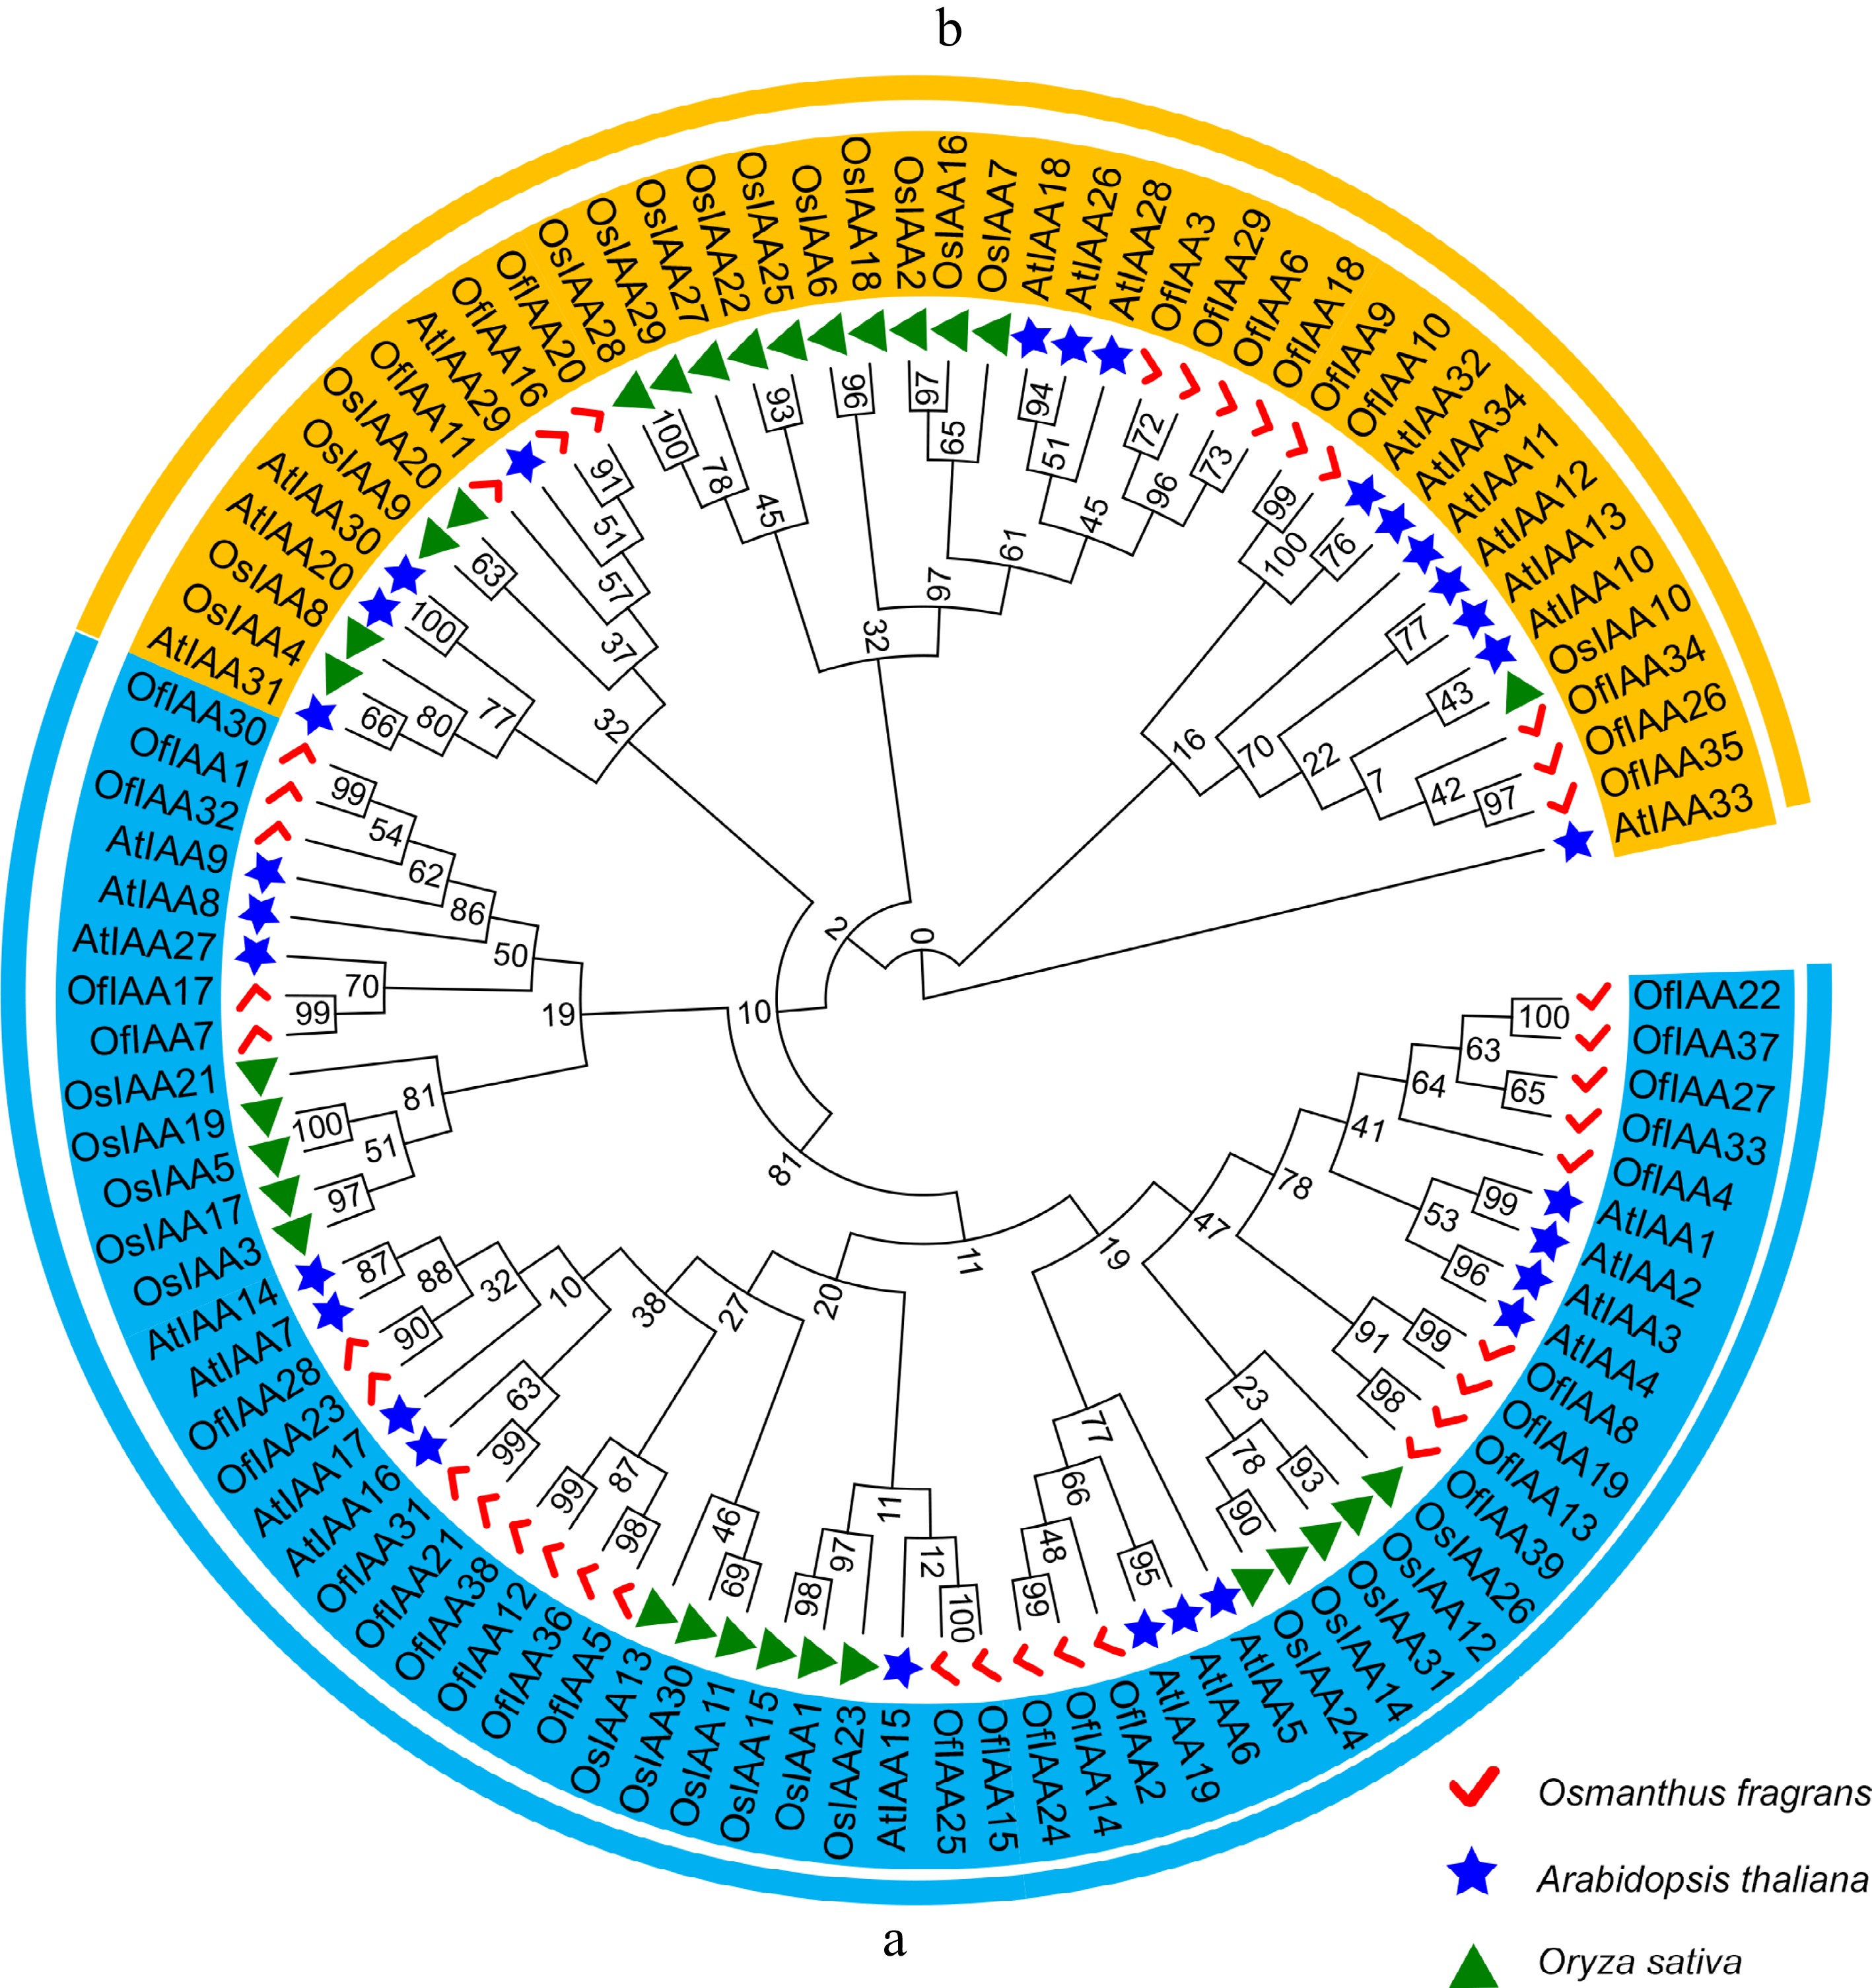
      Figure 2. 

      Phylogenetic relationship of the IAAs among O. fragrans, A. thaliana, and O. sativa. The IAA proteins in O. fragrans are represented by the red ticks, the IAA proteins in A. thaliana are represented by the blue stars, the IAA proteins in O. sativa are represented by the green triangles. Two main groups (a) and (b) were displayed by colored arcs.
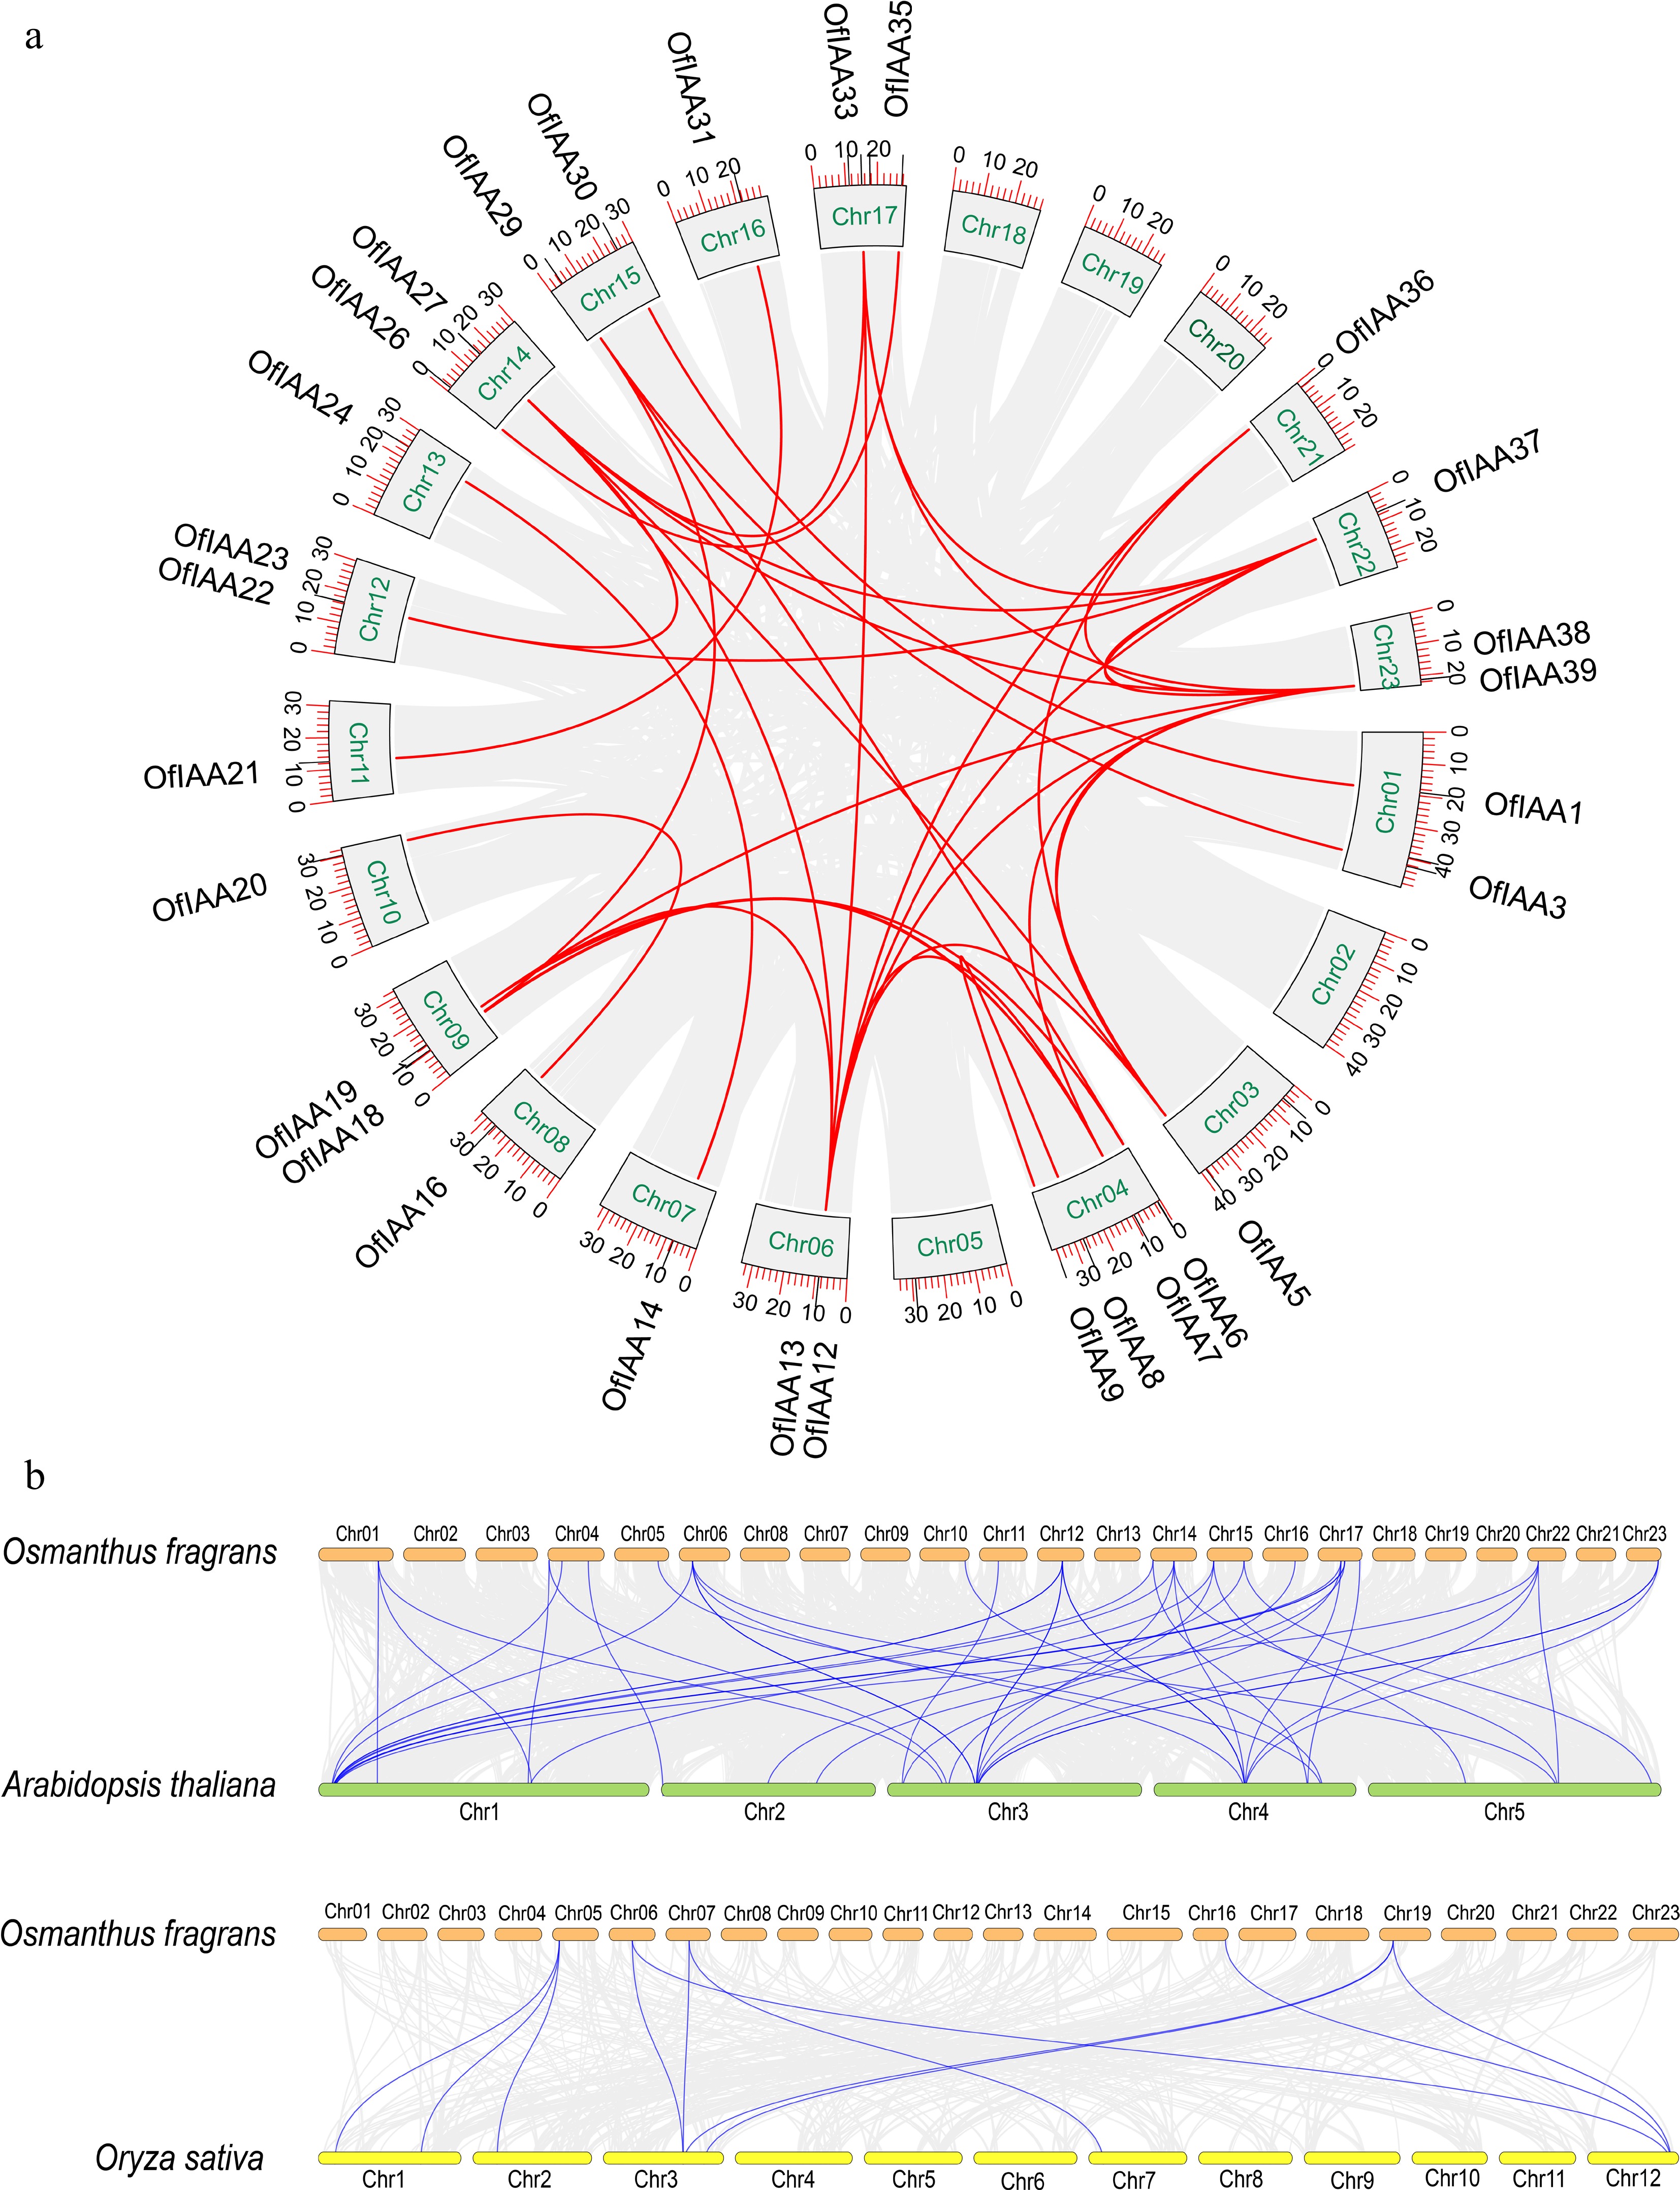
      Figure 3. 

      Synteny analysis of the IAA genes. (a) Synteny analysis of the OfIAA genes in O. fragrans. (b) Synteny analysis of the OfIAA genes between A. thaliana and O. sativa.

      Table 1.  Ka/Ks analysis and estimated divergence time of OfIAA genes.

      Duplicated gene pairs Ka Ks Ka/Ks Divergence time
      (Mya)
      OfIAA1 & OfIAA30 0.07 0.25 0.29 8.46
      OfIAA3 & OfIAA29 0.18 0.45 0.41 15.02
      OfIAA5 & OfIAA12 0.22 0.92 0.24 30.57
      OfIAA5 & OfIAA28 0.22 1.67 0.13 55.65
      OfIAA5 & OfIAA36 0.04 0.22 0.21 7.27
      OfIAA5 & OfIAA38 0.18 0.73 0.25 24.38
      OfIAA9 & OfIAA10 0.01 0.02 0.69 0.56
      OfIAA8 & OfIAA13 0.1 0.67 0.16 22.2
      OfIAA8 & OfIAA19 0.07 0.12 0.62 3.89
      OfIAA6 & OfIAA18 0.11 0.28 0.41 9.26
      OfIAA7 & OfIAA17 0.08 0.24 0.35 8.16
      OfIAA6 & OfIAA29 0.27 0.72 0.37 23.97
      OfIAA8 & OfIAA38 0.36 2.28 0.16 75.9
      OfIAA13 & OfIAA19 0.16 0.72 0.22 24.03
      OfIAA13 & OfIAA27 0.2 1.65 0.12 55.07
      OfIAA13 & OfIAA33 0.21 1.16 0.19 38.59
      OfIAA12 & OfIAA36 0.21 0.76 0.28 25.36
      OfIAA13 & OfIAA37 0.25 1.7 0.15 56.59
      OfIAA12 & OfIAA38 0.1 0.2 0.48 6.59
      OfIAA14 & OfIAA24 0.07 0.19 0.39 6.34
      OfIAA15 & OfIAA25 0.09 0.28 0.3 9.44
      OfIAA16 & OfIAA20 0.18 0.43 0.43 14.39
      OfIAA18 & OfIAA29 0.3 0.97 0.31 32.19
      OfIAA21 & OfIAA31 0.07 0.19 0.35 6.36
      OfIAA22 & OfIAA27 0.14 0.52 0.27 17.18
      OfIAA23 & OfIAA28 0.07 0.75 0.1 24.89
      OfIAA23 & OfIAA28 0.07 0.75 0.1 24.89
      OfIAA22 & OfIAA37 0.06 0.23 0.27 7.69
      OfIAA26 & OfIAA35 0.07 0.24 0.3 8.15
      OfIAA27 & OfIAA33 0.07 0.25 0.27 8.41
      OfIAA27 & OfIAA37 0.12 0.72 0.17 24.12
      OfIAA33 & OfIAA37 0.14 0.86 0.16 28.59
      OfIAA36 & OfIAA38 0.17 0.67 0.26 22.23
      OfIAA37 & OfIAA39 0.22 1.48 0.15 49.41
      Ka, nonsynonymous; Ks, synonymous.

      Multiple alignments of the amino acid sequences of OfIAA proteins revealed that 35 OfIAA proteins contained all four typical conserved domains I, II, III, and IV. However, OfIAA12, 18, 26, and 32 lacked one of these domains (Fig. 4). Specifically, OfIAA32 lacked domain I, OfIAA18 and 26 lacked domain II, and OfIAA12 lacked domain IV. Nuclear localization signals (NLS) were identified at the end of domain IV in 16 OfIAA proteins. Additionally, gene structure analysis showed that the number of exons ranged from two to five (Fig. 5). Furthermore, five different motifs were identified in the 39 OfIAA proteins, and the majority of OfIAA proteins contained all five motifs, with motif 1 being conserved in all the OfIAA proteins (Fig. 5).
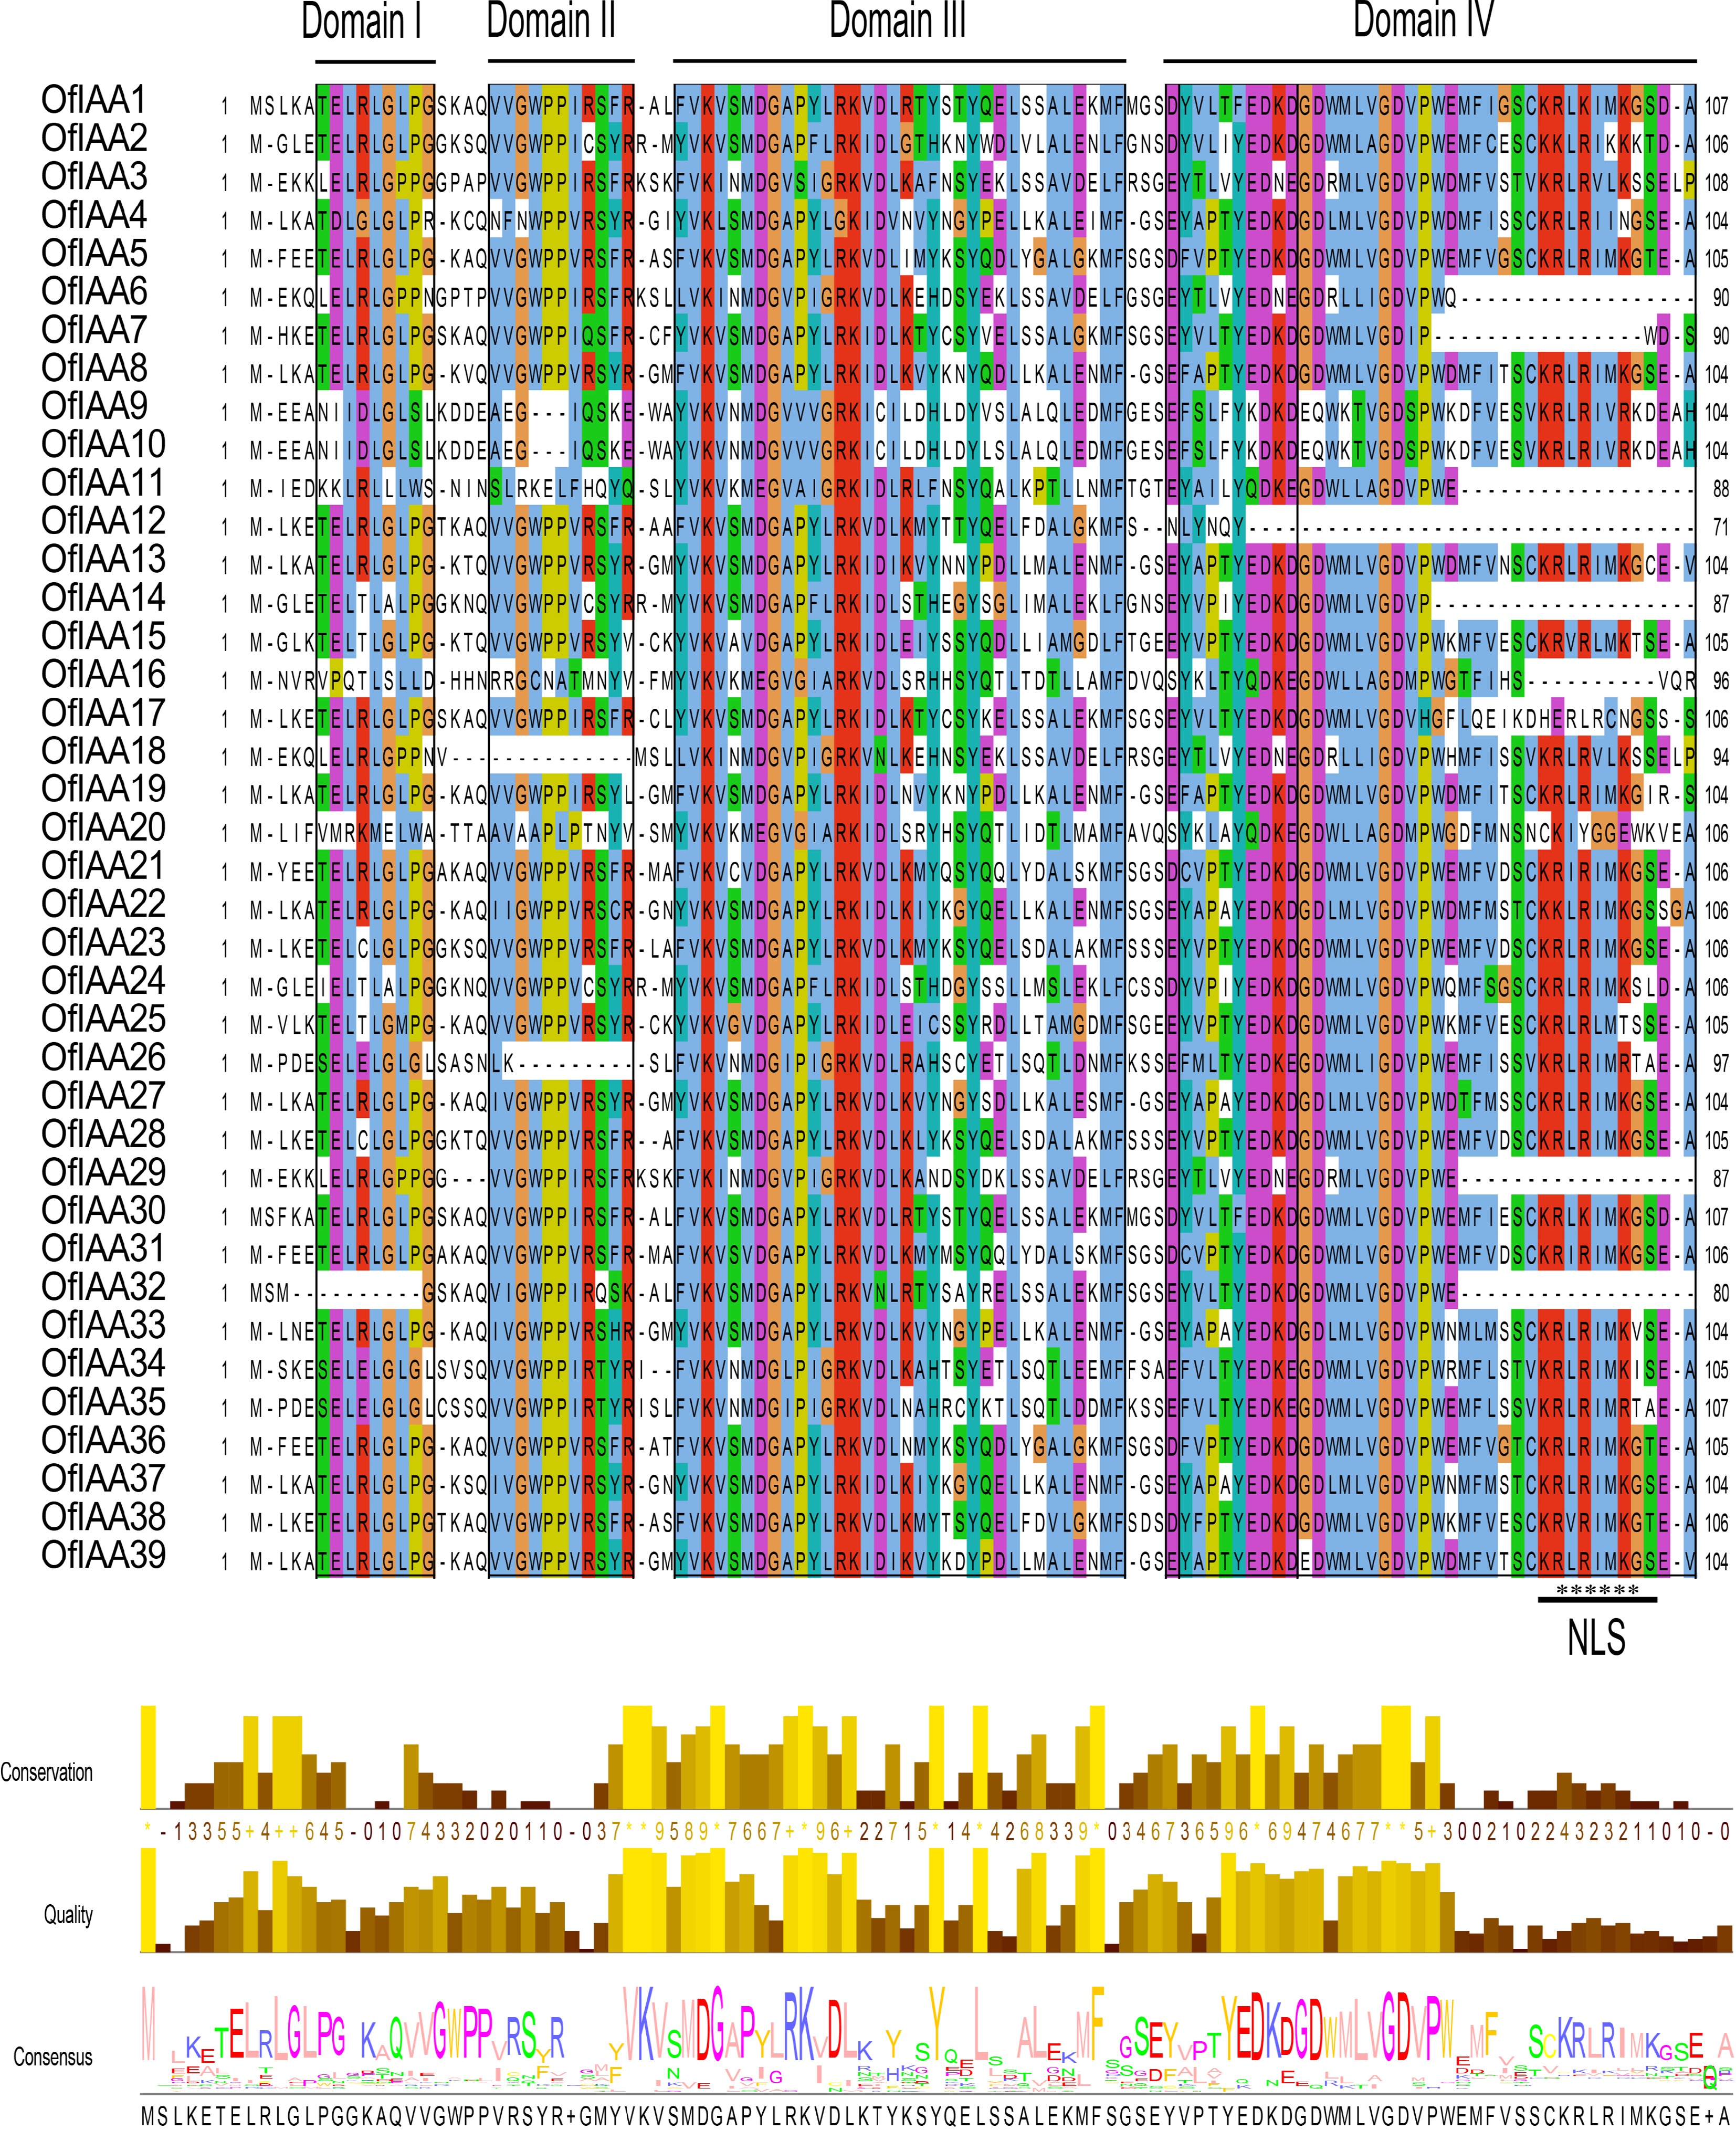
      Figure 4. 

      Multiple sequence alignment of the OfIAA proteins. The conserved domains (I, II, III, and IV) of the OfIAA gene family are underlined. Nuclear localization signals (NLS) are indicated with black asterisks. Bits indicate amino acid conservation at each position.
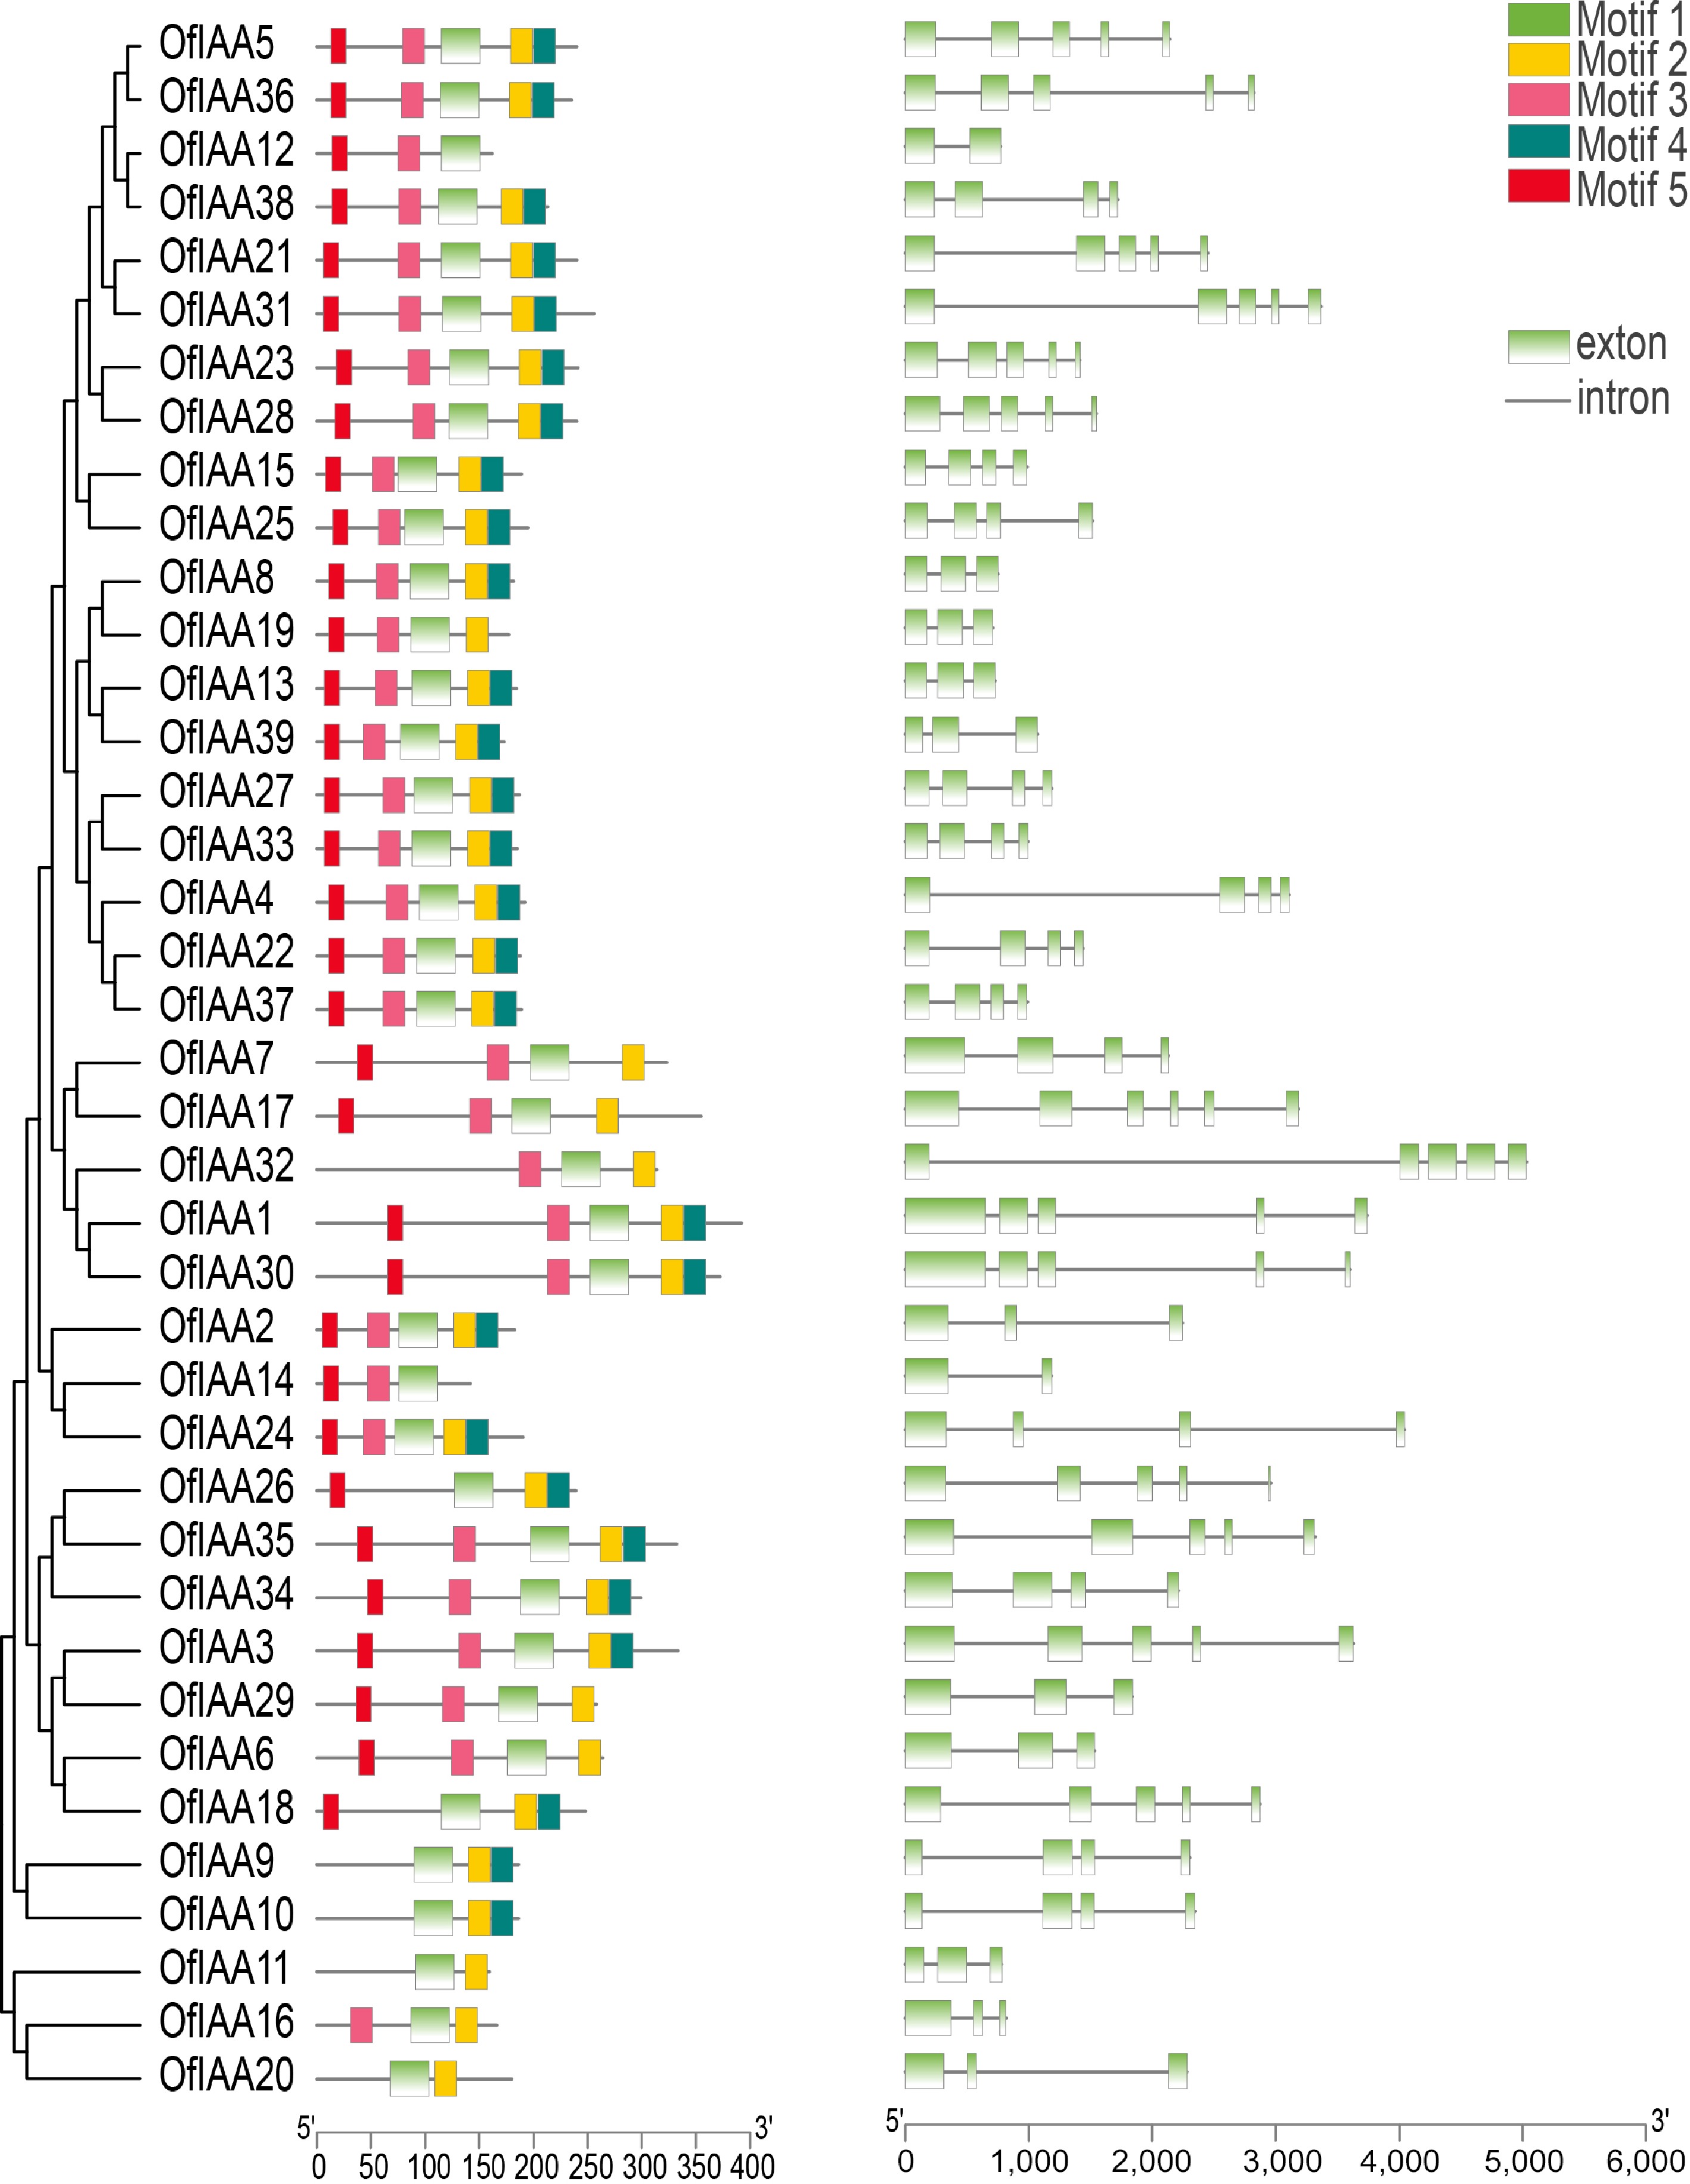
      Figure 5. 

      Motif and gene structure analysis of OfIAAs.

    • The 2,000 bp upstream promoter regions of 39 OfIAA genes were identified through CRE analysis (Fig. 6). A total of 11 types of CREs were identified, with the majority being associated with hormone responses, such as auxin, ABA (abscisic acid), GA (gibberellin), MeJA (methyl jasmonate), and SA (salicylic acid). In addition, a significant number of OfIAA promoters contained ABA-responsive elements (31 OfIAA genes), MeJA-responsive elements (26 OfIAA genes), and GA-responsive elements (23 OfIAA genes). Furthermore, the promoters of OfIAA genes related to defense and stress responsiveness, and low-temperature responsiveness were also identified.
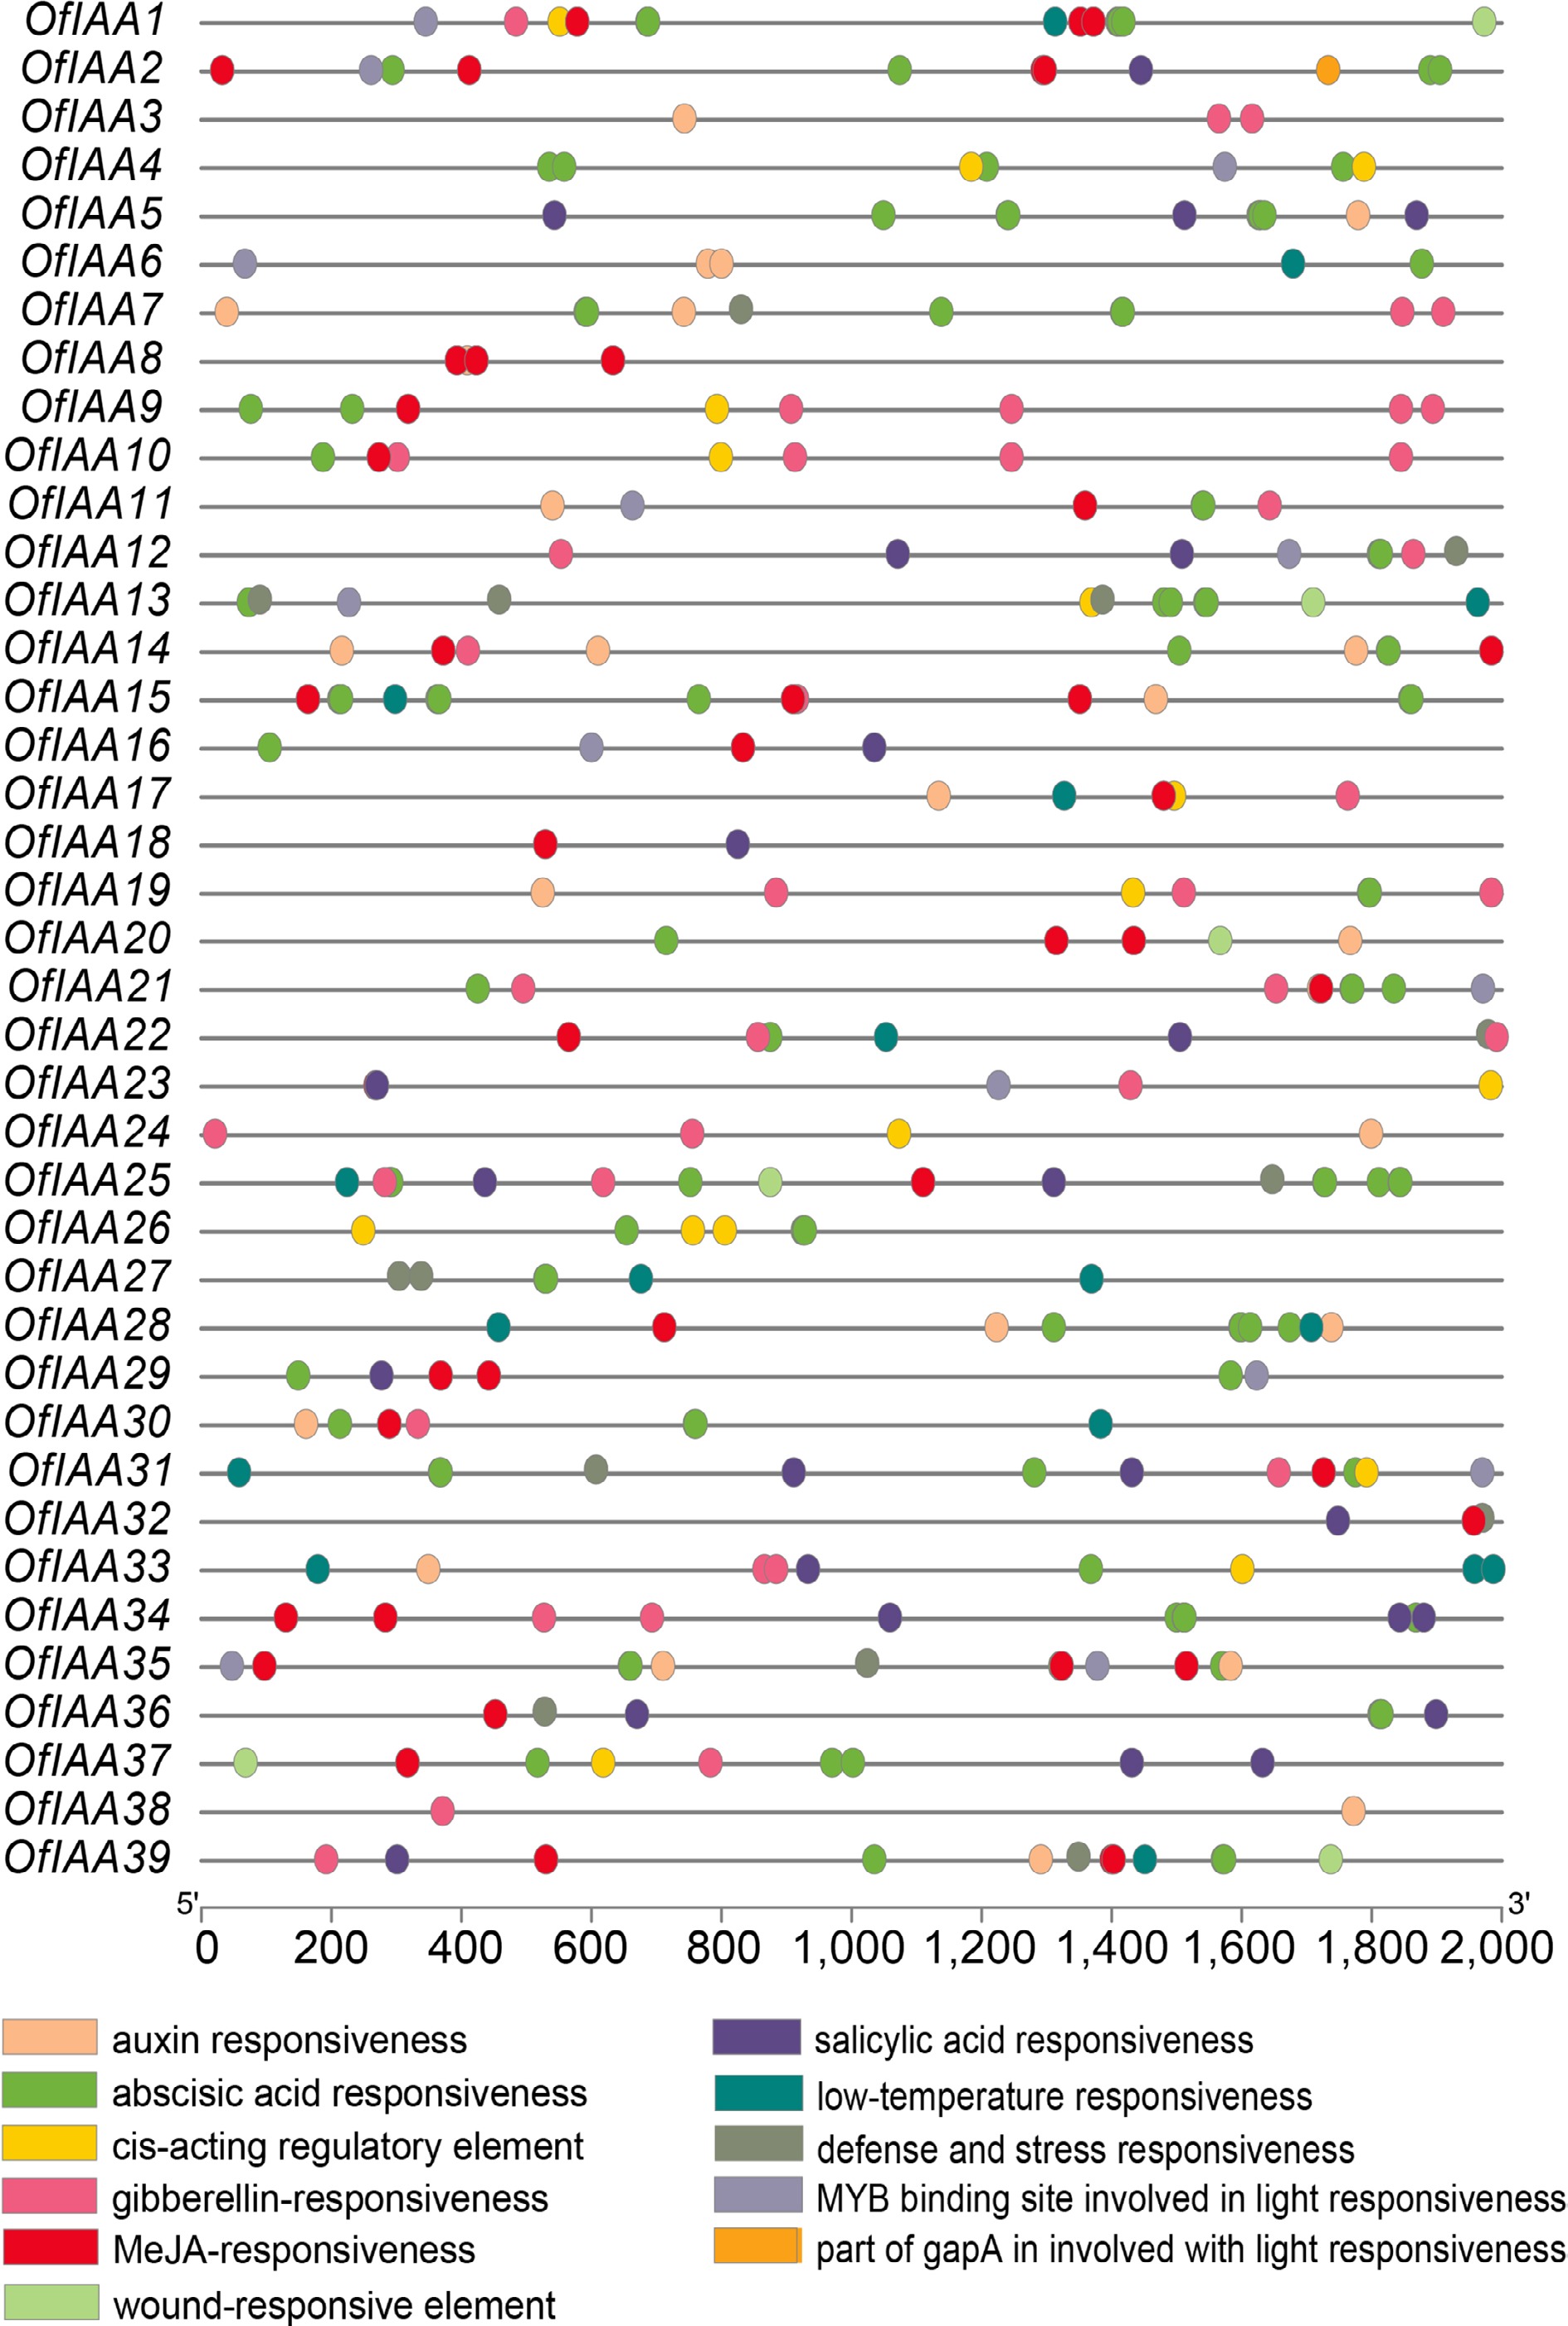
      Figure 6. 

      Cis-elements distribution of OfIAA genes.

    • To gain further insight into the expression patterns of the OfIAA genes in different tissues, transcriptome sequencing was performed. The expression profiles of the 39 OfIAA genes were examined in the six different tissues, including root, annual stem, perennial stem, young leaf, mature leaf, and flower (Fig. 7). The expression analysis revealed that the majority of the OfIAA genes exhibited broad expression patterns in all six tissues, except for OfIAA4, 9, and 10. Of particular interest was the predominant expression of OfIAA6 in the root, while OfIAA7, 16, 20, 28, and 30 exhibited high expression levels in the annual stem. Additionally, OfIAA29 and 32 had high expression levels in the perennial stem, and OfIAA14 was overrepresented in the young leaf. Furthermore, the transcriptome analysis revealed that OfIAA24 and 25 were predominantly expressed in the flower (Fig. 7).
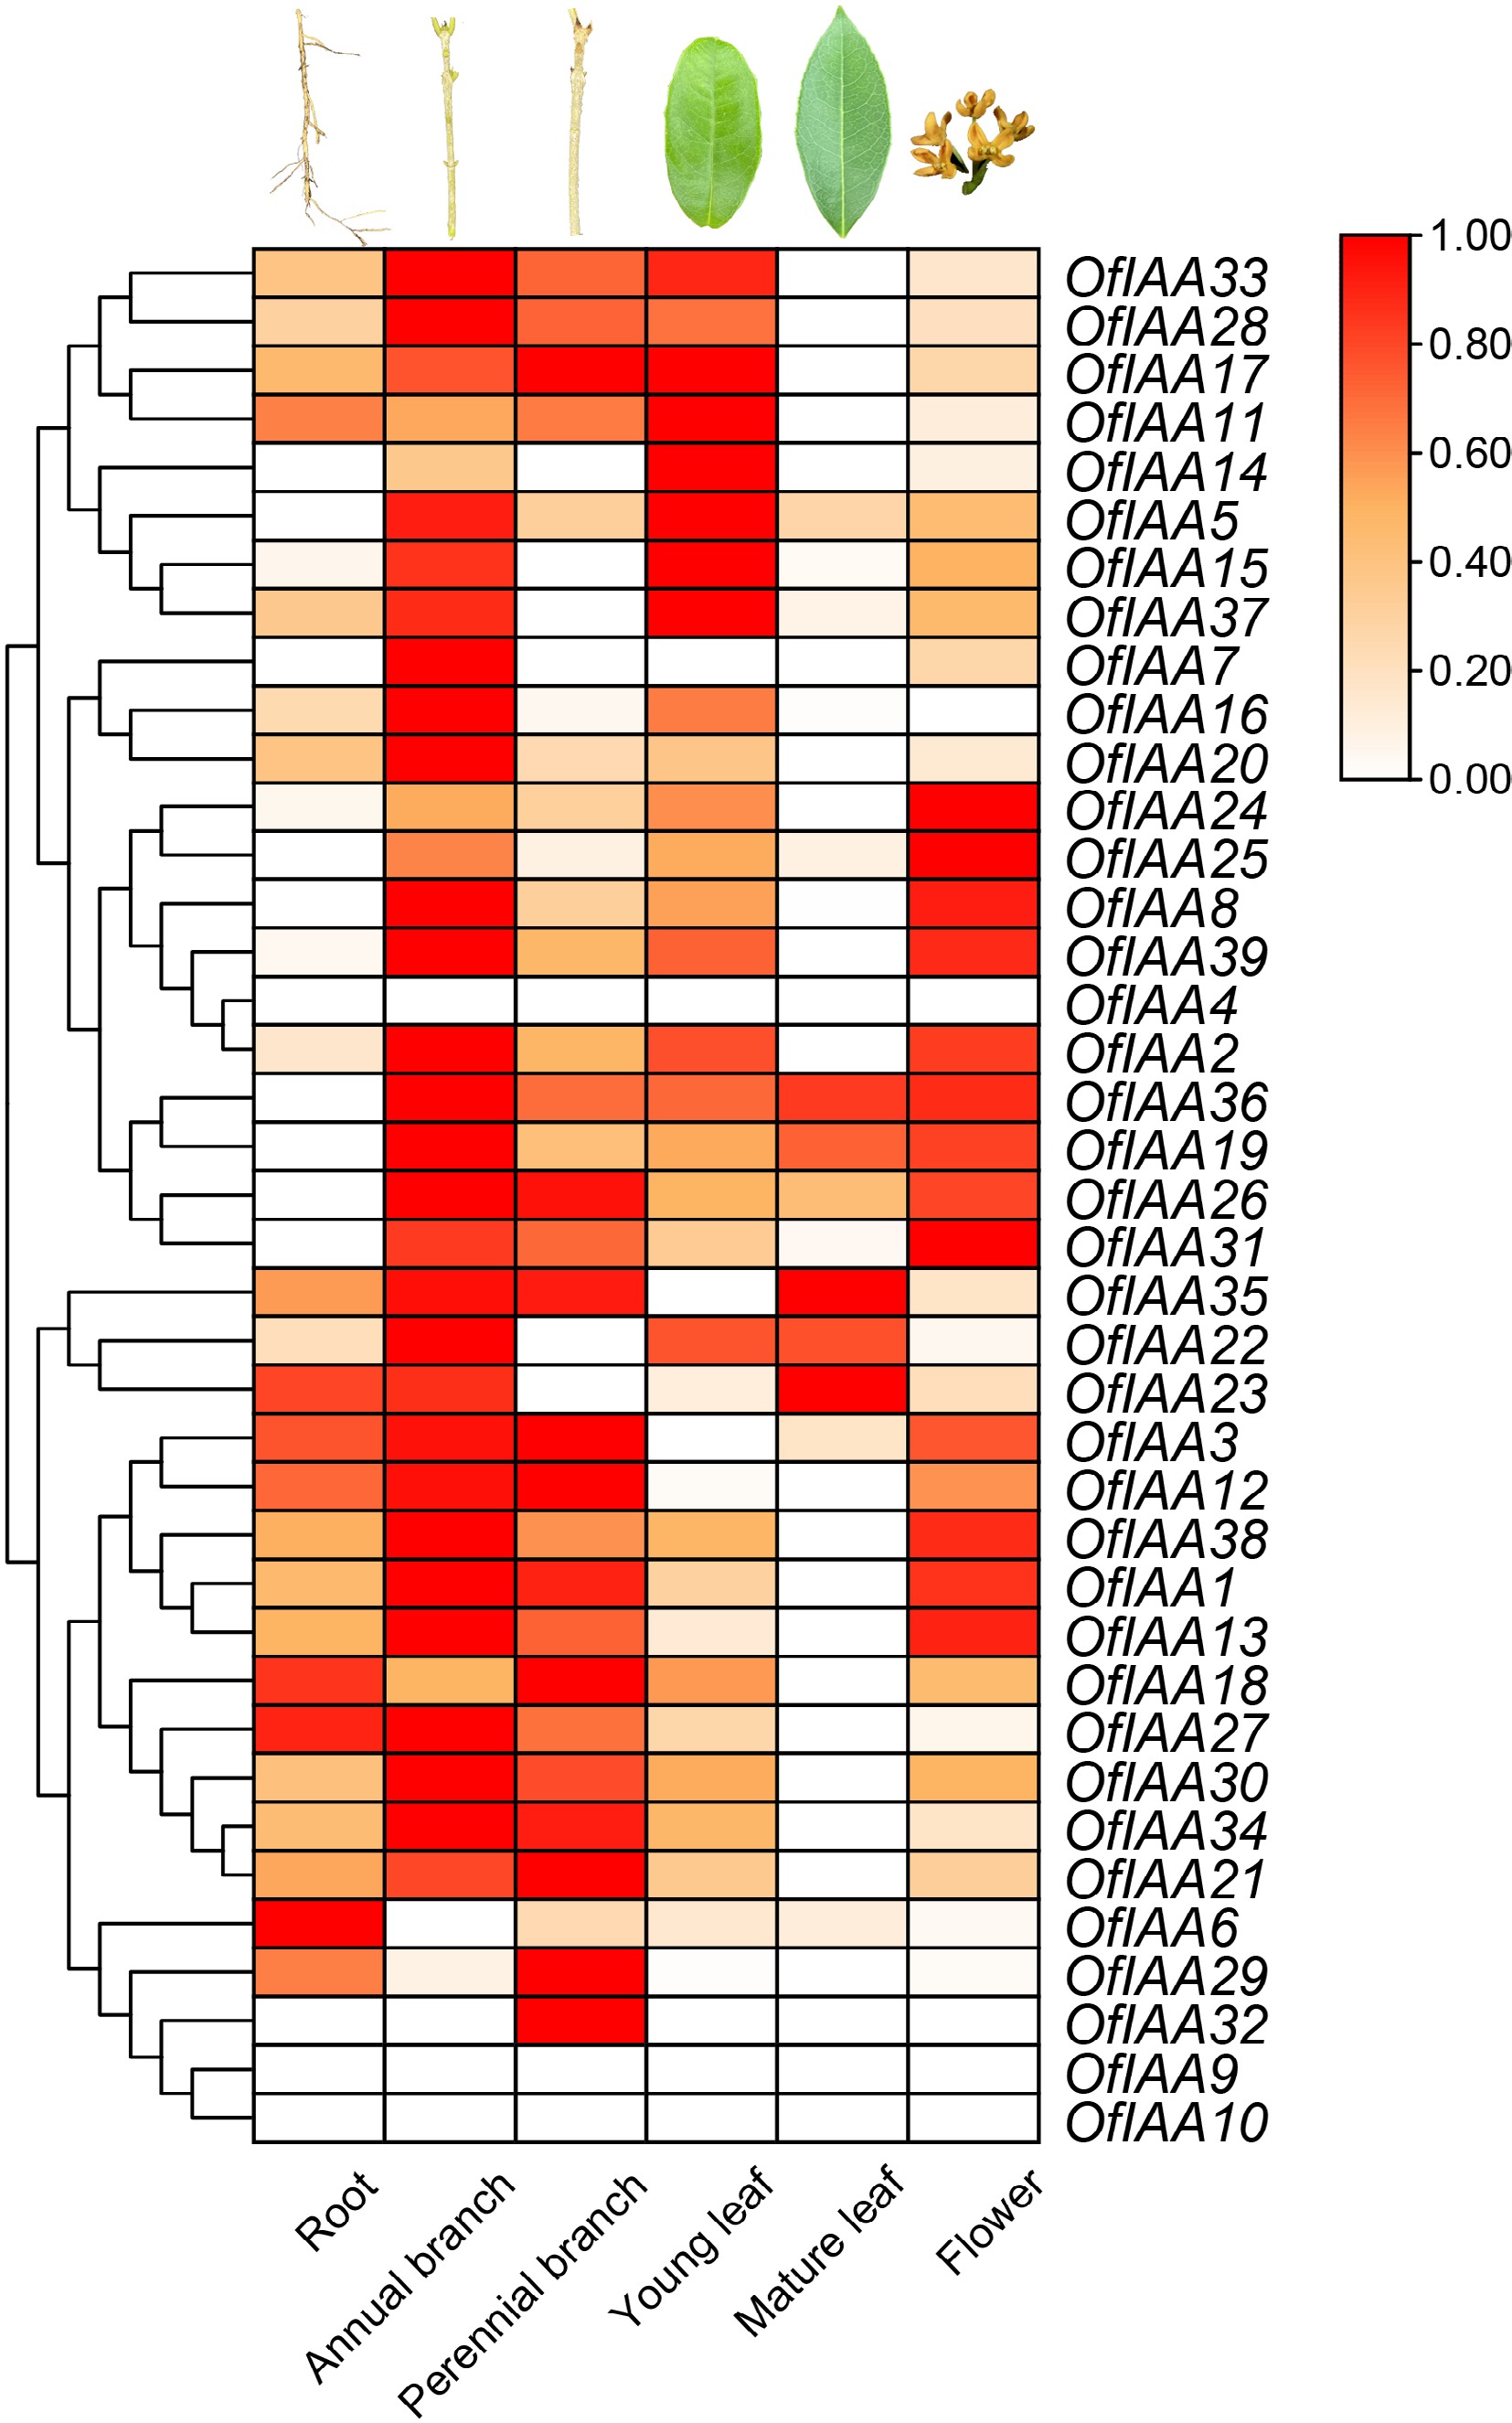
      Figure 7. 

      Expression analysis of OfIAAs in different tissues.

    • In O. fragrans, the scent release is significantly influenced by the flower opening process, with the transformation from the S1 to S2 stages playing a particularly crucial role. To investigate the potential involvement of OfIAA genes in this process, a comprehensive analysis of their expression profiles was conducted via RNA-seq in flower buds at the S1 and S2 stages (Table 2). Through analysis, a total of 18 DEGs (differentially expressed genes) were identified from the S1 to S2 stage (Table 2). Among these DEGs, 16 genes were upregulated, including OfIAA2, 8, 11, 12, 13, 14, 15, 20, 25, 27, 28, 33, 36, 37, 38, and 39, while two genes, namely OfIAA6 and 29, were downregulated. Subsequently, the expression patterns of all DEGs were validated in flower buds at the S1 and S2 stage using qRT‒PCR (Fig. 8). The qRT-PCR results were consistent with the expression trends observed in the transcriptomic data. These results suggest that these differentially expressed OfIAA genes may have a potential role in regulating the flowering process.

      Table 2.  Identification of DEGs in the flower opening processes of O. fragrans.

      Gene Expression FoldChange Padj value
      S1 S2
      OfIAA2 0.00 22.82 7.00 6.69 × 10⁻⁷
      OfIAA6 1,121.83 435.01 −1.37 3.97 × 10⁻²⁹
      OfIAA8 28.68 789.65 4.79 1.93 × 10−99
      OfIAA11 5.05 24.49 2.26 1.20 × 10⁻³
      OfIAA12 13.62 145.78 3.42 2.75 × 10⁻²¹
      OfIAA13 18.45 60.19 1.70 8.14 × 10⁻⁵
      OfIAA14 0.32 7.61 4.45 9.80 × 10⁻³
      OfIAA19 92.29 490.40 2.41 1.30 × 10−41
      OfIAA20 0.30 6.22 4.15 4.90 × 10⁻²
      OfIAA25 25.79 131.80 2.36 1.76 × 10⁻¹⁵
      OfIAA27 4.82 23.02 2.25 5.20 × 10⁻³
      OfIAA28 3.73 173.53 5.60 5.41 × 10⁻²⁸
      OfIAA29 1,136.52 235.71 −2.27 4.41 × 10−60
      OfIAA33 4.68 33.32 2.86 9.99 × 10⁻⁵
      OfIAA36 44.20 92.87 1.06 7.90 × 10⁻⁴
      OfIAA37 101.89 292.73 1.52 1.54 × 10⁻¹⁵
      OfIAA38 110.89 292.85 1.40 1.45 × 10⁻¹³
      OfIAA39 24.51 134.72 2.44 2.23 × 10⁻¹¹
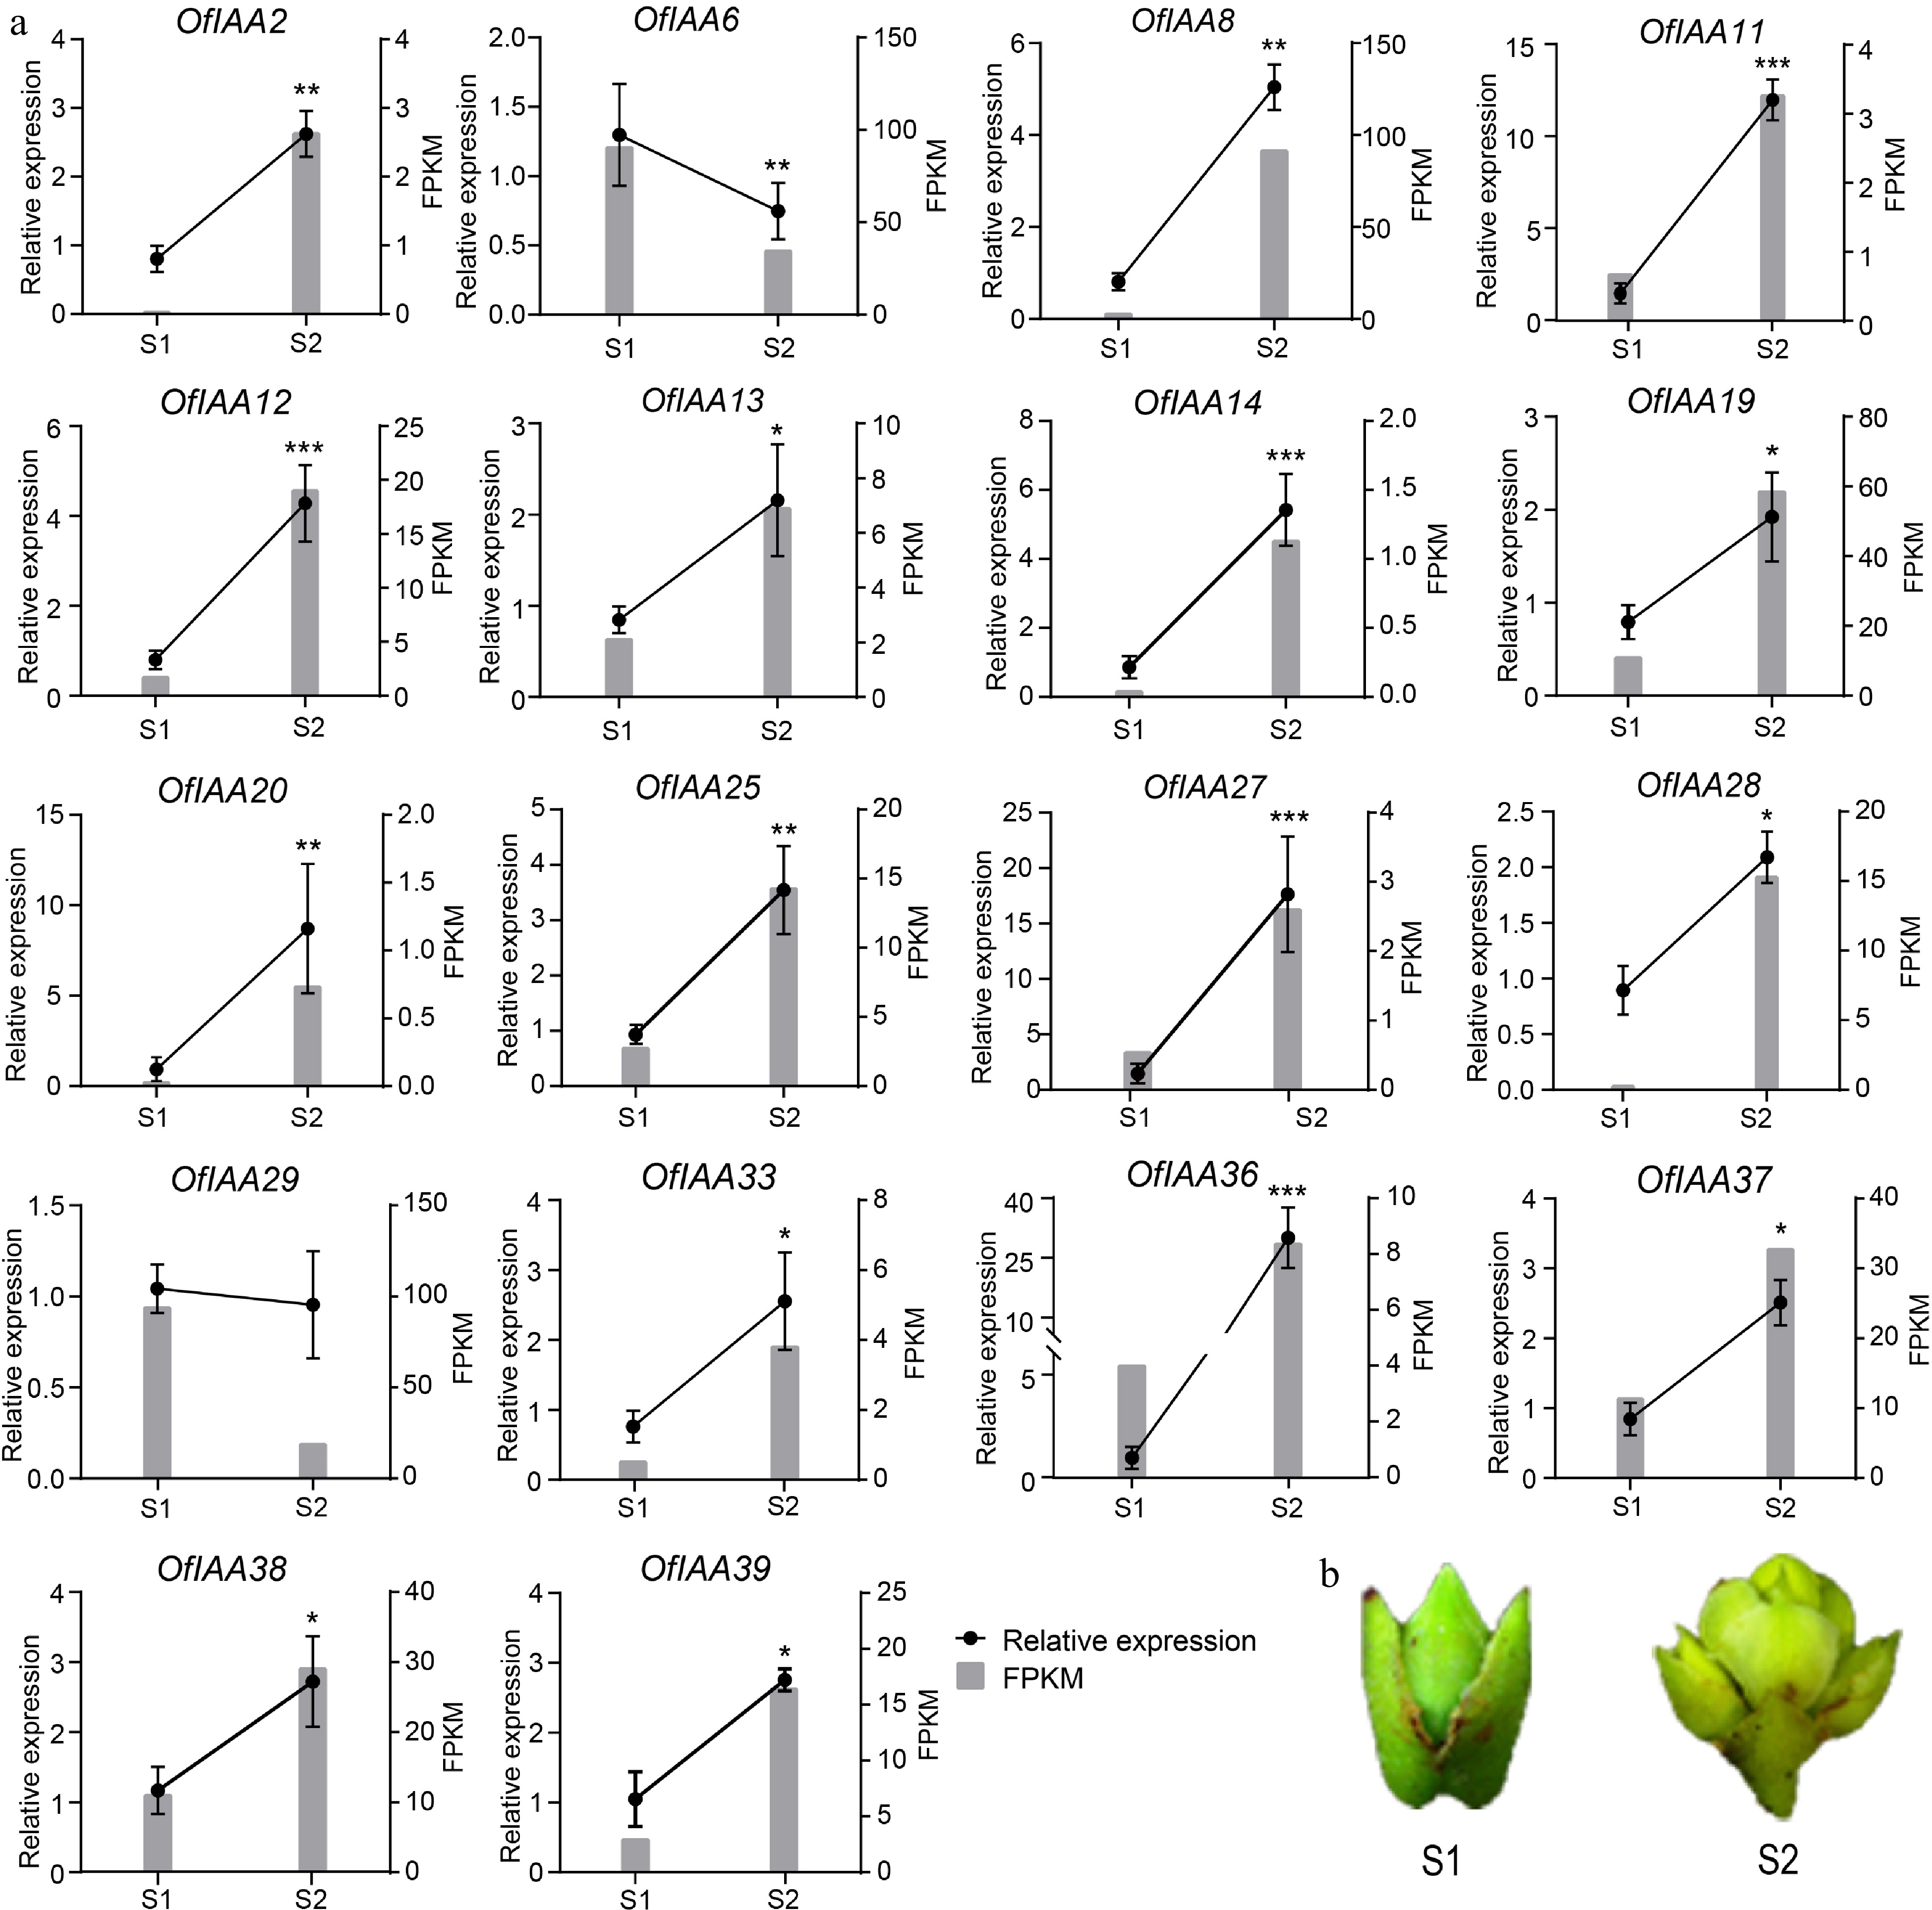
      Figure 8. 

      Expression analysis of the differently expressed OfIAA genes during flower opening processes in O. fragrans. (a) FPKM and qRT‒PCR analysis of the differentially expressed OfIAA genes at stage S1 and S2. Error bars represent the standard error of three replicates. (b) Phenotypes of flower buds at S1 and S2 stage. Significance was assessed by Duncan's multiple-range test (DMRT) at p < 0.001 (***), p < 0.01 (**) and p < 0.05 (*).

    • Salinity and drought stress have a profound impact on the growth, development, and natural distribution of O. fragrans. To investigate the potential role of OfIAA genes in the responding to salt and drought stress, we analyzed their expression patterns under these conditions. The transcriptomic results revealed that the expression of the majority of OfIAA genes were significantly altered in response to salt and drought stress. However, the expression of OfIAA9, 10, 20, 24, and 27 was nearly absent after treatments (Fig. 9a). Based on the DEG thresholds, three DEGs (OfIAA18, 22, and 23) showed downregulation after salt stress, while 11 DEGs were identified under drought stress, including ten downregulated genes (OfIAA13, 15, 18, 21, 22, 23, 28, 29, 31, and 36) and one upregulated gene (OfIAA5) (Table 3). The spatiotemporal expression of all the DEGs was further verified during 24-h after salt and drought treatments, respectively. In particular, OfIAA18, 22, and 23 showed a decreasing trend within 12 h after salt treatment, but their expression levels increased after 12 h (Fig. 9a). In the context of the drought treatment, OfIAA5 and 28 exhibited a decreasing trend within 12 h, followed by an increase at 24 h (Fig. 9c). Furthermore, OfIAA15, 18, 21, 22, 23, 29, 31, and 36 exhibited a general decline over the 24-h period following the drought treatment (Fig. 9b). OfIAA13 showed an increasing trend from 0 to 12 h, but was downregulated at 24 h after the drought treatment (Fig. 9c). These results indicate that the differentially expressed OfIAA genes are involved in the response to salt and drought stress in O. fragrans.
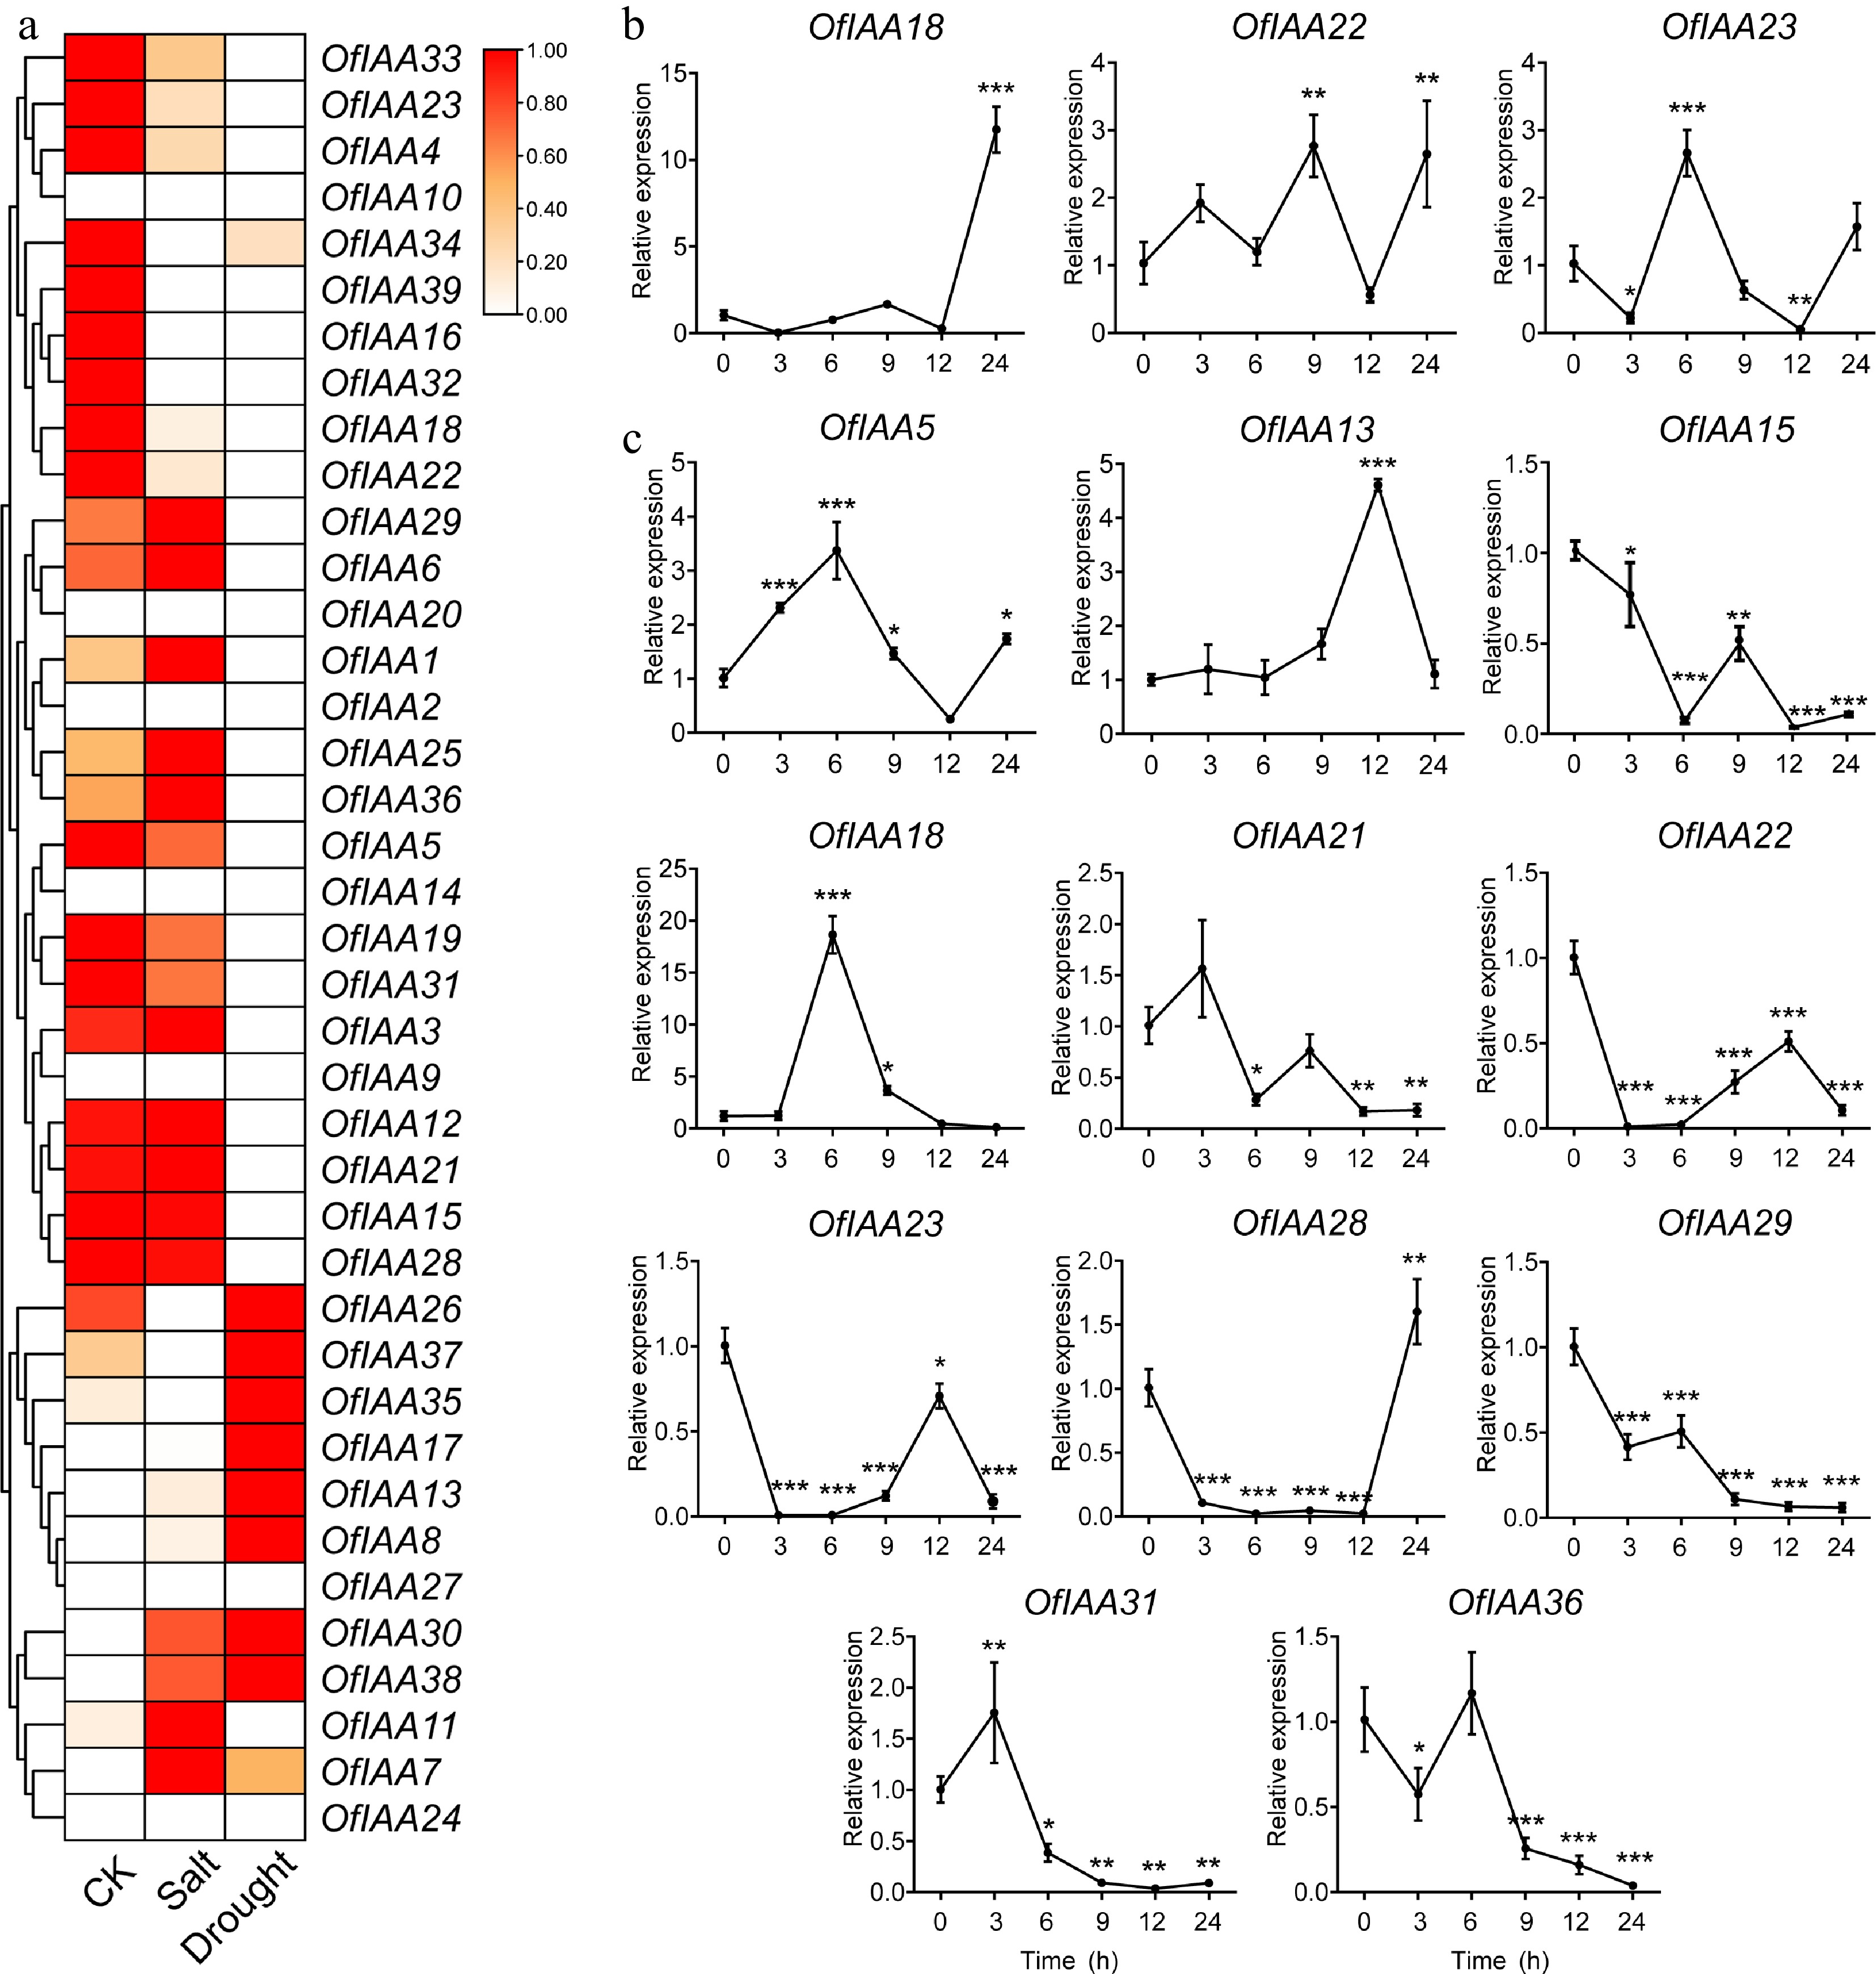
      Figure 9. 

      Expression profiles of the differentially expressed OfIAA genes after (a) salt and (b) drought treatments by qRT‒PCR in O. fragrans. Error bars represent the standard error for three replicates. Significance was assessed by Duncan's multiple-range test (DMRT) at p < 0.001 (***), p < 0.01 (**) and p < 0.05 (*).

      Table 3.  Identification of DEGs under salt and drought treatments in O. fragrans.

      Stress Gene Expression FoldChange Padj value
      CK Treatment
      Salt OfIAA18 1.24 0.28 −2.18 2.2 × 10⁻³
      OfIAA22 4.047 0.67 −2.59 3.6 × 10⁻⁵
      OfIAA23 6.47 1.92 −1.75 1.5 × 10⁻⁴
      Drought OfIAA5 35.73 12.14 −1.54 1.6 × 10⁻¹⁷
      OfIAA13 0.38 6.59 4.15 8.1 × 10⁻¹²
      OfIAA15 2.87 0.41 −2.80 2.3 × 10⁻⁴
      OfIAA18 1.24 0.23 −2.41 6.4 × 10⁻³
      OfIAA21 79.82 29.78 −1.41 3.3 × 10⁻²⁶
      OfIAA22 4.05 0.20 −4.30 4.1 × 10⁻⁹
      OfIAA23 6.47 1.06 −2.59 2.9 × 10⁻⁷
      OfIAA28 2.07 0.71 −1.53 3.7 × 10⁻²
      OfIAA29 13.73 6.75 −1.01 4.9 × 10⁻⁵
      OfIAA31 60.42 15.61 −1.94 1.9 × 10⁻²⁶
      OfIAA36 52.94 16.89 −1.63 3.1 × 10⁻¹⁷
    • Auxin, an essential plant hormone, plays a crucial role in plant growth, development, and physiological processes. In the context of auxin signaling, the Auxin/IAA gene serves as a key regulator of downstream responses. Identification of the Aux/IAA gene family provides a valuable foundation for further research into auxin signaling and regulatory mechanisms. With the advent of molecular biology techniques and genome sequencing, comprehensive analyses of the Auxin/IAA gene family have been conducted in various species, such as Arabidopsis[8], rice[25], maize (Zea mays)[26], and Populus[9]. However, limited information is available on the Aux/fIAA gene family in O. fragrans. Therefore, it is imperative to conduct a comprehensive investigation of this gene family in O. fragrans to gain a better understanding of its potential functions in the flower opening processes and responses to abiotic stress.

      In this study, a genome-wide identification and comprehensive analysis of the OfIAA gene family in O. fragrans was performed. A total of 39 OfIAA genes were identified in O. fragrans, which is more than the number found in Arabidopsis (29) and Populus (35) (Supplemental Table S1). The OfIAA gene family exhibited significant variation in protein length, MW, and pI consistent with findings in Arabidopsis and rice[8,25] (Supplemental Table S1). Upon analysis of the chromosomal distribution, we observed a non-uniform distribution of the OfIAA genes across the 19 chromosomes (Fig. 1). Notably, OfIAAs located on the same chromosome had similar gene structures and gene motifs. A typical Aux/IAA protein consists of four conserved domains[27]. The present analysis revealed that 35 OfAux/IAA proteins had all four domains, while the remaining proteins lacked one domain (Fig. 2). For instance, OfIAA32 lacked domain I, indicating that it cannot repress via interaction with the TPL (TOPLESS) corepressor, thereby losing its repressor function in auxin signaling[28]. Similarly, the absence of domain II in OfIAA18 and 26 result in reduced protein stability and an inability to participate in the TIR1 (transport inhibitor response 1) degradation pathway, making them resistant to degradation at elevated auxin levels[29]. Moreover, the absence of domain IV in OfIAA12 indicates that it cannot form homo- and heterodimers with ARF proteins[30]. Gene duplications, particularly segmental duplications, play a key role in the expansion of gene families[31]. A total of 34 pairs of segmental duplications were found among the OfIAA genes, with no tandem duplications observed (Fig. 3, Table 1). It was hypothesized that segmental duplications may have contributed to the expansion of the Aux/IAA gene family in O. fragrans. Phylogenetic analysis classified the 39 OfIAA proteins into two main groups, consistent with Arabidopsis and rice[32]. Notably, OfIAA genes within the same clade displayed conserved intron-exon structures (Fig. 5), suggesting potential functional similarities. Five types of motifs in the OfAux/IAA gene family were also identified (Fig. 5), which is consistent with Hordeum vulgare[33] and pepper[34]. In addition, the promoter regions of the OfIAA genes contained numerous hormone-responsive and stress-responsive elements (Fig. 6). These elements are involved in regulating the expression of the OfIAA genes in response to hormone signals and stress conditions in O. fragrans.

      The analysis of transcriptomic expression of the OfIAA genes in different tissues revealed that the OfIAA genes are widely expressed in stem tissue. Moreover, certain OfIAA genes show unique preferential expression patterns (Fig. 7). Among the OfIAA genes, 16 OfIAA genes (OfIAA2, 6, 7, 14, 16, 17, 20, 21, 24, 25, 28, 30, 32, 33, 34, and 35) showed the highest expression in different tissues of O. fragrans (Fig. 7), indicating the different functions of the OfIAA gene family in these tissues. Aux/IAA gene play important roles in regulating plant growth and development, particularly in the flowering processes. For example, in rose (Rosa hybrida), repressing the specific ethylene-repressed RhIAA14 gene causes restricted cell expansion, leading to reduced flower size and limited petal expansion[18]. Similarly, petal abscission is delayed when RhIAA4-1 is silenced[35], while downregulation of RhIAA16 promotes petal abscission[19]. In O. fragrans, the functions of OfIAAs in flower opening processes remain unexplored. The present study identified 18 differentially expressed OfIAA genes (16 upregulated and two downregulated) from the S1 stage to the S2 stage during flower opening (Fig. 8). These DEGs suggest a possible involvement in the regulation of flower opening in O. fragrans. Furthermore, the Aux/IAA gene family has been proven to be involved in the abiotic stress response and improved abiotic stress tolerance. Overexpression of TaIAA15-1A in bread wheat (Triticum aestivum) improves drought tolerance by regulating the expression of genes involved in auxin, ABA, phenolamide, and antioxidant signaling pathways[36]. In grapevine (Vitis vinifera), VvIAA18 significantly enhances salt tolerance by upregulating downstream genes, as demonstrated in transgenic tobacco plants and Escherichia[37]. Three DEGs (OfIAA18, 22, and 23) were identified after salt treatment (Fig. 9), indicating that salt stress inhibits auxin signaling. Drought treatment significantly induced 11 DEGs, suggesting their potential role in regulating drought tolerance in O. fragrans. The responses of OfIAA genes to both salt and drought suggest their involvement in abiotic stress adaptation in O. fragrans. These results highlight the multiple roles of OfIAA genes in regulating flower opening and abiotic stress response in O. fragrans.

    • A comprehensive genome-wide analysis was conducted to identify 39 OfIAA genes in O. fragrans. The analysis of gene characterization revealed the evolutionary conservation of the OfIAA gene family. Additionally, synteny analysis suggested that segmental duplication had a significant role in the evolution of the OfIAA gene family. Through transcriptomic and qRT‒PCR analyses, it was found that almost all the OfIAAs were expressed in the stem tissue. Furthermore, 18 DEGs were identified, which contributed to the regulation of the flower opening in O. fragrans. Moreover, three and 11 DEGs were obtained after salt and drought treatments, respectively. The expression patterns of differentially expressed OfIAA genes suggested their essential role in responding to abiotic stress tolerance.

    • The potted material of O. fragrans 'Yanhonggui' is maintained in the Osmanthus Germplasm Resource Garden of Zhejiang Agriculture and Forestry University in Hangzhou, China. All the materials were kept in a greenhouse under natural conditions. To investigate the tissue-specific expression patterns, samples were collected from different plant tissues, including the root, annual stem, perennial stem, young leaf, mature leaf, and flower. During flower opening, flower buds were collected at two different developmental stages. The S1 stage involved the buds in the globular form with the inner bracts visibly covering the inflorescence. The S2 stage involved the buds when the inflorescence had burst through the bracts, and the florets were closely crowded. According to Dong et al.[38], uniform branch cuttings of O. fragrans 'Yanhonggui', each 20 cm long, were used for salt and drought treatment. All the cuttings were subjected to 200 mmol/L D-mannitol and 200 mmol/L NaCl, respectively, in a growth chamber under controlled conditions (temperature of 23 °C, 14/10-h light/dark cycle, and relative humidity of 60%). Three biological replicates were performed for each treatment. The third or fourth fully expanded leaf from the top was collected from each treatment at 0, 3, 6, 9, 12, and 24 h. All samples were immediately frozen in liquid nitrogen and stored at −80°C.

    • The nucleotide and protein sequences of O. fragrans were downloaded from the O. fragrans genome database in NCBI (www.ncbi.nlm.nih.gov/genome/?term=Osmanthus+fragrans). The Hidden Markov Model (HMM) for the Aux/IAA gene family (PF02309) was downloaded from the pfam database (www.ebi.ac.uk/interpro) and utilized with the hmmbuild tool (www.hmmer.org) to identify potential Aux/IAA genes in the genome of O. fragrans. The amino acid sequences of OfIAA proteins were analyzed using the online tool Expasy (www.expasy.org) to calculate the length of amino acid, molecular weight (MW), and isoelectric point (pI). Additionally, the Protein Parameter Calculator in TBtools (https://github.com/CJ-Chen/TBtools) was employed to determine the instability index, aliphatic index, and grand average of hydropathicity for the OfIAA proteins. The subcellular localization prediction of OfIAA proteins was performed using WoLF PSORT (https://wolfpsort.hgc.jp/).

    • The AUX/IAA protein sequences of Arabidopsis thaliana and rice (Oryza sativa) were obtained from the NCBI (National Center for Biotechnology Information) database (Supplemental Tables S2 & S3). Subsequently, the Aux/IAA protein sequences of O. fragrans, Arabidopsis, and rice were aligned using the MEGA11 software[39], and a phylogenetic tree was generated by the neighbor-joining method with a bootstrap value of 1,000. In addition, the exon-intron distribution of the OfAux/IAA genes were analyzed using Gene Structure Display Sever 2.0 (http://gsds.cbi.pku.edu.cn/). The motifs of the OfAux/IAA proteins were predicted by the Multiple Expectation Maximization for Motif Elicitation (MEME) online program (https://meme-suite.org/meme/tools/meme).

    • To investigate cis-regulatory elements (CREs) in promoter sequences of OfAux/IAA genes, 2,000 bp genomic regions upstream of the translational start codons were analyzed using the Plantcare program (http://bioinformatics.psb.ugent.be/webtools/plantcare/html/). The putative CREs in the promoter sequences of each OfAux/IAA gene were visualized in TBtools software[40].

    • The chromosome information of OfAux/IAA genes was analyzed by TBtools software[40], including chromosome length, numbers, and the start and end sites of genes. The domains of the predicted OfAux/IAA proteins were visualized using DNAMAN version 7 software. The pattern of gene duplication of OfAux/IAAs was assessed by MCScanX v1.0 software. The DnaSP v5.0 soft was used to analyze the synonymous (Ks) and nonsynonymous (Ka) substitution ratios of the gene pairs. The divergence time was calculated using the formula T = Ks/2r, where Ks represents the synonymous substitutions per site and r represents the rate of divergence of nuclear genes in plants. For dicotyledonous plants, the rate of divergence (r) was considered to be 1.5 × 10⁻⁸ synonymous substitutions per site per year. Synteny analyses of OfAux/IAA genes, OfAux/IAAs and AtAux/IAAs, and OfAux/IAAs and OsAux/IAAs were conducted using the Quick MCScanX Wrapper program in TBtools.

    • A total of 0.5 g of material was used for total RNA extraction using a FastPure Universal Plant Total RNA Isolation Kit (Vazyme, Nangjing, China) according to the manufacturer's instructions. For library construction and RNA sequencing, 3.0 μg of RNA from each sample was utilized. The RNA sequencing method employed was previously described by Ye et al.[37]. Three biological replicates were performed for RNA sequencing. Fragments Per Kilobase of exon model per Million mapped fragments (FPKM) was employed to calculate the expression, the differentially expressed genes (DEGs) were determined by the threshold of |log2(ratio treatment/CK)| ≥ 1, along with Padj: (p.adjust) < 0.001. The RNA sequencing data were accessed at the SRA (Sequence Read Archive) database (www.ncbi.nlm.nih.gov/sra) under Bioproject number PRJNA961323. TBtools software was used to generate the heatmap to visualize the expression of OfIAA genes.

    • cDNA synthesis was carried out using ToloScript All-in-one RT EasyMix for qPCR (TOLOBIO, Shanghai, China) according to the manufacturer's recommendations. qRT‒PCR analysis was performed using the LightCycler480II System (Roche, Basel, Switzerland) as described by Yang et al.[41]. Three biological repetitions were performed. The relative expression level of genes was calculated by the 2−ΔΔCᴛ method. The sequence-specific primers are listed in Supplemental Table S4.

    • Data treatment and analysis were performed by Excel 2022 (Microsoft, Redmond, USA). IBM SPSS 20 software (IBM, Armonk, USA) was utilized to determine significant differences. Significance was assessed by Duncan's multiple-range test (DMRT) at p < 0.001 (***), p < 0.01 (**) and p < 0.05 (*).

    • The authors confirm contribution to the paper as follows: study design and supervision: Zhao H, Dong B; participating in the entire thesis writing and data analysis: Cao S, Dong B; assisting in the bioinformatics analysis of the gene family: Ye Y, Wang Y; participated in the experiment process: Zheng Z, Zhong S, Xiao Z; providing guidance and manuscript revision: Fang Q, Deng J. All authors reviewed the results and approved the final version of the manuscript.

    • The plant materials are preserved in the Osmanthus Germplasm Resource Garden of Zhejiang Agriculture and Forestry University (Hangzhou, China). The raw reads files have been accessed on NCBI Sequence Read Archive (SRA) under the BioProject number of PRJNA961323.

      • This work was funded by the National Natural Science Foundation of China (Grant No. 31902057 and 32401643), the Key research and development program of Zhejiang Province (Grant No. 2021C02071), and the Zhejiang Provincial Natural Science Foundation of China (Grant No. LQ19C160012).

      • The authors declare that they have no conflict of interest.

      • # Authors contributed equally: Shanshan Cao, Yong Ye

      • Copyright: © 2024 by the author(s). Published by Maximum Academic Press, Fayetteville, GA. This article is an open access article distributed under Creative Commons Attribution License (CC BY 4.0), visit https://creativecommons.org/licenses/by/4.0/.
    Figure (9)  Table (3) References (41)
  • About this article
    Cite this article
    Cao S, Ye Y, Zheng Z, Zhong S, Wang Y, et al. 2024. Aux/IAA gene family identification and analysis reveals roles in flower opening and abiotic stress response in Osmanthus fragrans. Ornamental Plant Research 4: e027 doi: 10.48130/opr-0024-0025
    Cao S, Ye Y, Zheng Z, Zhong S, Wang Y, et al. 2024. Aux/IAA gene family identification and analysis reveals roles in flower opening and abiotic stress response in Osmanthus fragrans. Ornamental Plant Research 4: e027 doi: 10.48130/opr-0024-0025

Catalog

  • About this article

/

DownLoad:  Full-Size Img  PowerPoint
Return
Return