-
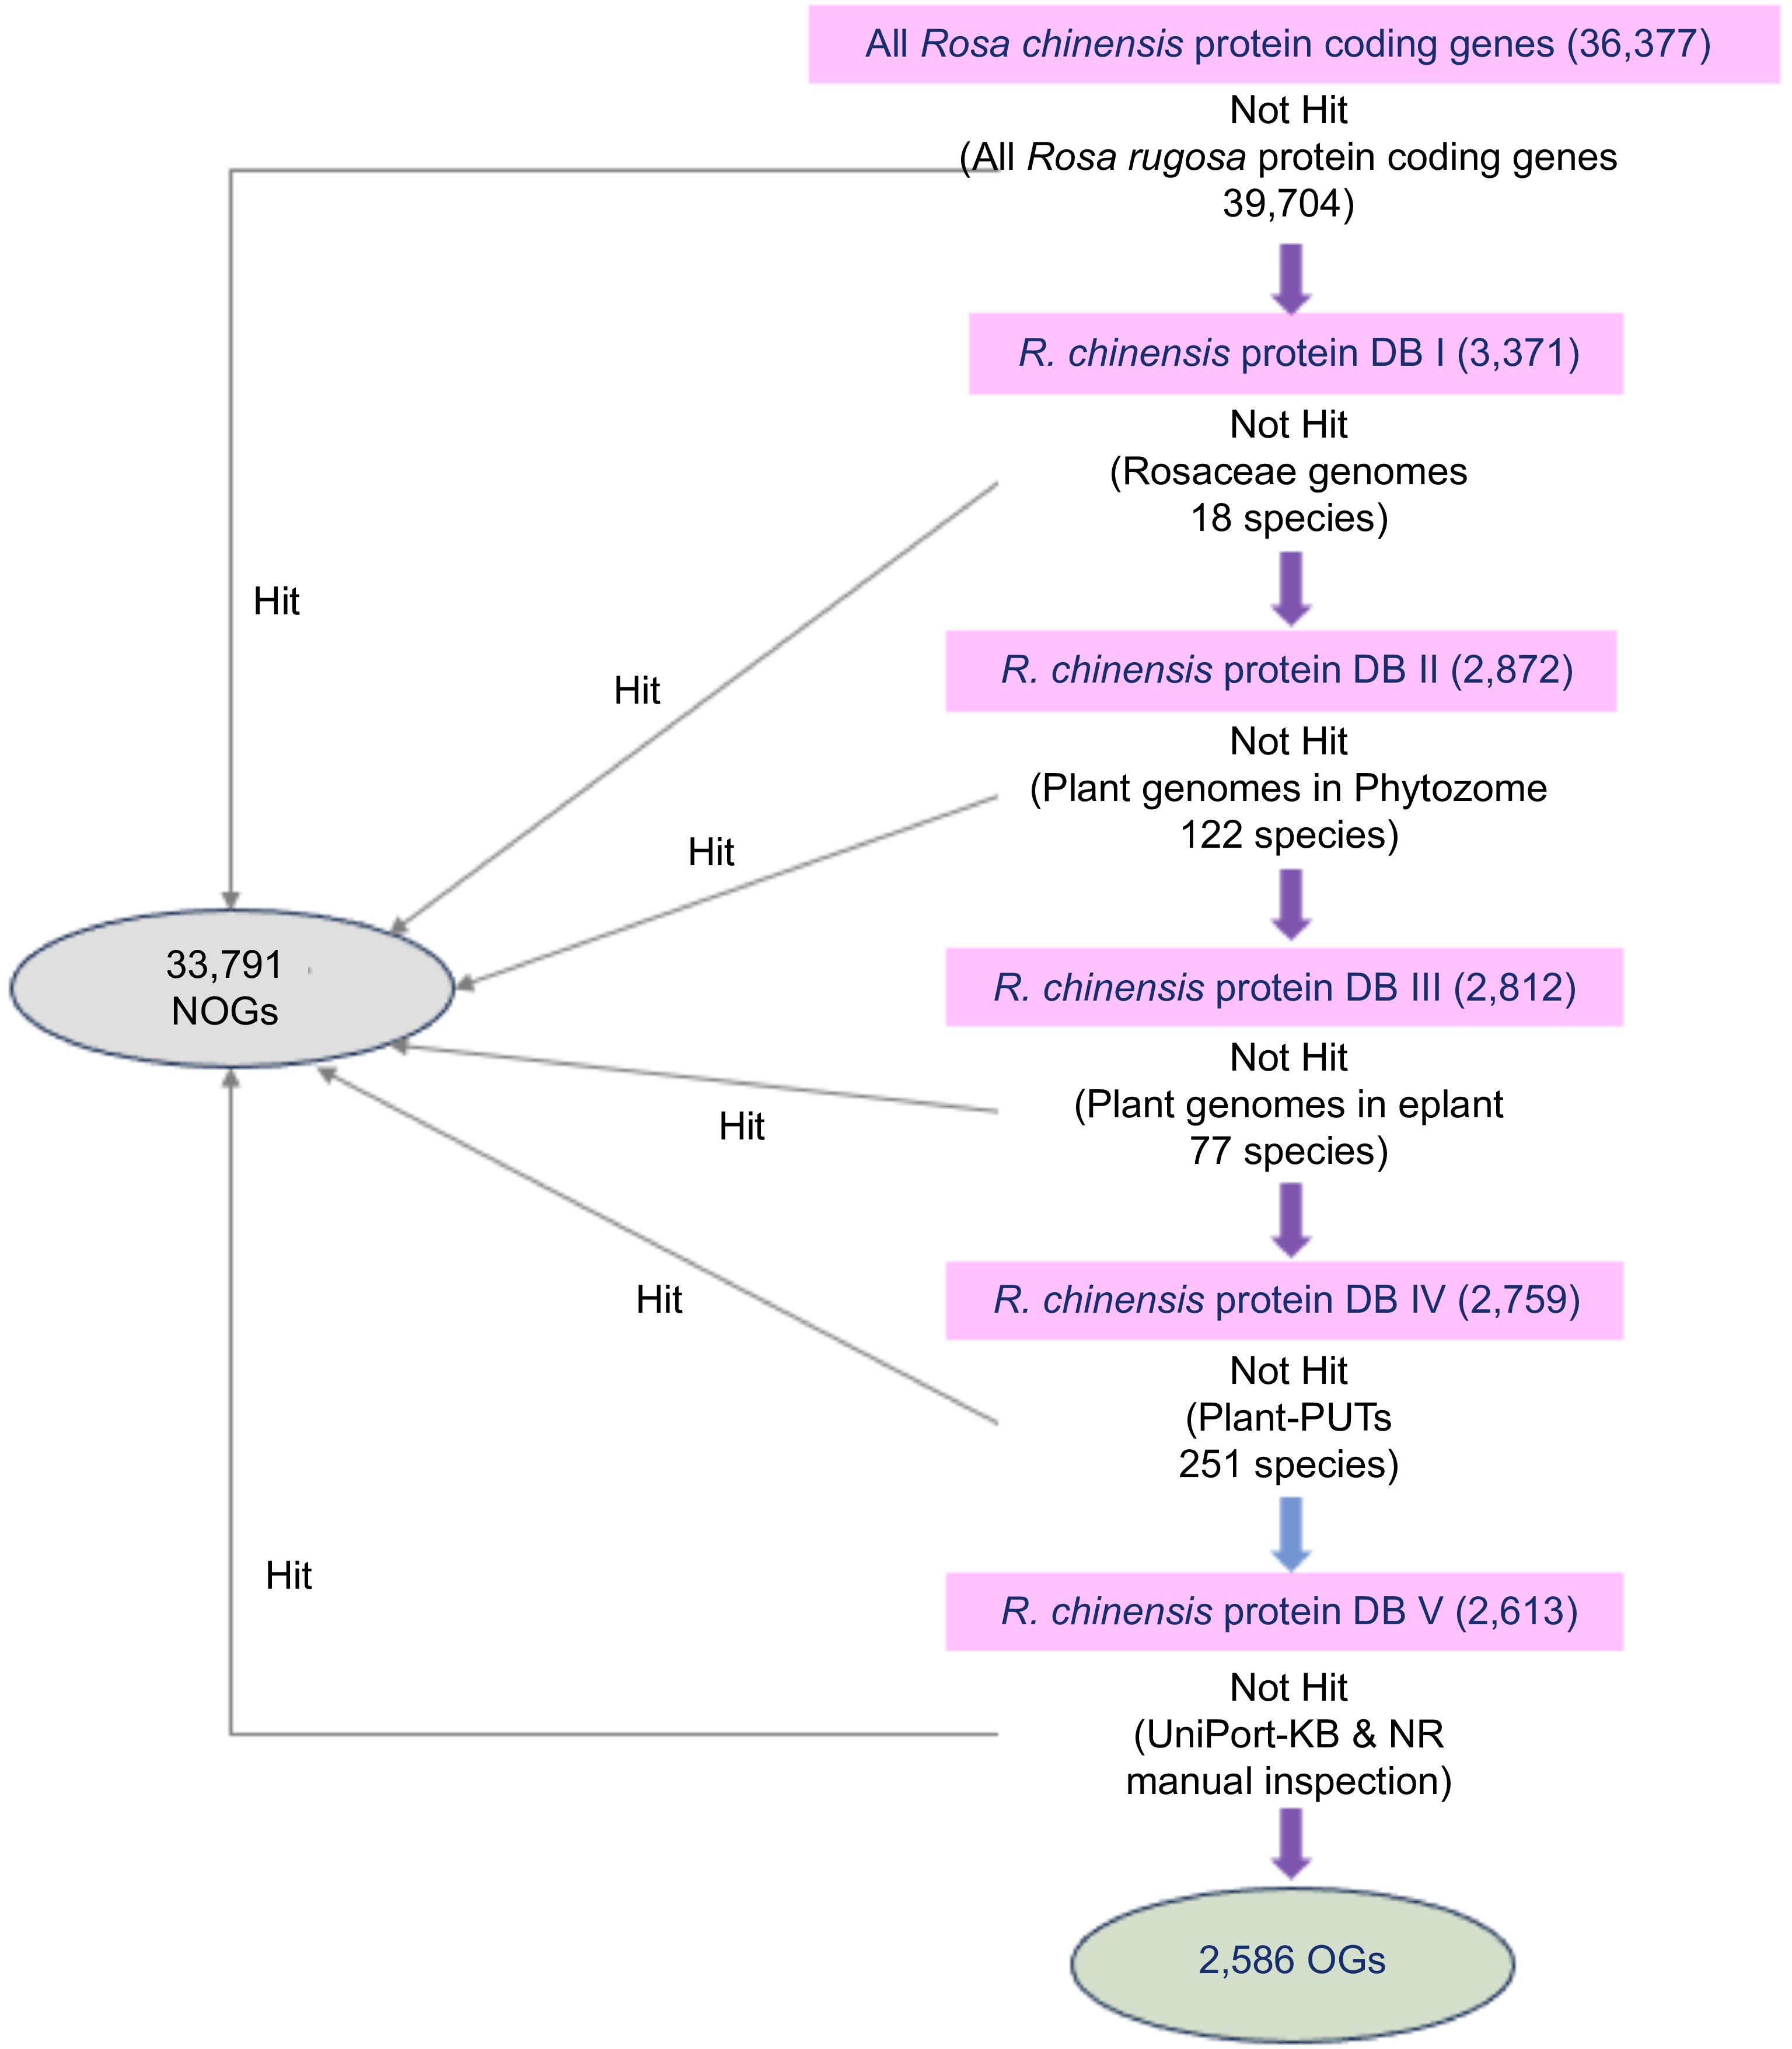
Figure 1.
Procedure for identifying the orphan genes in R. chinensis genome. The purple arrows represent a homolog-based search by BLASTP with an E-value cutoff of 1e-5. The blue arrow represents a homolog-based search by TBLASTN with an E-value cutoff of 1e-5. Genes without homologs in any databases were identified as OGs (2,586), while genes with homologs were classified as NOGs (33,791).
-
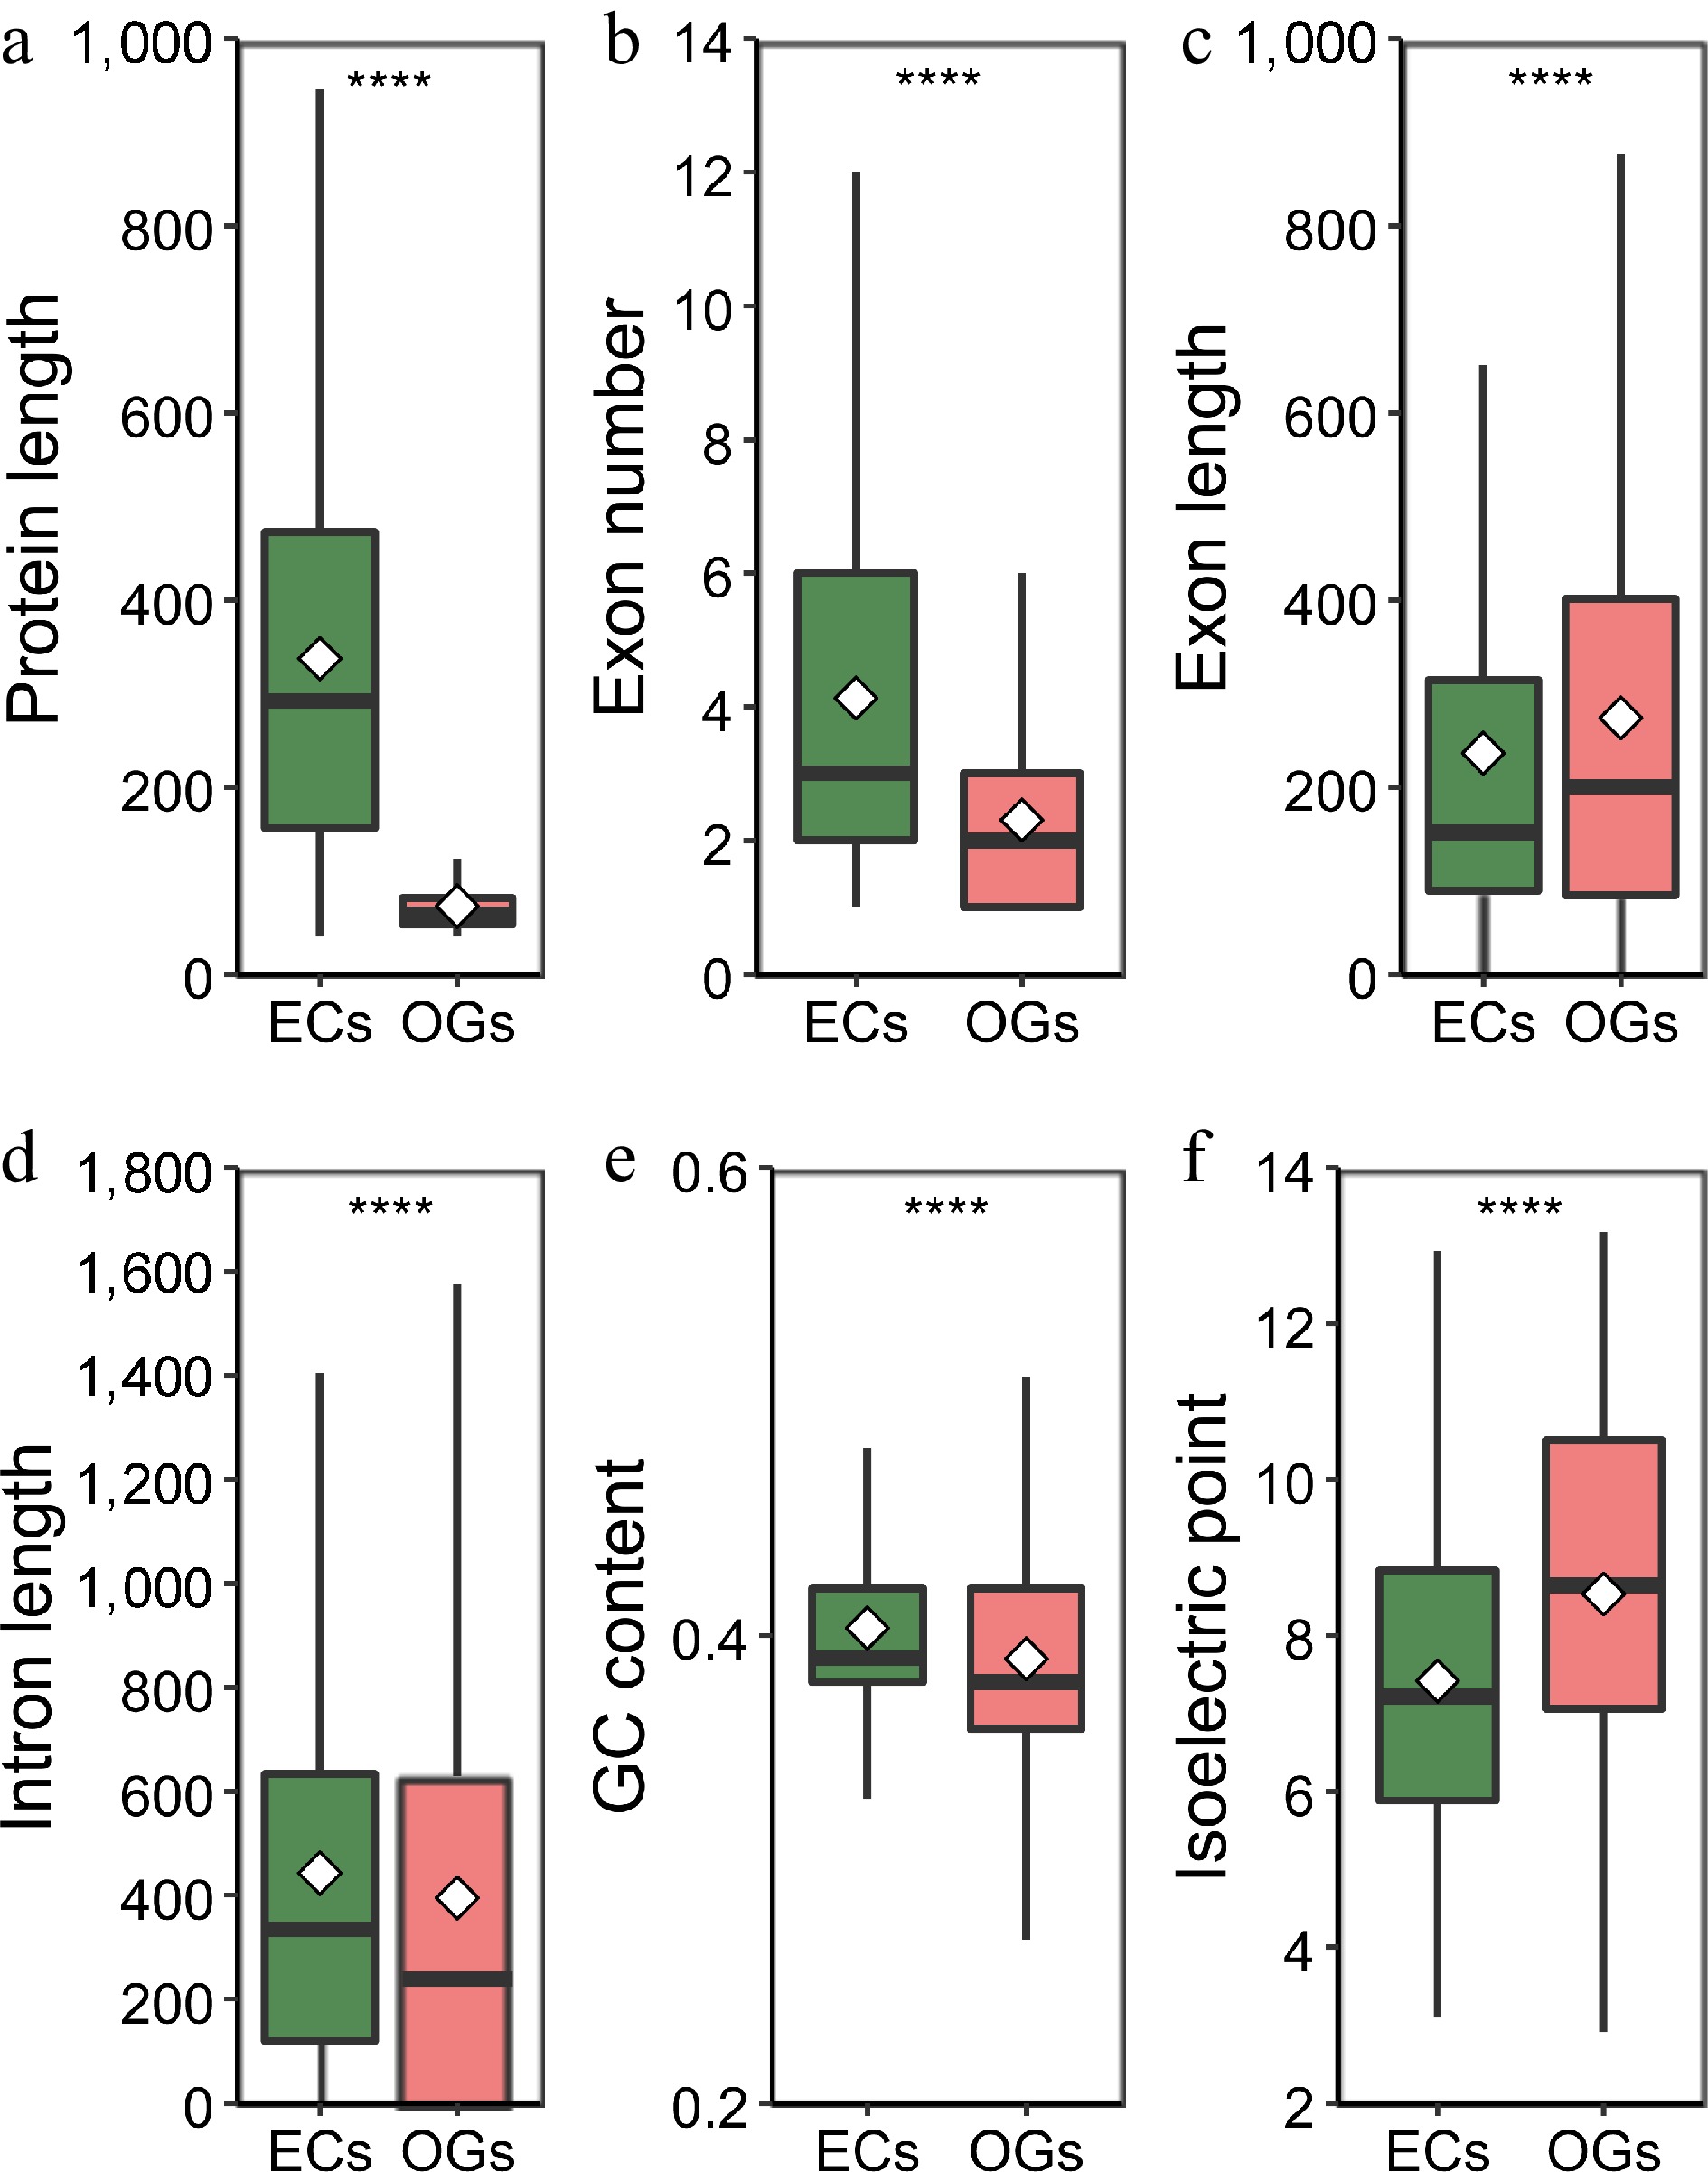
Figure 2.
Analysis and comparison of the structural characteristics of orphan genes (OGs) and non-orphan genes (NOGs). (a) Box-plot comparisons of protein length. (b) Exon number per gene. (c) Exon length. (d) Intron length. (e) GCs content. (f) Isoelectric point. White squares represent the mean value. **** indicate significance levels at p < 0.0001.
-
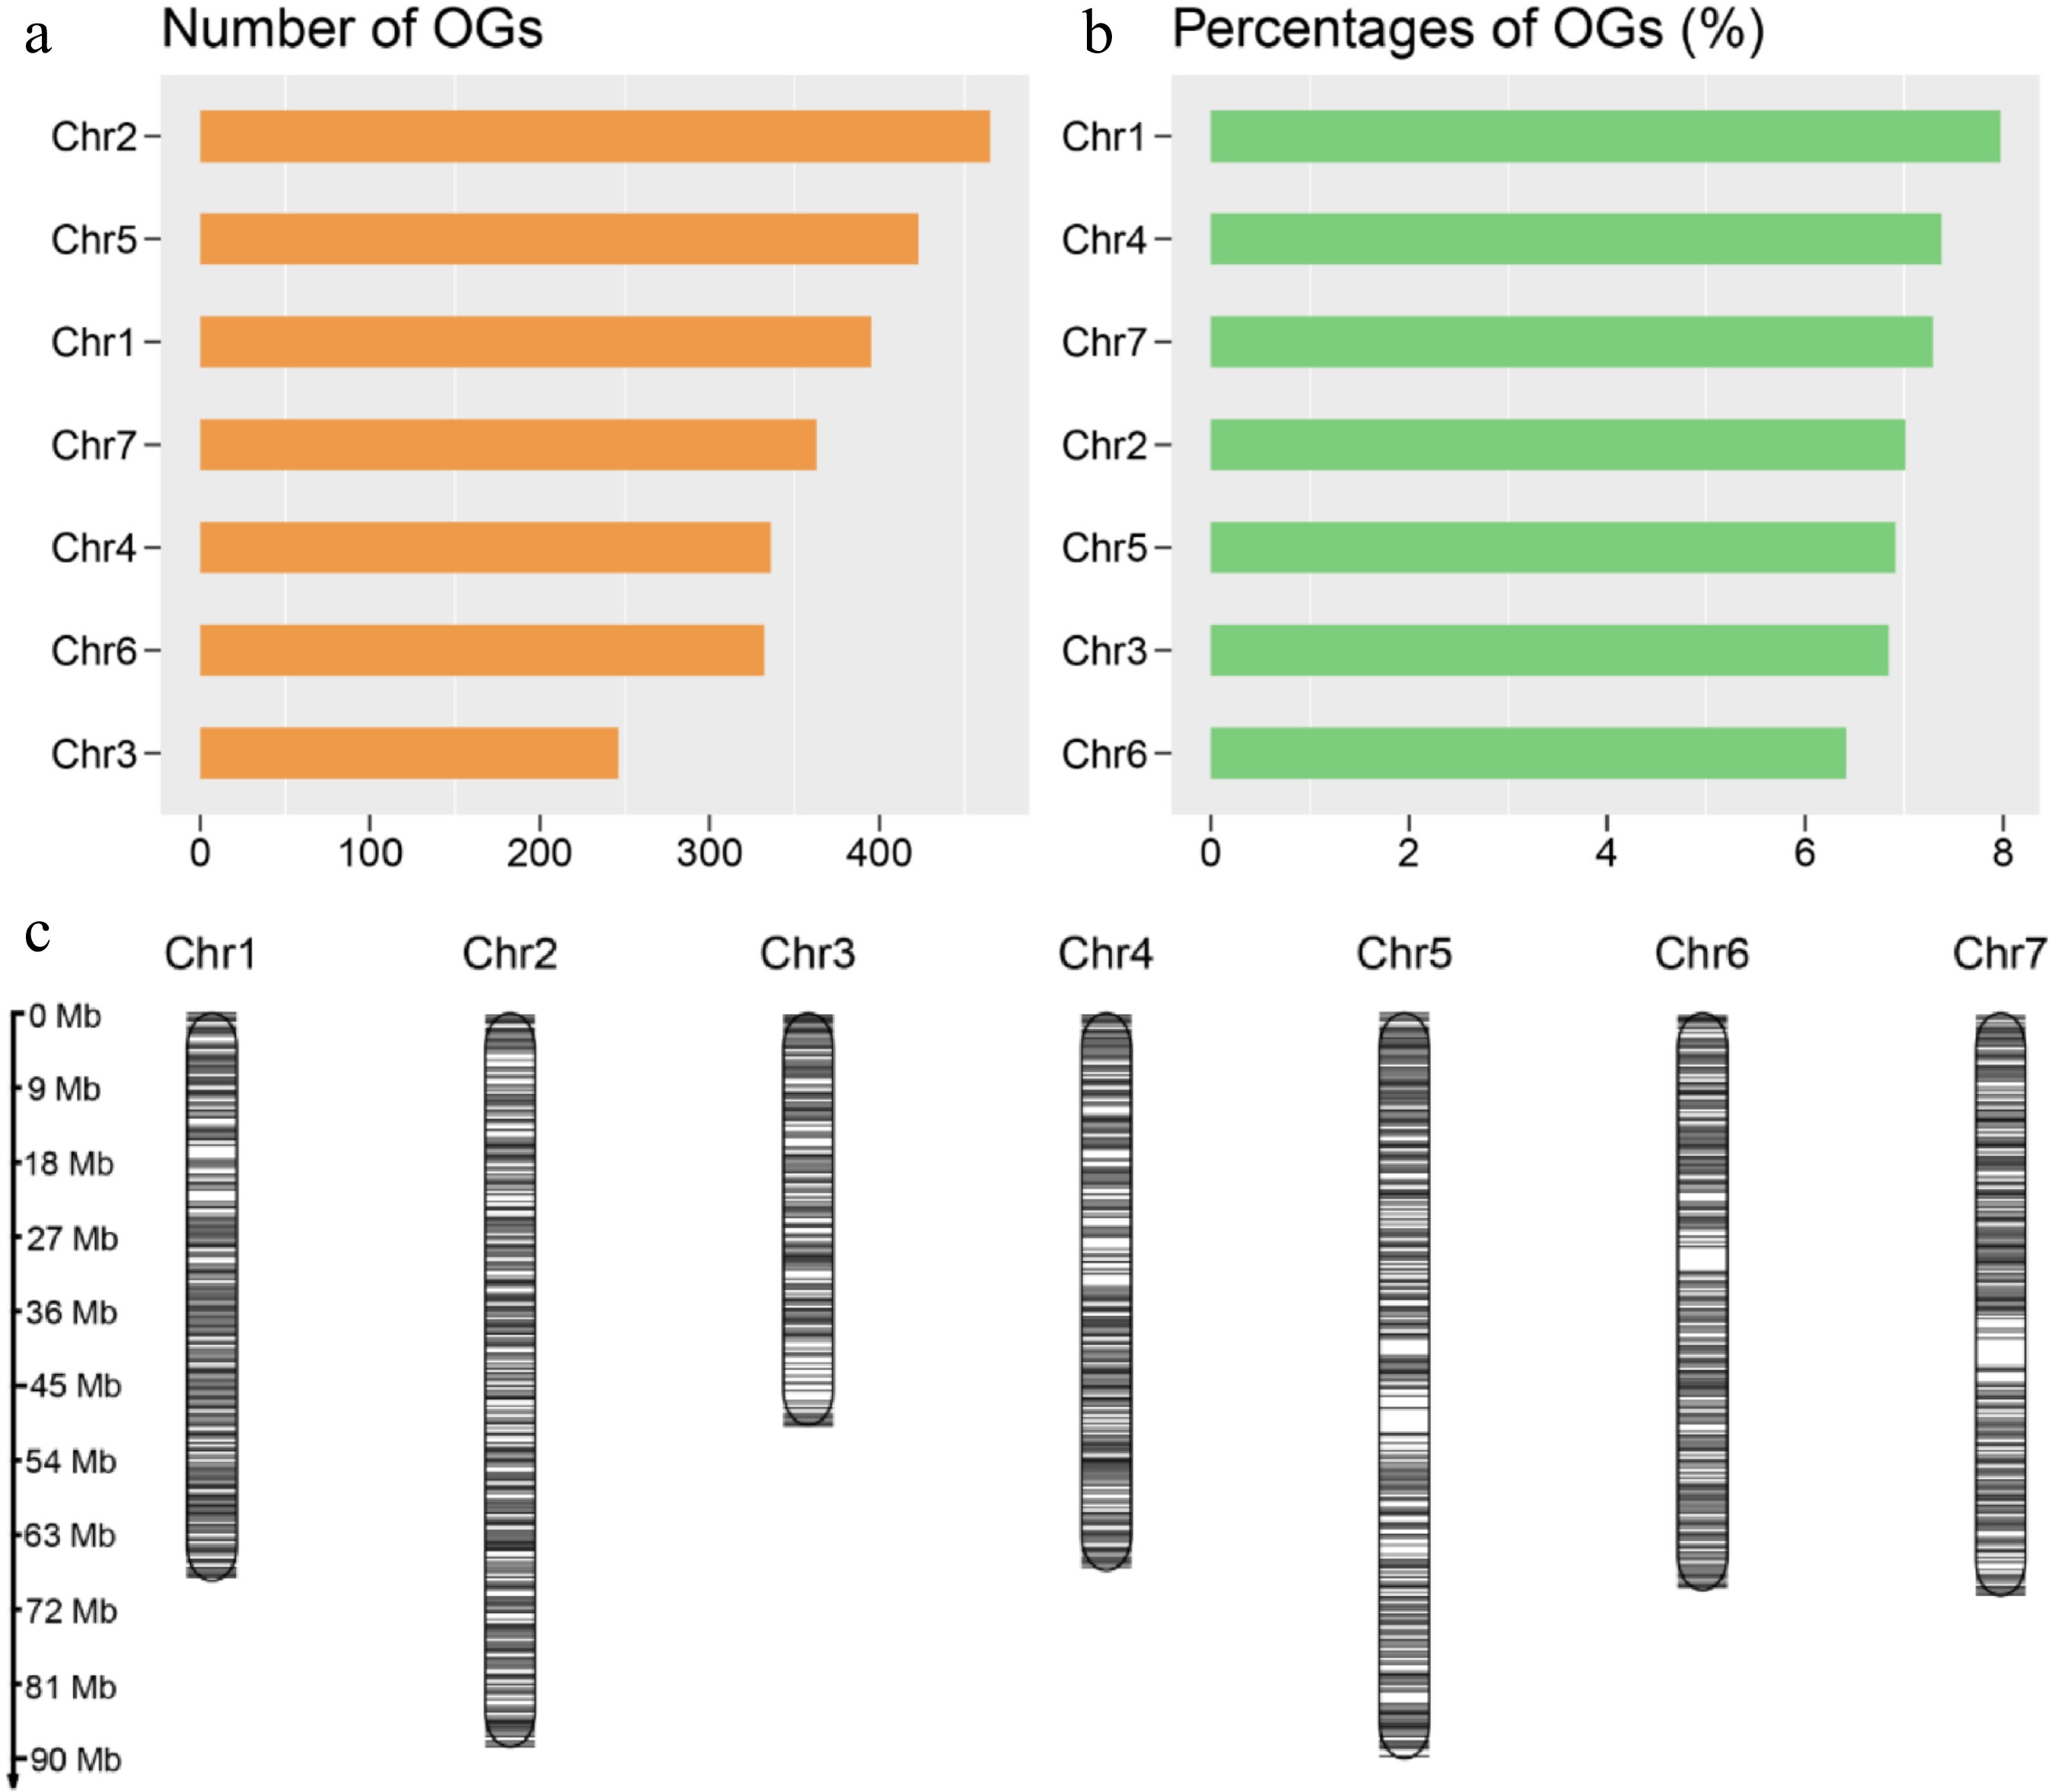
Figure 3.
Orphan genes (OGs) distribution on chromosomes. (a) The numbers of OGs on each chromosome of R. chinensis. (b) Percentage of OGs on each chromosome of R. chinensis. (c) Chromosomal distribution of the identified OGs. Black horizontal lines represent OGs.
-
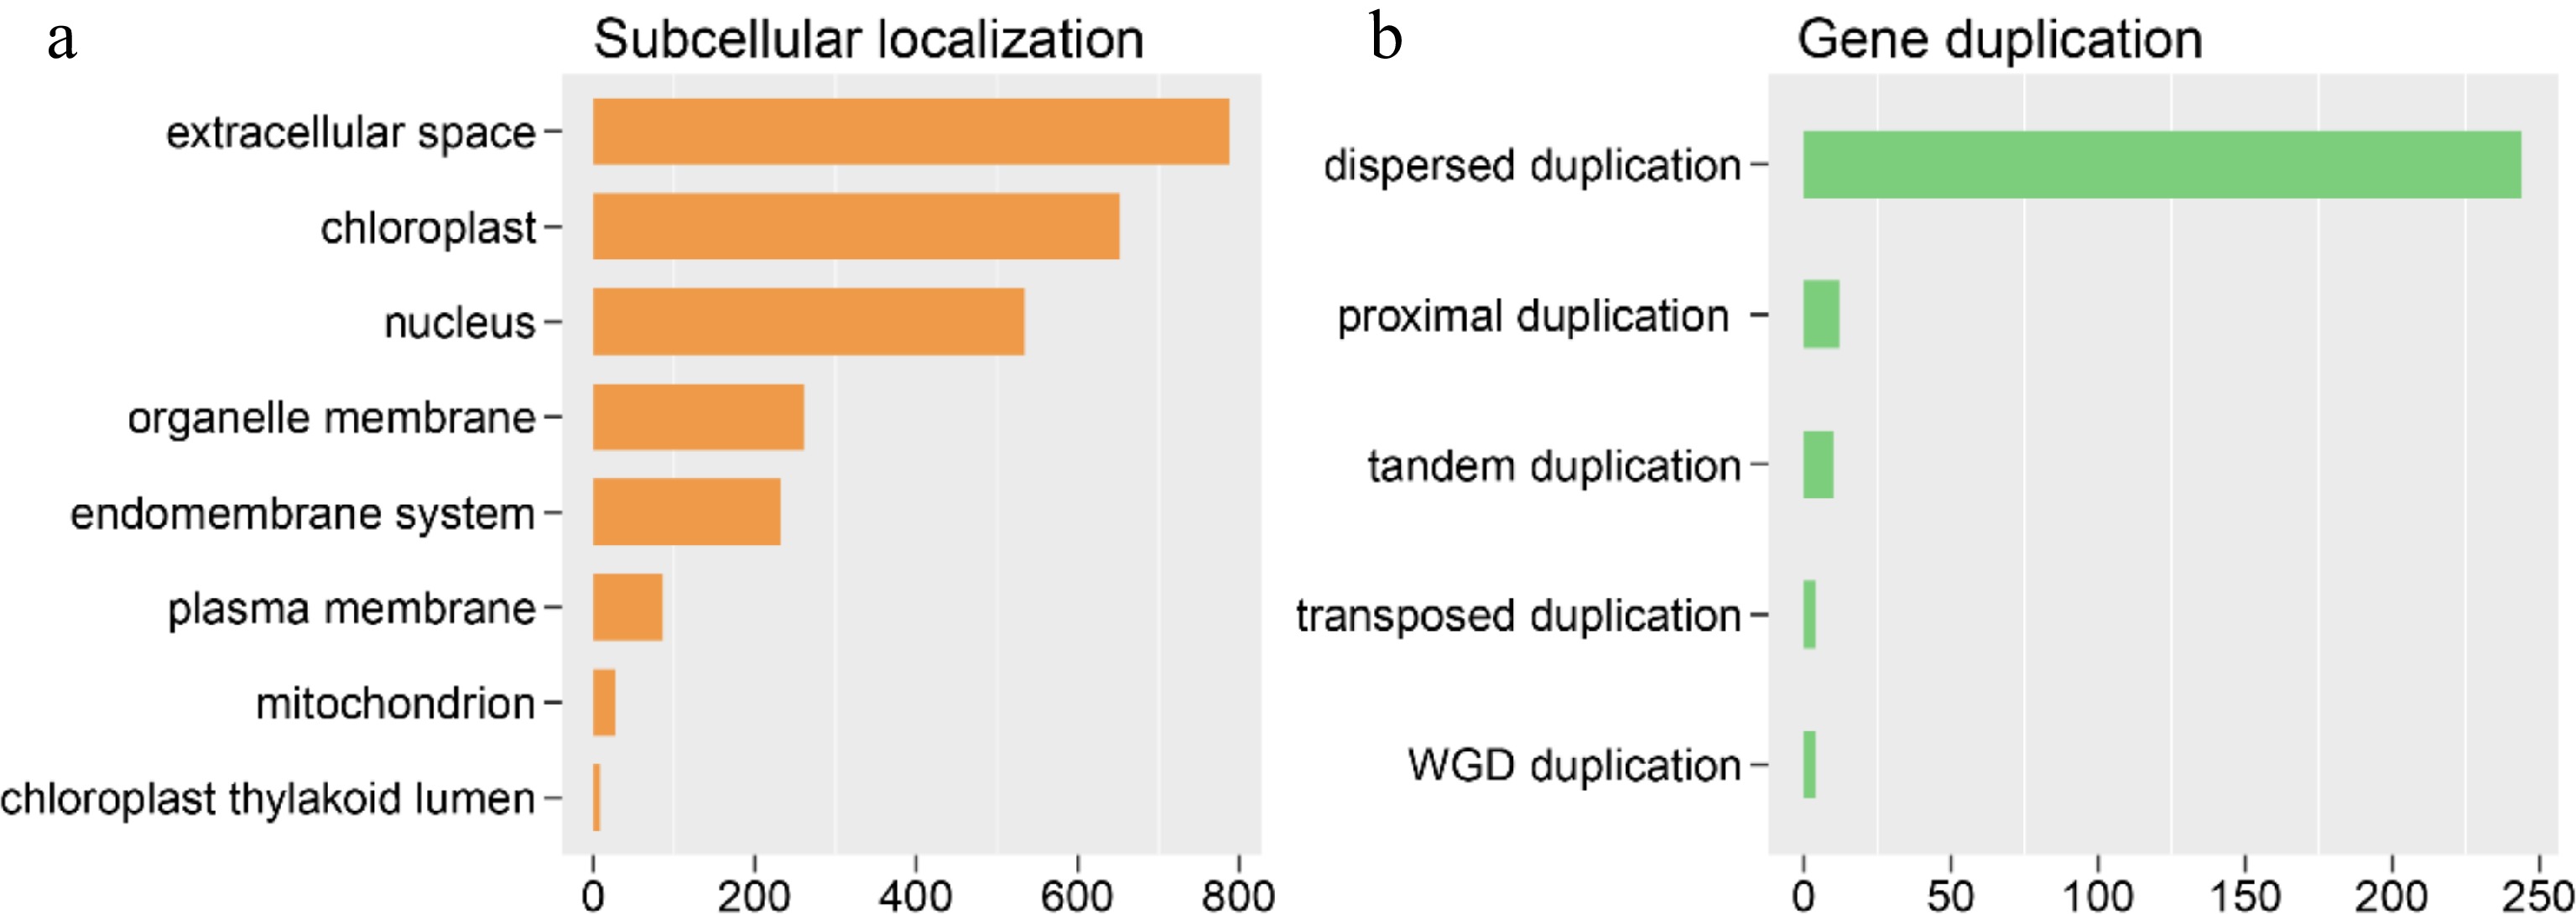
Figure 4.
Orphan gene (OGs) subcellular and gene duplication analysis. (a) OGs assigned to different subcellular locations. (b) The OGs number of different duplication types.
-
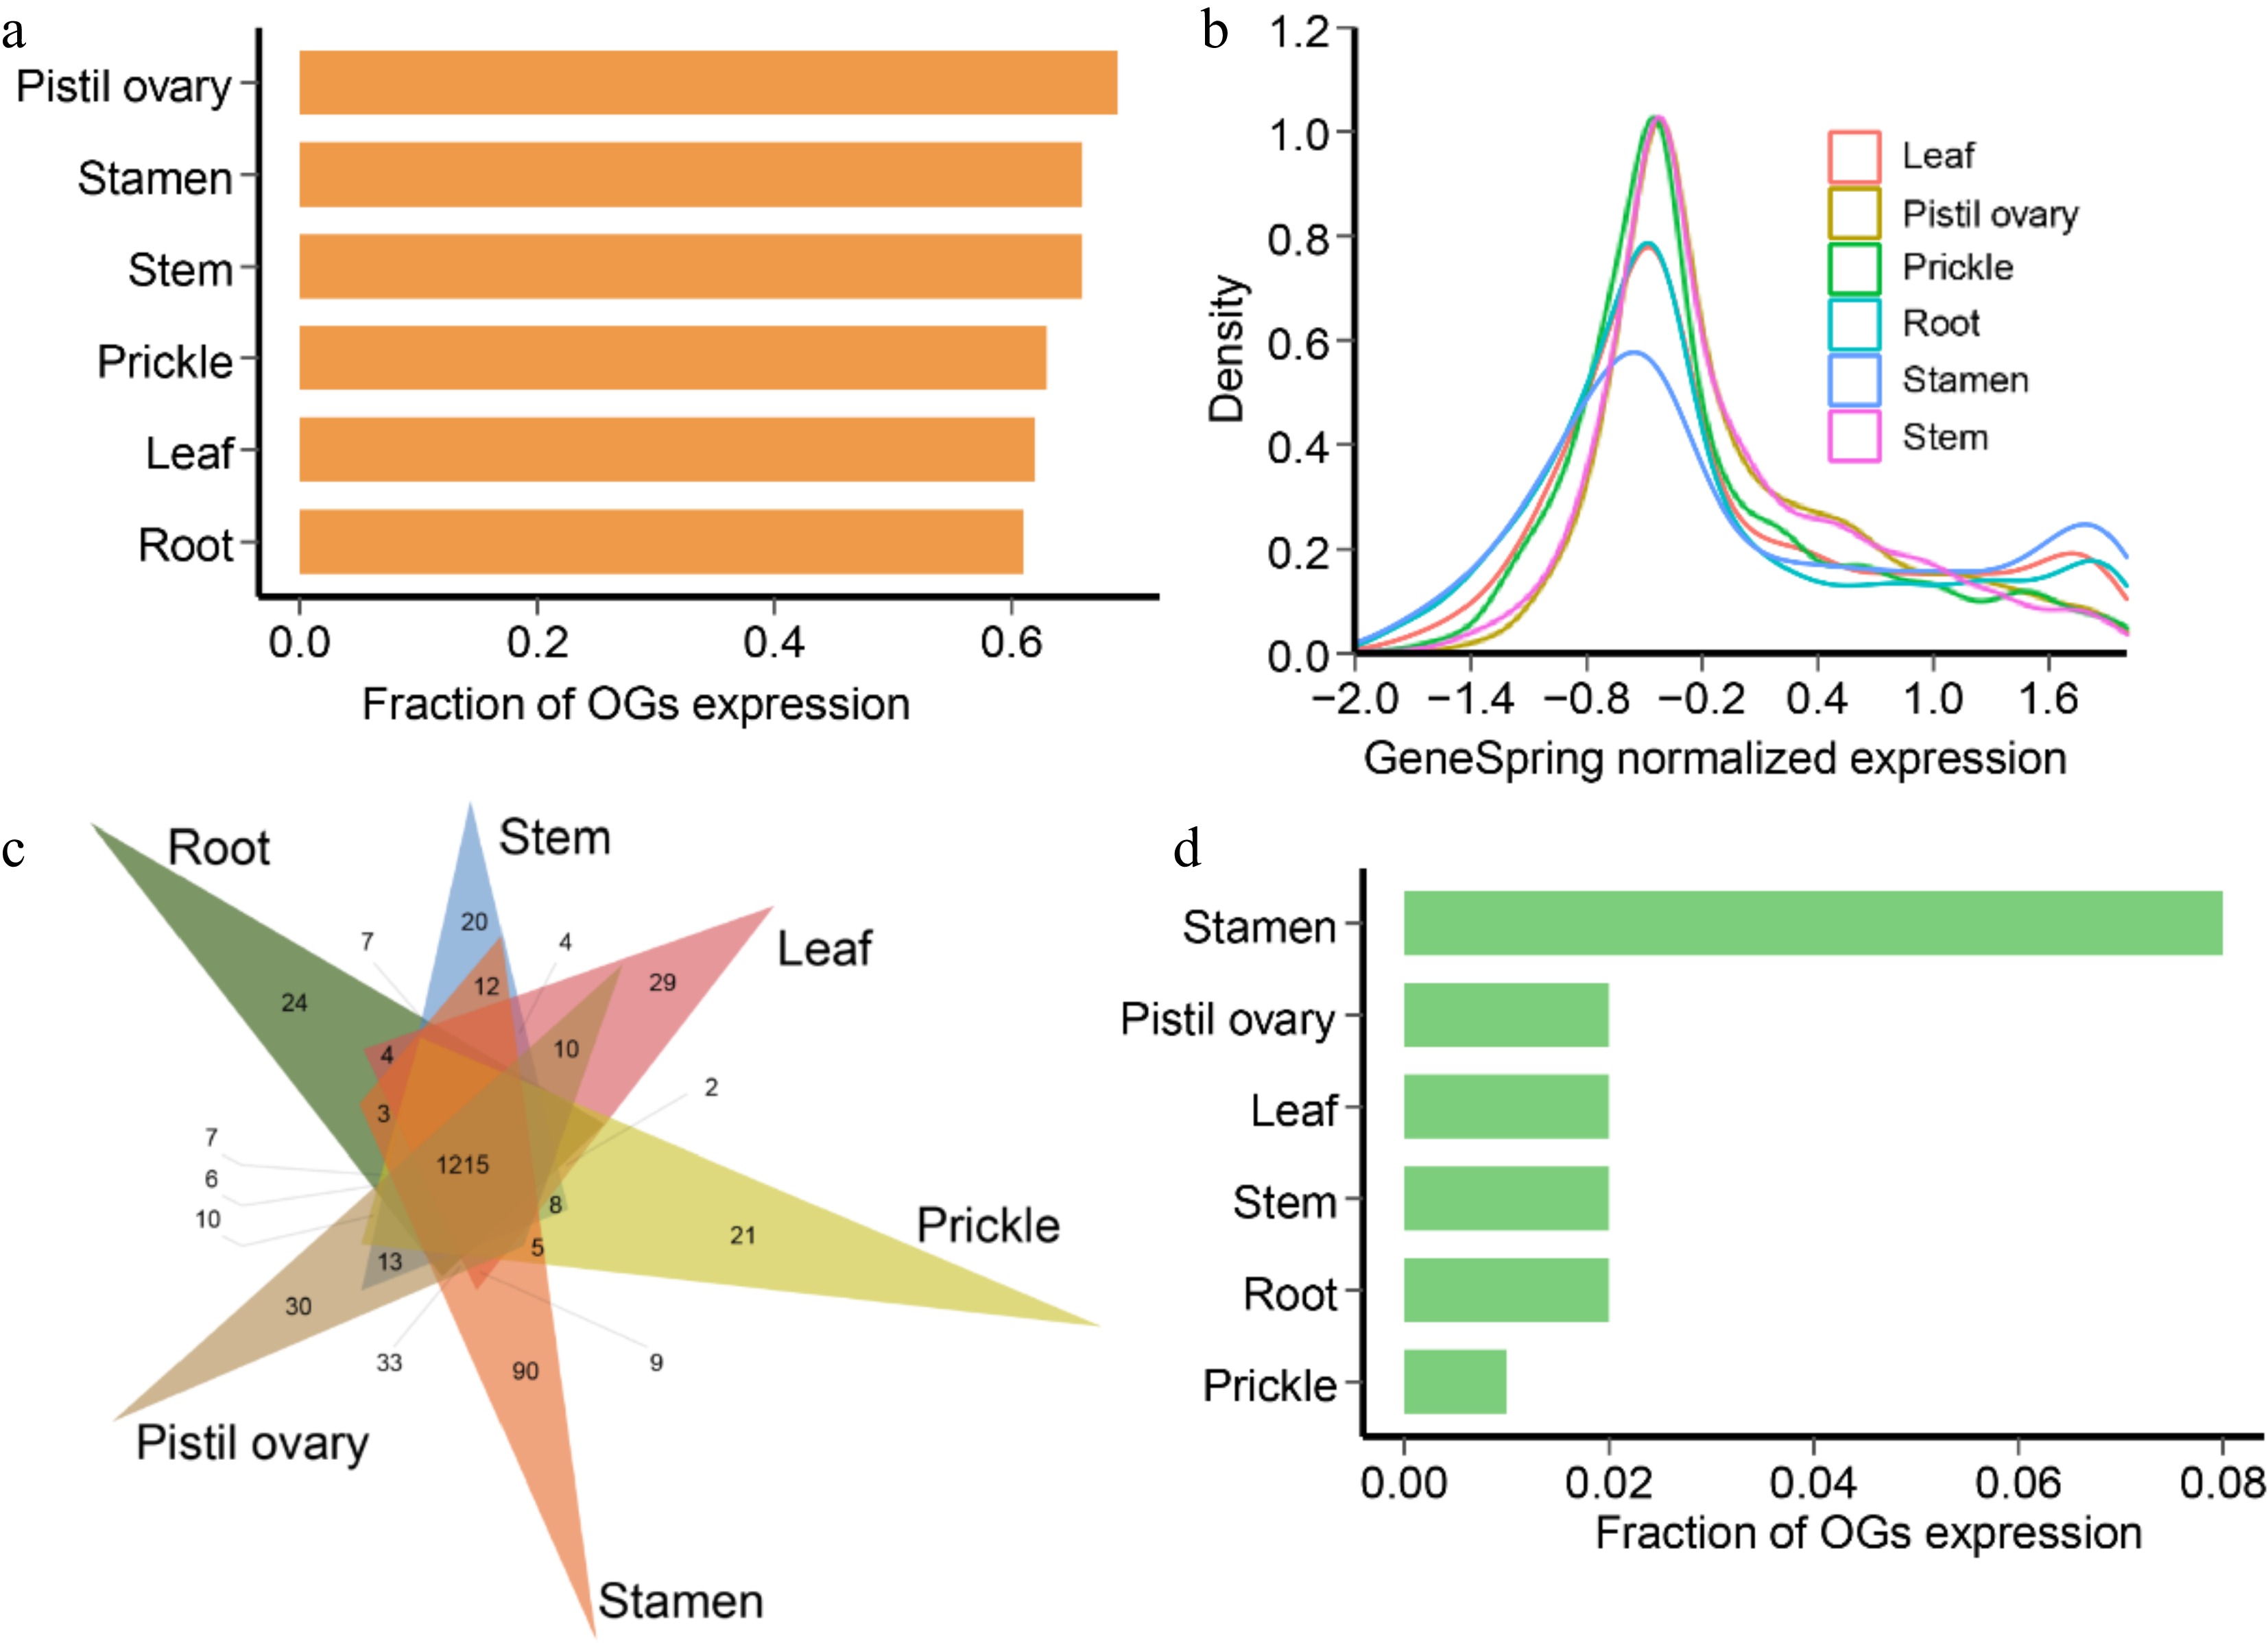
Figure 5.
Gene expression patterns of R. chinensis orphan genes (OGs). (a) Fraction of OGs having expression in different tissues. (b) GeneSpring normalized expression levels of OGs in different tissues. (c) Fraction of OGs having tissue-specific expression in different tissues of adult stage. (d) Venn diagram showing the number and relationships of expressed OGs in root, stem, leaf, prickle, stamen, and pistil ovary.
-
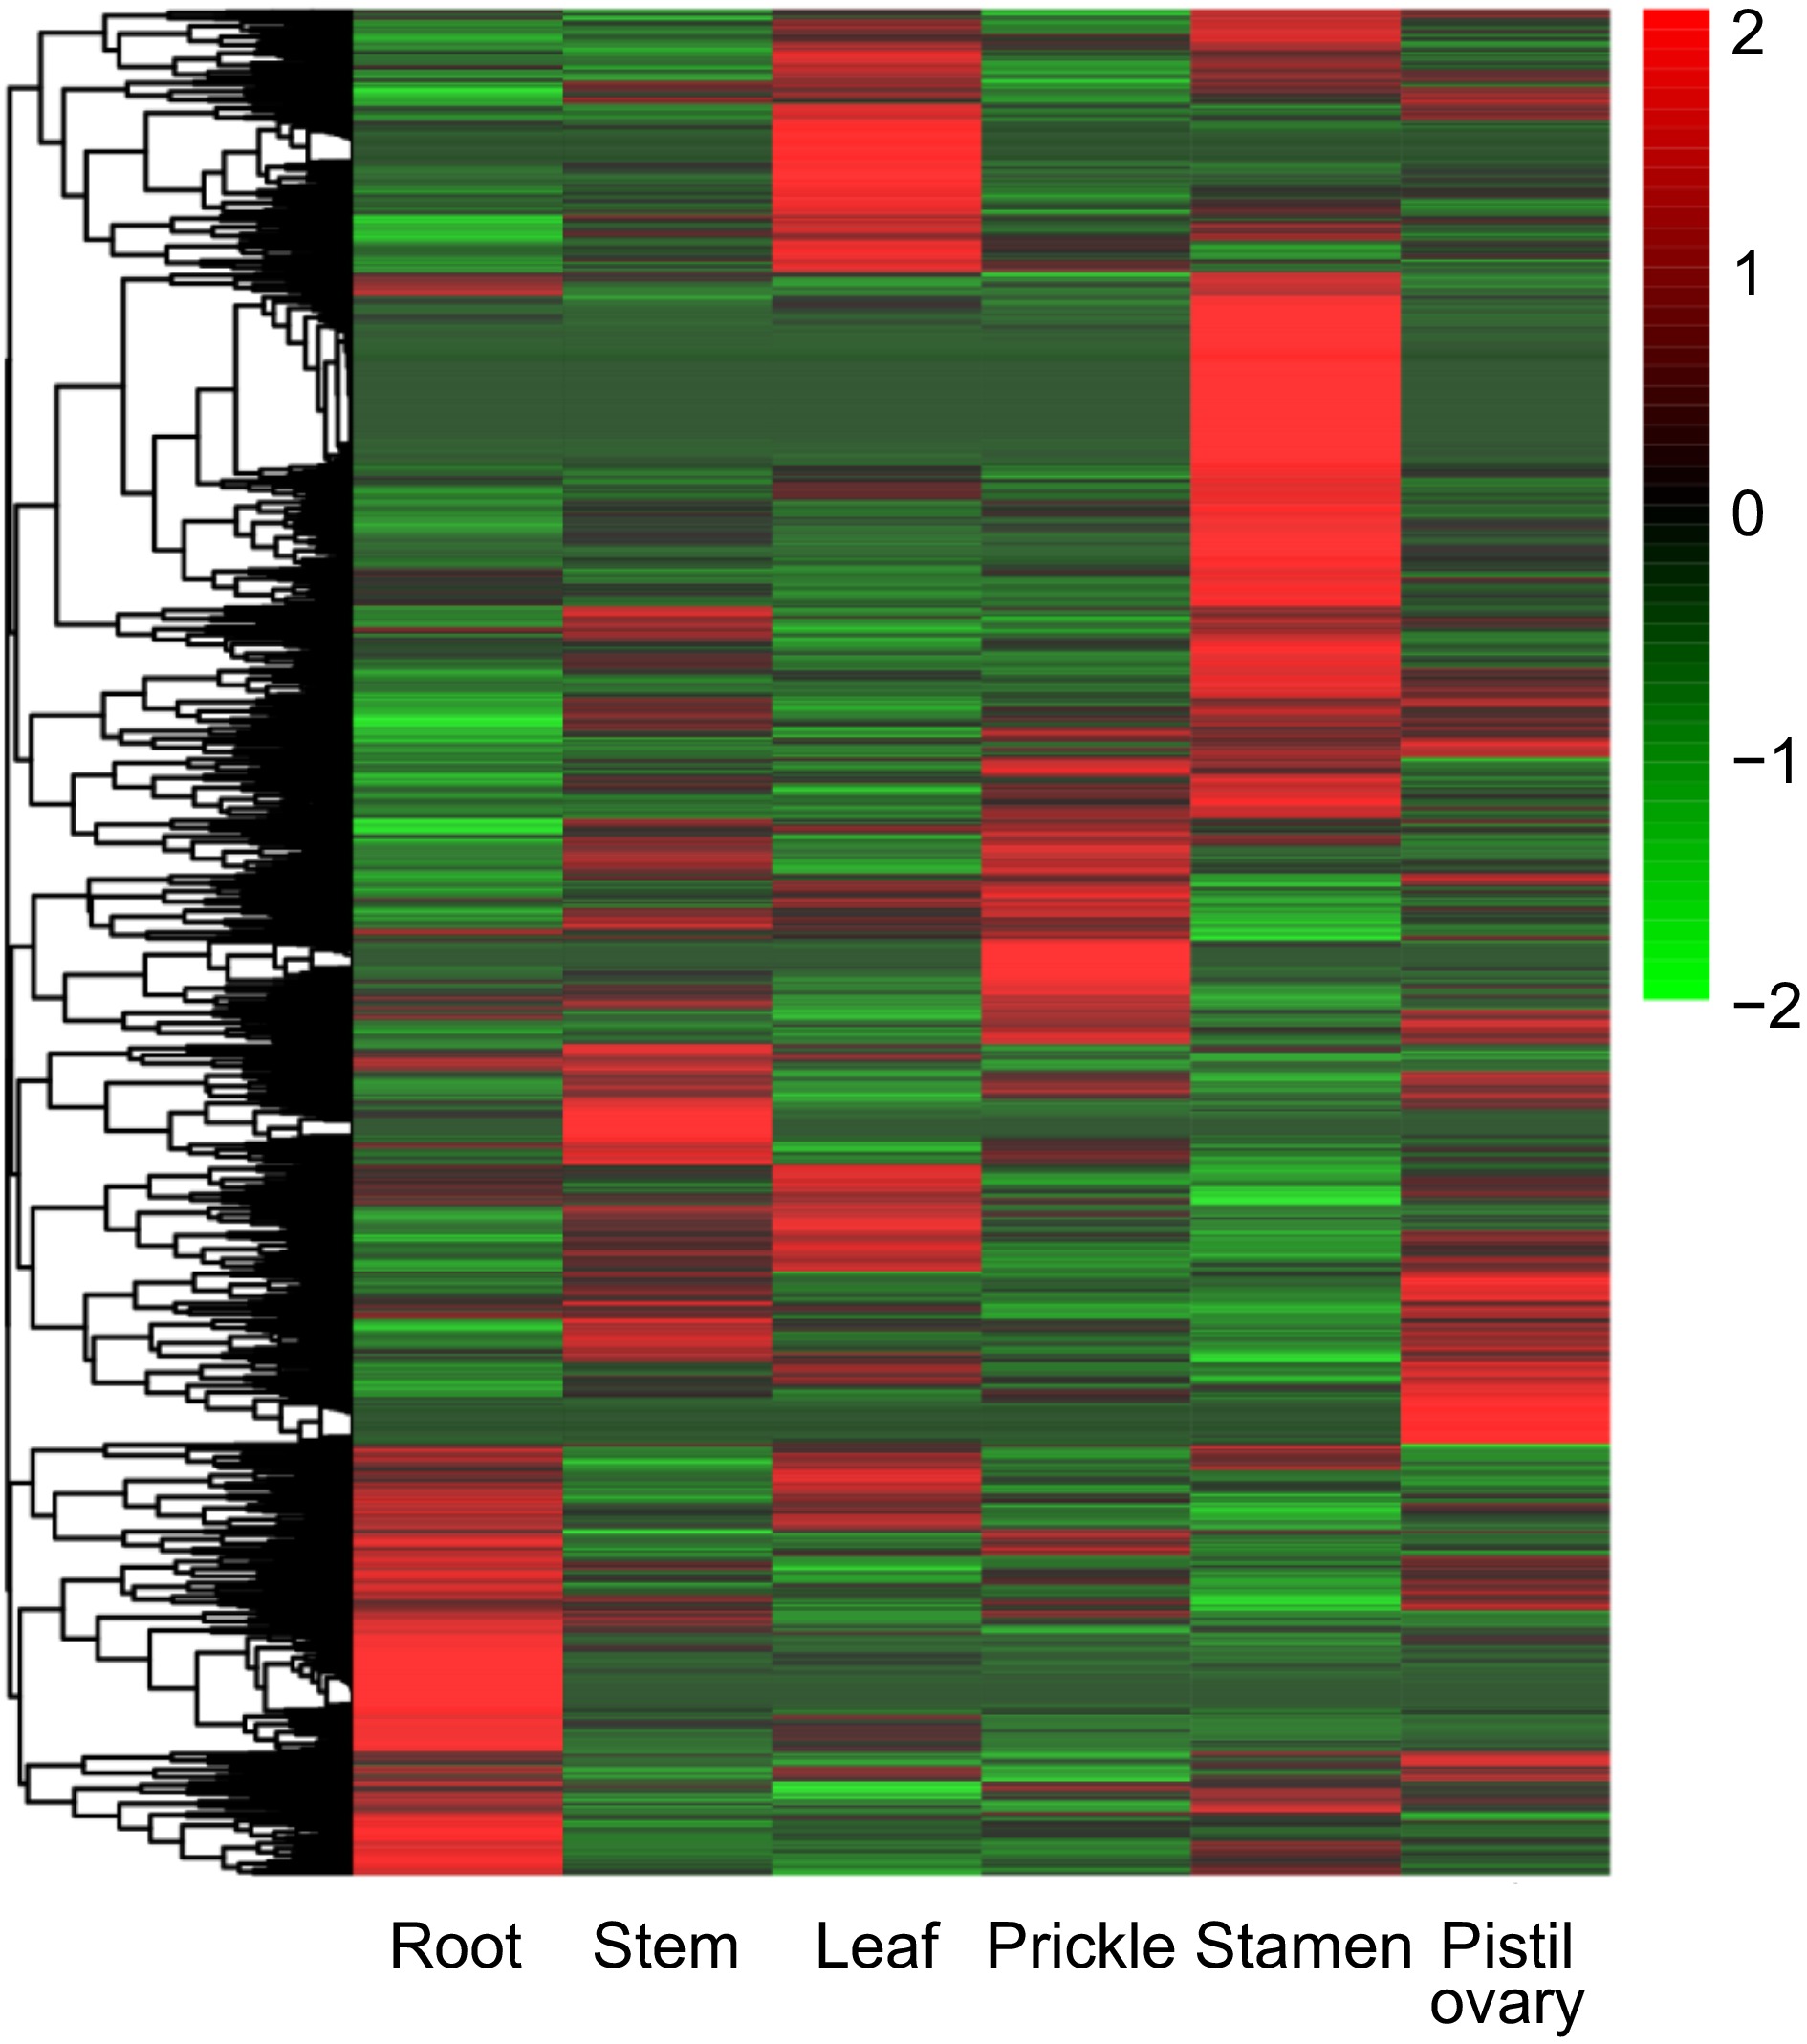
Figure 6.
Expression pattern of orphan genes in different tissues includes root, stem, leaf, prickle, stamen, and pistil ovary of R. chinensis.
-
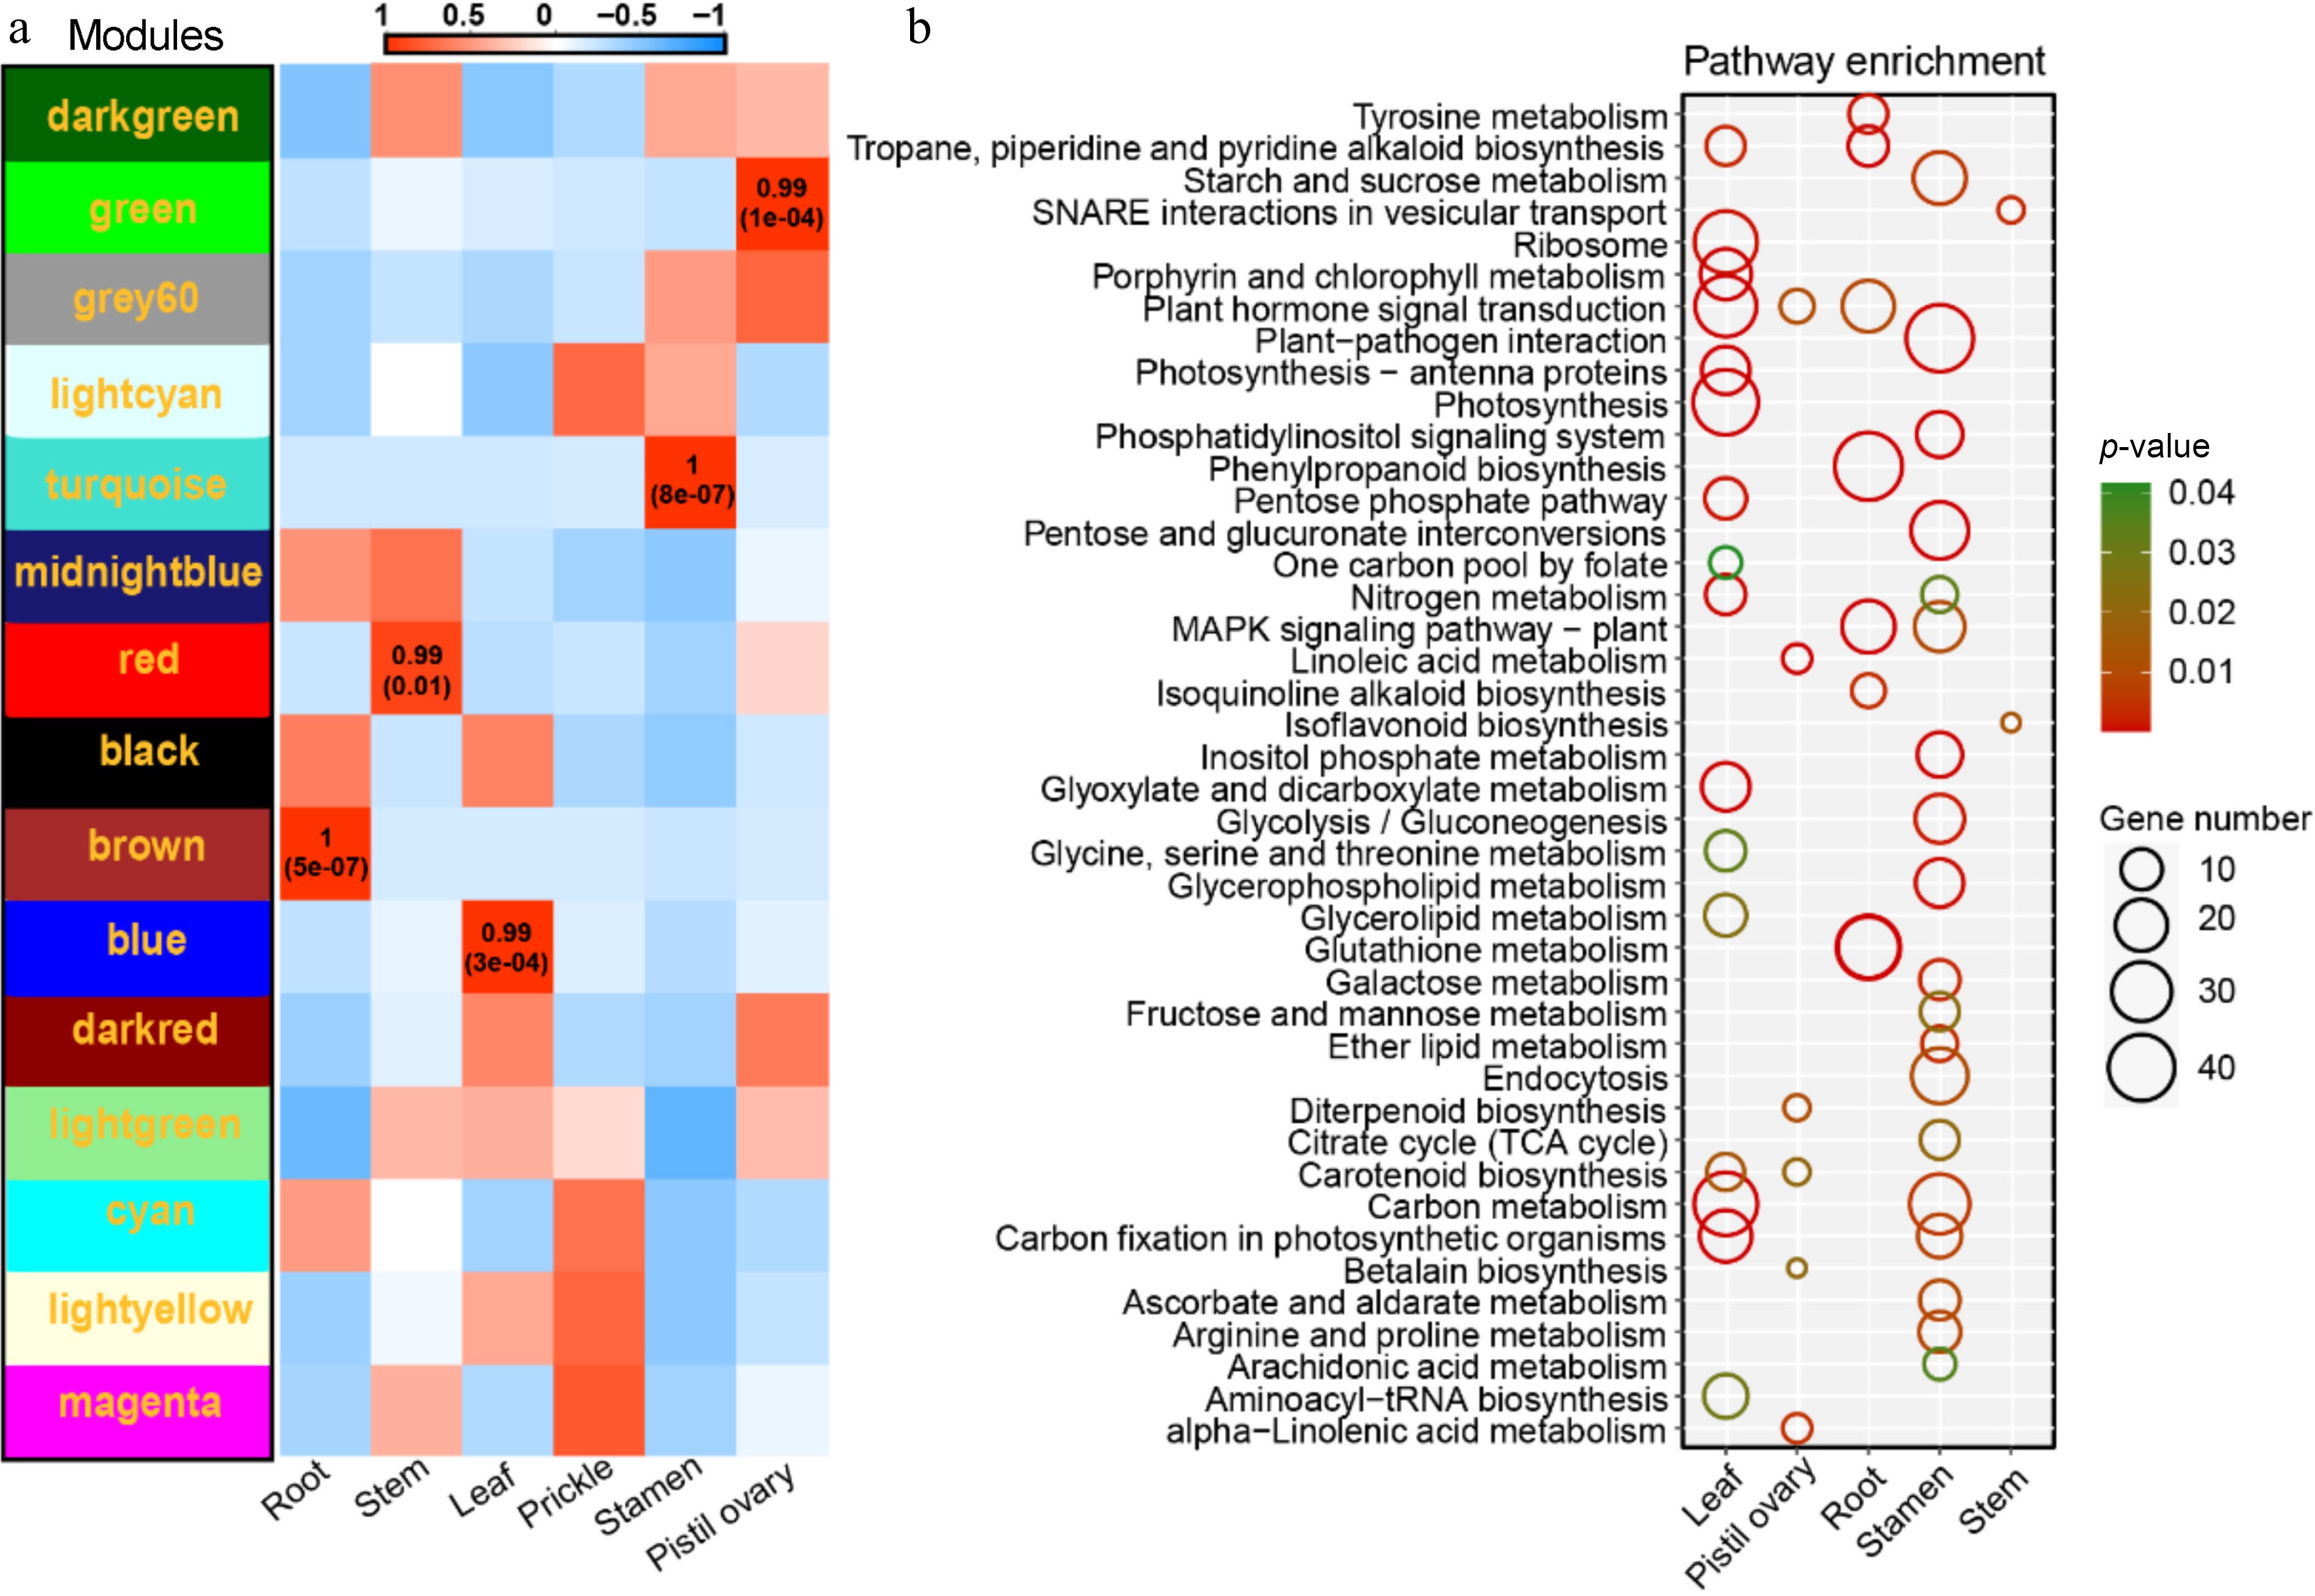
Figure 7.
Co-expression network analyses. (a) Heat map of module-tissue relationship. (b) KEGG enrichment analysis of five tissue-specific modules, include KEGG enrichment analysis result of MEblue module genes (leaf). KEGG enrichment analysis result of MEgreen module genes (pistil ovary). KEGG enrichment analysis result of MEbrown module genes (root). KEGG enrichment analysis result of MEturquoise module genes (stamen). KEGG enrichment analysis result of MEred module genes (stem).
-
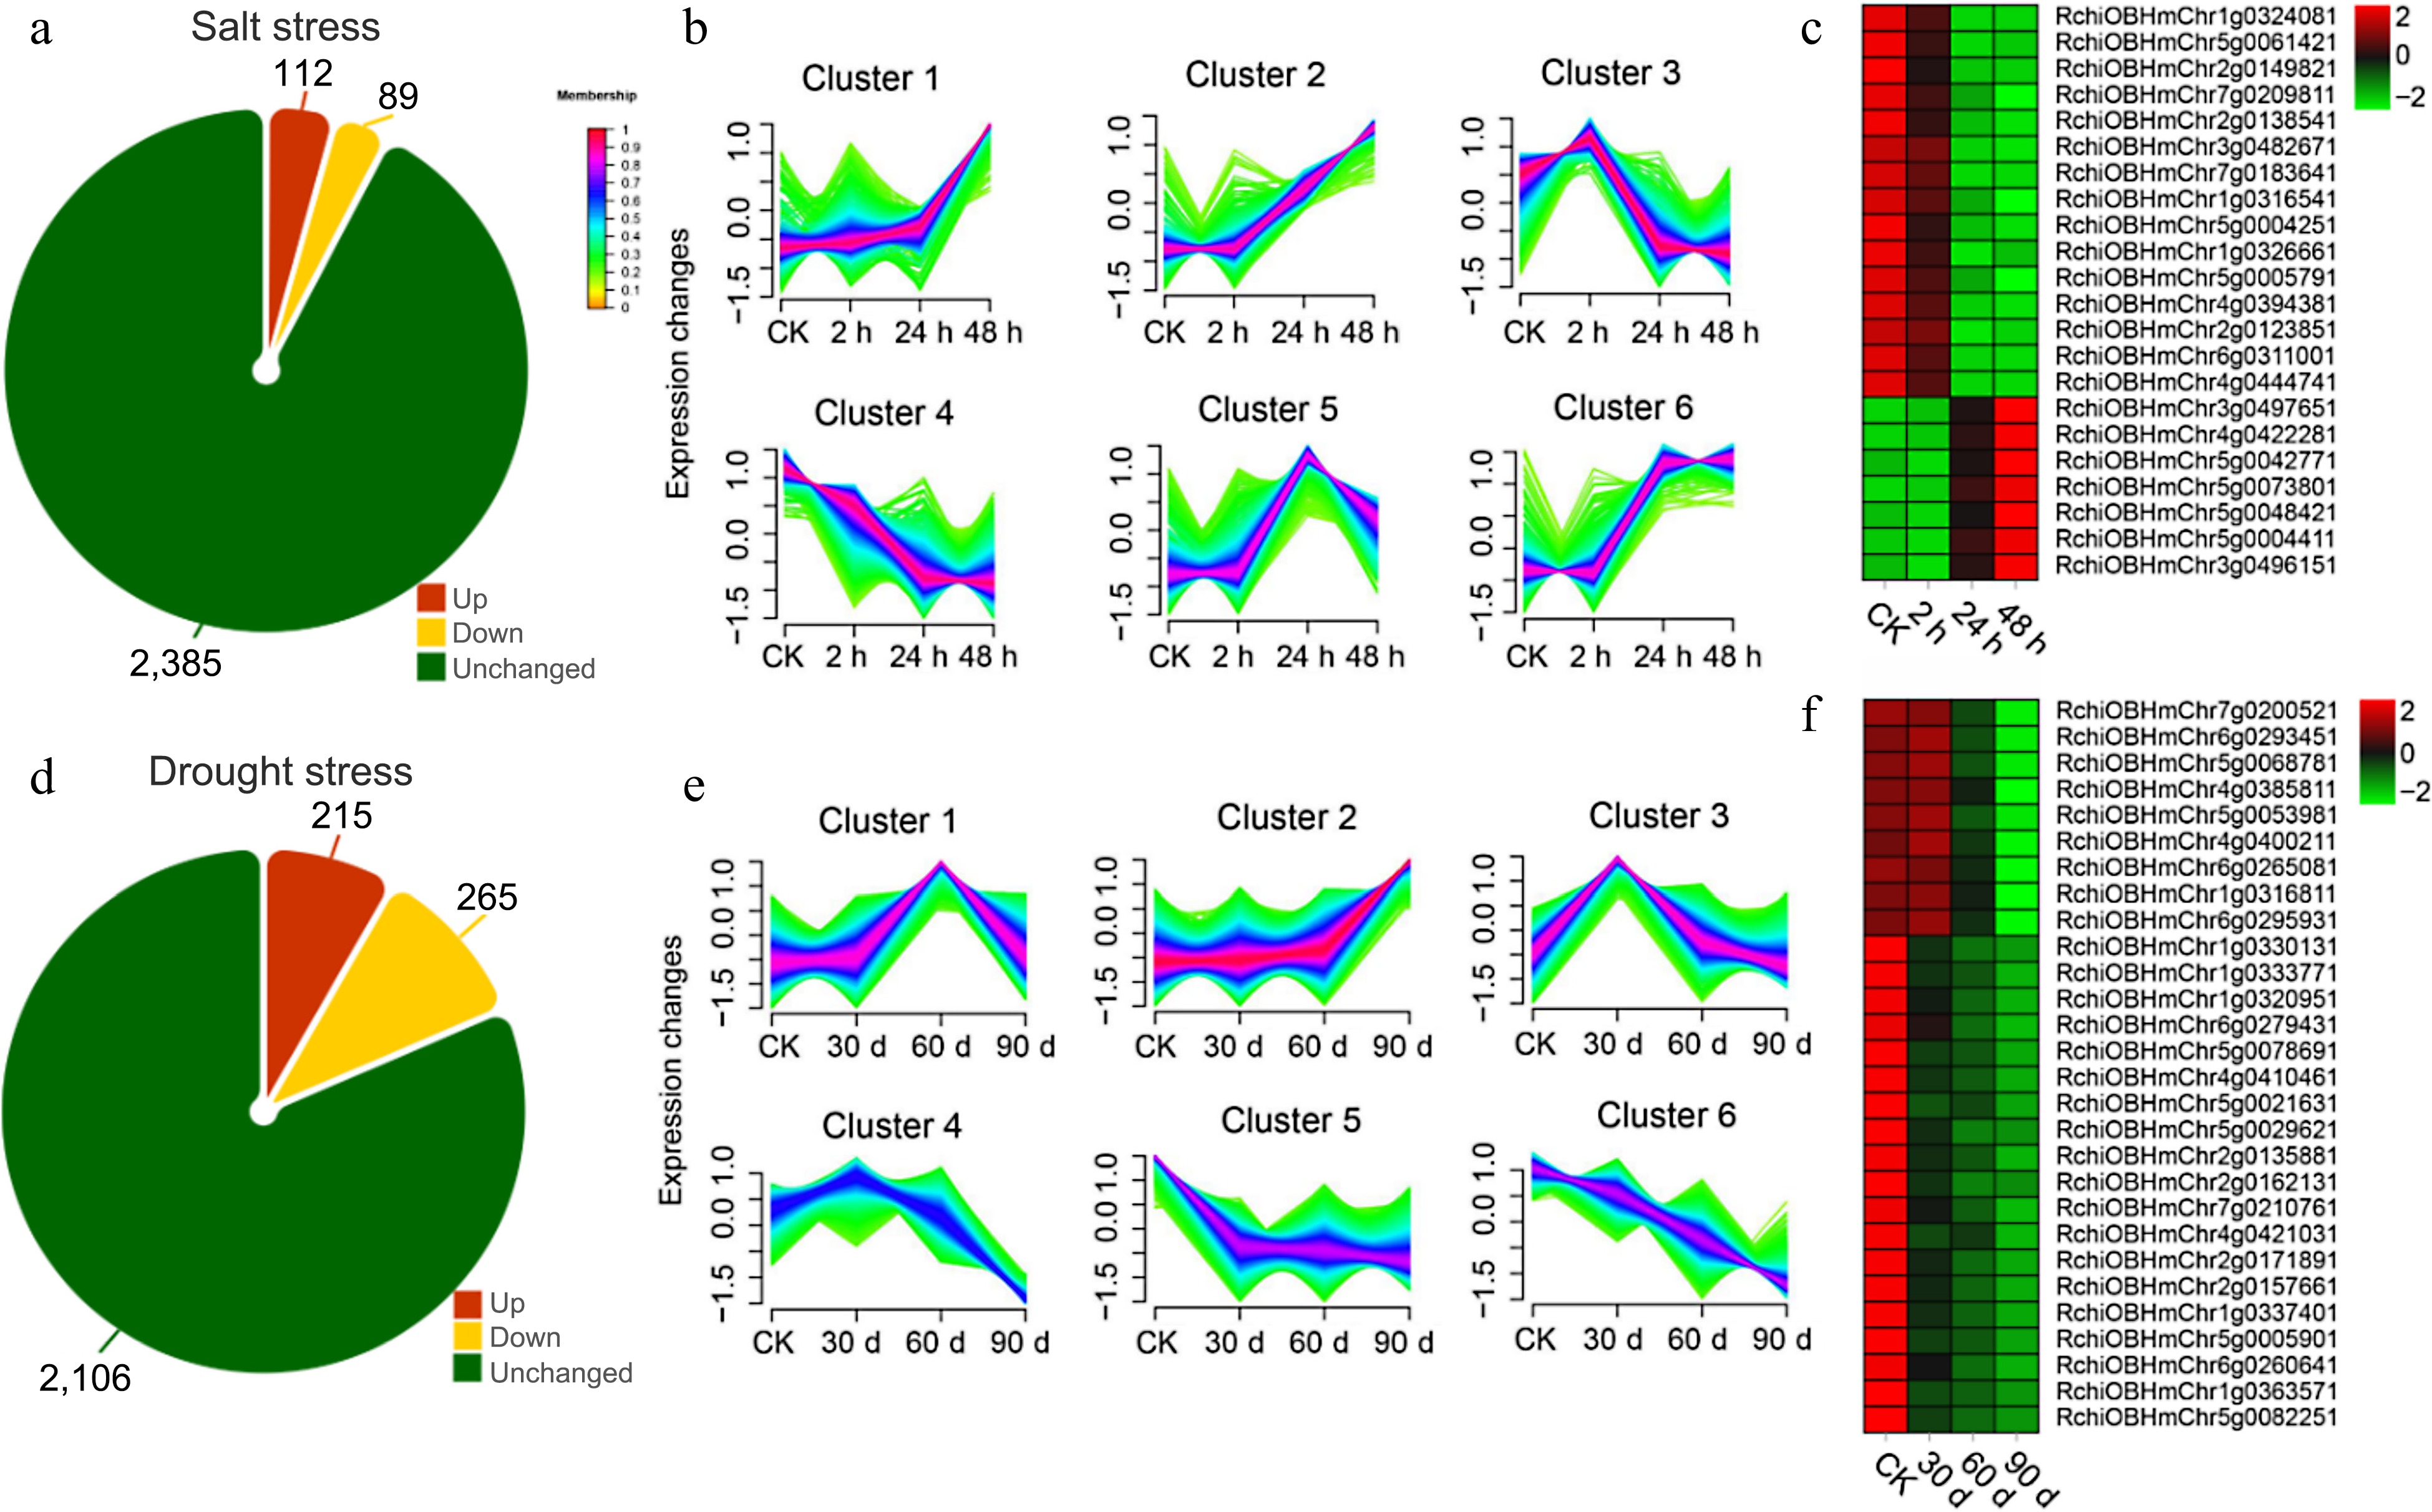
Figure 8.
Transcriptome analysis of orphan genes (OGs) under salt and drought stress. (a) Number of differentially expressed OGs under salt stress in leaves of R. chinensis. (b) Trends in the expression of differentially expressed genes at different time points under salt stress. (c) Heat map of the expression of OGs under the trend of pattern Cluster 2 and Cluster 4. (d) Number of differentially expressed OGs under drought stress in roots of R. chinensis. (e) Trends in the expression of differentially expressed genes at different time points under drought stress. (f) Heat map of the expression of OGs under the trend of pattern Cluster 1 and Cluster 3.
-
Items OGs NOGs Wilcox rank sum test
probabilityMean (SE) Median Mean (SE) Median Gene size (bp) 1,512.34 (1,736.26) 880 2,868.43 (2,590.26) 2,239 < 2.2e-16 Protein size (aa) 72.5 (32.17) 63 378.4 (306.51) 306 < 2.2e-16 Exons per gene 2.34 (1.99) 2 4.82 (4.74) 3 < 2.2e-16 Exon size (bp) 347.84 (385.78) 225.5 322.22 (423.62) 164 7.789e-15 Intron size (bp) 571.3 (998) 270 556.31 (731.19) 356 < 2.2e-16 Gene GC content (%) 39 (4.85) 38.05 40.31 (4.06) 39.46 < 2.2e-16 CDS GC content (%) 41.9 (6.47) 41.46 45.08 (4.54) 44.35 < 2.2e-16 Isoelectric point 8.53 (2.34) 8.64 7.42 (1.94) 7.21 < 2.2e-16 Table 1.
Genic features of orphan genes (OGs) compared with non-orphan genes (NOGs).
-
Type Cluster KEGG pathway p-value Salt stress Cluster 2 Alanine, aspartate and glutamate metabolism 0.011861 Base excision repair 0.013442 Pentose and glucuronate interconversions 0.016805 Ubiquinone and other terpenoid-quinone biosynthesis 0.032602 Cluster 4 Glutathione metabolism 0.006557 ABC transporters 0.007274 Brassinosteroid biosynthesis 0.014615 MAPK signaling pathway 0.016903 Terpenoid backbone biosynthesis 0.023847 Glycine, serine and threonine metabolism 0.035604 Drought stress Cluster 1 Carbon metabolism 4.02E-06 Ubiquinone and other terpenoid-quinone biosynthesis 5.04E-05 Carbon fixation in photosynthetic organisms 5.22E-05 Riboflavin metabolism 0.000115 Pentose phosphate pathway 0.00284 Glyoxylate and dicarboxylate metabolism 0.008393 Steroid biosynthesis 0.03522 DNA replication 0.036059 Thiamine metabolism 0.043981 Cluster 3 Pyrimidine metabolism 0.002402 Aminoacyl-tRNA biosynthesis 0.019032 Purine metabolism 0.037451 Table 2.
Enriched KEGG pathway for R. chinensis orphan genes.
Figures
(8)
Tables
(2)