-

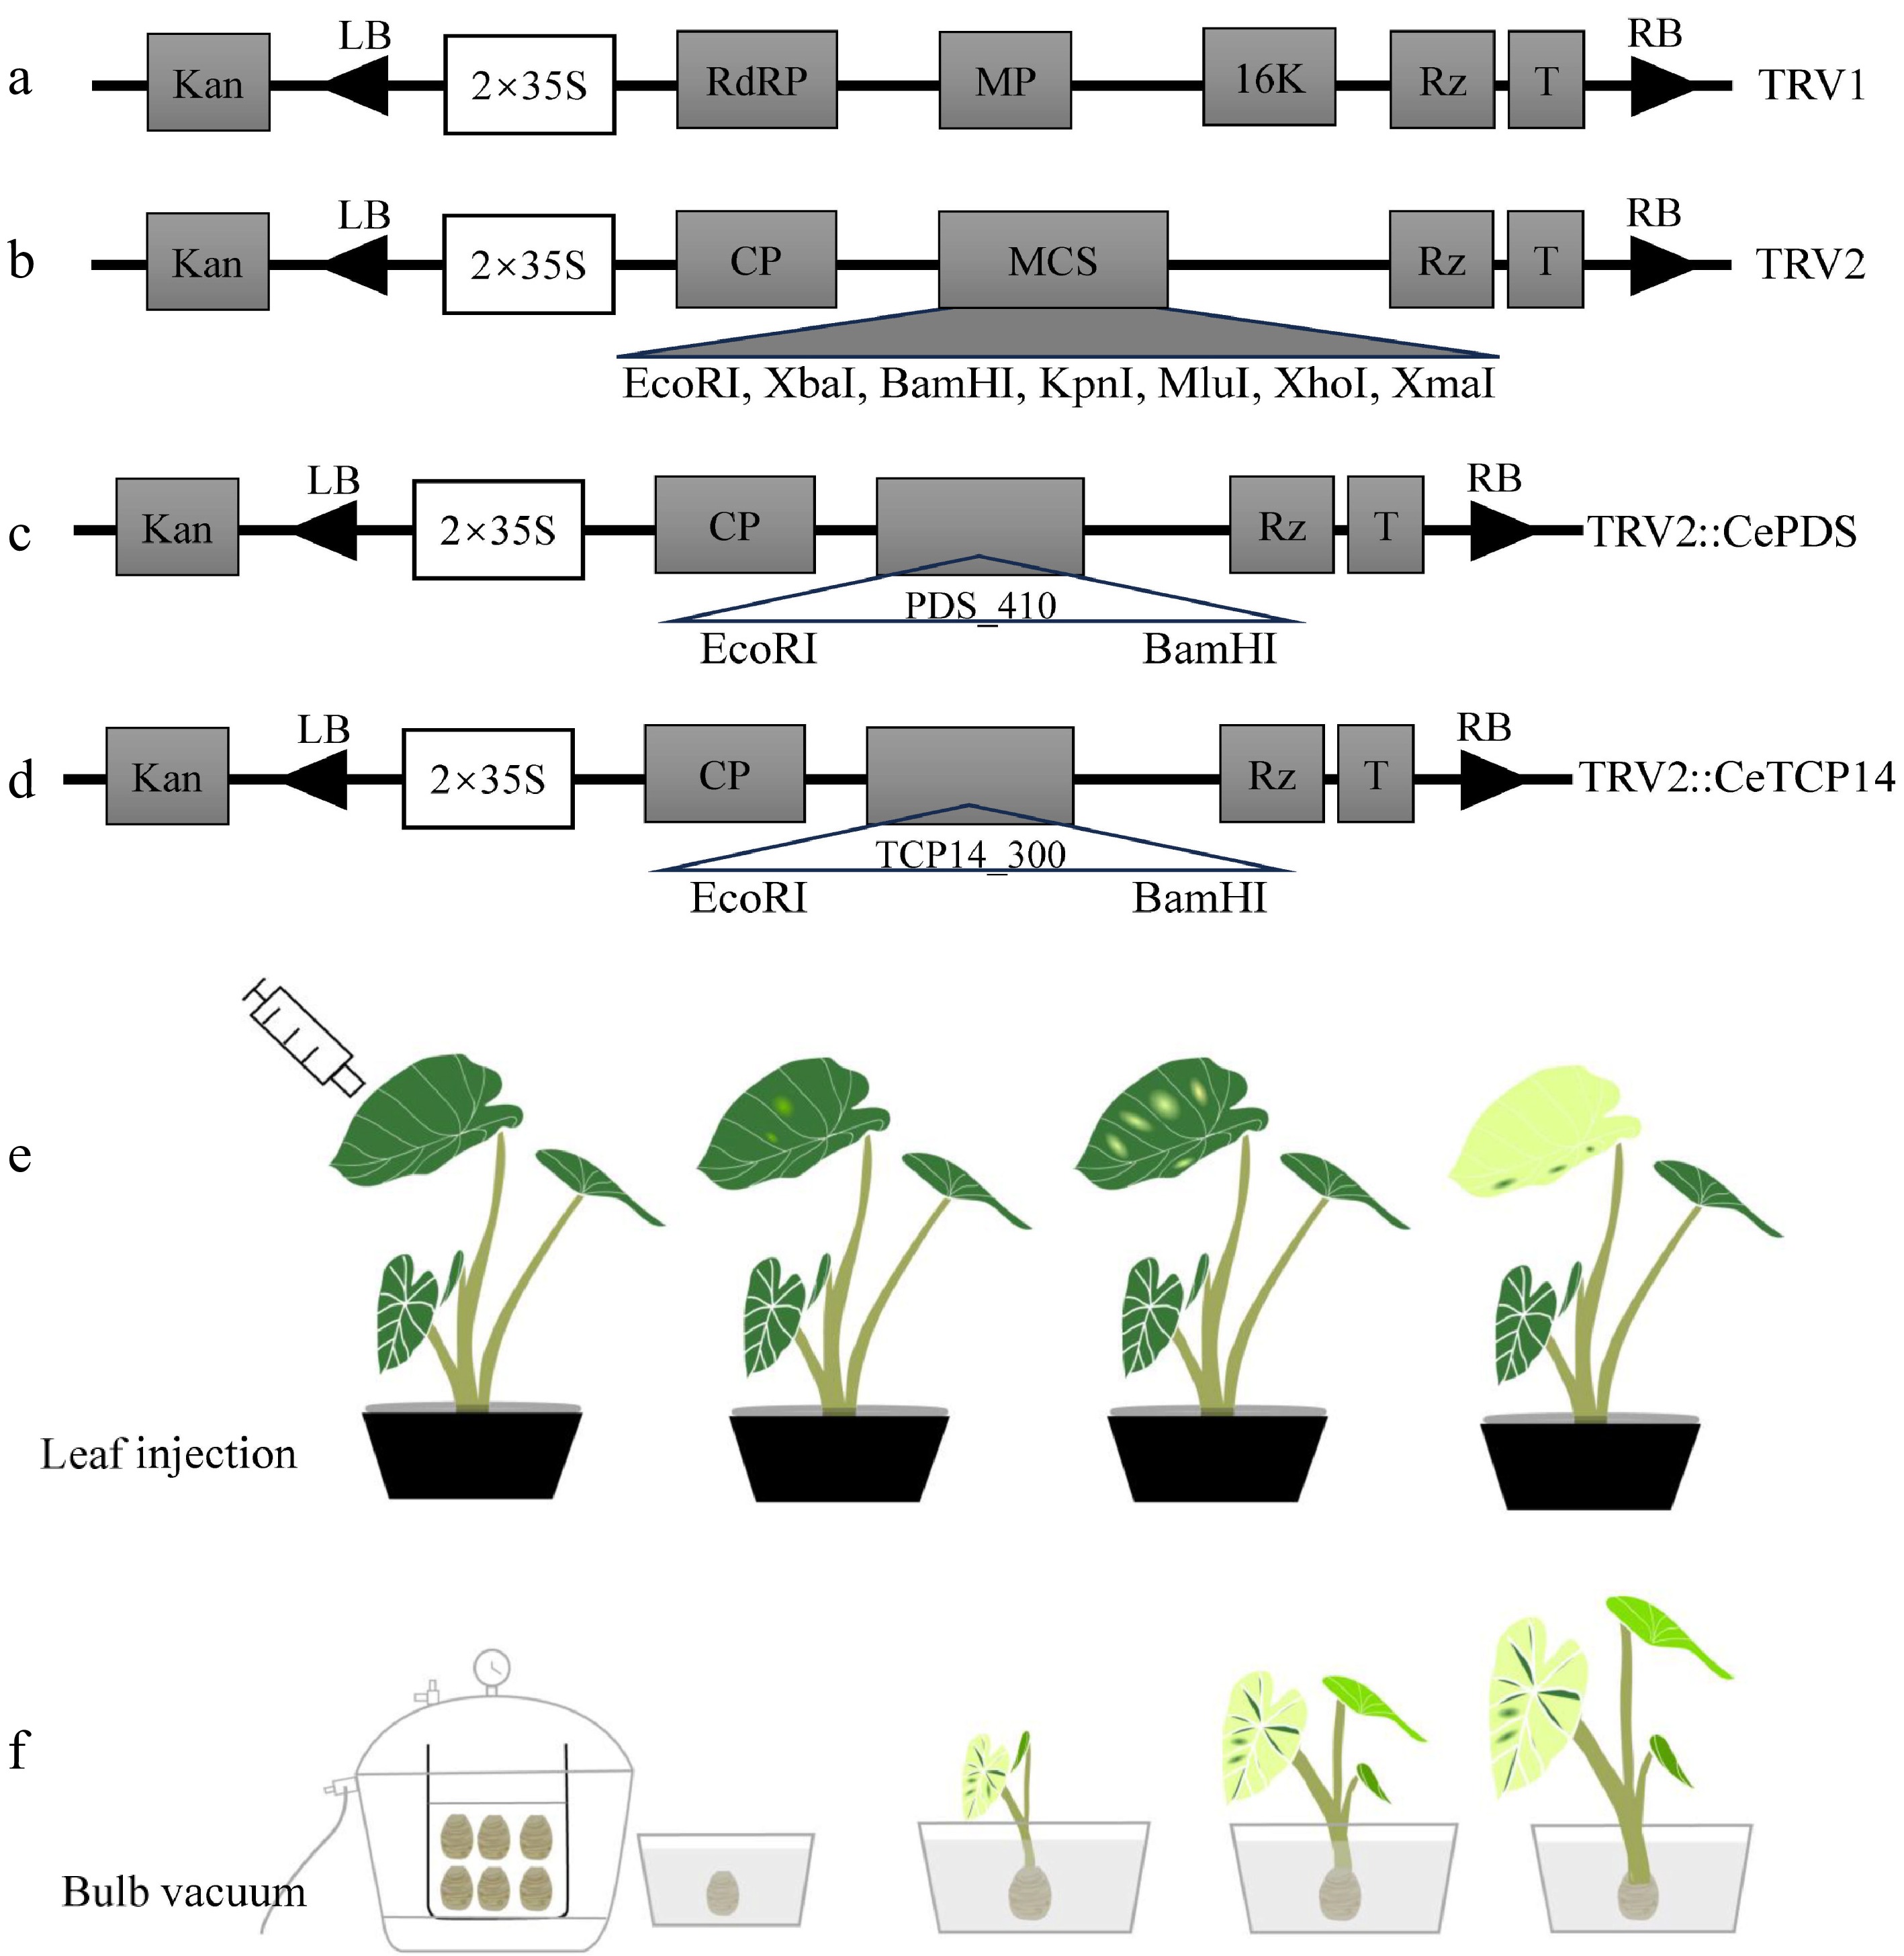
Figure 1.
Vectors used and infection flow chart in this study. The plasmid profile of (a) pTRV1, (b) pTRV2, (c) pTRV2::PDS410, (d) pTRV2::CeTCP14. Color change of leaves by (e) leaf injection and (f) bulb vacuum injection methods.
-

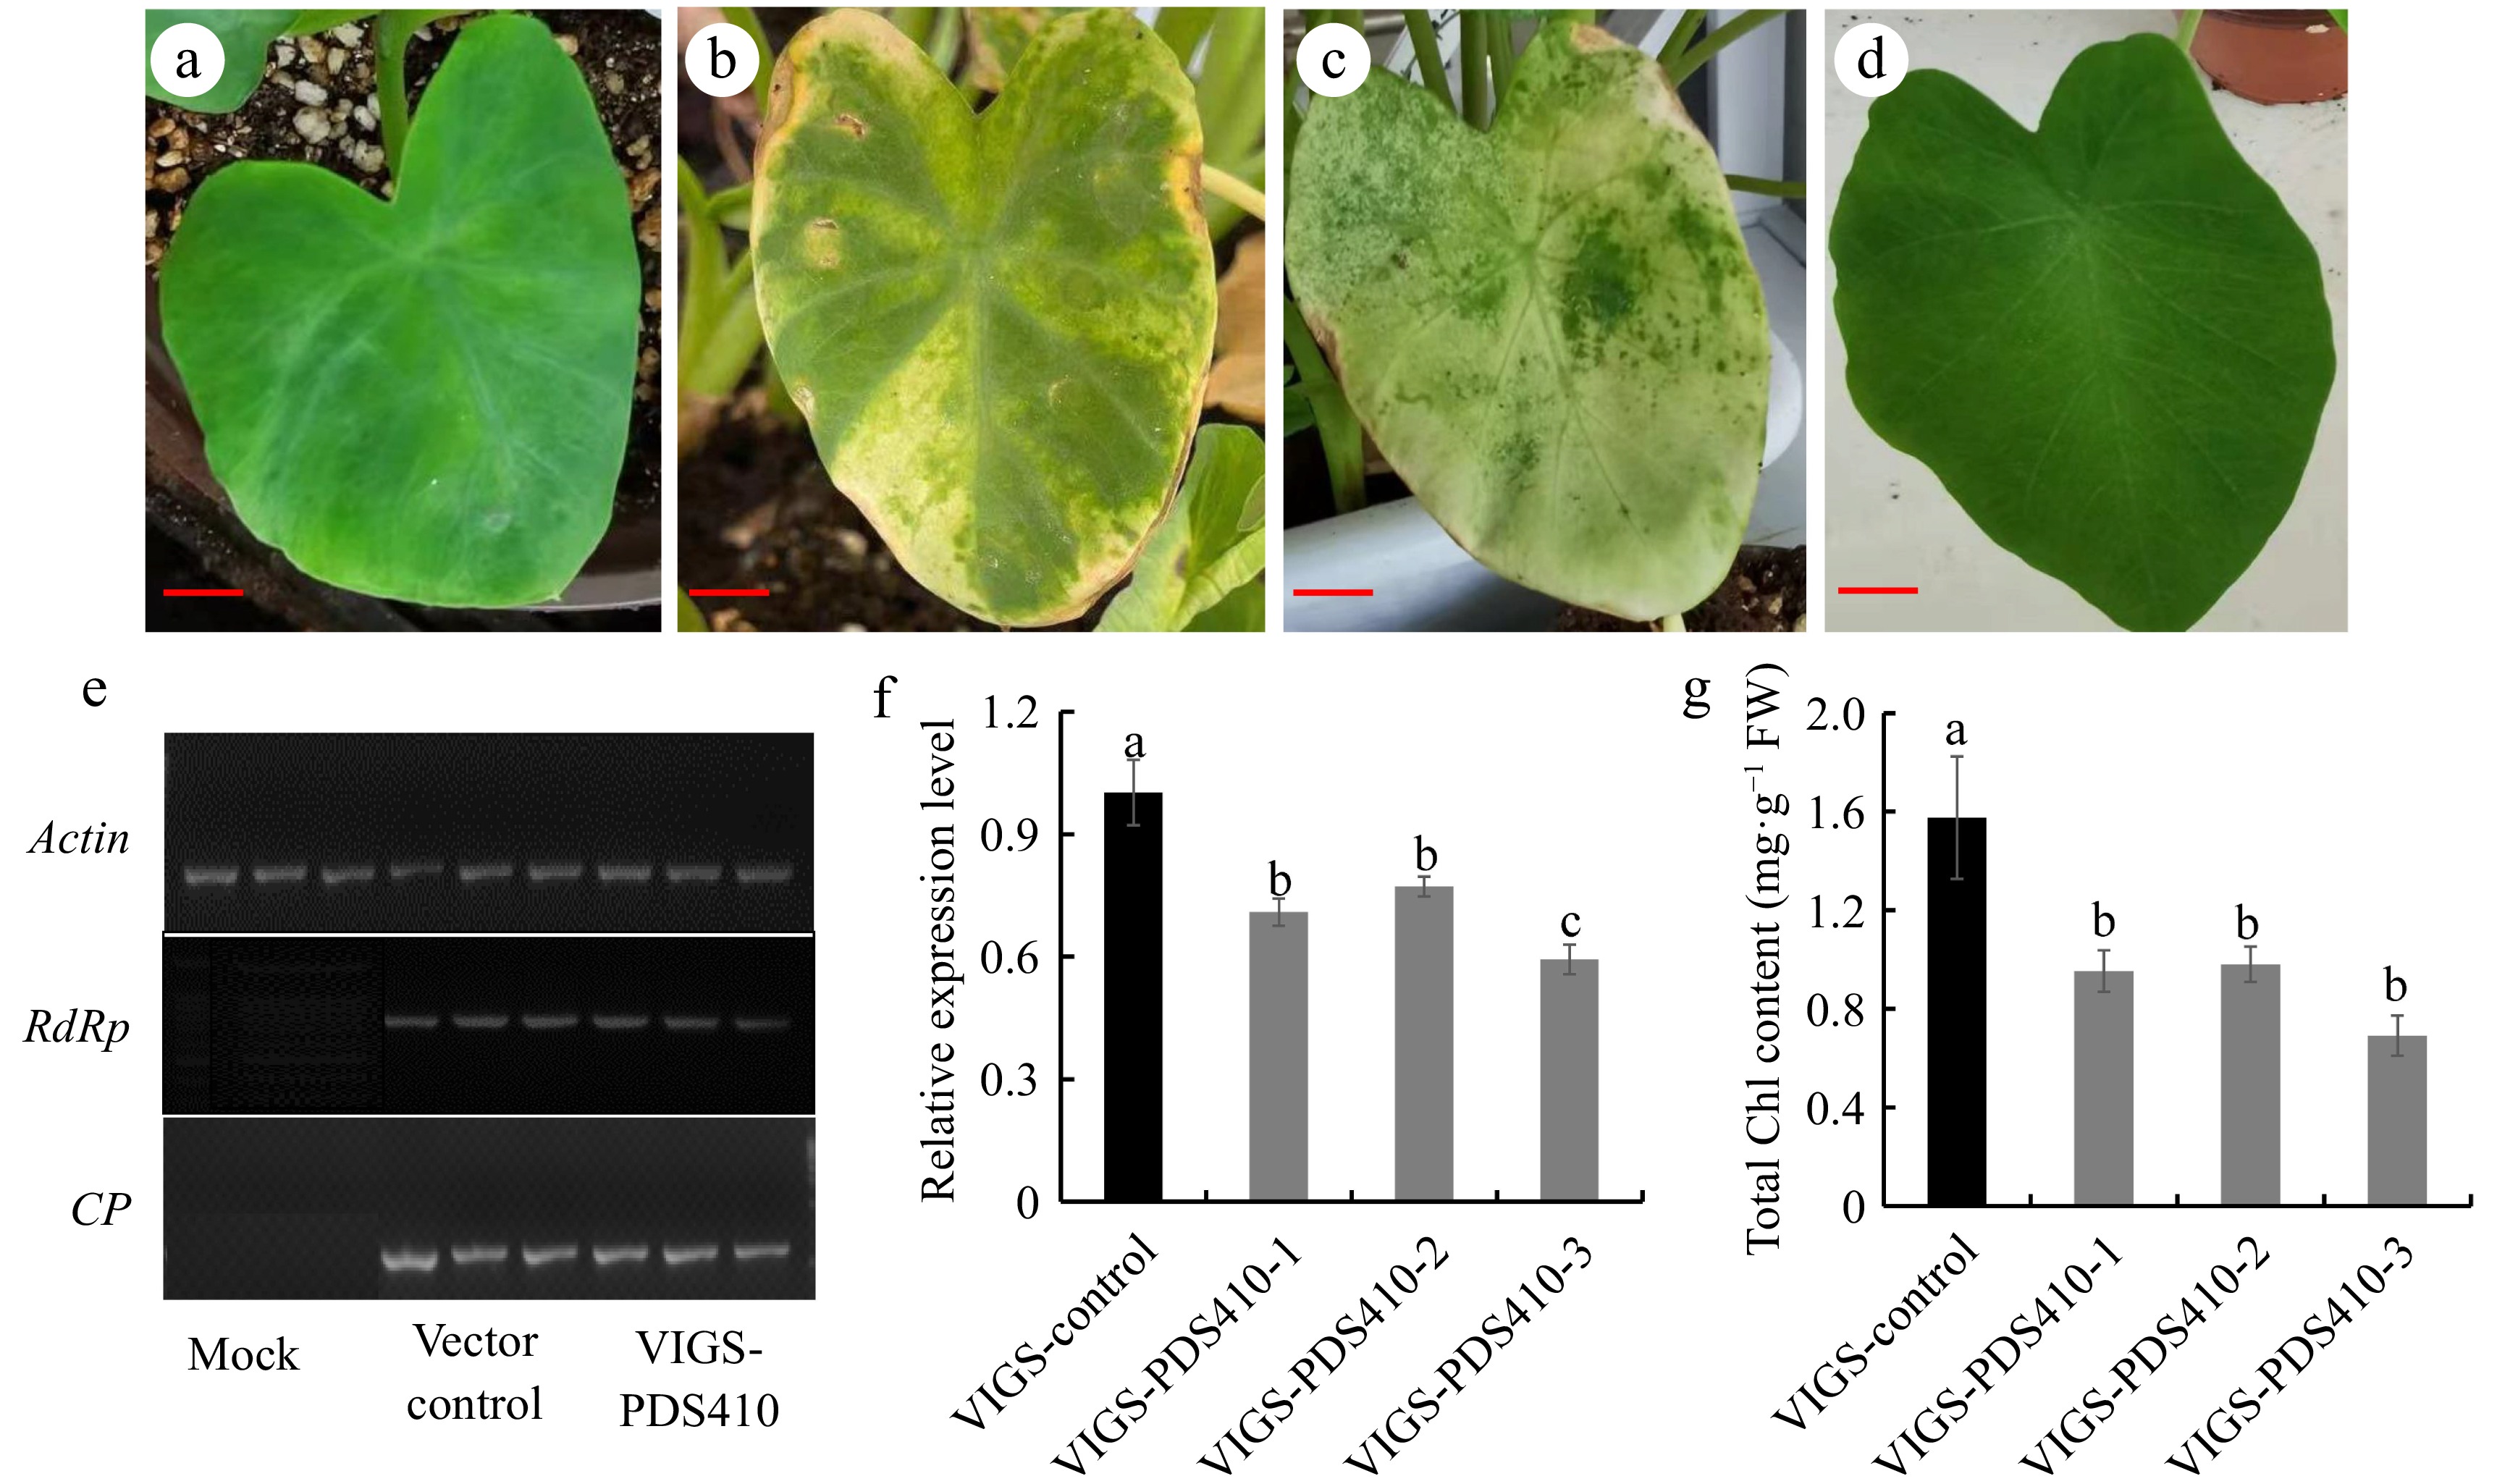
Figure 2.
VIGS system constructing in taro. (a) Empty vector phenotype at 20 d of leaf infection with OD600 = 0.6, (b) VIGS-PDS410 phenotype at 20d of leaf infection OD600 = 0.6, (c) VIGS-PDS410 phenotype at 30 d of leaf infection with OD600 = 0.6, (d) mock phenotype after 20 d infection, (e) RdRp gene expression in TRV1 and CP gene expression in TRV2 were detected by RT-PCR with actin as the internal reference, (f) detection of CePDS expression level for photobleaching phenotype plants, (g) chlorophyll content detection for photobleaching phenotype plants. Scale bars = 3 cm.
-

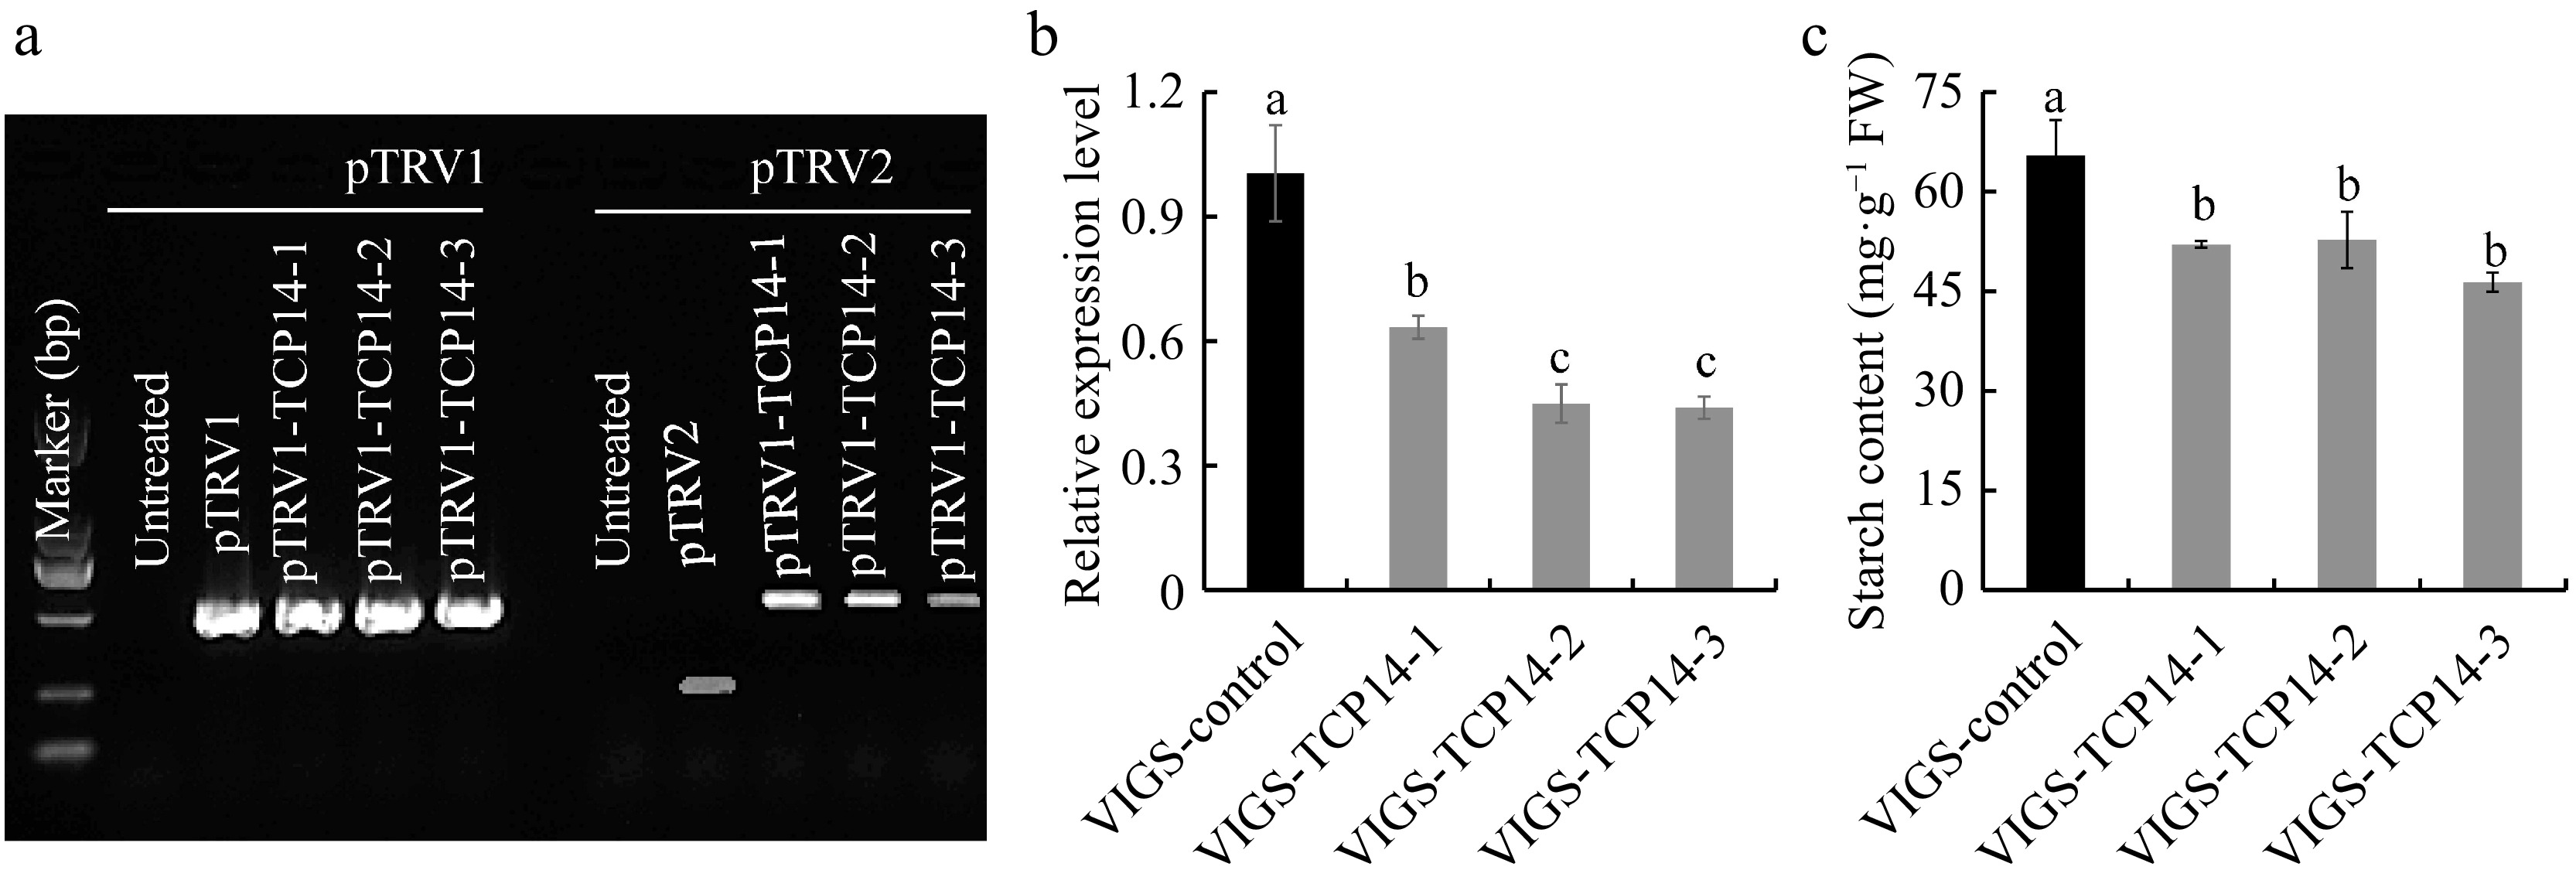
Figure 3.
Detection of taro VIGS system for CeTCP14 in Ganyu No. 2. (a) RdRp gene expression in pTRV1 and fragement expression in pTRV2 were detected by RT-PCR. (b) Detection of CeTCP14 expression at 20 d after bulb vacuum infiltration. (c) Starch content detection for VIGS-CeTCP14 plants.
-
Primer name Primer sequence (5'−3') Length (bp) Purpose CePDS-EcoRI-F GGAATTCATGGGCTTTACCAGTTCTCTTTCGG 410 Used for fragments amplified of CePDS and CeTCP14 inserted in TRV2 vector CePDS-BamHI-R CGGGATCCTCCAGCAATATAGGCTTATGACCTG TRV2-TCP14_F GTGAGTAAGGTTACCGAATTCATGGGGGAGAGCCACCAG 300 TRV2-TCP14_R CGTGAGCTCGGTACCGGATCCATCGACGGCCTTGCTGGG qCePDS-F GGTCGTTGGGGAGGAAGC 140 Used for the qRT-PCR of CePDS qCePDS-R TCTAGTCGGGCGTGGTGA qCeTCP14_F CCACACCGCCATCCAGTT 110 Used for the qRT-PCR of CeTCP14 qP_TCP14_R CGAGCTCGTCTATGGCGG CeActinF CTAGTGGTCGCACAACAGGT 191 Used for the qRT-PCR of reference genes CeActinR TTCACGCTCAGCAGTGGTAG TRV1F1 CGTGTTGCATTTCGATGAA 525 Used for the detection of RdRp in TRV1 TRV1R1 GACAACGCCACGATTAAGT TRV2F1 GTTGAAGAAGTTACACAGCA 407 Used for the detection of coat protein in TRV2 TRV2R1 TCTTCAACTCCATGTTCTCT pTRV2_F TGTCAACAAAGATGGACATTGTTAC 198 / 480 Used for the detection of TRV2 and TRV2-CeTCP14 expression pTRV2_R ACACGGATCTACTTAAAGAA TRV2_F TGTTACTCAAGGAAGCACGATGAGCT − Used for vector construction sequencing and colony PCR detection TRV2_R GTACAGACGGGCGTAATAACGCTTA Note: underline indicates cleavage sites, bold indicates protective bases. Table 1.
Primers used in this study
-
OD600 Total number of inoculation plants Number of photobleaching phenotype The percentage of
photobleaching phenotype0 10 0 d 0 0.6 30 3.00 ± 1.00 c 10% 0.8 30 5.33 ± 0.58 b 17.77% 1.0 30 8.33 ± 0.58 a 27.77% 1.2 30 7.67 ± 0.58 a 25.57% Table 2.
Bacterial concentrations optimization for the VIGS system.
-
Infection type Total number of inoculation plants Number of photobleaching phenotype The percentage of
photobleaching phenotypeLeaf injection 30 8.33 ± 0.58 a 27.77% Bulb evacuation 30 8.00 ± 0.58 a 26.67% Table 3.
Comparison of the VIGS system based on infection type.
Figures
(3)
Tables
(3)