-

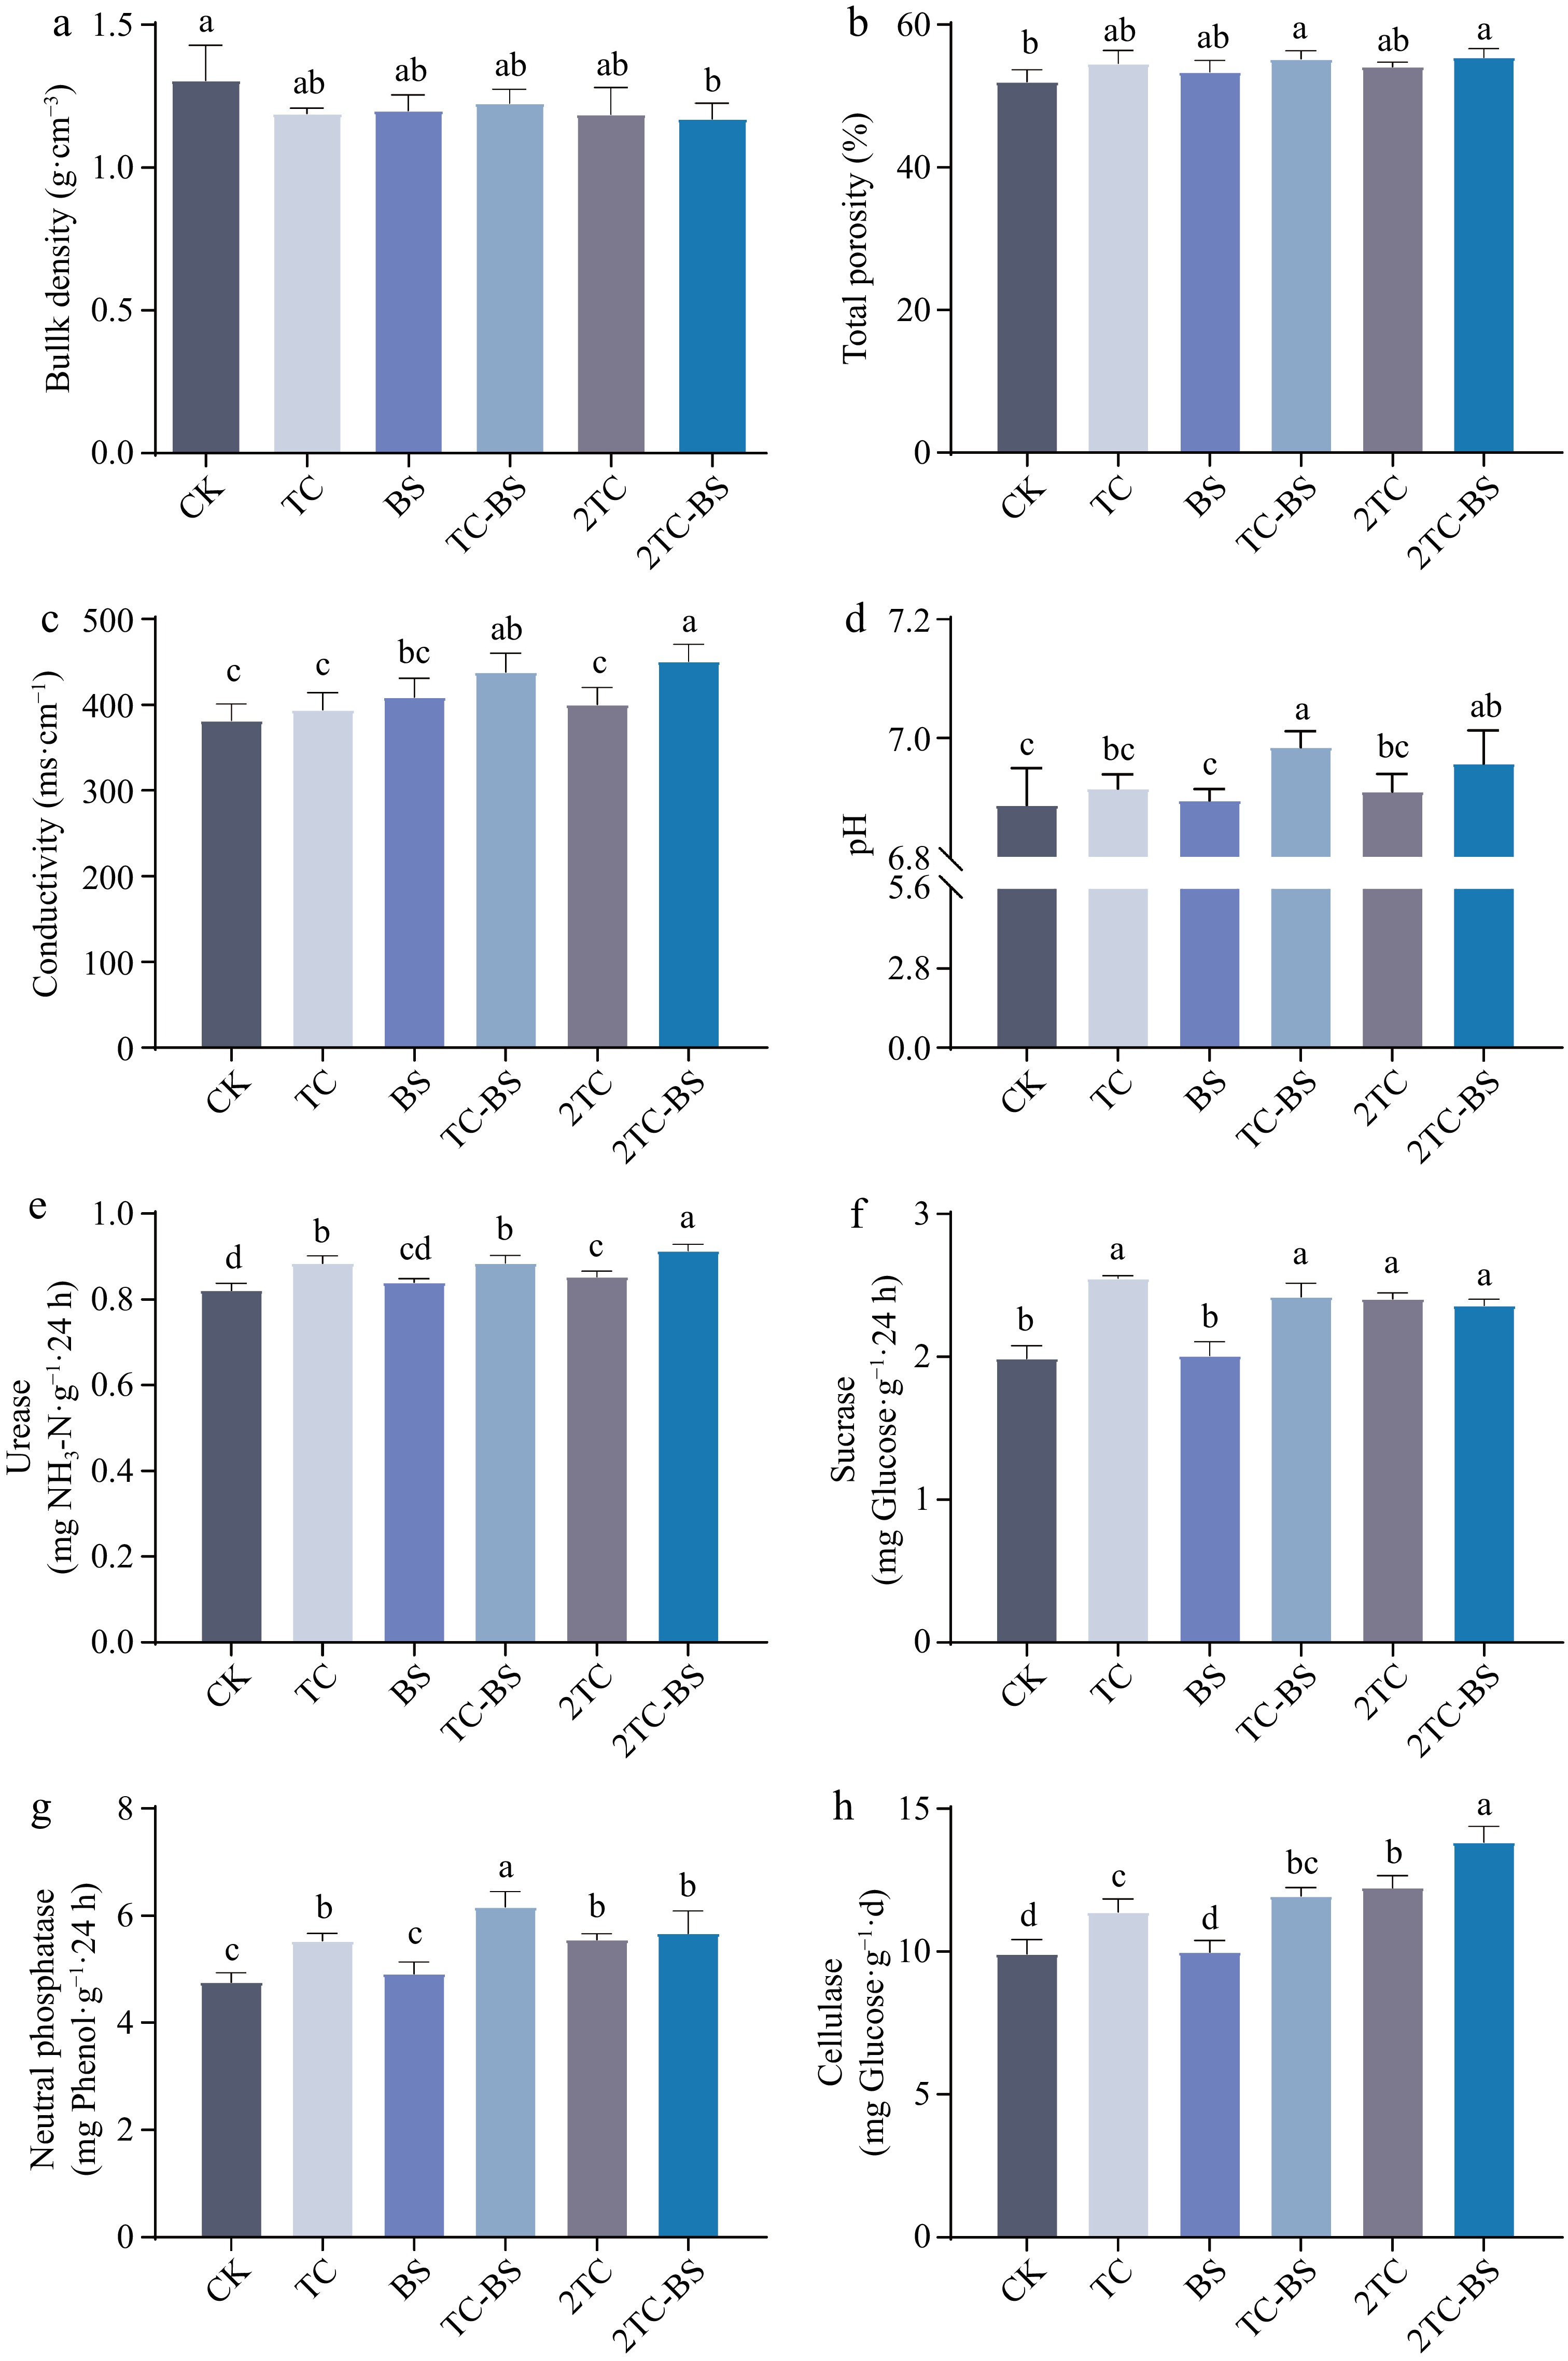
Figure 1.
Effects of different treatments on soil physical and chemical properties and soil enzyme activity. The different letters indicated significant differences as assessed by the Duncan test (p < 0.05; n ≥ 3). Conventional fertilization (CK), tomato residues (TC), B. subtilis (BS), tomato residues + B. subtilis (TC-BS), double tomato residues (2TC), and double tomato residues + B. subtilis (2TC-BS).
-

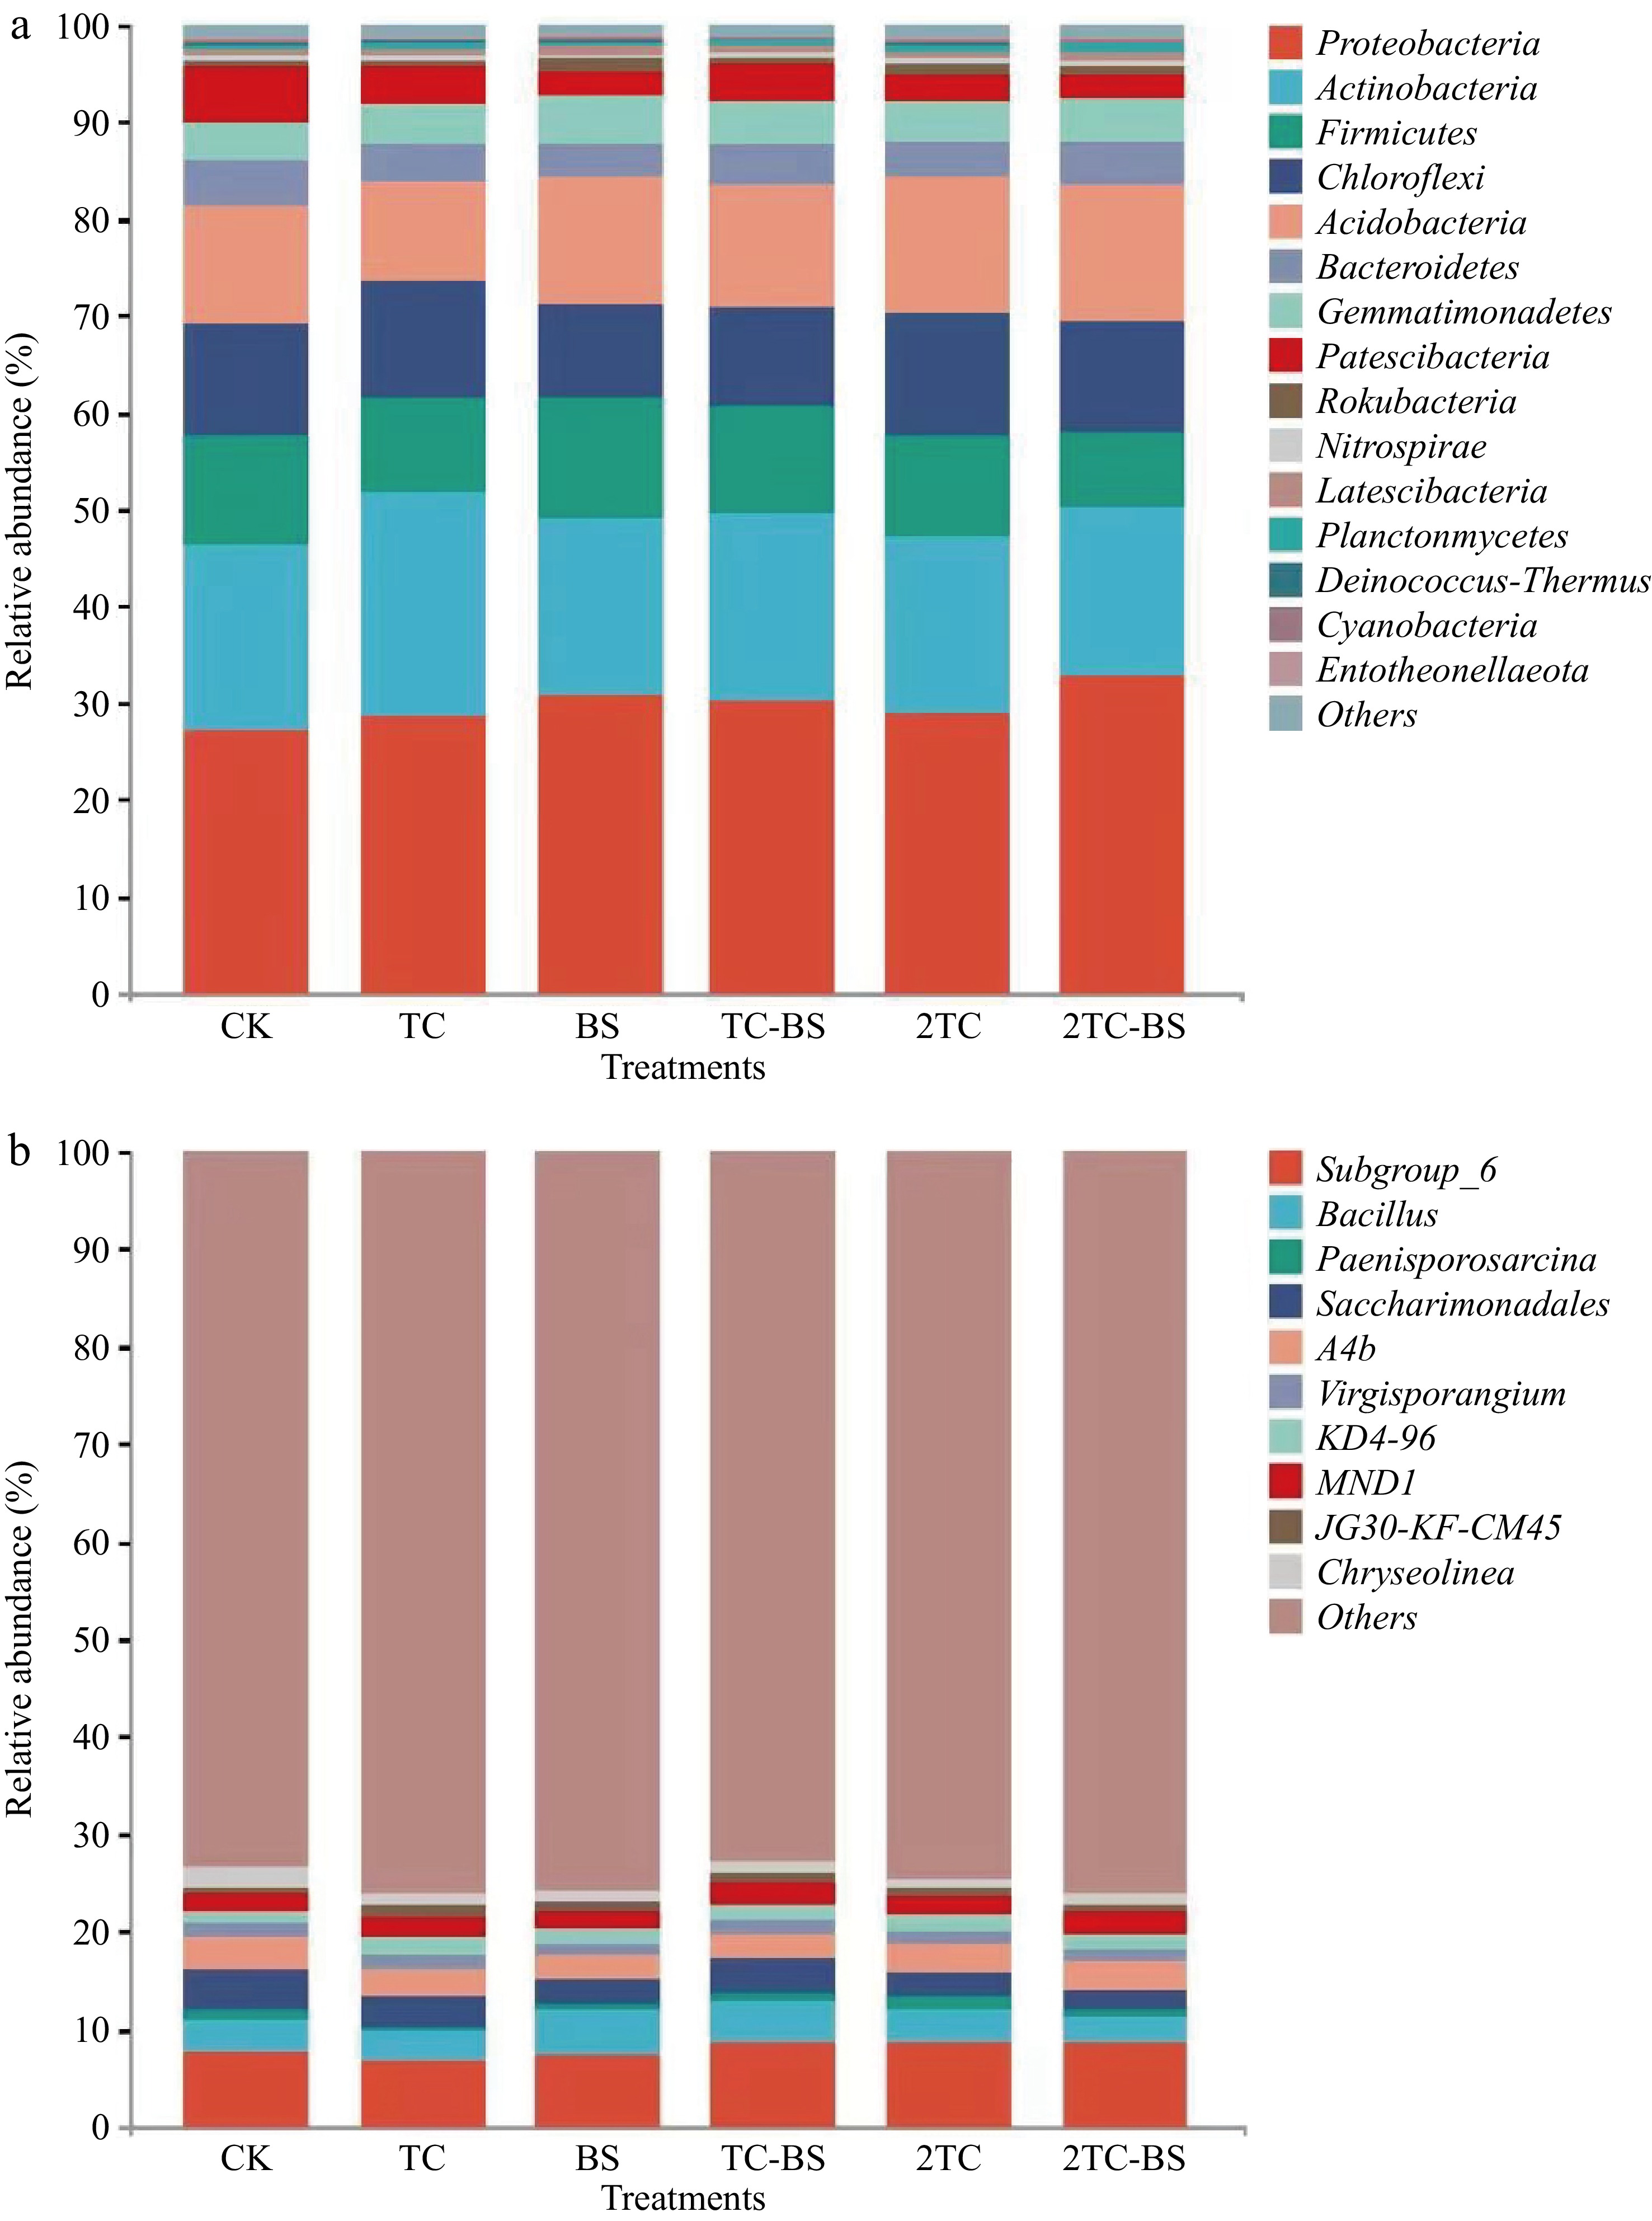
Figure 2.
Effects of the treatments on relative abundance of bacteria in soil at phyla and genera level. Conventional fertilization (CK), tomato residues (TC), B. subtilis (BS), tomato residues + B. subtilis (TC-BS), double tomato residues (2TC), and double tomato residues + B. subtilis (2TC-BS).
-

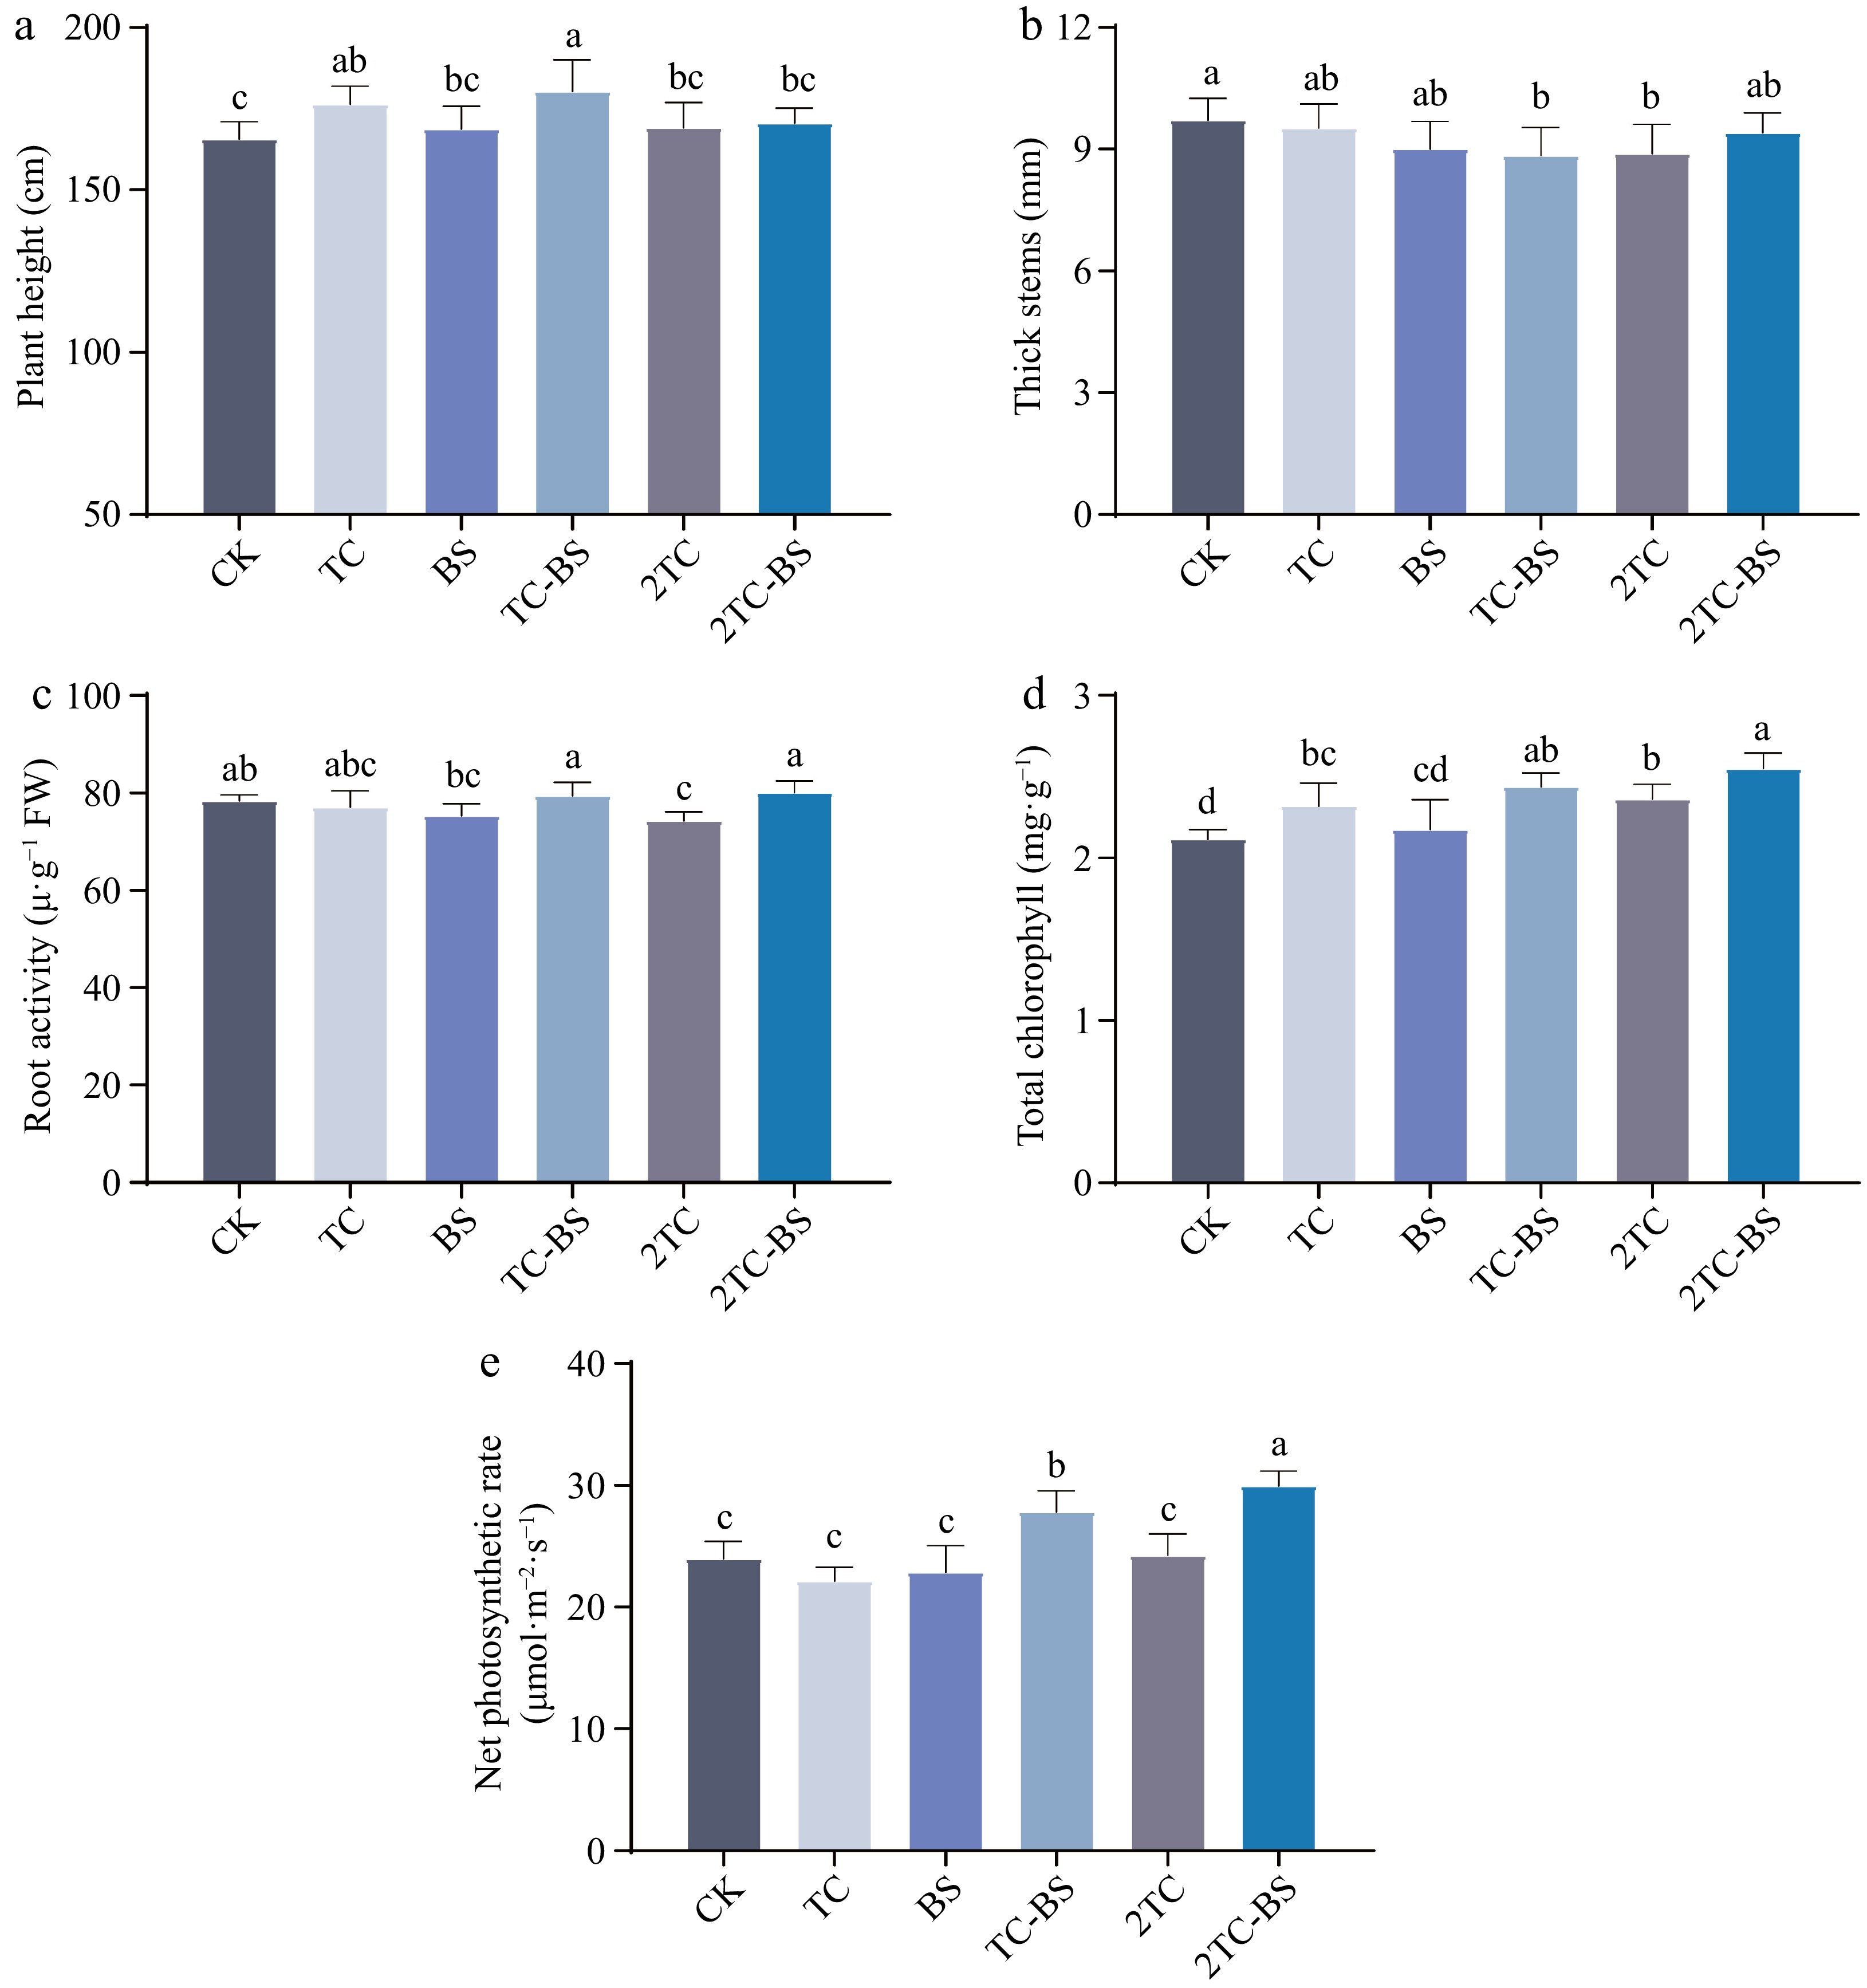
Figure 3.
Effects of the different treatments on the growth and physiology of the tomato. The different letters indicated significant differences as assessed by the Duncan test (p < 0.05; n ≥ 3), conventional fertilization (CK), tomato residues (TC), B. subtilis (BS), tomato residues + B. subtilis (TC-BS), double tomato residues (2TC), and double tomato residues + B. subtilis (2TC-BS).
-
Treaments Organic substance
(g·kg−1)Total sarbon
(g·kg−1)Total nitrogen
(g·kg−1)Alkali-hydro nitrogen
(mg·kg−1)C/N CK 23.29 ± 1.87 b 23.08 ± 1.44 c 2.88 ± 0.22 ab 265.97 ± 13.55 ab 7.96 ± 0.28 c TC 25.95 ± 1.01 a 27.03 ± 1.17 a 3.02 ± 0.12 a 281.51 ± 10.32 a 8.94 ± 0.24 b BS 24.45 ± 0.84 ab 22.63 ± 1.20 c 2.84 ± 0.13 ab 257.63 ± 9.68 b 7.98 ± 0.31 c TC-BS 24.67 ± 2.04 ab 26.17 ± 0.69 ab 2.63 ± 0.13 bc 264.23 ± 11.30 ab 9.98 ± 0.66 a 2TC 25.88 ± 1.59 a 25.09 ± 1.14 b 2.42 ± 0.21 b 268.42 ± 20.54 ab 10.41 ± 1.02 a 2TC-BS 25.05 ± 1.66 ab 25.15 ± 1.24 b 2.64 ± 0.21 bc 281.93 ± 9.46 a 9.60 ± 0.94 ab The different letters indicate significant differences as assessed by the Duncan test (p < 0.05; n ≥ 3), conventional fertilization (CK), tomato residues (TC), B. subtilis (BS), tomato residues + B. subtilis (TC-BS), double tomato residues (2TC), and double tomato residues + B. subtilis (2TC-BS). Table 1.
Effects of the different treatments on soil nutrient content.
-
Treatments Chao1 Goods_coverage Shannon Simpson CK 6,981.83 ± 202.57 bc 0.97 ± 0.01 ab 10.68 ± 0.18 a 0.99 ± 0.00 b TC 7,131.05 ± 378.01 abc 0.98 ± 0.01 ab 10.59 ± 0.30 a 1.00 ± 0.00 a BS 6,752.89 ± 333.69 c 0.98 ± 0.00 a 10.08 ± 0.64 a 0.99 ± 0.01 b TC-BS 7,456.27 ± 277.17 a 0.97 ± 0.00 b 10.48 ± 0.31 a 1.00 ± 0.00 a 2TC 7,515.53 ± 198.99 a 0.97 ± 0.00 b 10.67 ± 0.16 a 1.00 ± 0.00 a 2TC-BS 7,216.68 ± 296.77 ab 0.97 ± 0.00 b 10.64 ± 0.18 a 1.00 ± 0.00 a The different letters indicate significant differences as assessed by the Duncan test (p < 0.05; n ≥ 3), conventional fertilization (CK), tomato residues (TC), B. subtilis (BS), tomato residues + B. subtilis (TC-BS), double tomato residues (2TC), and double tomato residues + B. subtilis (2TC-BS). Table 2.
Effects of the different treatments on the alpha diversity of the soil bacteria.
-
Treatments Soluble solids
(%)Soluble sugars
(%)Titratable acid
(%)Sugar/acid Soluble protein
(mg·g−1)Vc
(ug·g−1)Lycopene
(ug·g−1)CK 6.46 ± 0.37 bc 6.86 ± 0.18 cd 0.62 ± 0.02 a 11.13 ± 0.44 c 1.17 ± 0.07 d 115.39 ± 4.59 c 22.06 ± 1.27 cd TC 7.14 ± 0.57 a 7.89 ± 0.78 b 0.60 ± 0.03 a 13.11 ± 1.89 b 1.72 ± 0.24 b 121.86 ± 4.38 b 23.32 ± 0.41 bc BS 5.90 ± 0.33 c 6.29 ± 0.73 d 0.57 ± 0.01 b 11.05 ± 1.17 c 1.01 ± 0.14 d 135.24 ± 3.82 a 20.76 ± 0.34 de TC-BS 6.64 ± 0.49 ab 8.10 ± 0.94 b 0.58 ± 0.01 b 14.00 ± 1.64 ab 1.96 ± 0.12 a 121.33 ± 4.37 bc 26.49 ± 0.68 a 2TC 6.72 ± 0.59 ab 7.75 ± 0.65 bc 0.58 ± 0.01 b 13.33 ± 0.96 ab 1.05 ± 0.01 d 123.78 ± 3.94 b 20.35 ± 1.17 e 2TC-BS 7.04 ± 0.59 ab 9.23 ± 0.62 a 0.61 ± 0.01 a 15.05 ± 0.96 a 1.43 ± 0.18 c 118.75 ± 1.99 bc 24.29 ± 1.17 b The different letters indicate significant differences as assessed by the Duncan test (p < 0.05; n ≥ 3), conventional fertilization (CK), tomato residues (TC), B. subtilis (BS), tomato residues + B. subtilis (TC-BS), double tomato residues (2TC), and double tomato residues + B. subtilis (2TC-BS). Table 3.
Effect of the different treatments on fruit quality of tomato.
-
Treatments Single fruit weight
(g·single fruit−1)Yield per plant
(kg·plant−1)Increased
productivityCK 97.60 ± 10.63 bc 2.05 ± 0.05 d − TC 90.62 ± 9.32 c 2.12 ± 0.05 c 3.44% BS 93.70 ± 11.38 bc 2.20 ± 0.03 bc 5.92% TC-BS 100.83 ± 10.32 abc 2.28 ± 0.07 a 10.98% 2TC 116.70 ± 7.40 a 2.25 ± 0.04 b 7.09% 2TC-BS 113.26 ± 11.76 ab 2.28 ± 0.04 a 10.95% The different letters indicate significant differences as assessed by the Duncan test (p < 0.05; n ≥ 3), conventional fertilization (CK), tomato residues (TC), B. subtilis (BS), tomato residues + B. subtilis (TC-BS), double tomato residues (2TC), and double tomato residues + B. subtilis (2TC-BS). Table 4.
Effects of the different treatments on tomato fruit yield.
Figures
(3)
Tables
(4)