-
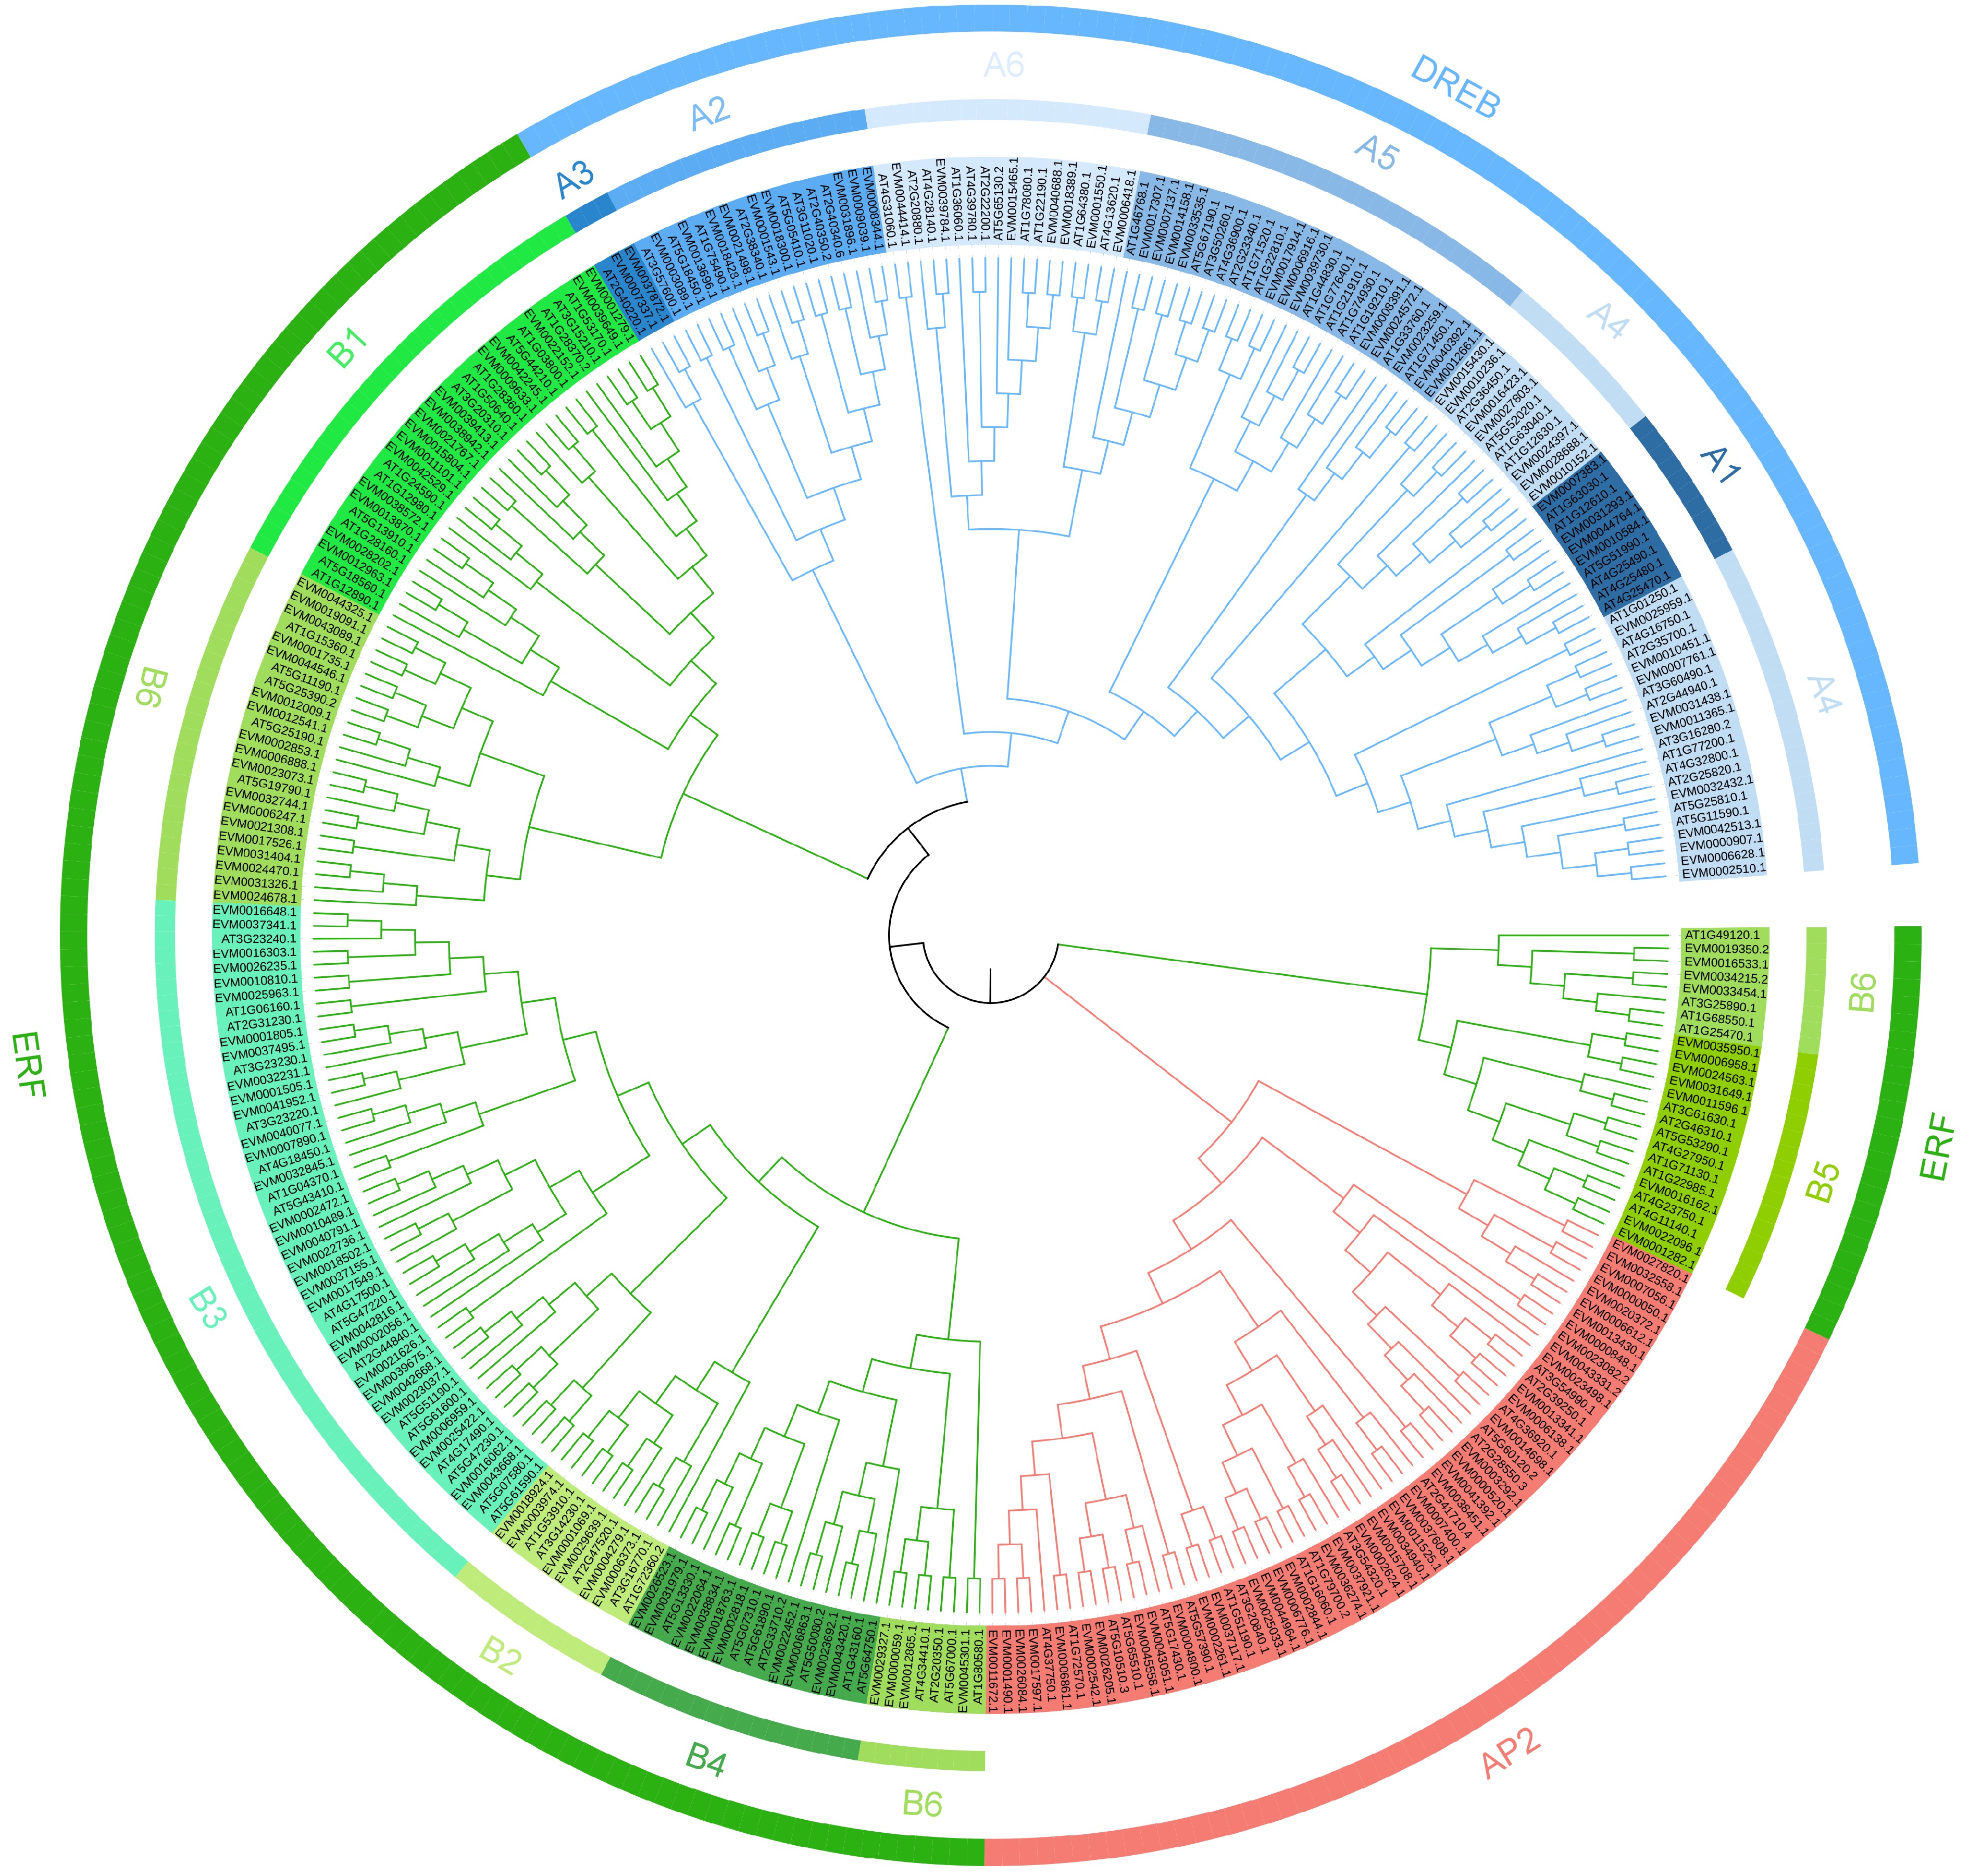
Figure 1.
Phylogenetic tree of the 355 AP2/ERF genes from loquat (189) and Arabidopsis thaliana (136). Different color blocks represent different subfamily members.
-
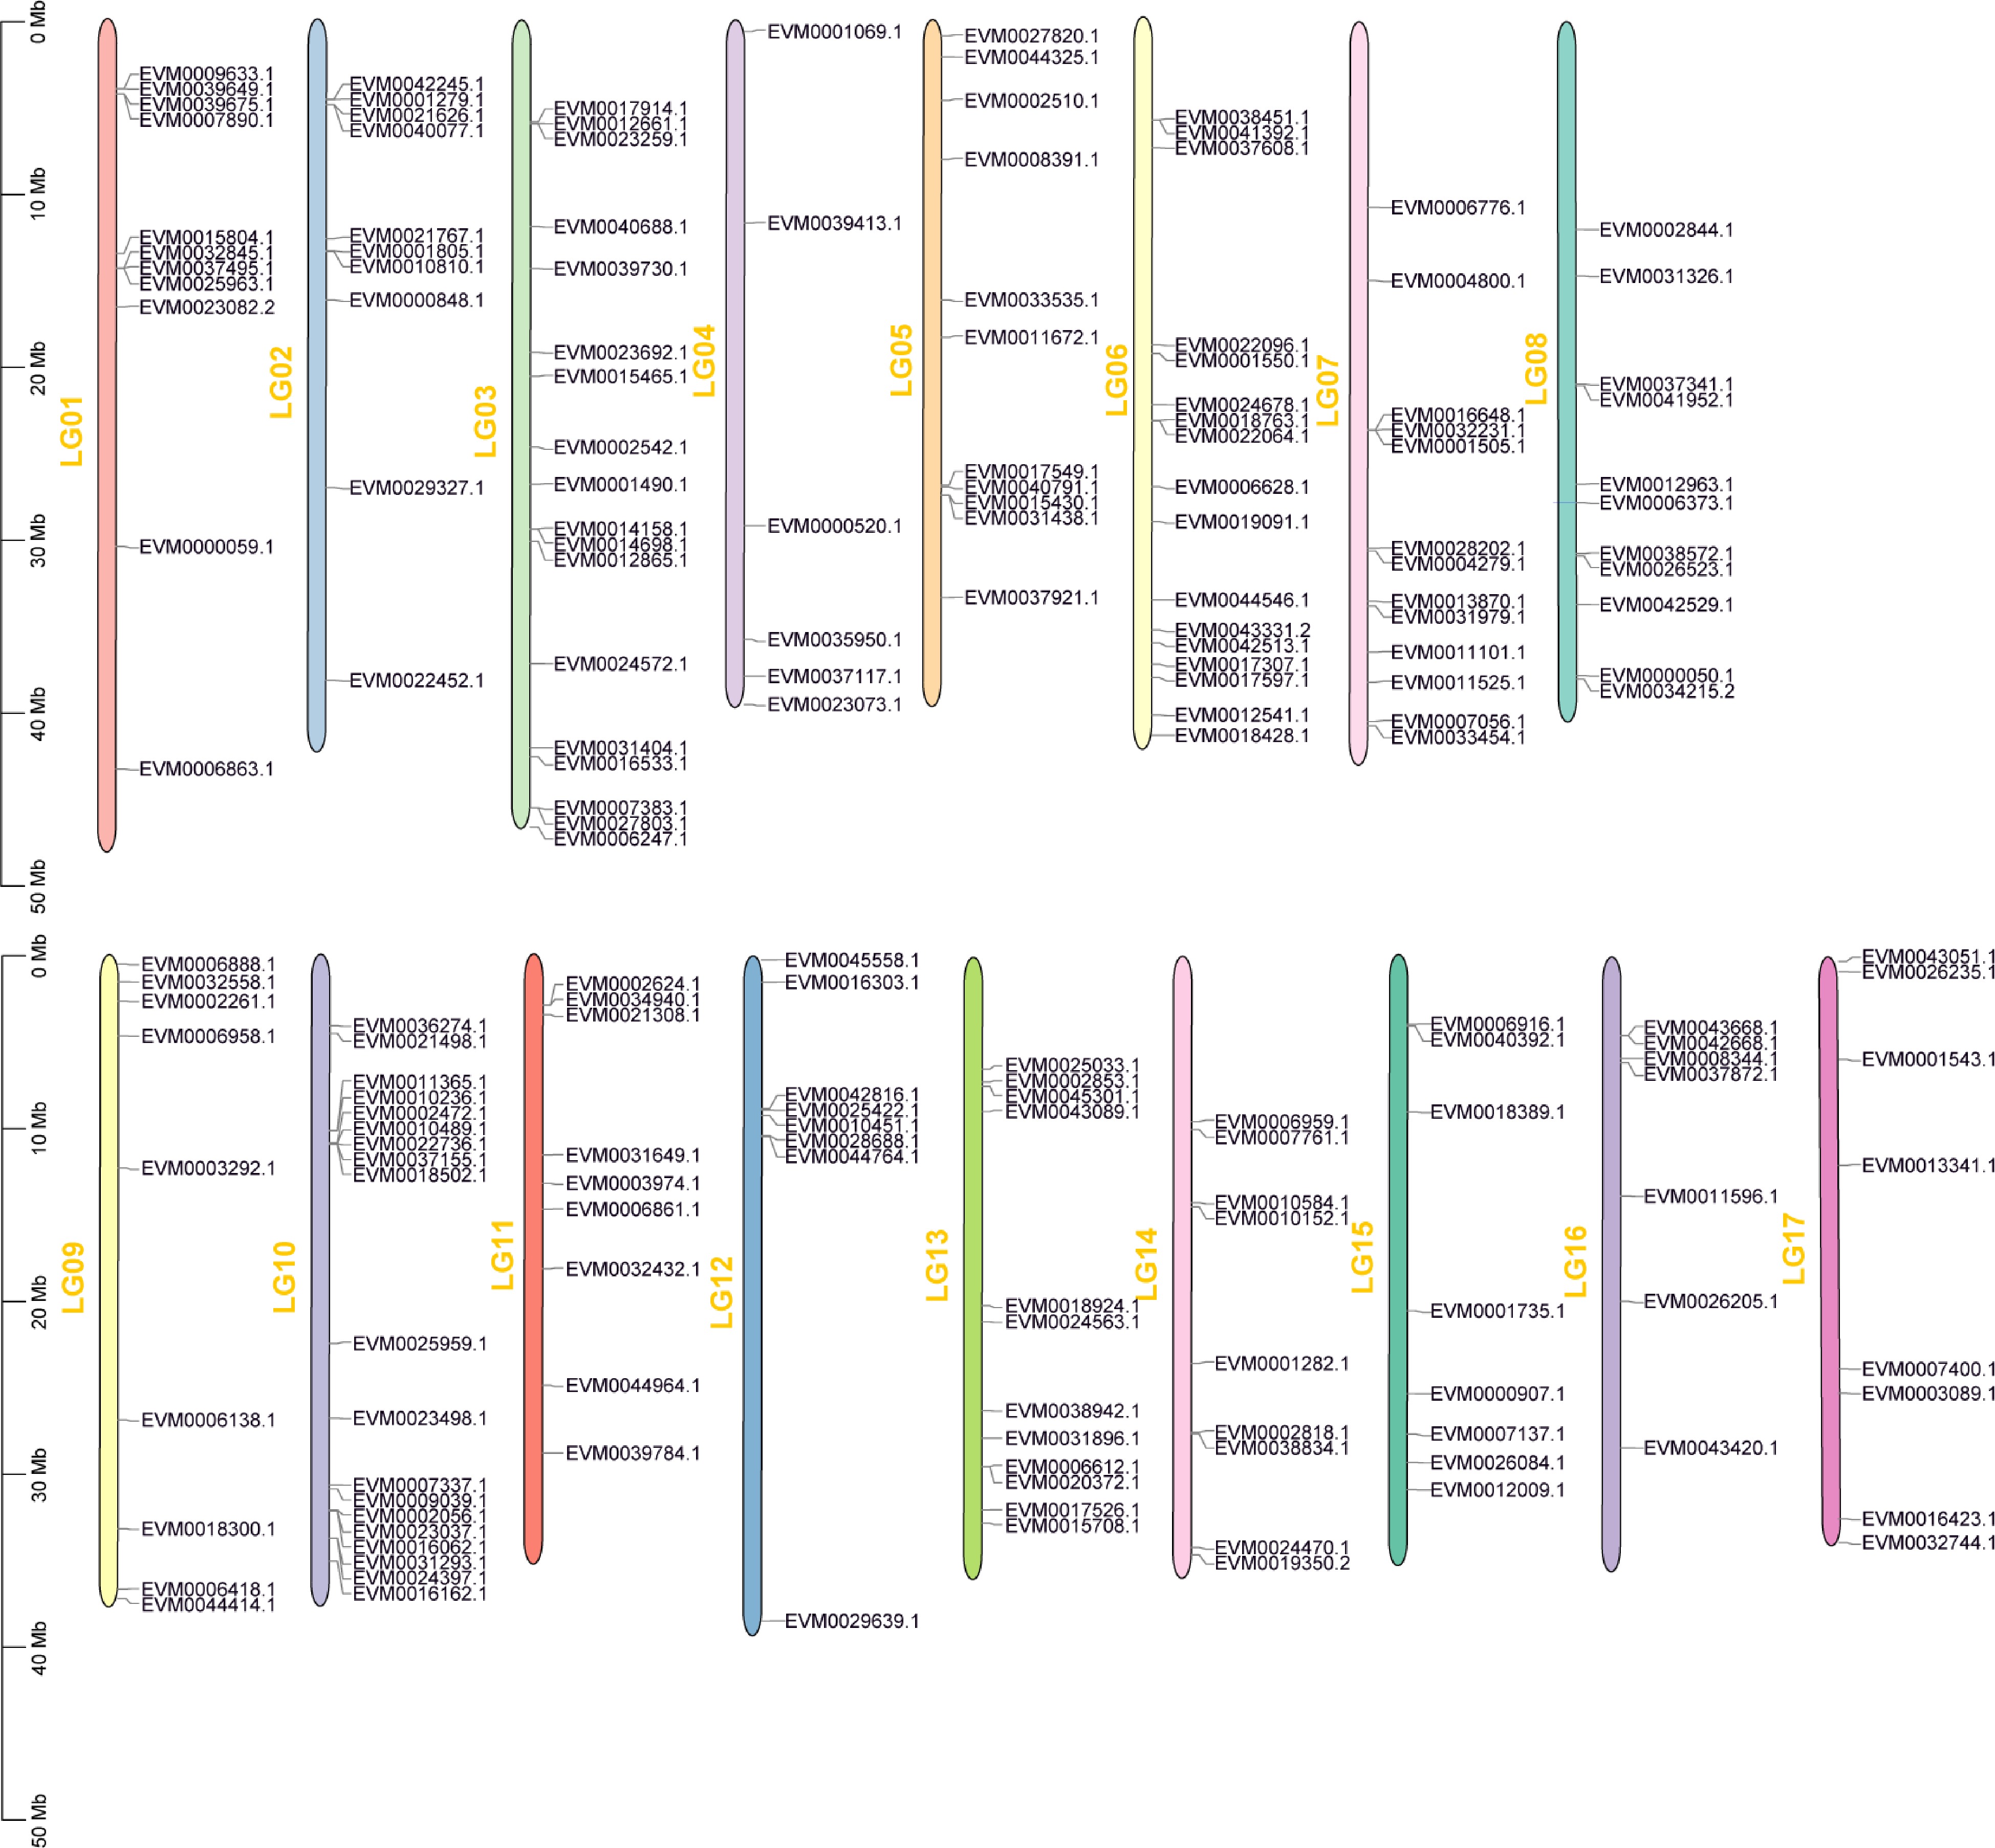
Figure 2.
Chromosomal location of the AP2/ERF genes in loquat.
-
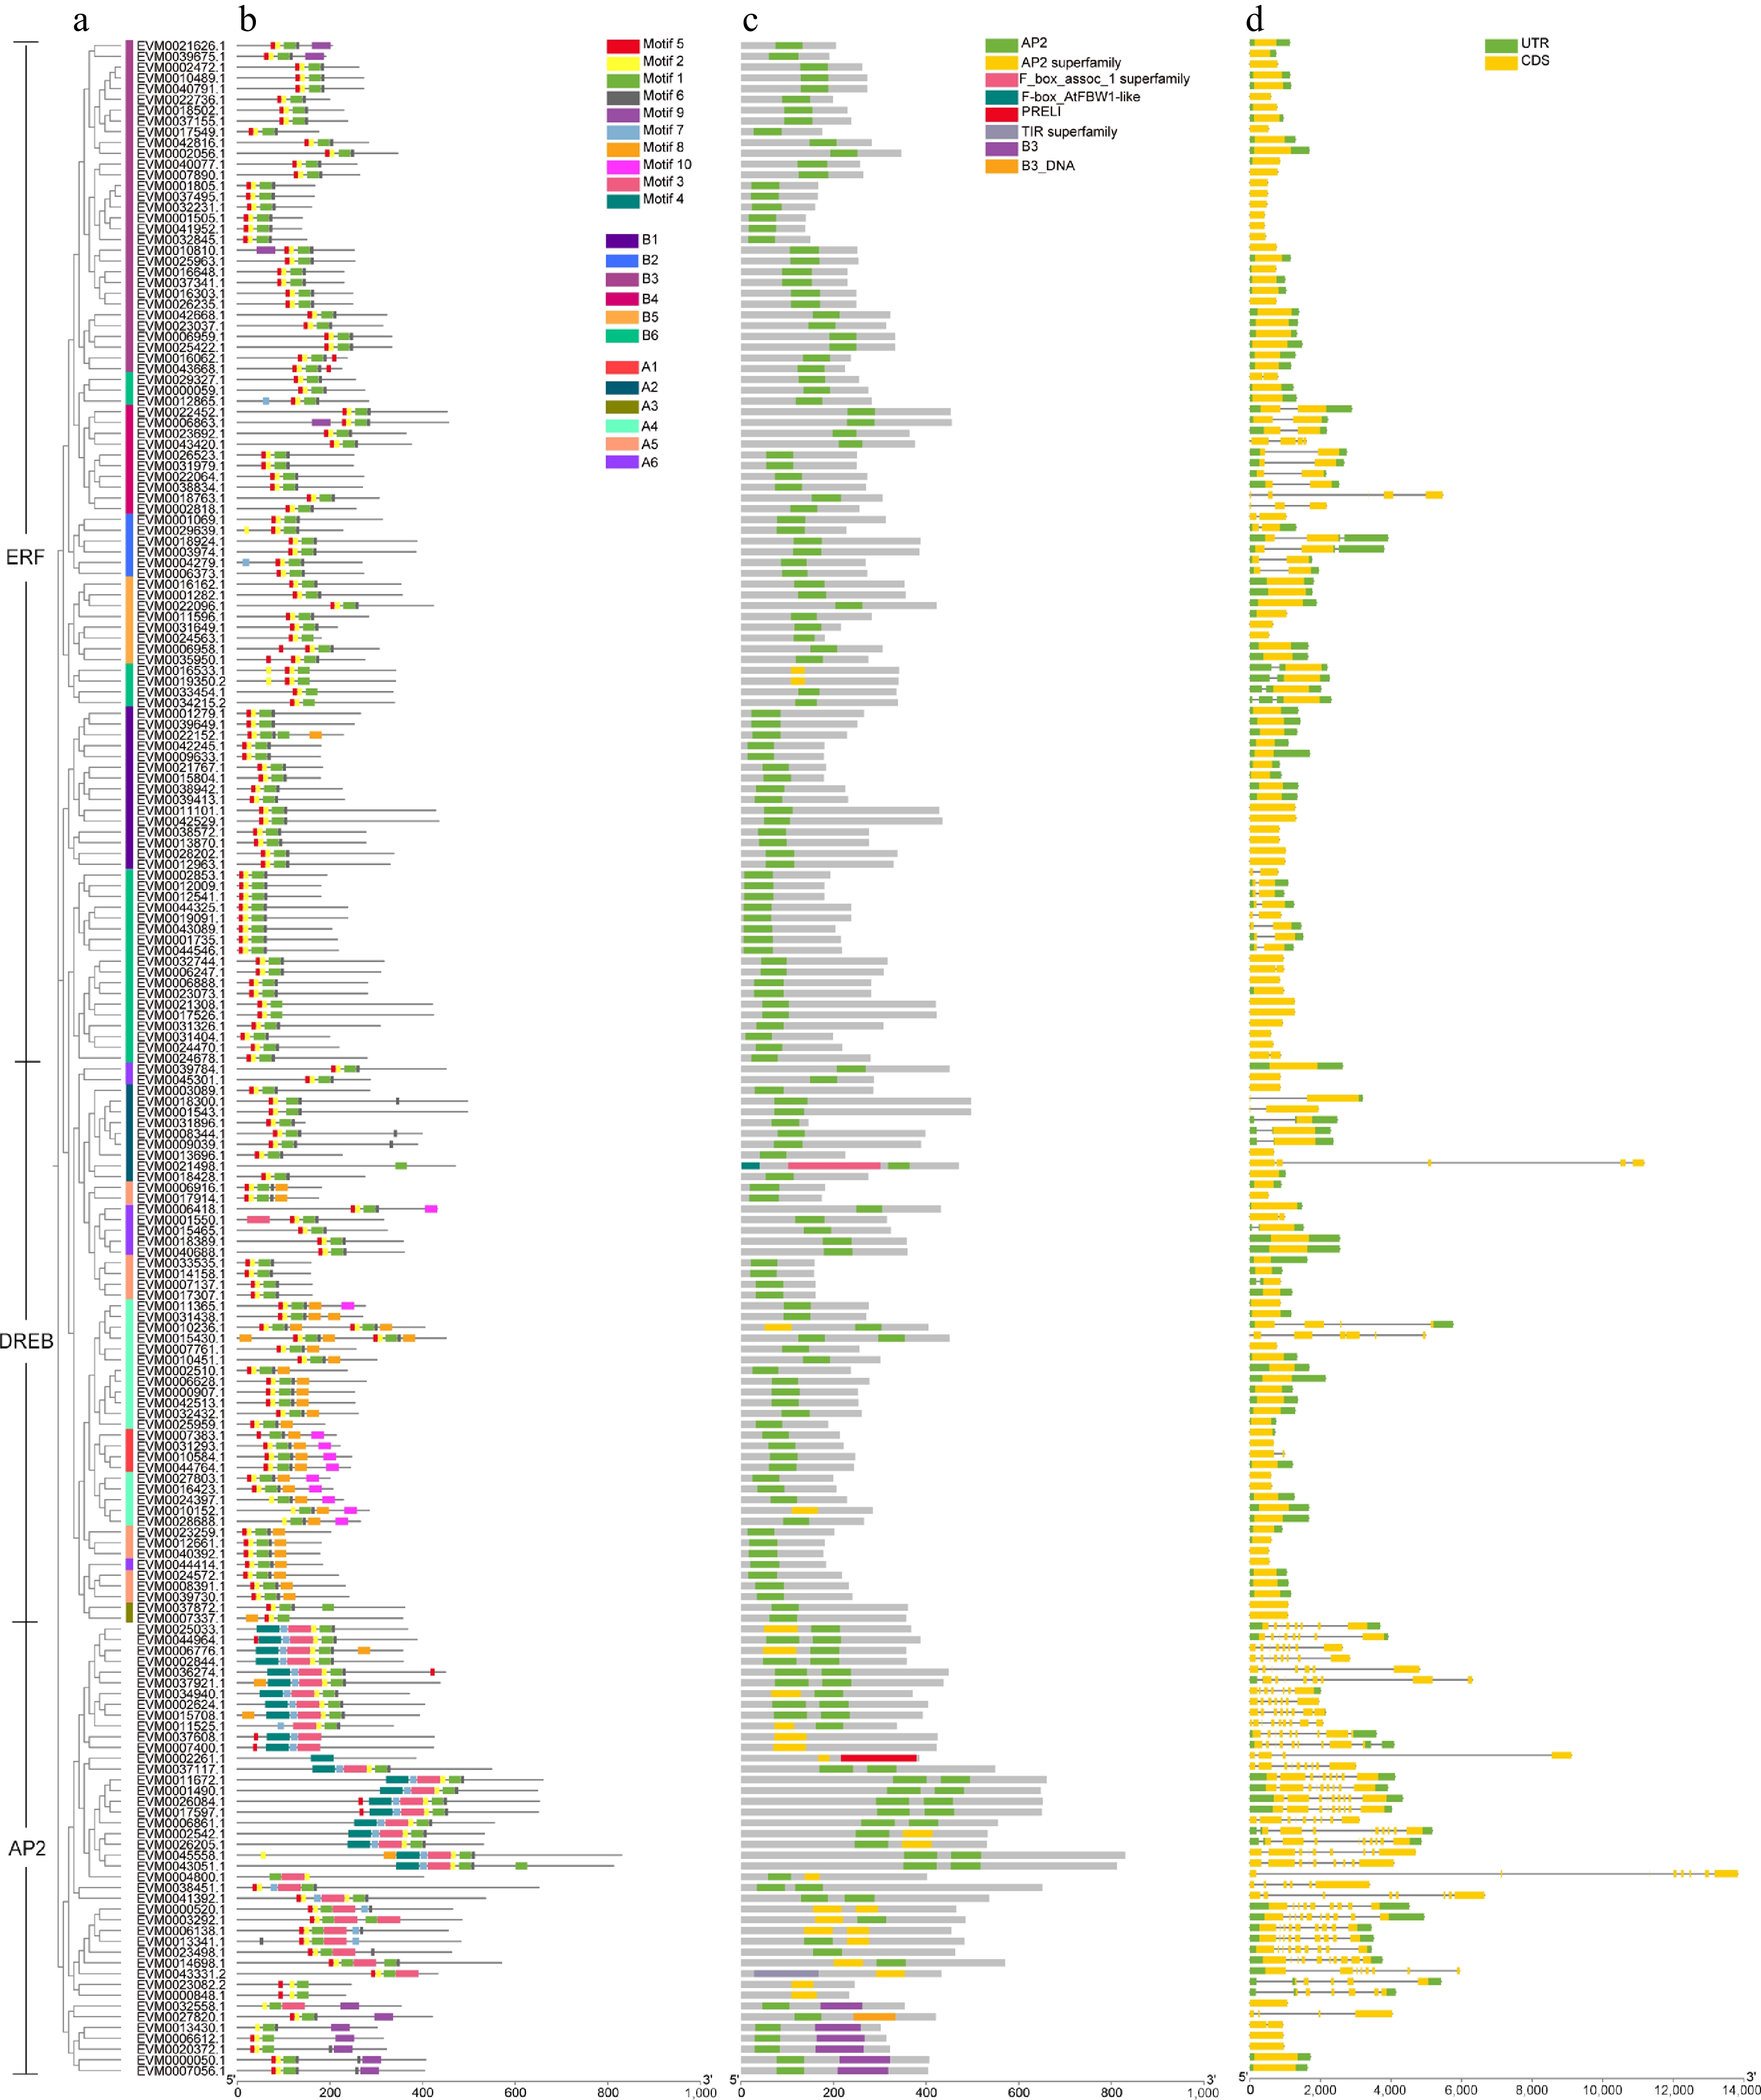
Figure 3.
Conserved motif and gene structure of loquat AP2/ERF gene family. (a) The phylogenetic tree of AP2/ERF genes. (b) Conserved motif distributions of AP2/ERF proteins. (c) Domains of loquat AP2/ERF genes. (d) Exon-intron distributions of AP2/ERF genes. The green and yellow boxes represent UTR and CDS, respectively.
-
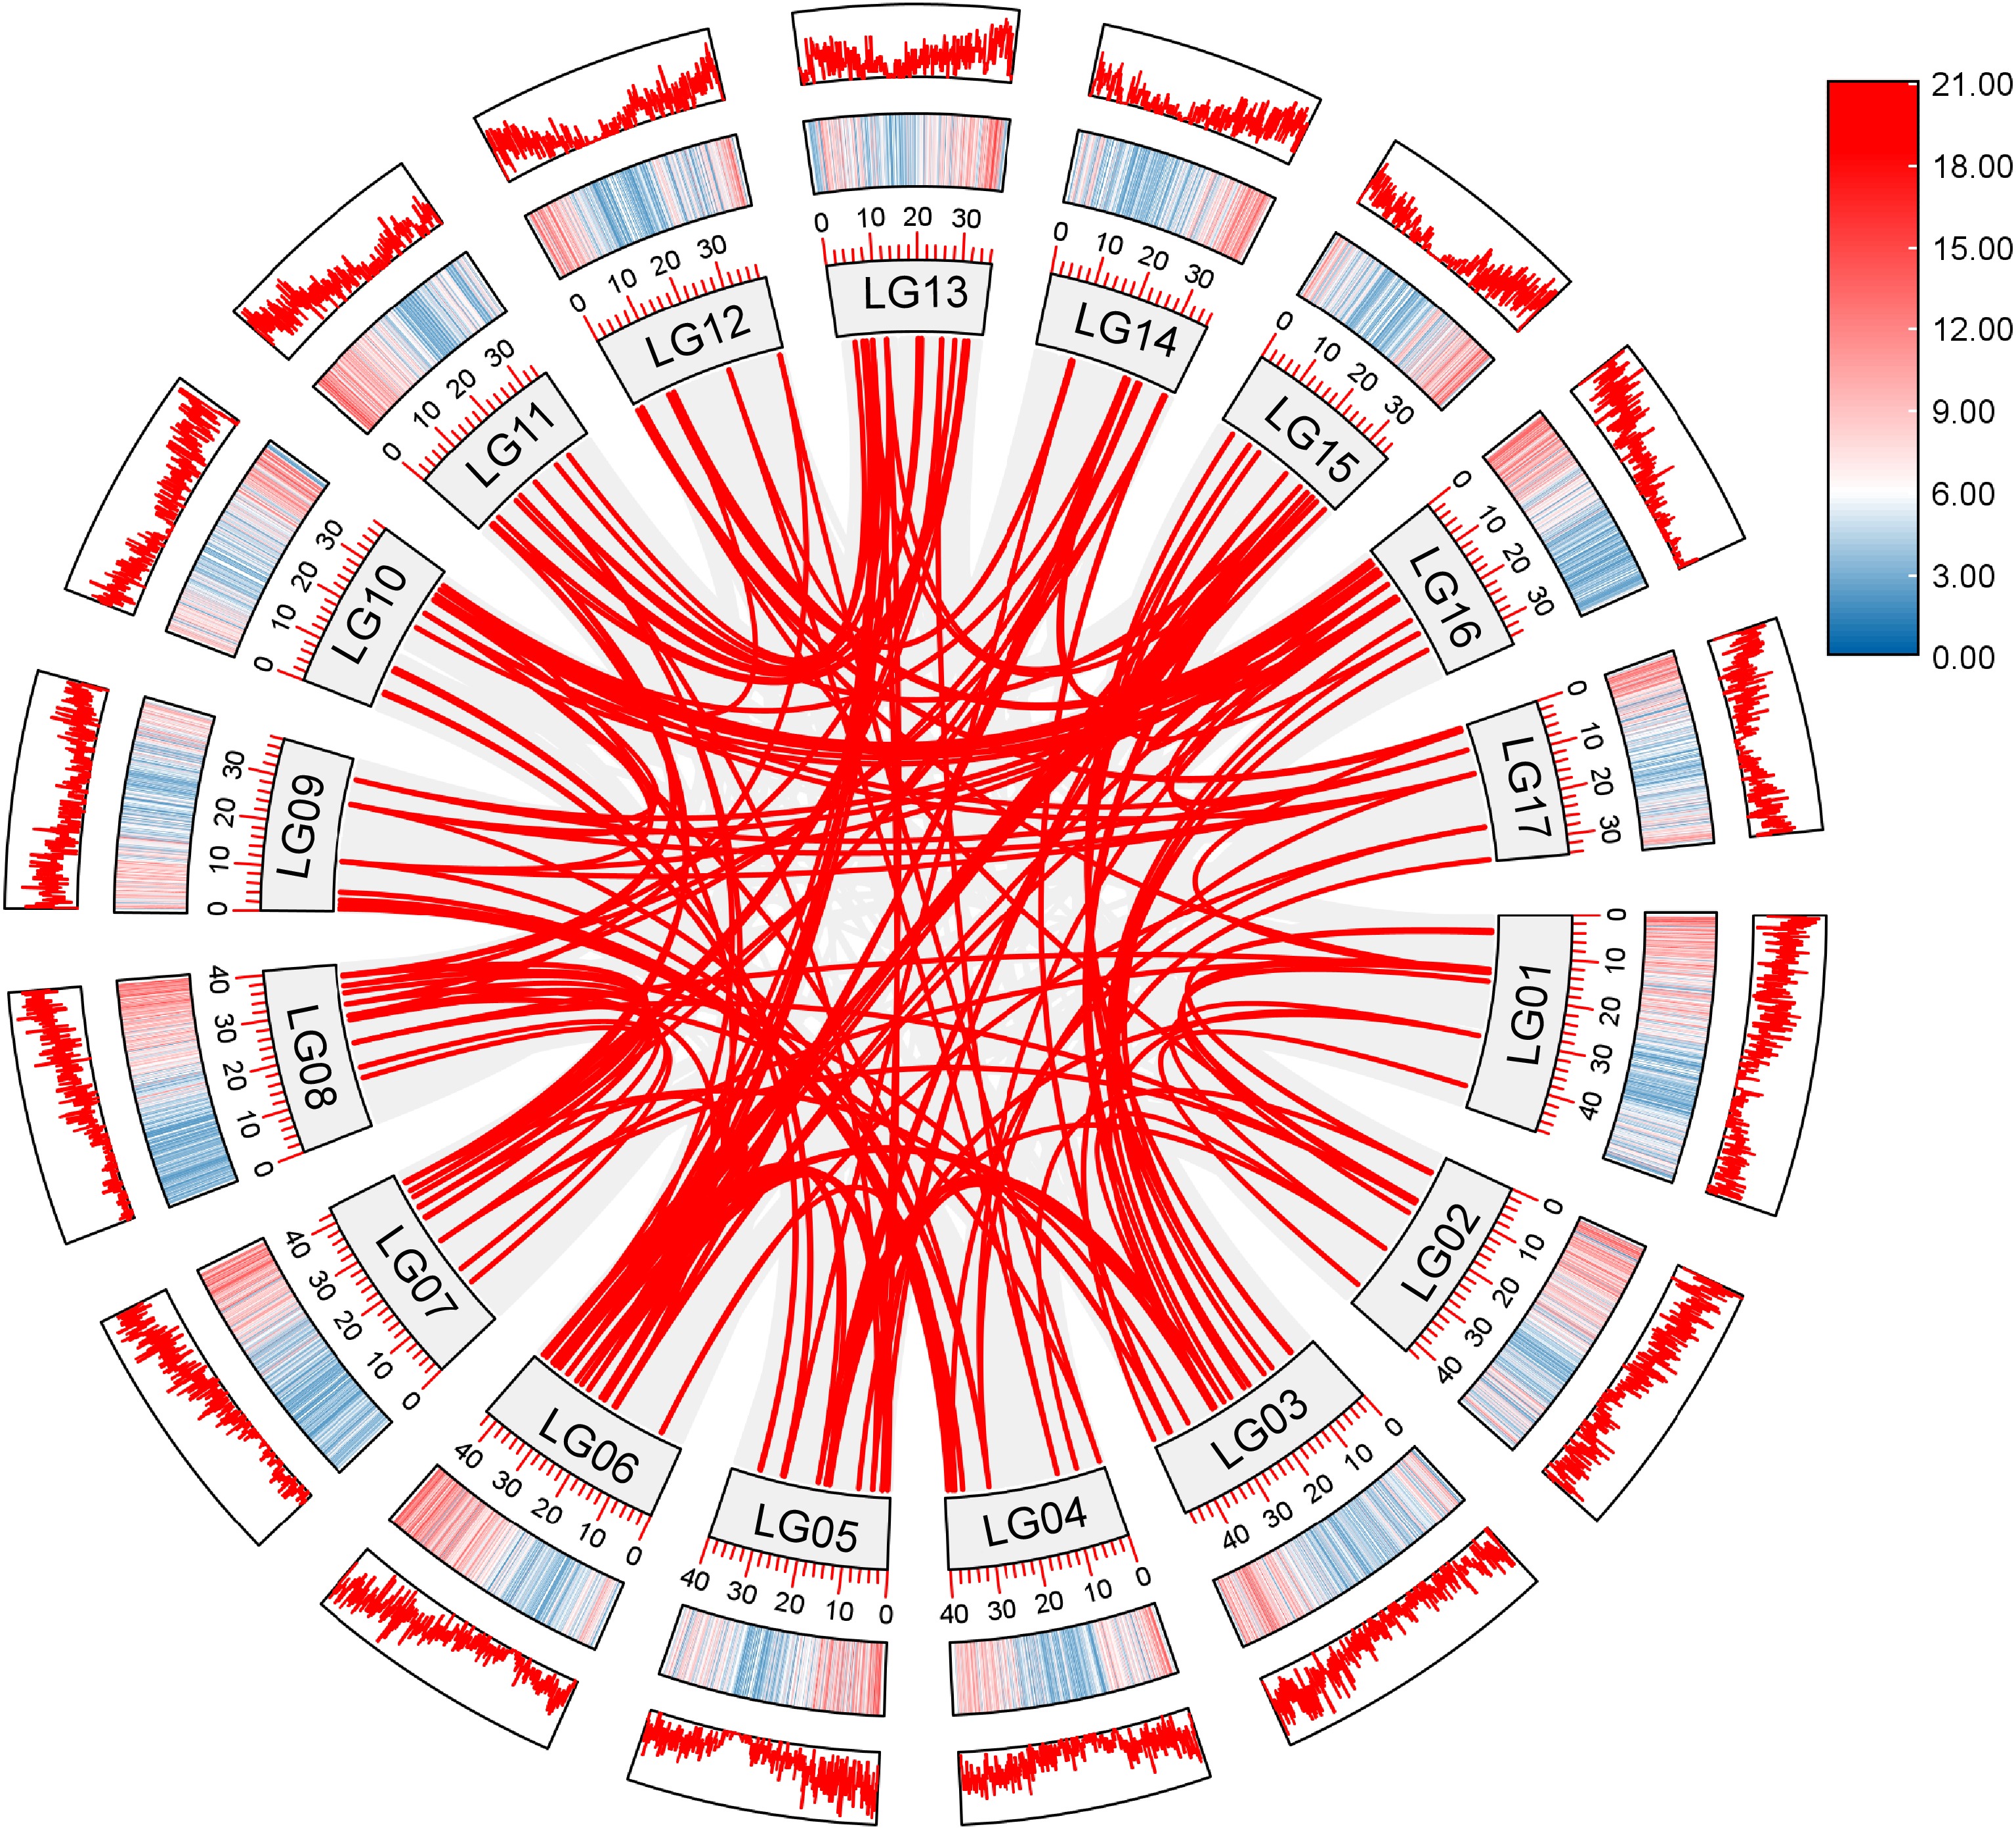
Figure 4.
Synteny analysis of AP2/ERF genes in loquat. Grey lines indicate all syntenic gene pairs in the loquat genome, red lines indicate collinearity relationships among loquat AP2/ERF genes. LG represents the different chromosome. Red and blue represent the level of gene distribution density on the chromosome. The deeper color means the higher density of genes.
-
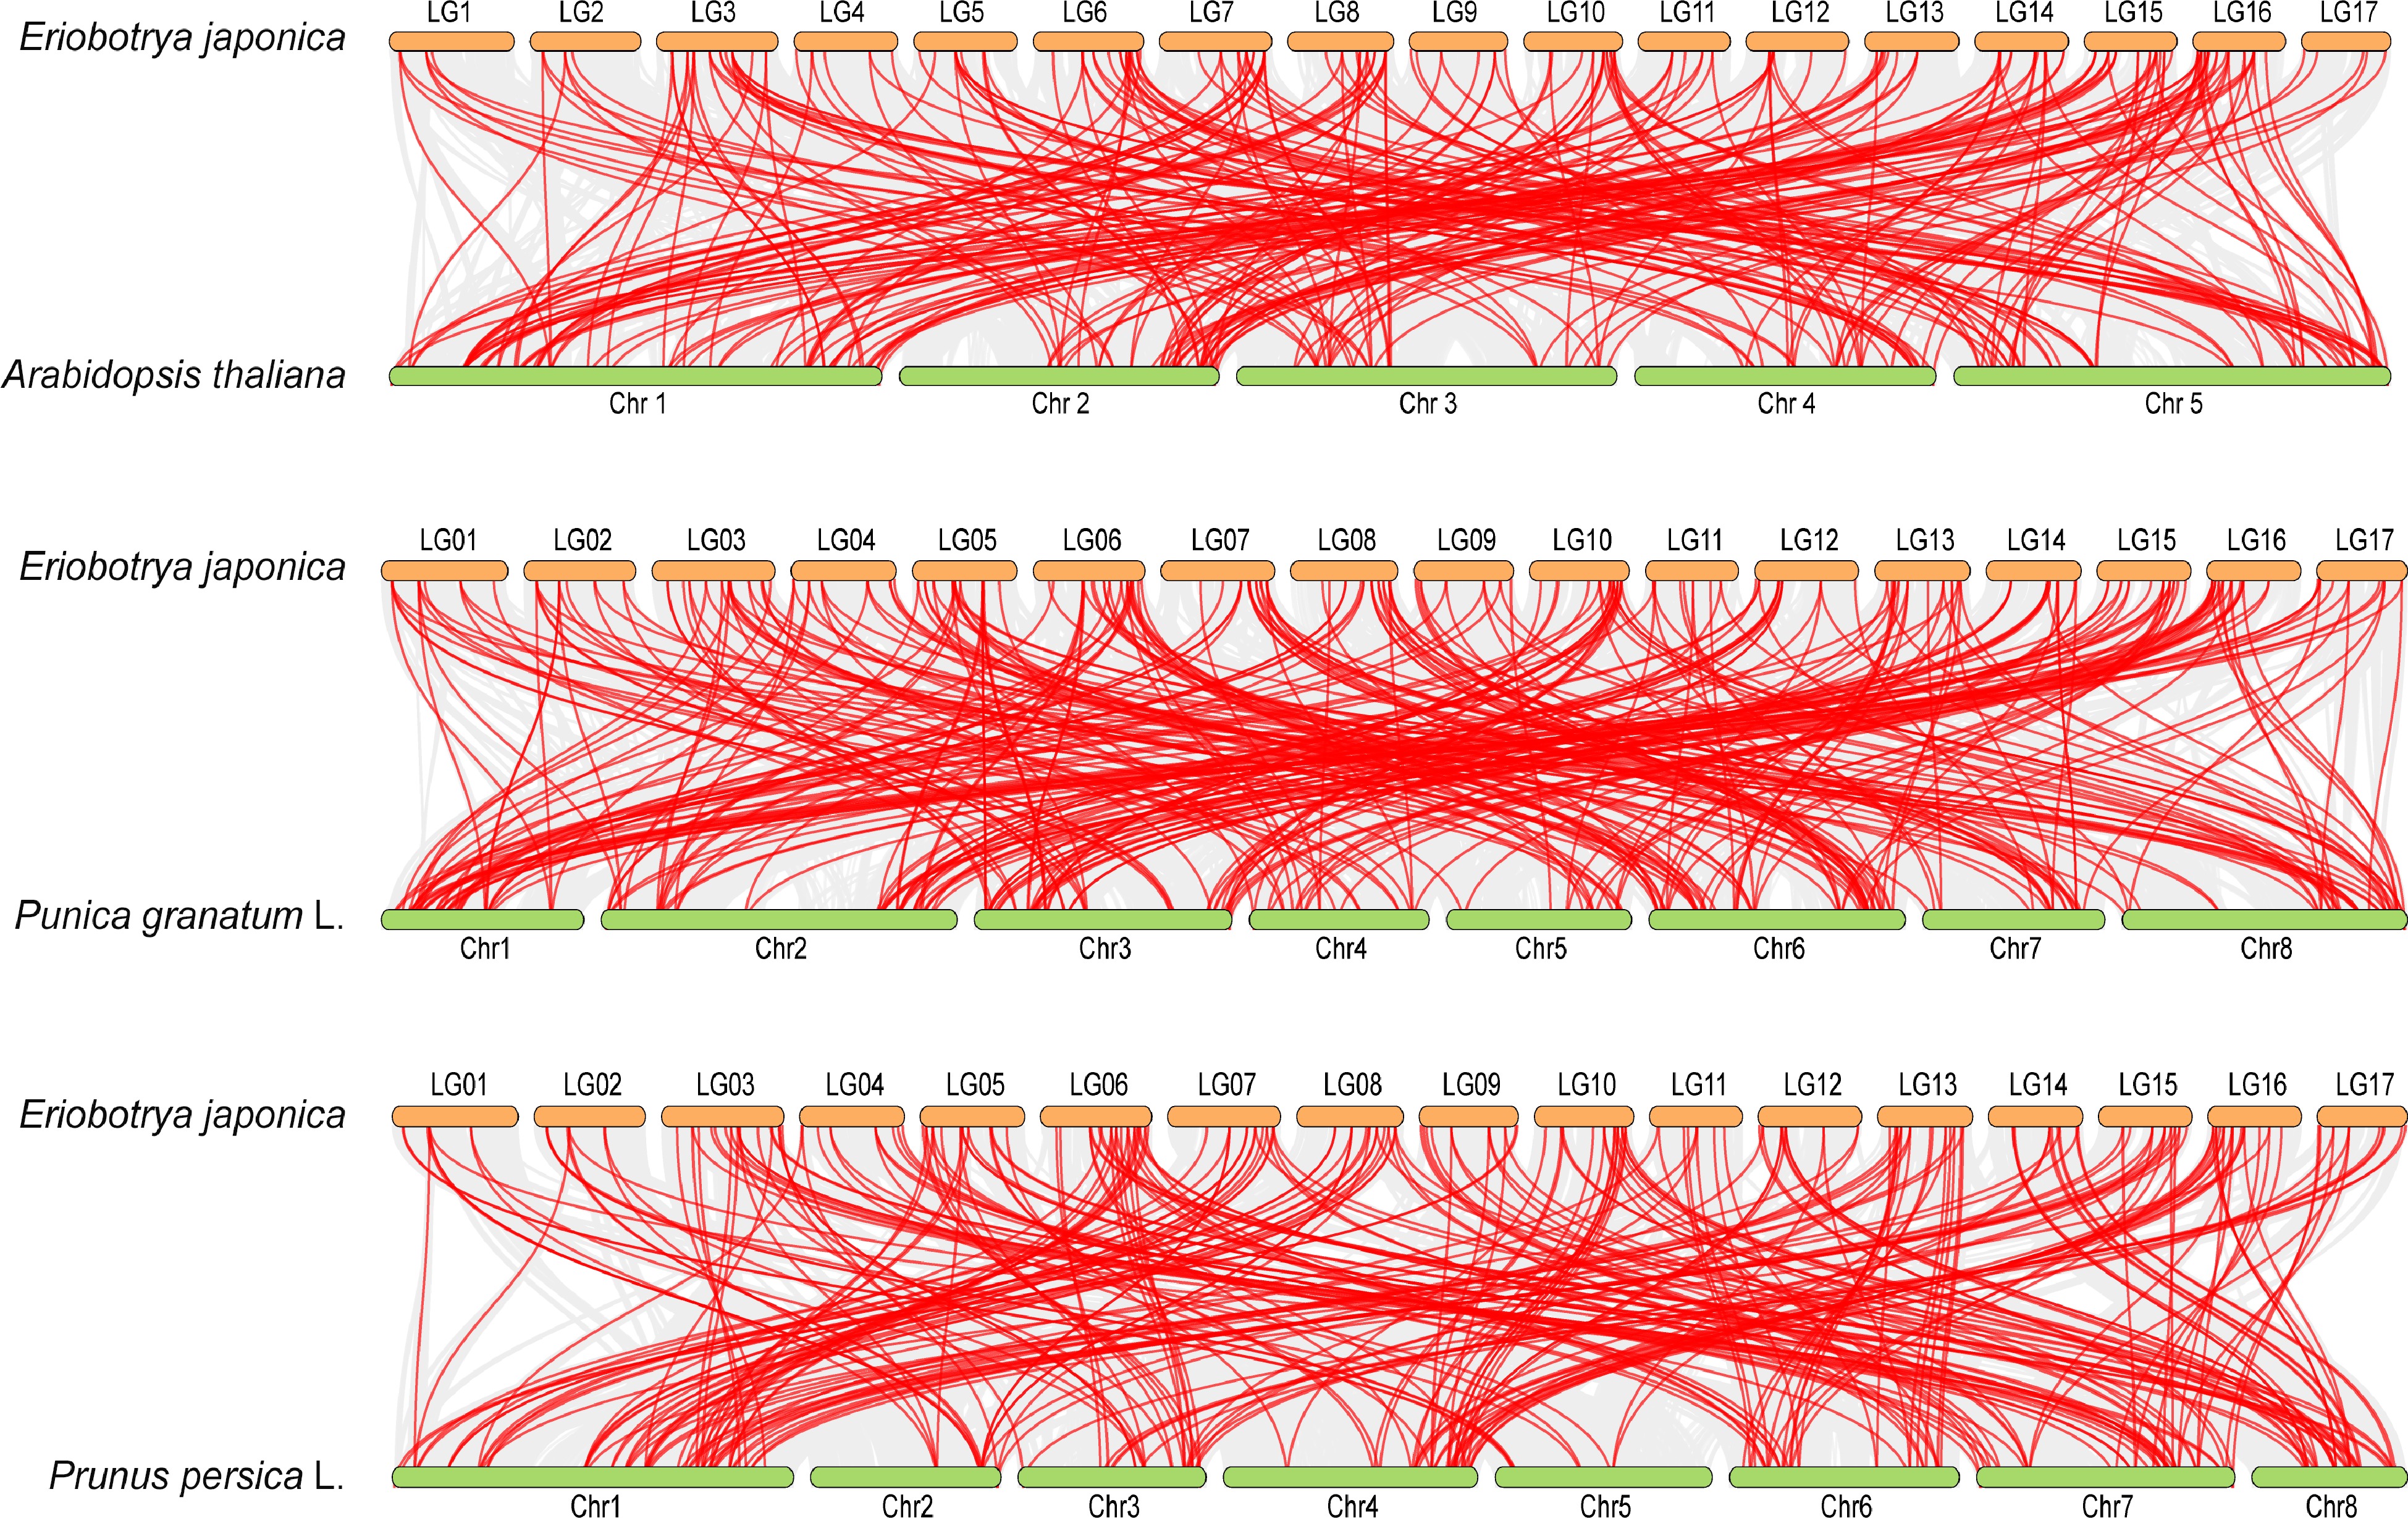
Figure 5.
Synteny analysis of AP2/ERF genes between loquat and other plants. Grey lines in the background represent the collinear blocks between different plant genomes, and the red lines highlight the syntenic AP2/ERF gene pairs. The three species respectively indicate Arabidopsis, pomegranate (Punica granatum L.), and peach (Prunus persica L.).
-
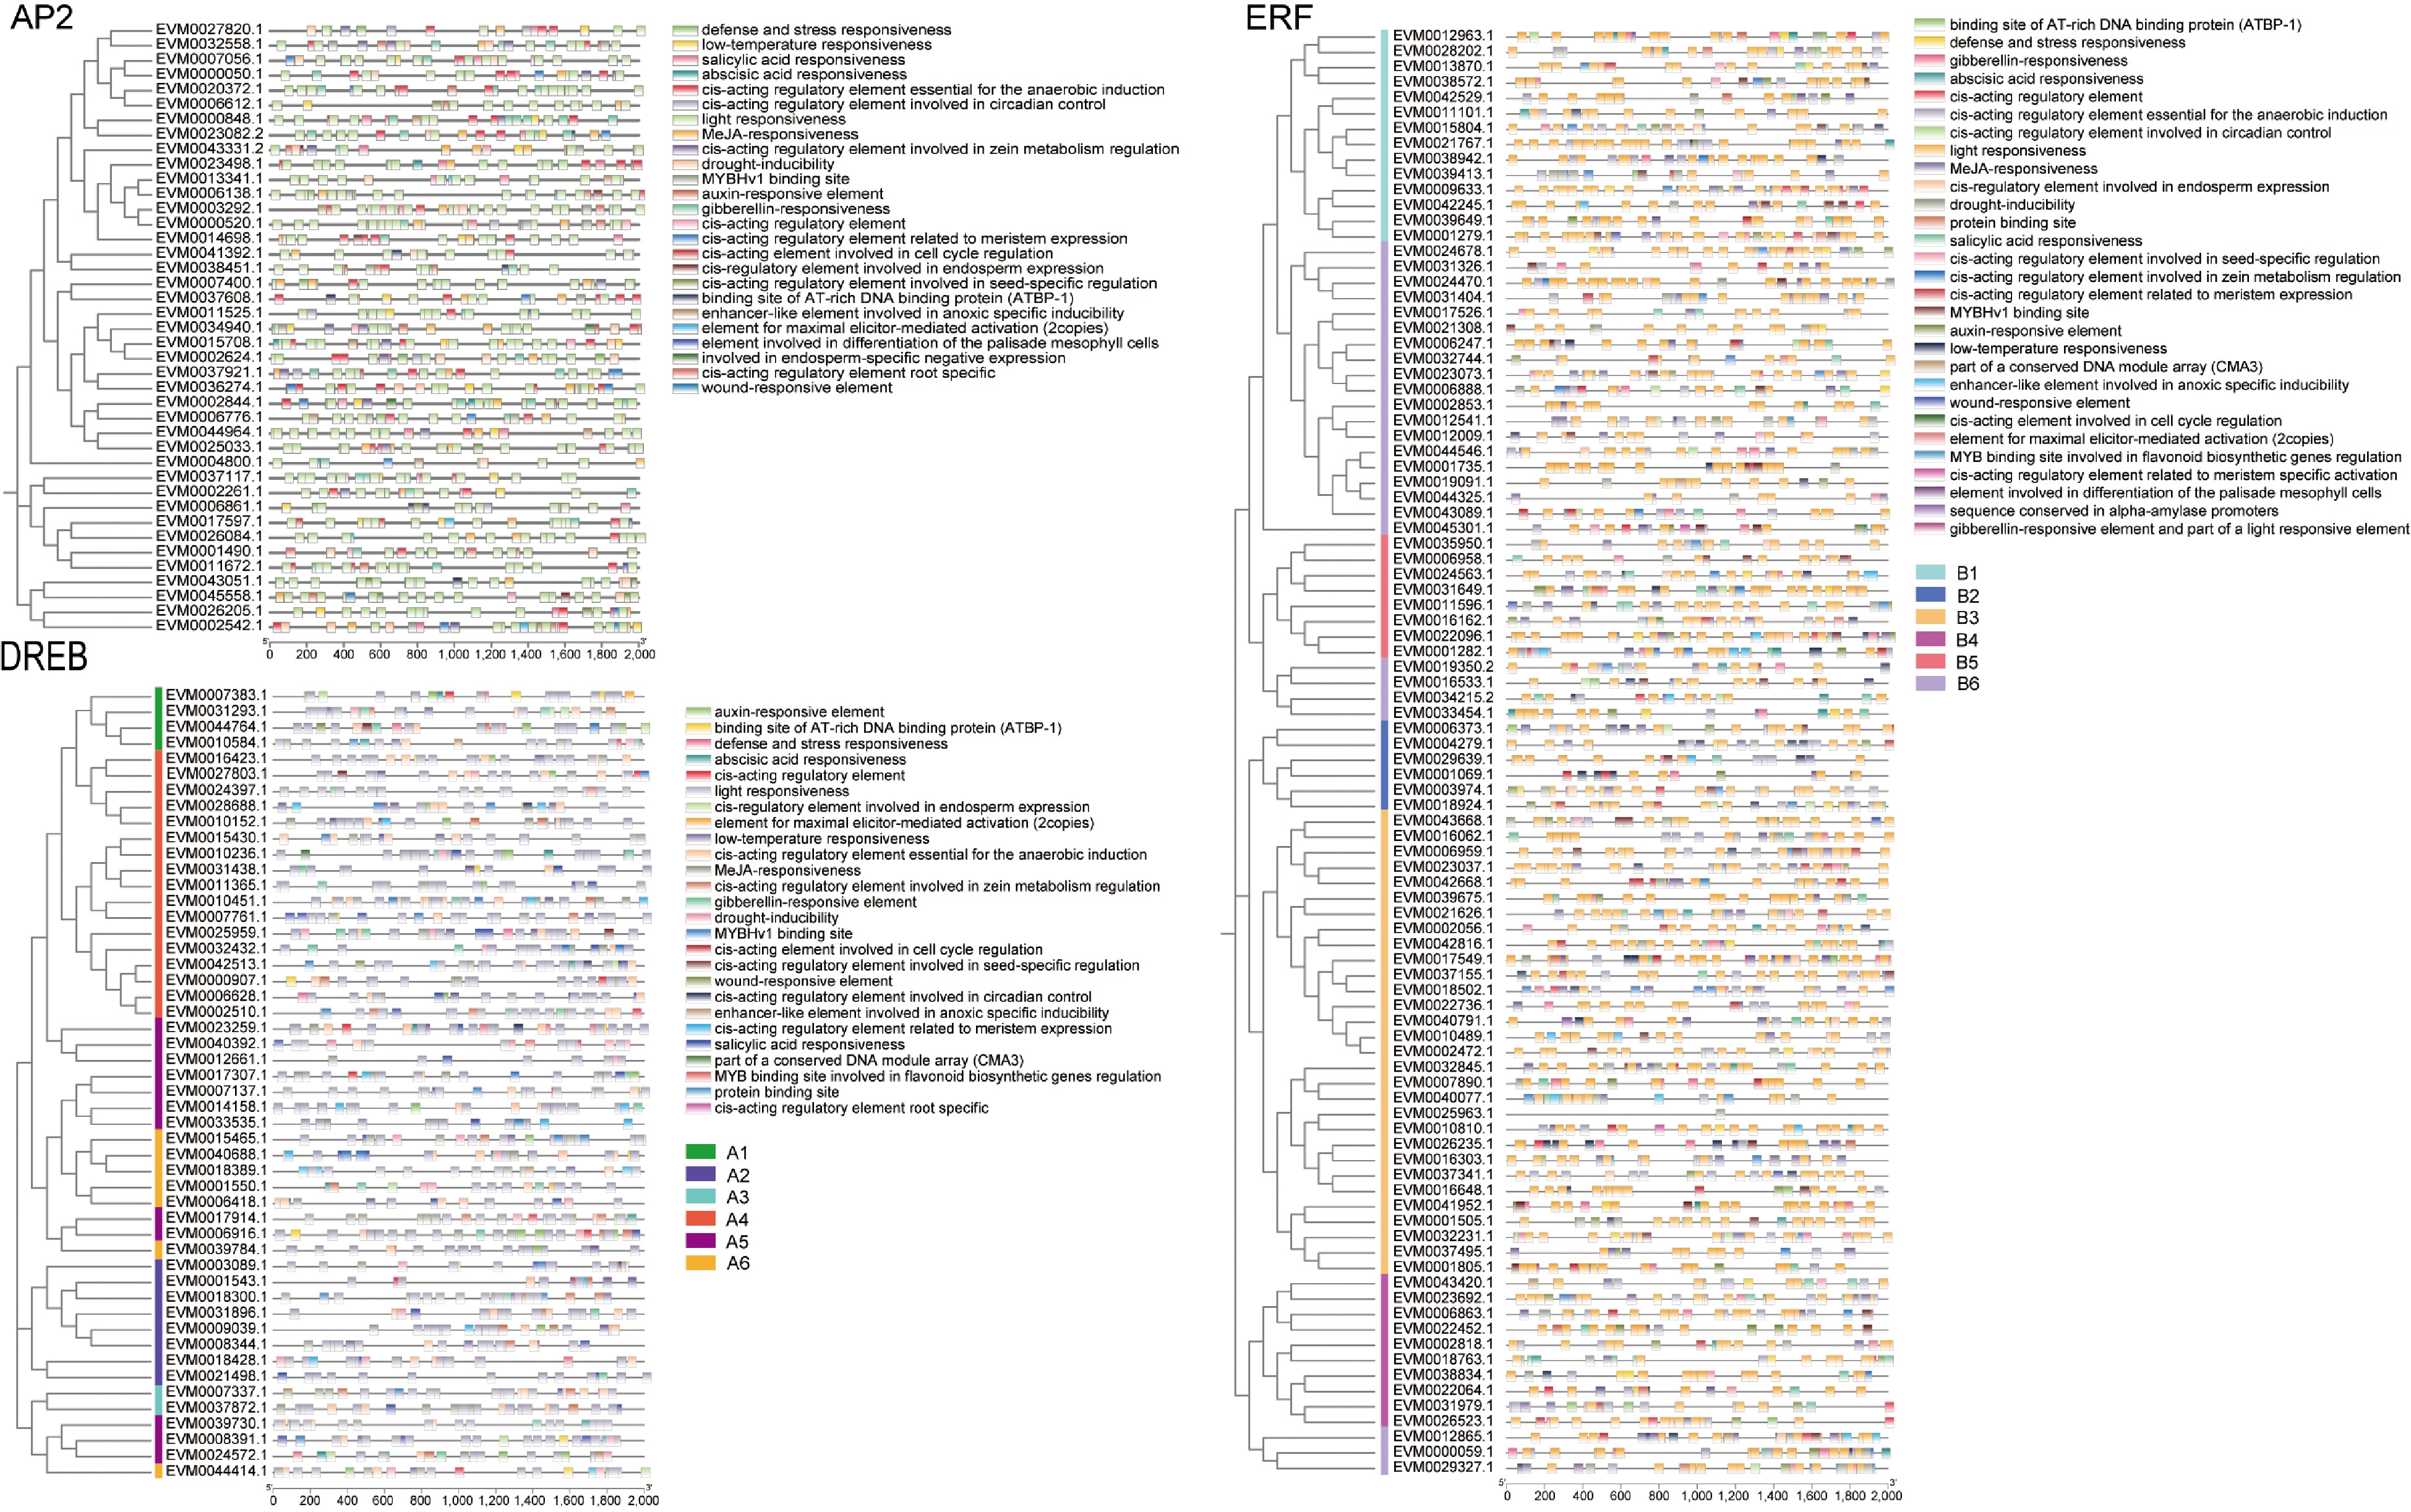
Figure 6.
Cis-acting elements in the promoter region of AP2/ERF genes in loquat. The 2,000 bp promoter region of the gene was analyzed. Different colors boxes represent different types of cis-acting elements and different groups of gene subfamilies.
-
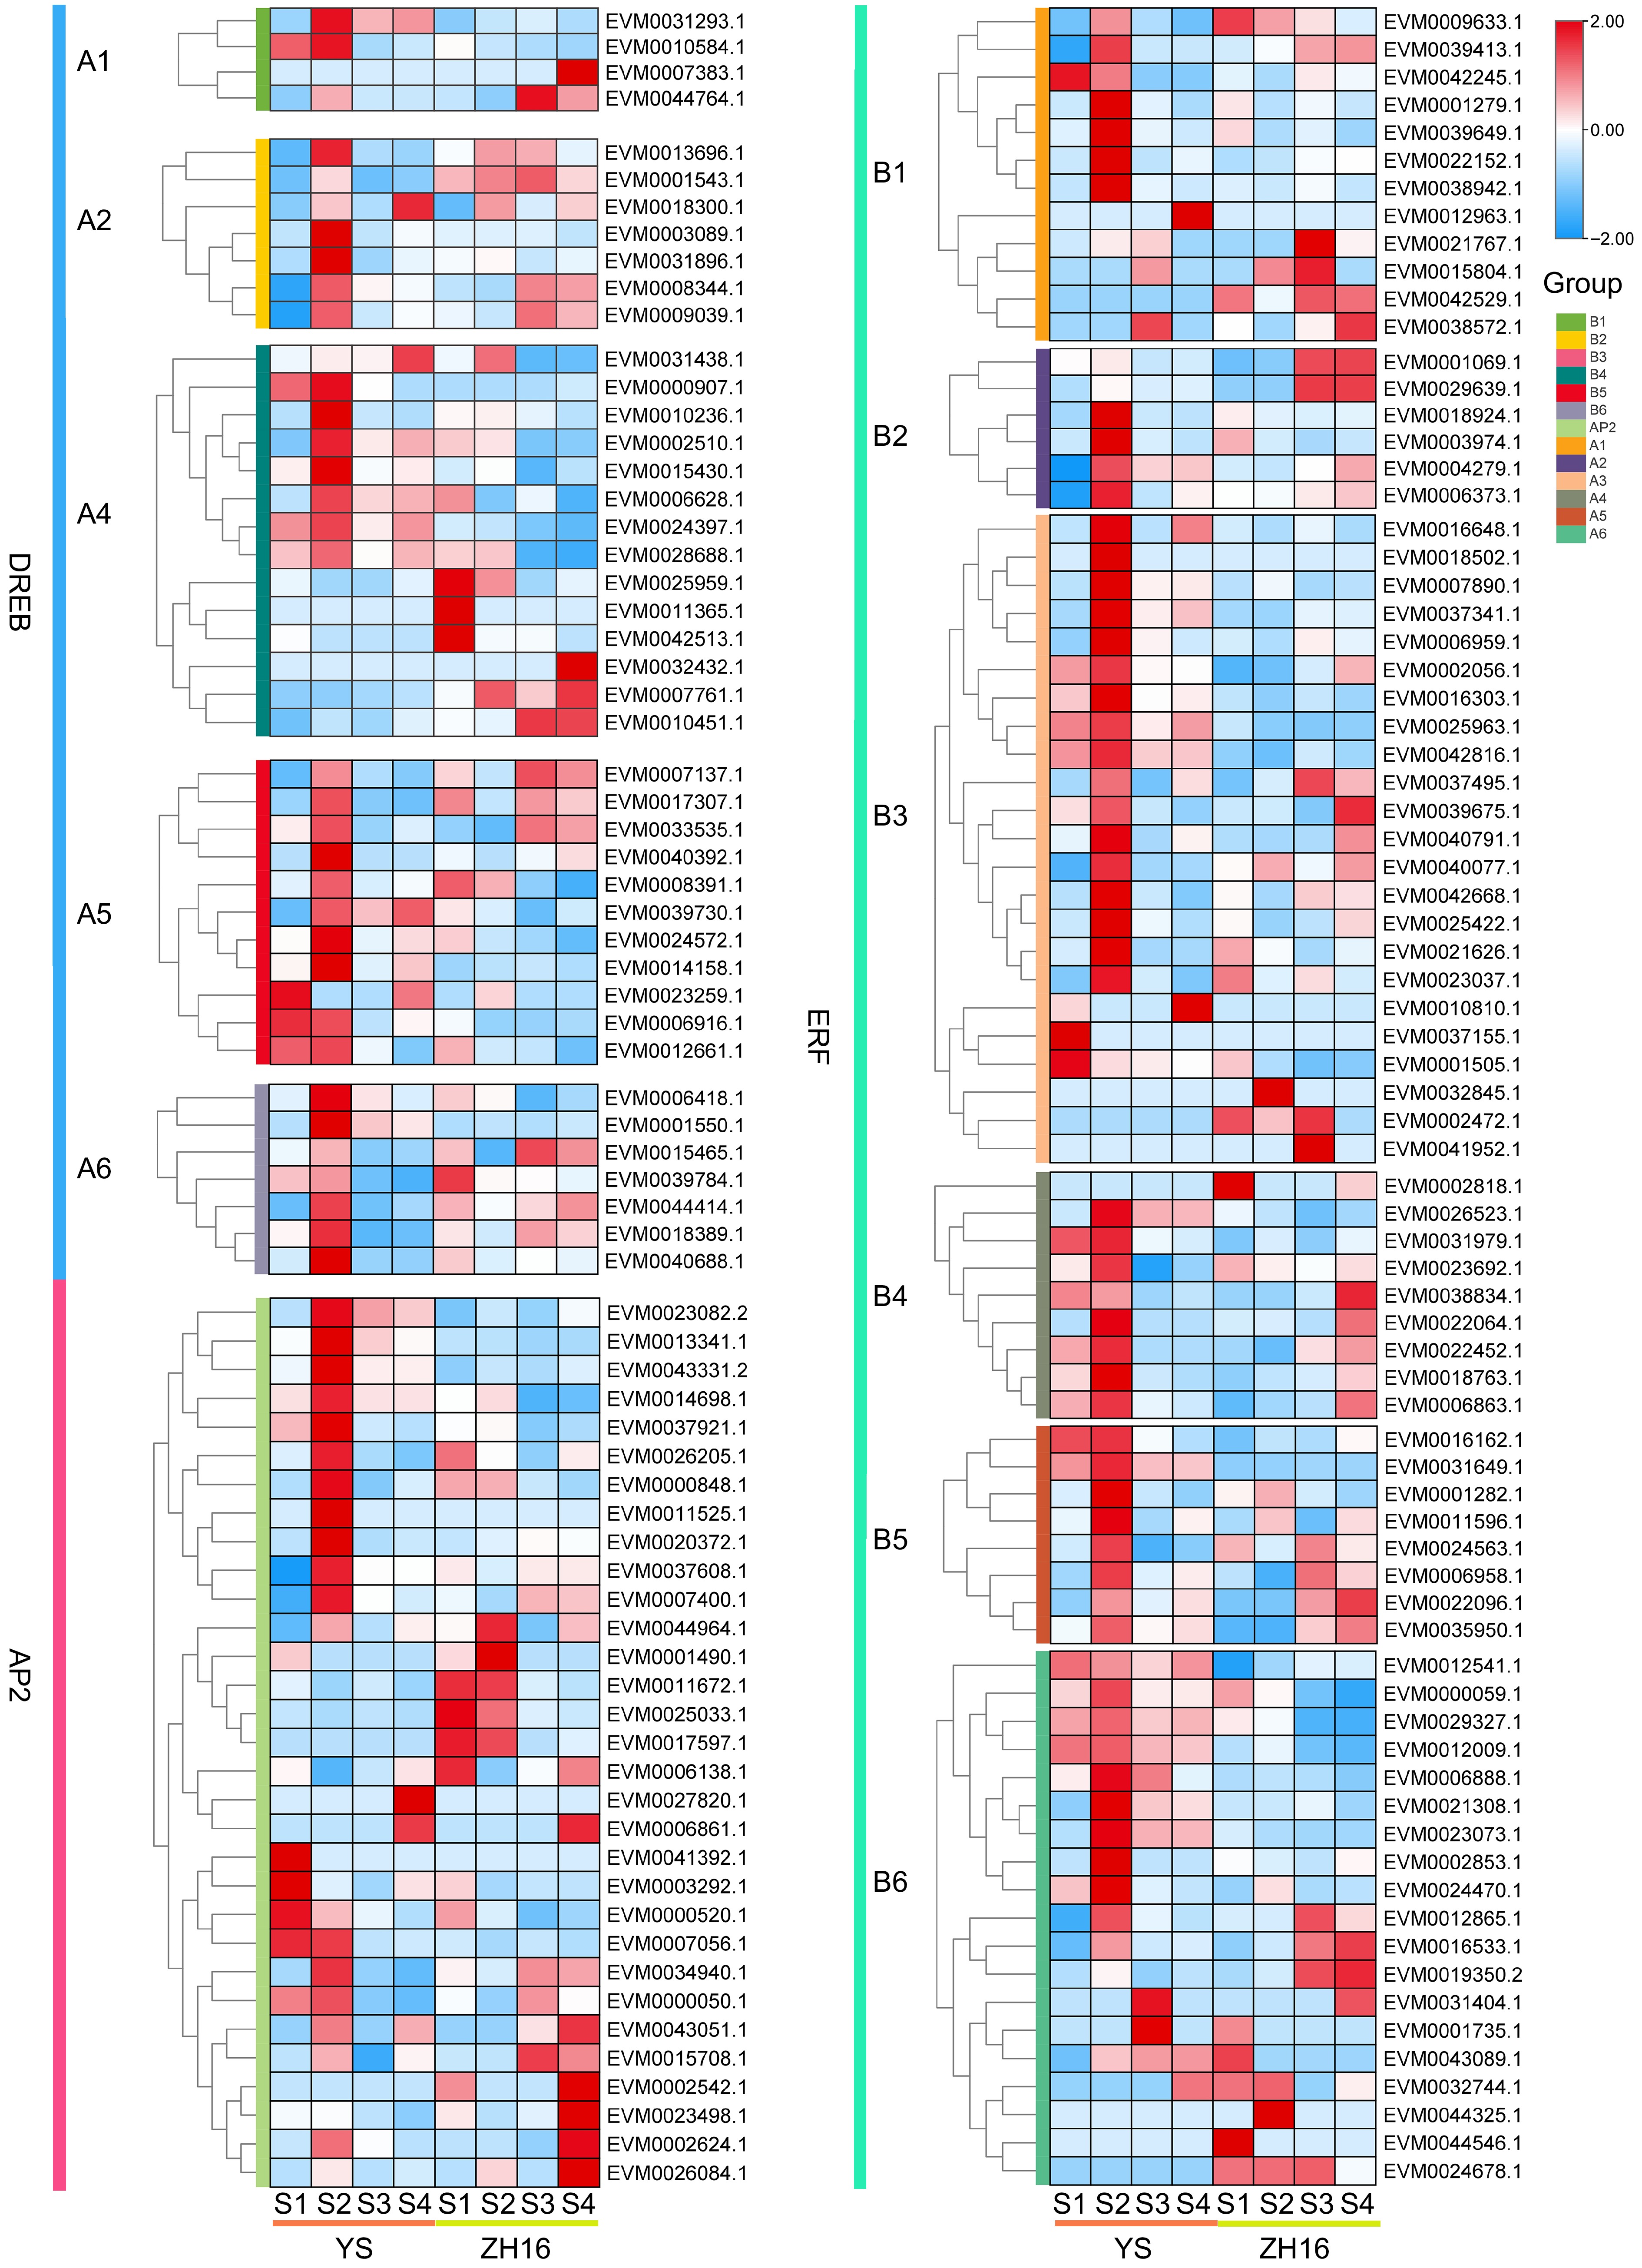
Figure 7.
The expression pattern analysis of the AP2/ERF gene family in different cultivars and developmental stages of loquat fruits. Red color represents high expression, while blue represents low expression. Fruits were harvested at four developmental stages (S1−S4), representing the expansion stage, the turning stage, the mature yellow stage, and the ripening stage.
Figures
(7)
Tables
(0)