-

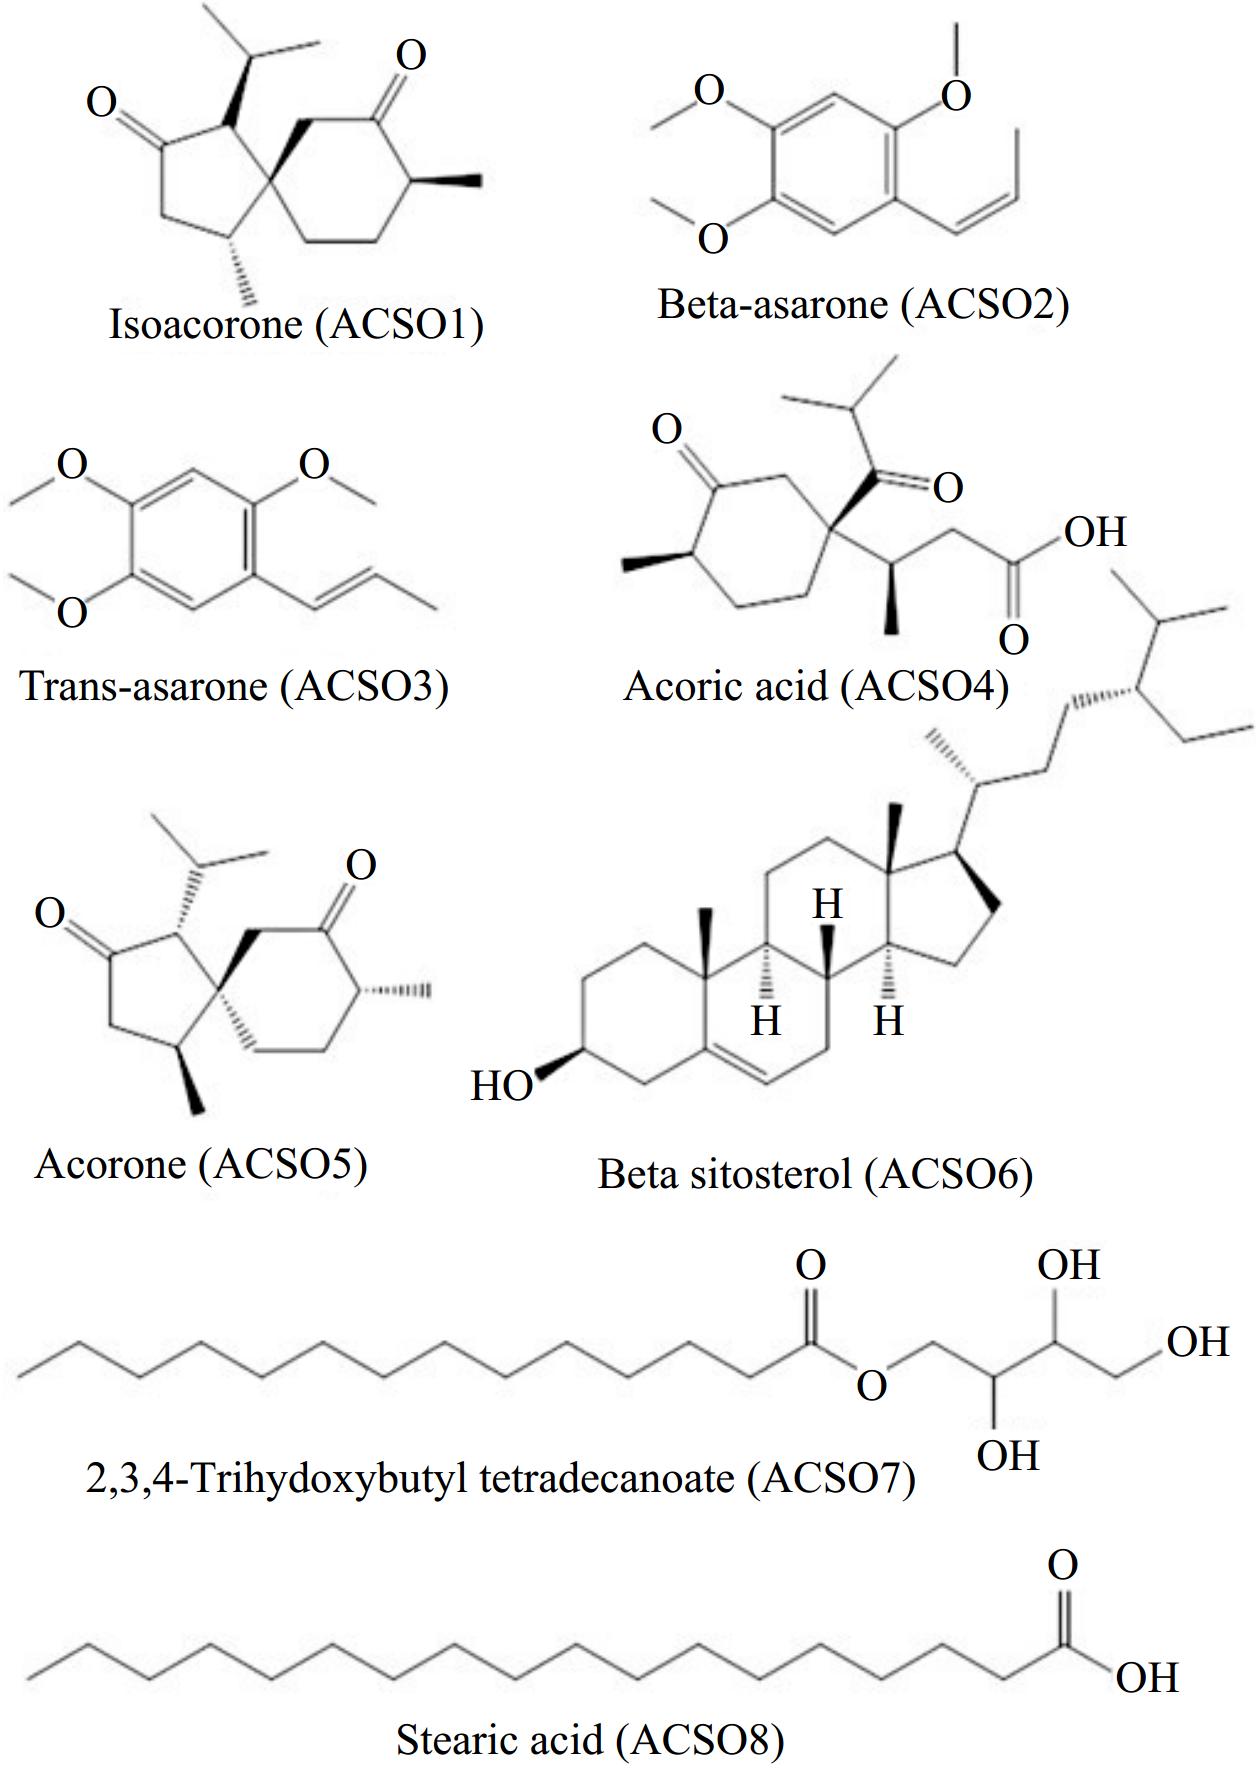
Figure 1.
Structures of the isolated compounds from the rhizome of A. calamus.
-

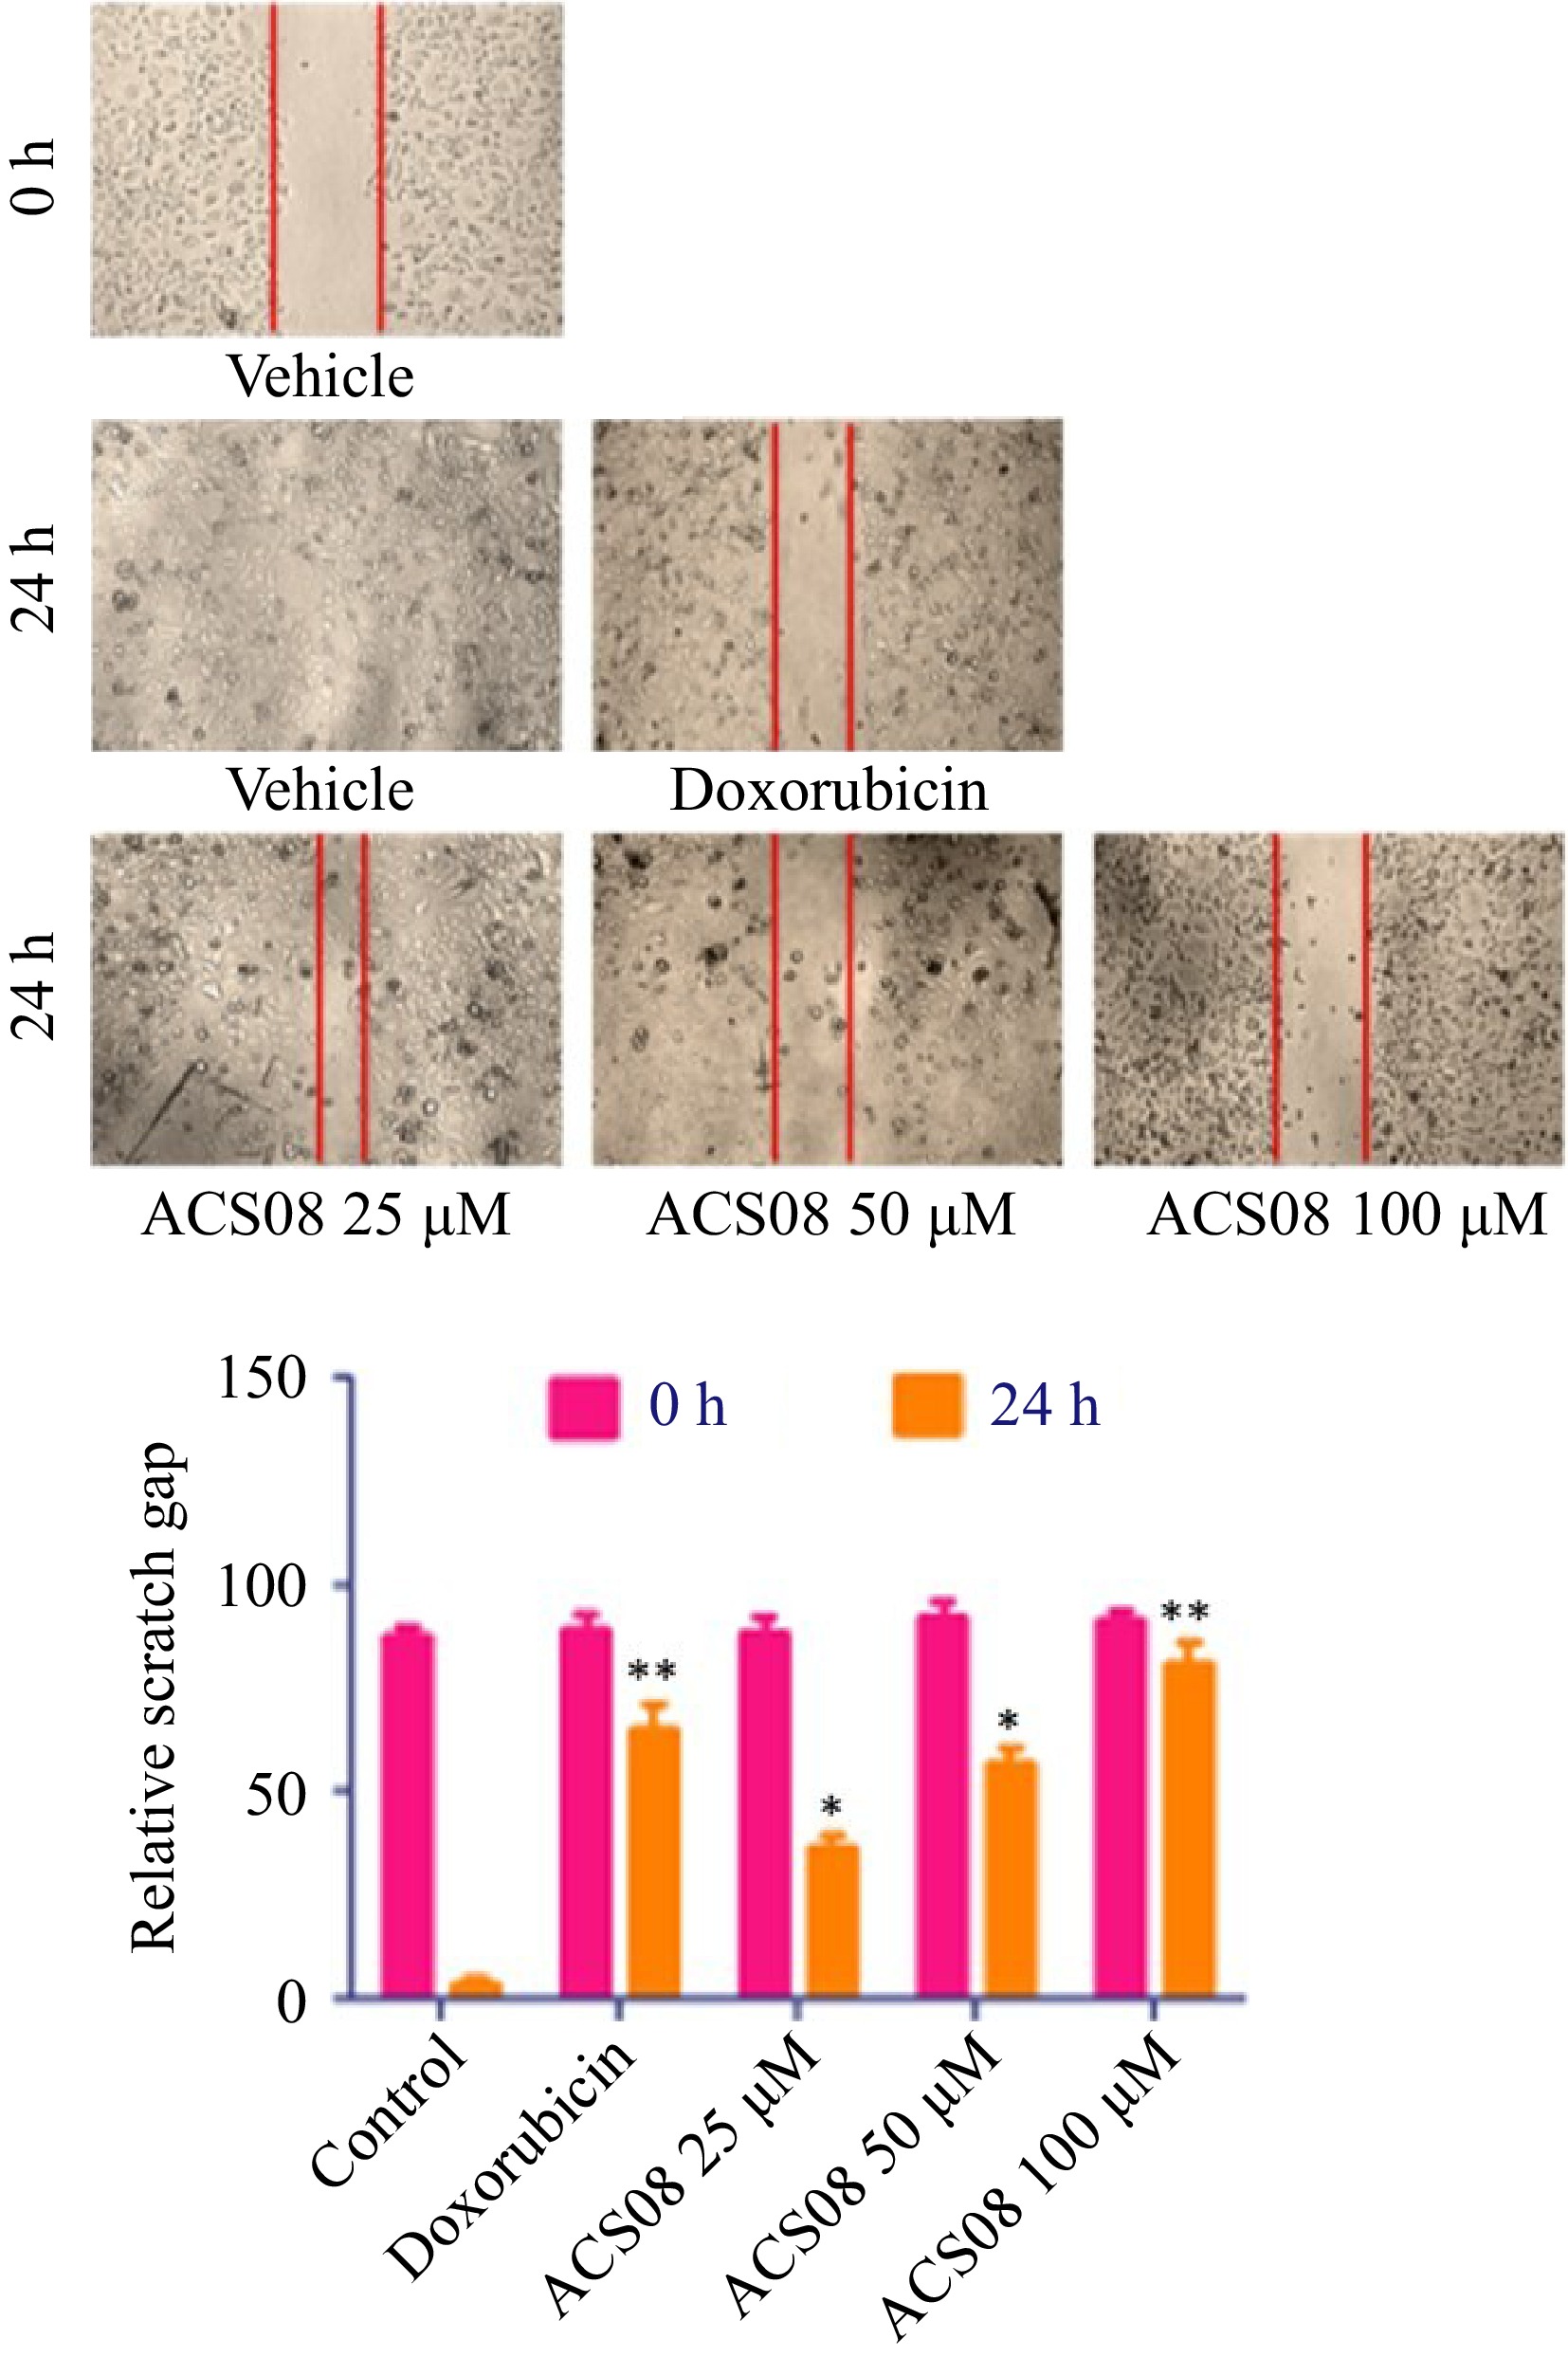
Figure 2.
Wound healing scratch assay experiment of MDA-MB-231 breast cancer cell treated with varying concentrations of ACS08 at different time points. The region of the scratch was estimated at 0 and 24 h time focuses and the migration rate was determined in relation to the corresponding control. Values are expressed as means ± SD representing three independent biological samples, each with three technical replicates. Differences were scored as statistical significance at *** p < 0.0001, ** p < 0.001, and * p < 0.05.
-

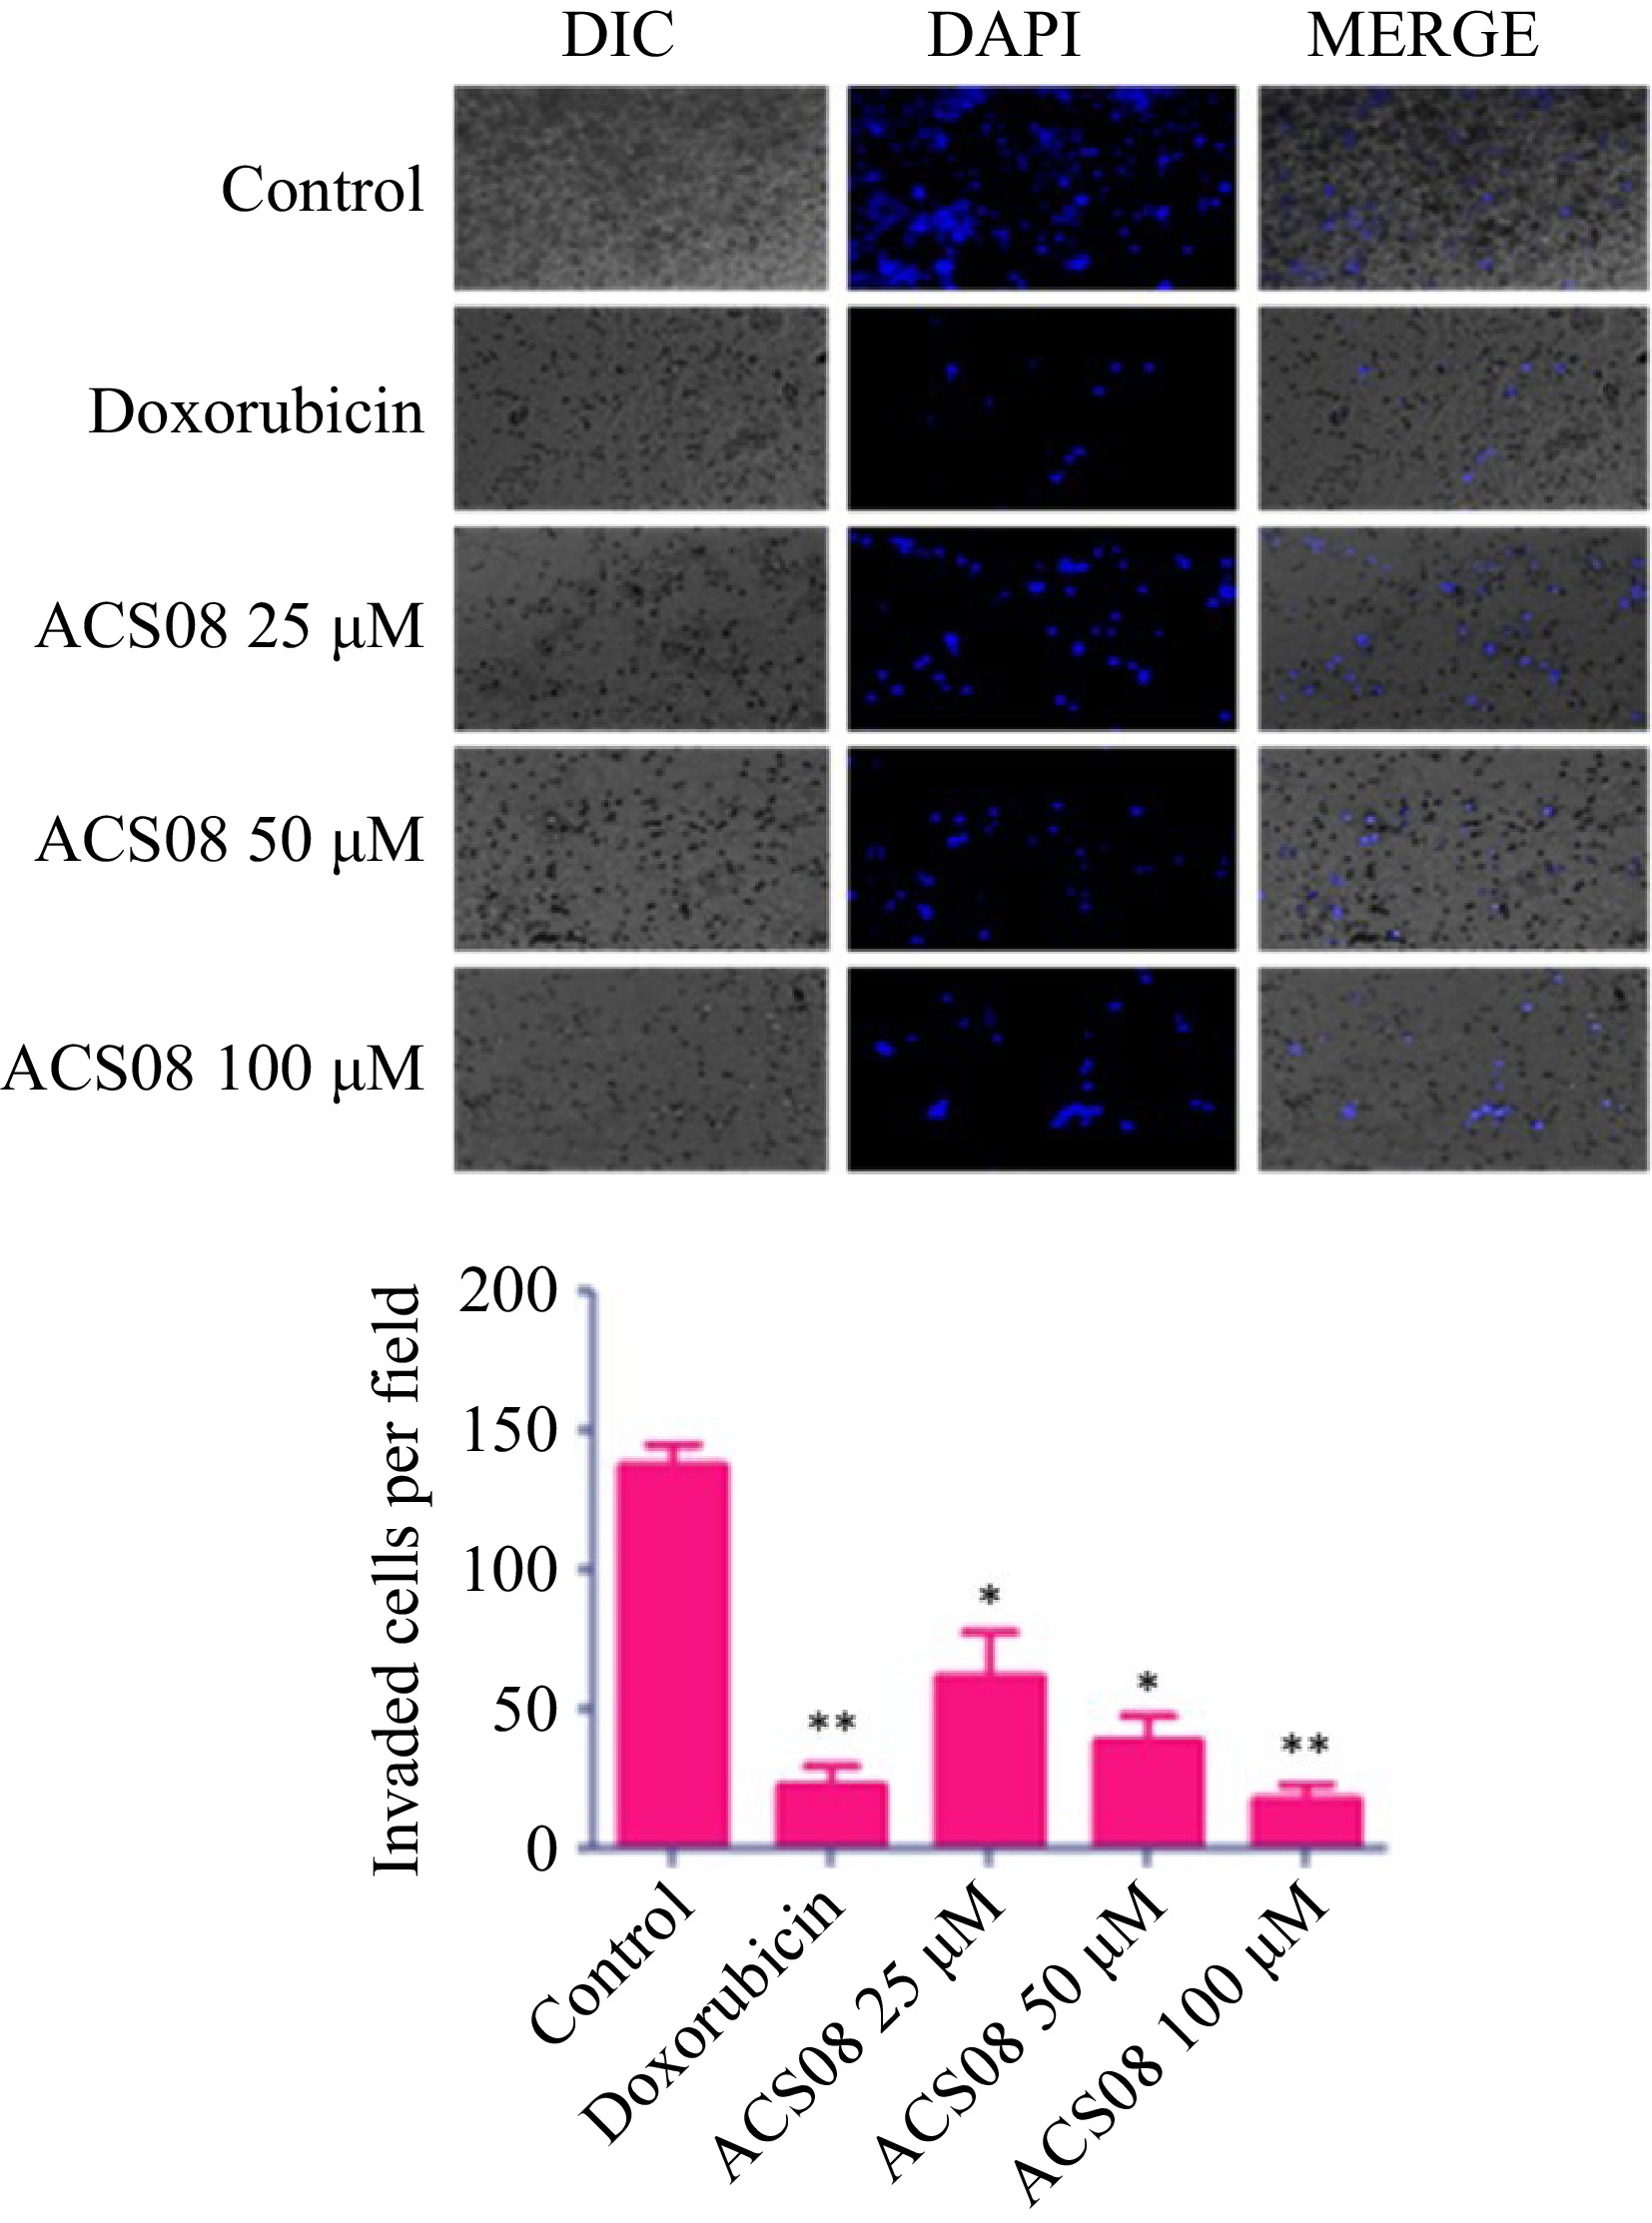
Figure 3.
Histogram and microscopic images showing MDA-MB-231 breast cancer cell migration treated with different concentrations of ACS08. Values are expressed as means ± SD representing three independent biological samples, each with three technical replicates. Differences were scored as statistical significance at *** p < 0.0001, ** p < 0.001, and * p < 0.05.
-
S. No. Different A. calamus extracts** Percentage inhibition (%)* A549 (Lung) HCT-116 (Colon) MDA-MB- 231 (Breast) 01 ExKwME 57 55 60 02 ExKpME 91 88 94 03 ExGnME 39 50 46 04 ExKwME 28 30 34 05 ExArHX 75 82 90 06 EXArAC 78 85 81 07 EXArEA 65 82 80 08 ExNJME 47 45 50 09 ExNJDC 67 65 80 10 ExRJME 58 55 60 * The values are the average of triplicate experiments. ** ExKwME (Kawoosa Methanolic extract); ExKpME (Kakpora Pulwama Methanolic extract); ExGnME (Ganastan Methanolic extract); ExArHX (Aarath Hexane extract); EXArAC (Aarath Acetone extract); EXArEA (Aarath ethylacitate extract); ExNJME (Najan Methanolic extract); ExNJDC (Najan DCM extract); ExRJME (Tuli Rajouri Methanolic extract). Table 1.
Cytotoxic activity of various extracts at 100 μg/ml concentration.
-
S. No. Different compounds
from A. calamusPercentage inhibition (%)* A549 (Lung) MIAPaCa (Pancreatic) HCT-116 (Colon) MDA-MB-231 (Breast) MDA-MB-468 (Breast) 01 ACS01 27 22 25 34 30 02 ACS02 53 59 72 85 80 03 ACS03 11 13 16 14 12 04 ACS04 25 37 40 54 38 05 ACS05 38 30 45 60 55 06 ACS06 52 45 60 68 72 07 ACS07 36 40 45 44 40 08 ACS08 63 52 74 80 64 * The values are the average of triplicate experiments. Table 2.
Cytotoxic activity of isolated compounds at 100 μM concentration.
-
Compounds A549 (Lung) MIAPaCa (Pancreatic) HCT-116 (Colon) MDA-MB-231 (Breast) MDA-MB-468 (Breast) ACS02 76.4 ± 2.1 80.56 ± 3.5 85.4 ± 2.1 65.4 ± 3.4 70.5 ± 2.3 ACS06 82.7 ± 4.5 75.3 ± 2.0 80.7 ± 1.9 69.5 ± 4.0 73.9 ± 2.1 ACS08 79.7 ± 0.5 65.59 ± 3.9 72.3 ± 2.2 55.89 ± 2.4 65.59 ± 5.0 The values are the average of triplicate experiments. Table 3.
IC50 value (μM) of selected compounds against different cancer cell lines.
Figures
(3)
Tables
(3)