-
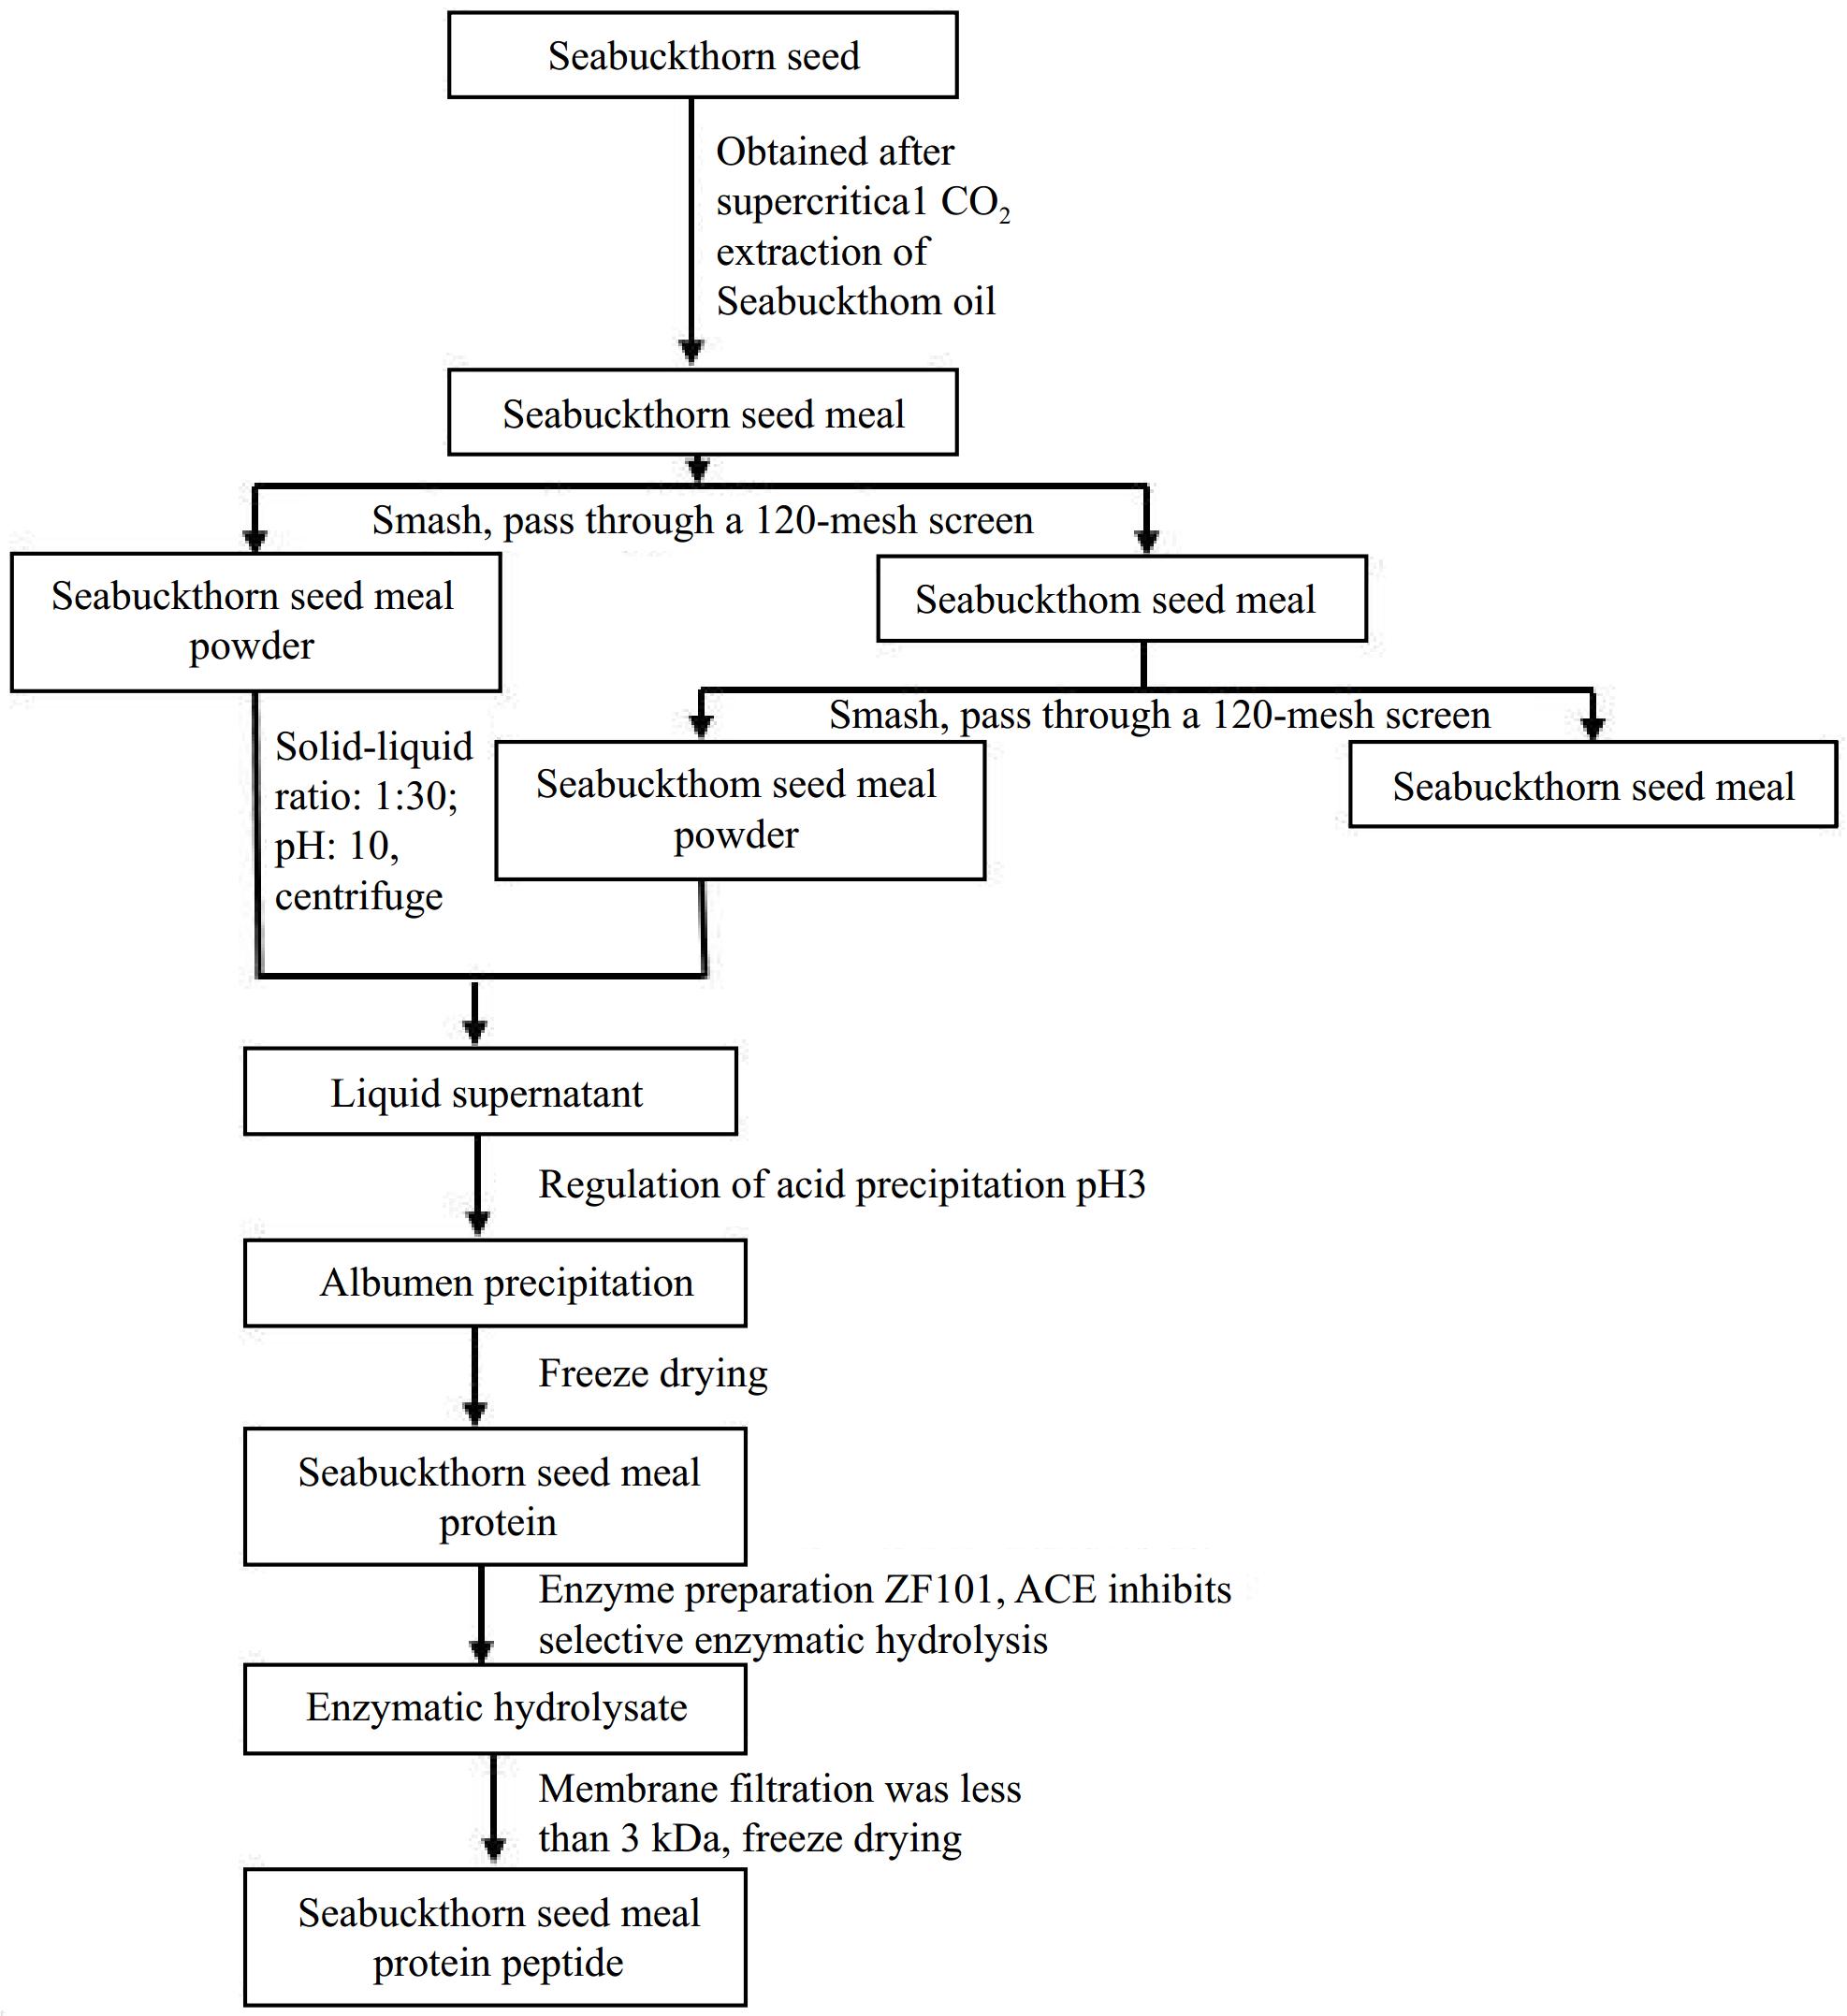
Figure 1.
Preparation of ACE inhibitory peptides from seabuckthorn seed meal.
-
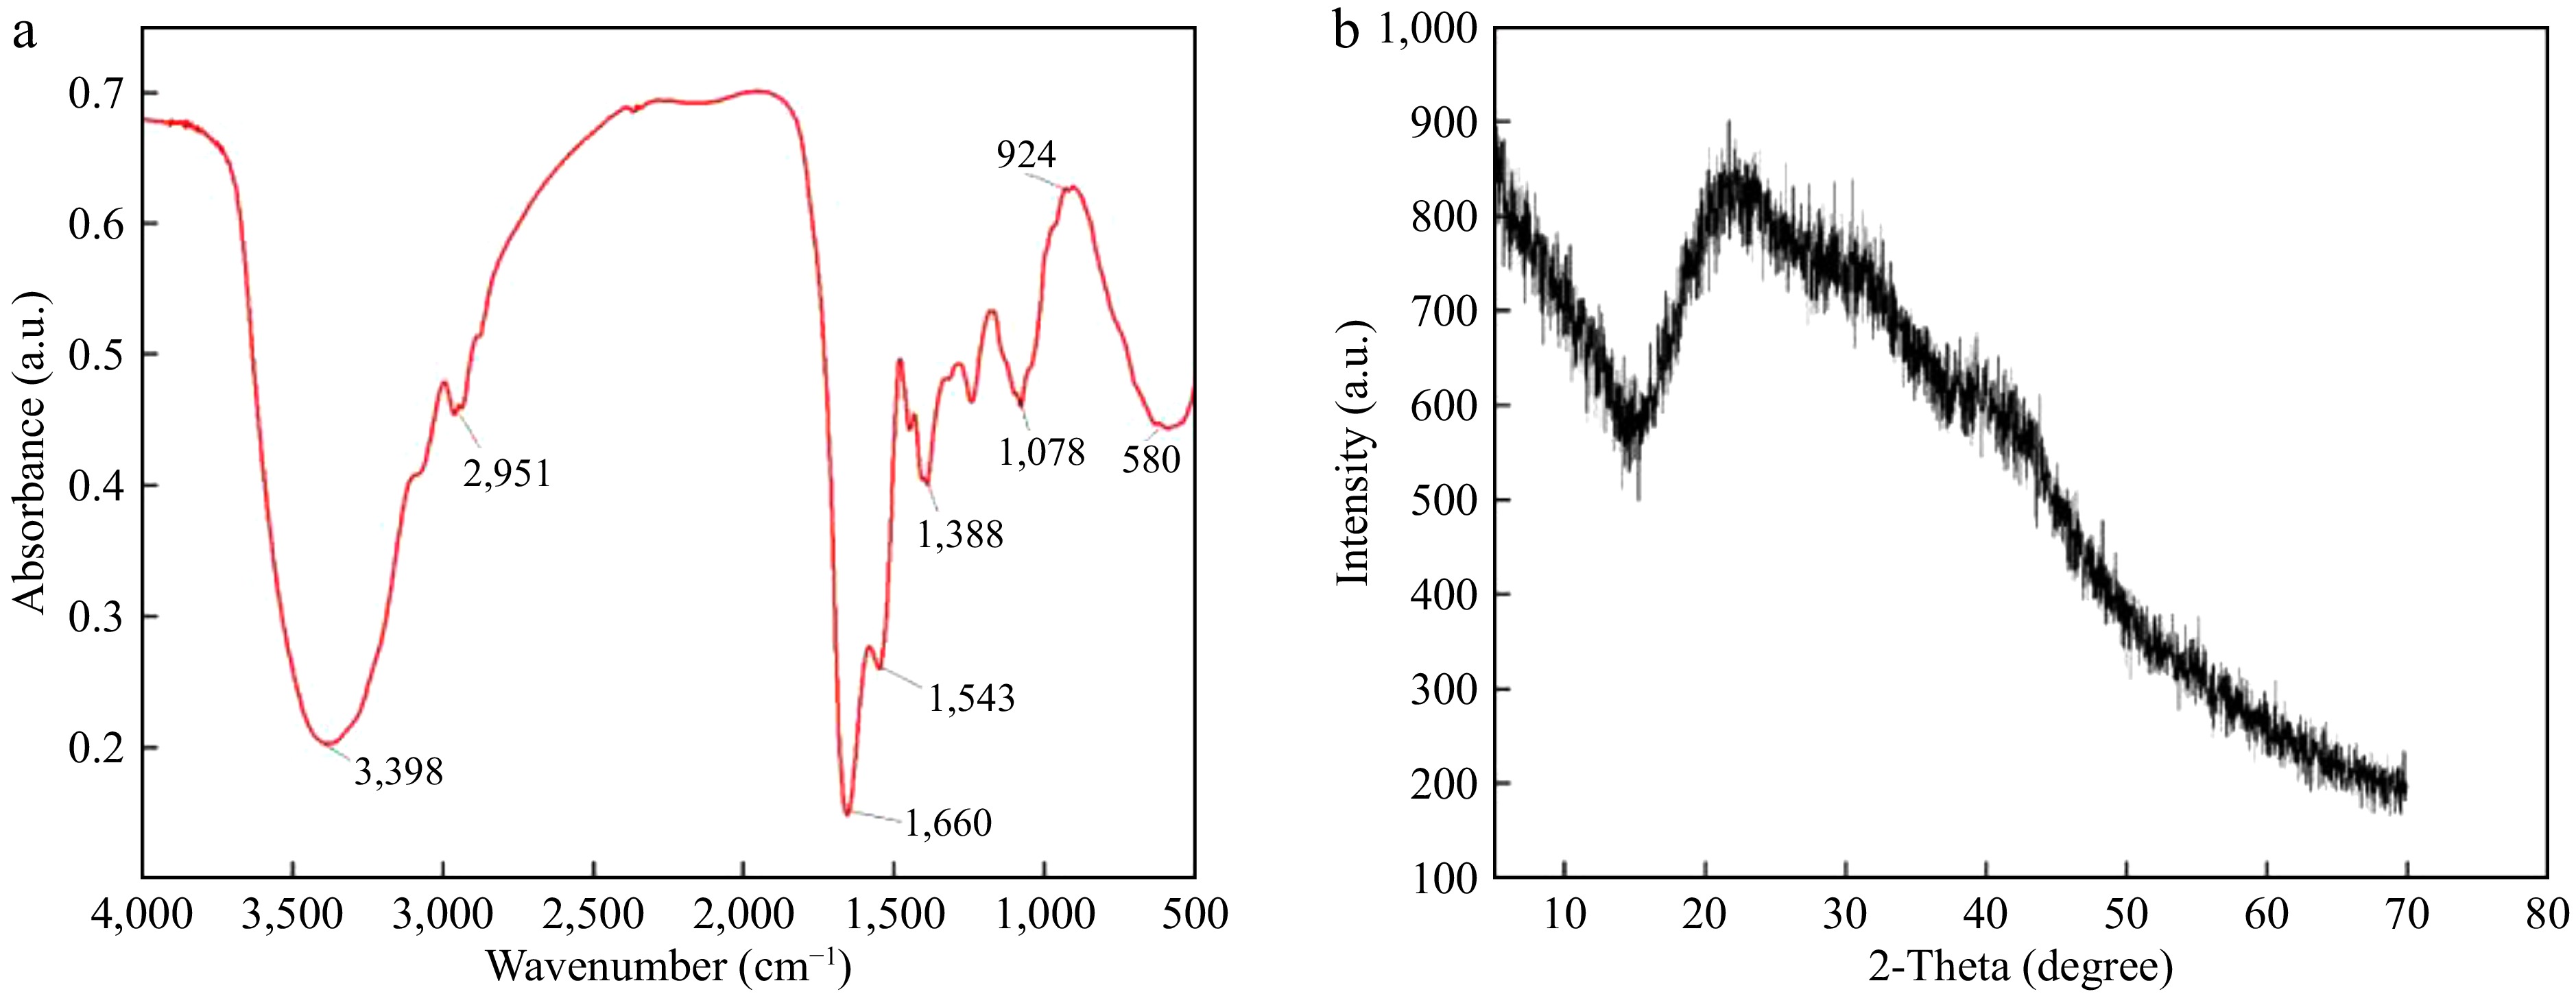
Figure 2.
(a) Infrared diffraction spectra of peptides. (b) X-ray diffraction results of peptides
-
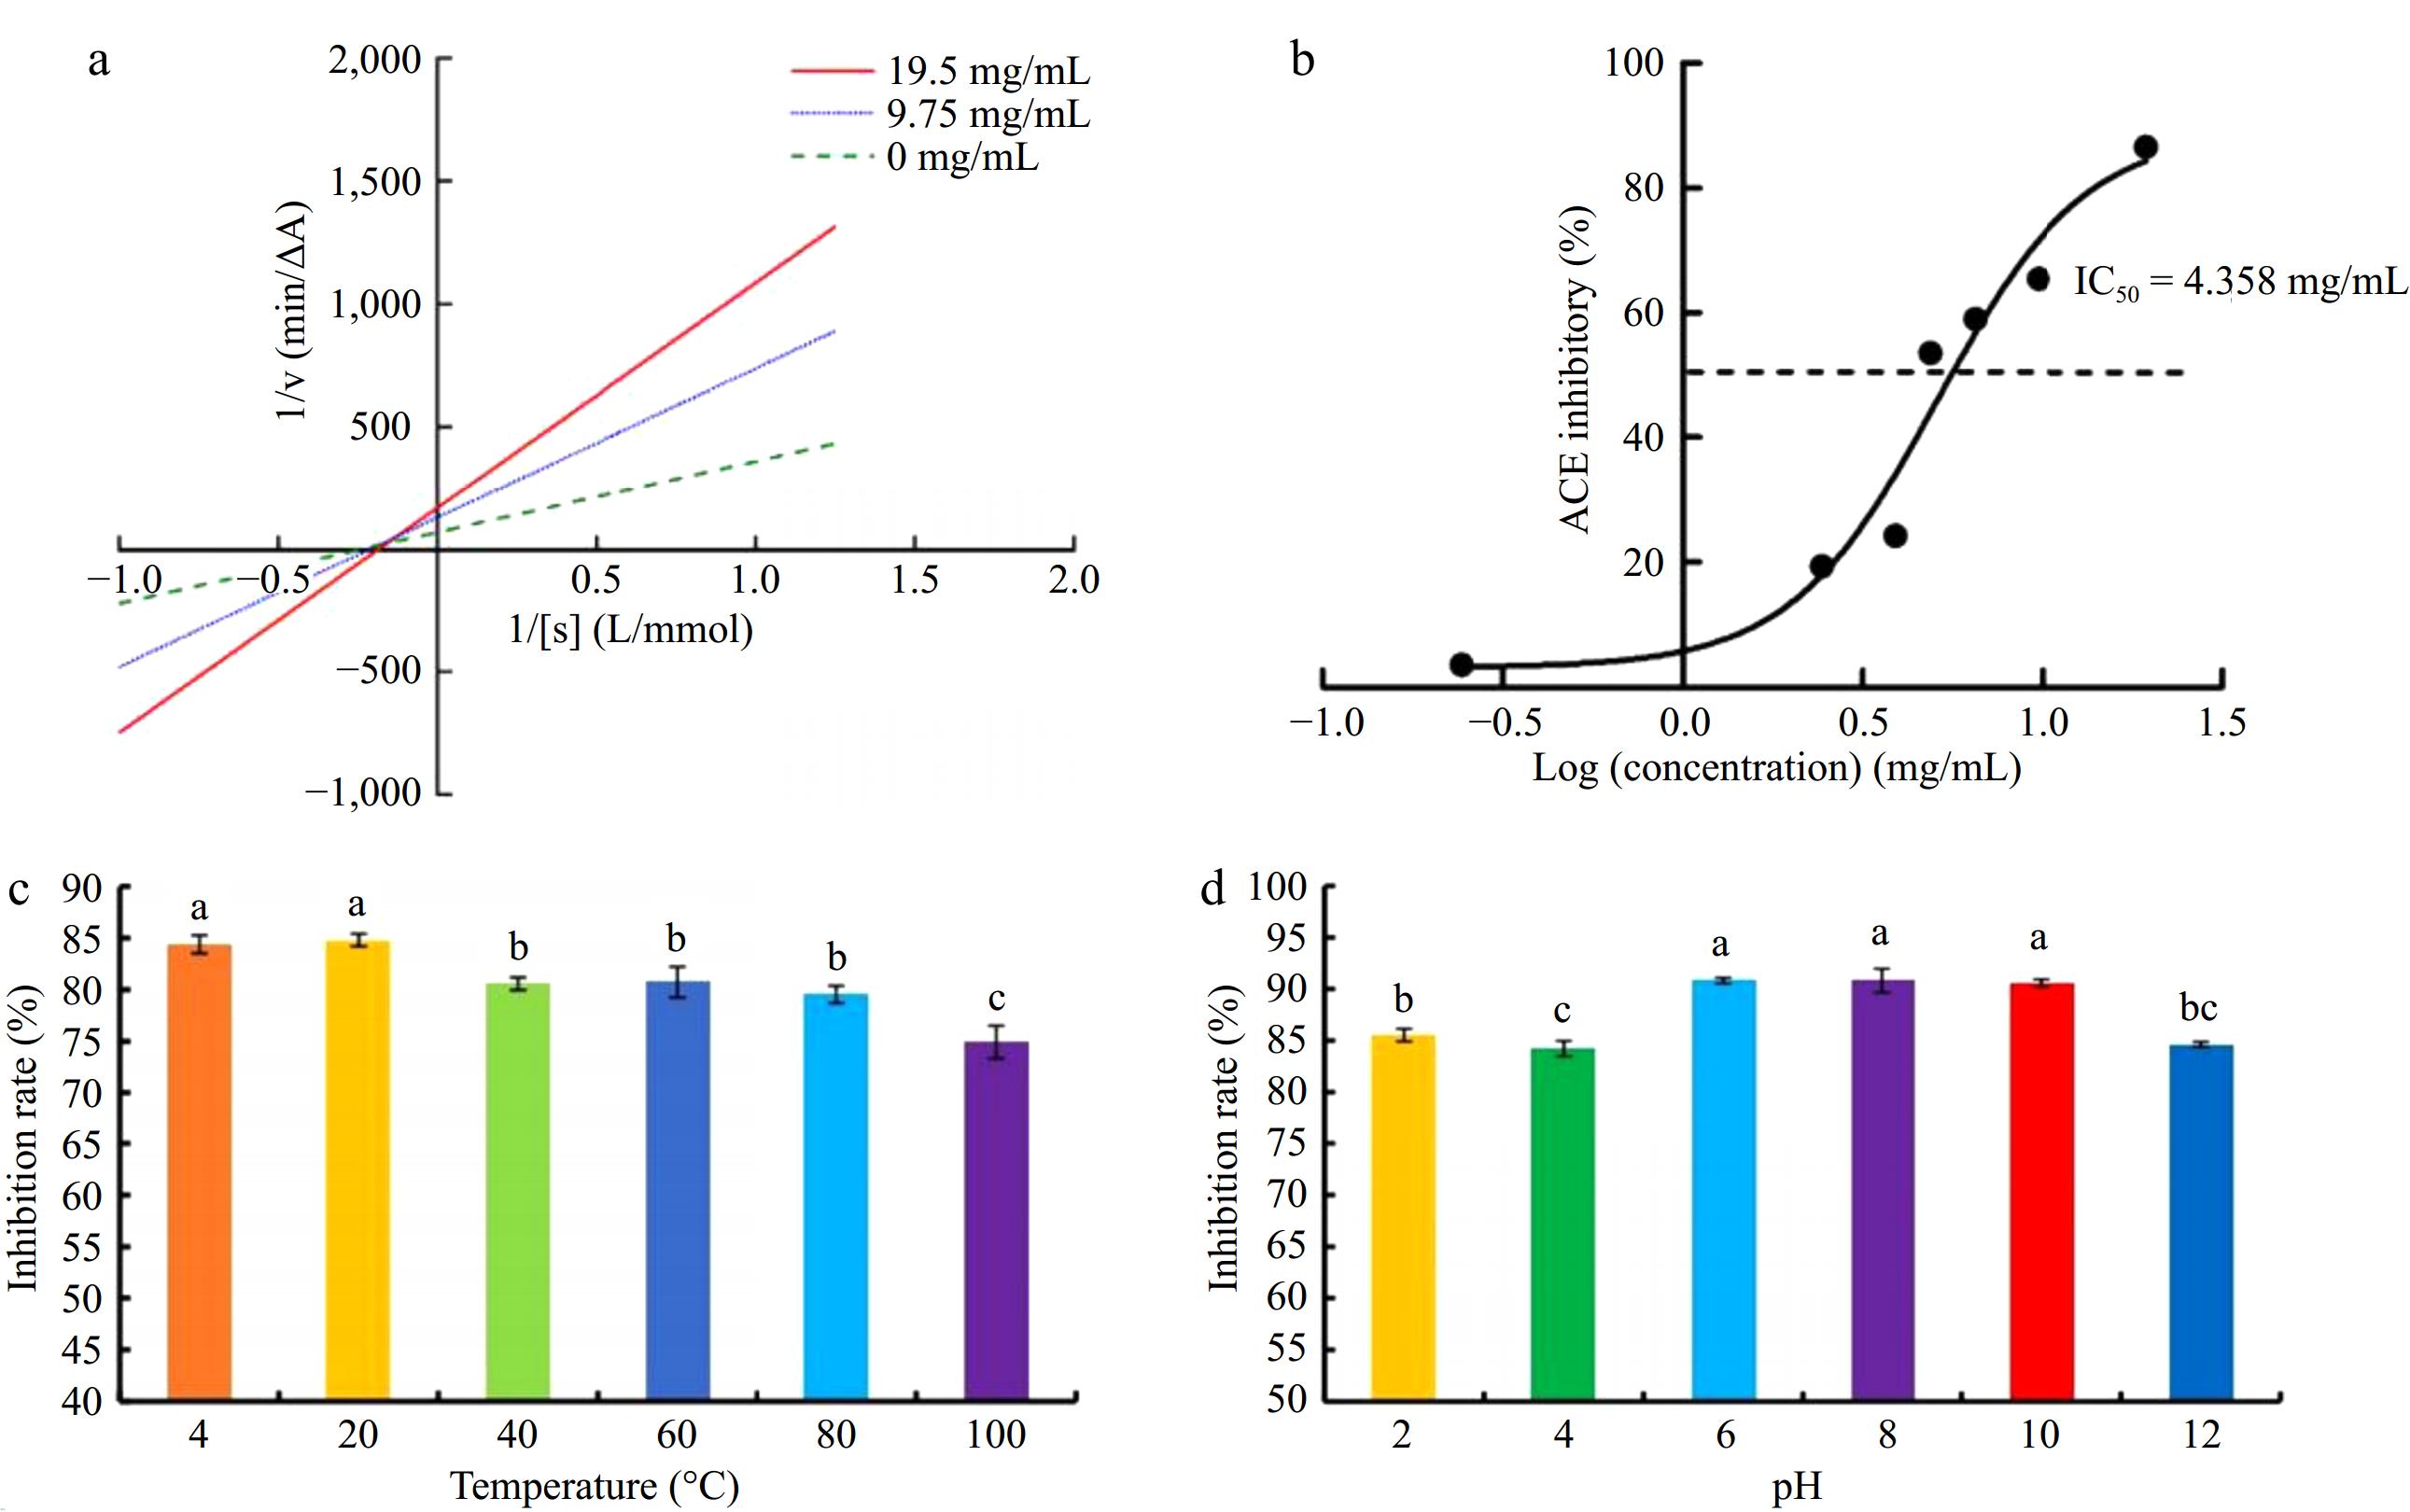
Figure 3.
(a) Relationship between ACE inhibitory peptide concentration and inhibitory activity of seabuckthorn seed meal. (b) Kinetic double reciprocal diagram of seabuckthorn seed meal polypeptide inhibiting ACE. (c) The ACE inhibition rate of seabuckthorn seed meal peptides treated at different temperatures. (d) The ACE inhibition rate of seabuckthorn seed meal peptides treated at different pH. Different letters represent significant differences at p < 0.05.
-
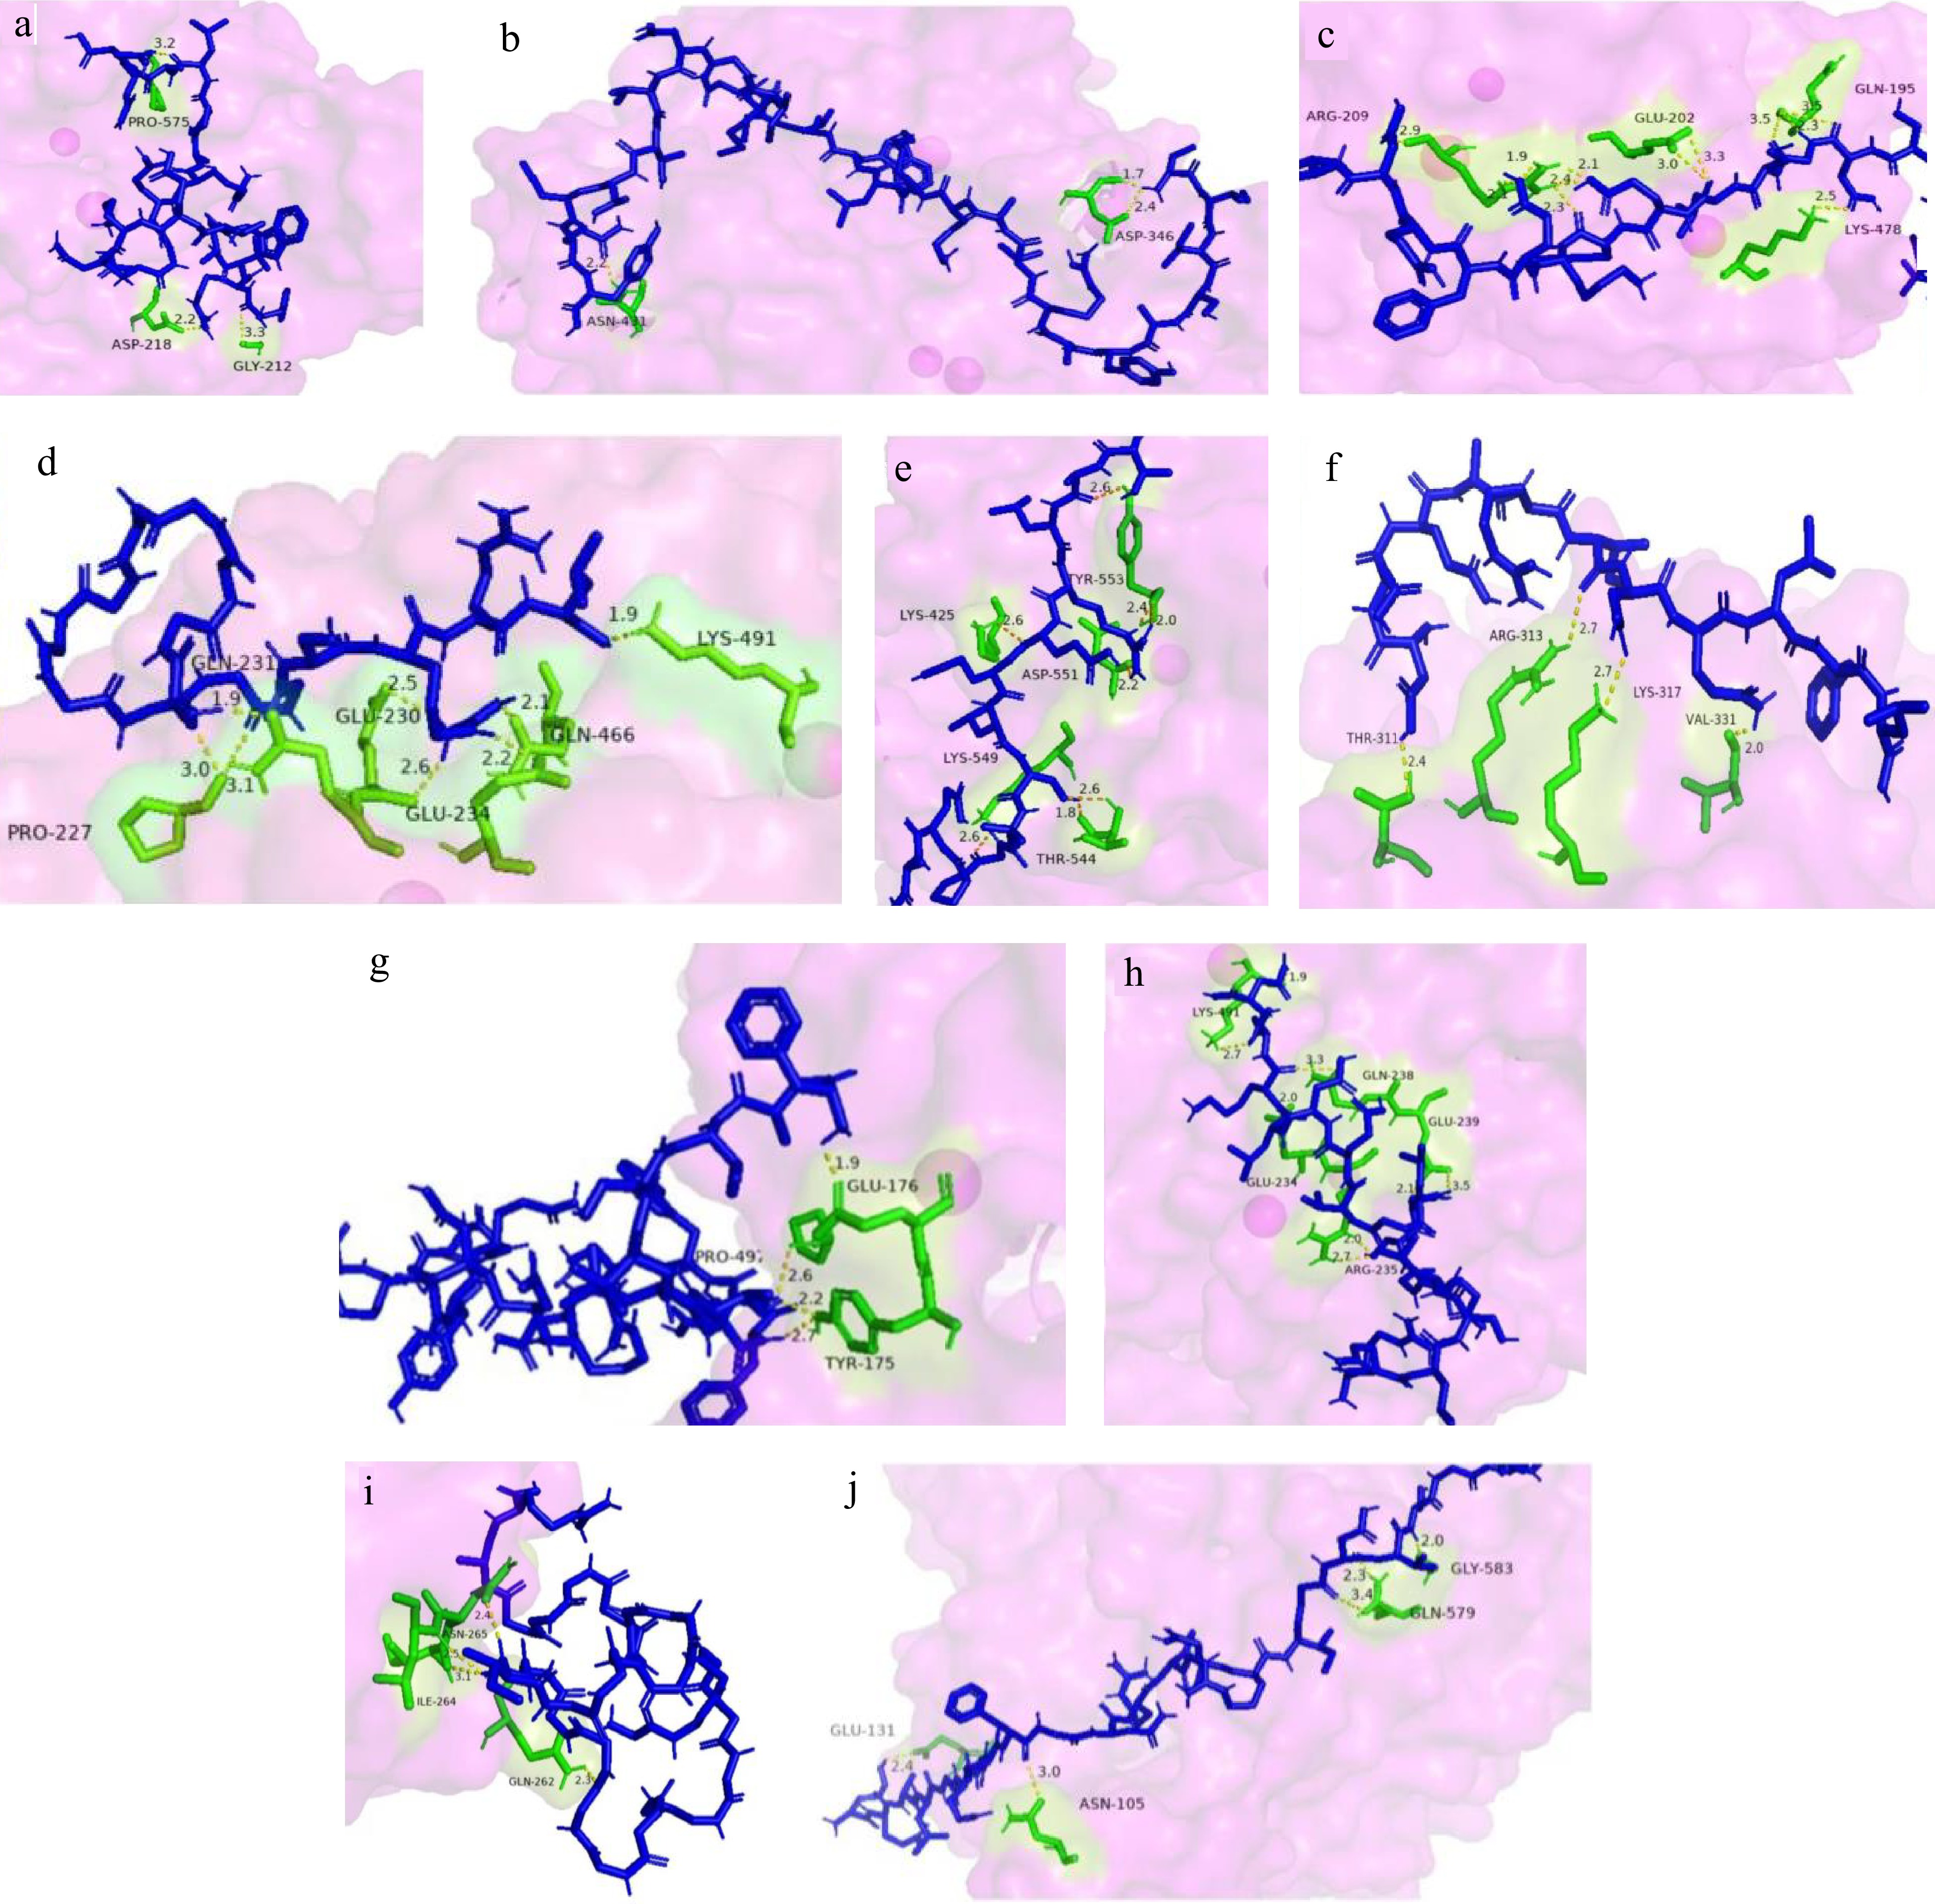
Figure 4.
Molecular docking results of peptides and ACE (1−10 docking results of 10 peptides in Table 2). Blue is peptide; Purple is ACE; Green is amino acid; Yellow is the bond created by the interaction.
-
MW (Da) PAP (%) NAMW (Da) WAMW (Da) > 500 k 13.98 768,704 803,432 500 k~100 k 15.45 191,719 239,242 100 k~50 k 11.52 67,218 69,982 50 k~20 k 26.88 30,453 32,557 20 k~10 k 24.98 14,362 14,858 < 10 k 7.19 4,191 6,573 Table 1.
Test results of protein MW of seabuckthorn seed meal.
-
MW (Da) PAP (%) NAMW (Da) WAMW (Da) > 10000 3.26 11,507 11,678 10,000~5,000 19.40 6,760 7,012 5,000~3,000 13.93 3,871 3,956 3,000~2,000 8.84 2,448 2,482 2,000~1,000 12.38 1,401 1,458 1,000~500 11.09 698 725 500~180 16.66 283 304 < 180 14.44 / / MW, Molecular weight; PAP, peak area percentage; NAMW, number average molecular weight; WAMW, weight average molecular weight. Table 2.
Determination of polypeptide MW of seabuckthorn seed meal.
-
Name Time
(min)Area
(mau*s)Content
(g/100 g)Proportion of
total amino
acid contentAspartic acid (Asp) 2.953 696.862 6.366 11.873% Glutamic (Glu) 3.400 1327.706 14.757 27.525% Serine (Ser) 6.851 363.541 2.638 4.921% Histidine (His) 7.780 62.961 1.148 2.141% Glycine (Gly) 8.724 412.175 2.162 4.033% Threonine (Thr) 9.093 180.797 1.534 2.860% Arginine (Arg) 10.430 696.119 8.622 16.082% Alanine (Ala) 11.566 339.348 2.072 3.864% Tyrosine (Tyr) 13.934 90.650 1.239 2.311% Valine (Val) 17.986 294.825 2.415 4.505% Methionine (Met) 18.348 17.390 0.177 0.330% Phenylalanine (Phe) 20.963 162.056 1.918 3.577% Isoleucine (Ile) 21.412 217.560 1.984 3.701% Leucine (Leu) 22.678 399.479 3.569 6.657% Lysine (Lys) 23.488 243.452 1.468 2.739% Proline (Pro) 29.987 291.578 1.391 2.594% Cystine (Cys) 16.960 10.302 0.154 0.287% Table 3.
Amino acid composition analysis.
-
Serial number Amino acid sequence Mass-to-charge ratio Isoelectric point Static charge Solubility 1 FRVAWTEKNDGQRAPLANN 2187.105 pH 9.86 1 Good 2 LIISVAYARVAKKLWLCNMIGDVTTEQY 3198.705 pH 8.70 0.9 Poor 3 VIRSRASDGCLEVKEFEDIPP 2360.191 pH 4.16 −2.1 Good 4 AGGGGGGGGGGSRRL 1172.588 pH 12.10 2 Good 5 LQPREGPAGGTTALREELSLGPEAALDTPPAGP 3268.681 pH 3.88 −3 Good 6 DDEARINQLFL 1333.675 pH 3.54 −2 Good 7 FAVSTLTSYDWSDRDDATQGRKL 2632.264 pH 4.19 −1 Good 8 RQLSLEGSGLGVEDLKDN 1929.988 pH 3.93 −2 Good 9 GGGGGGGGGGGGGGGIGGGGGGGGGGGAR 1841.798 pH 10.84 1 Good 10 KEALGEGCFGNRIDRIGDVSGMGCNRRTPAP 3276.578 pH 8.07 0.9 Good Table 4.
Peptide detection results and physicochemical properties.
Figures
(4)
Tables
(4)