2024 Volume 3
Article Contents
About this article
ARTICLE   Open Access    

Characterization and angiotensin-converting enzyme inhibitory activity of peptides of seabuckthorn (Hippophae rhamnoides L.) seed meal

More Information
  • Given the side effects associated with synthetic antihypertensive drugs, there is a growing need among researchers to investigate angiotensin-converting enzyme (ACE) inhibitory peptides derived from food protein as safer therapeutic alternatives. This study used seabuckthorn (Hippophae rhamnoides L.) seed meal as the raw material, and the protein was extracted by alkaline extraction and acid precipitation. After enzymatic digestion, peptides with molecular weight less than 3 kDa were selected for study. The screened peptide had an IC50 value of 4.358 mg/mL on ACE with a non-competitive inhibition mechanism and good inhibition stability. By employing infrared (IR) analysis, exclusively β-fold and β-helix structures were identified in the hydrolysate, while no other structural motifs were detected. X-ray diffraction revealed that it had an irregular amorphous structure. The peptide contains 17 amino acids that are both highly acidic and hydrophobic, with glutamic acid ranking first in terms of the number of individual amino acids. Compared with the database (NCBI, Uniport), ten peptides with ACE inhibitory activity were detected, and molecular docking showed the mechanism of each peptide inhibiting ACE, FRVAWTEKNDGQRAPLANN, LIISVAYARVAKKLWLCNMIGDVT-TEQY, VIRSRASDGCLEVKEFEDIPP, AGGGG-GGGGGGSRRL, LQPREGPAGGTT-ALREELSLGPEAALDTPPAGP, DDEARINQLFL, FAVSTLTSYDWSDRDDATQGR-KL, RQLSLEGSGLGVEDLKDN, GGGGGGGGGGGGGGGIGGGGGGGGGGGAR, and KEALGEGCFGNRIDRIGD. According to the results, AGGGGGG-GGGGSRRL is more stable in binding to ACE and may have better inhibitory activity. It has been shown that seabuckthorn protein can be an alternative source of ACE inhibitory peptides.
  • Aquaporins (AQPs) constitute a large family of transmembrane channel proteins that function as regulators of intracellular and intercellular water flow[1,2]. Since their first discovery in the 1990s, AQPs have been found not only in three domains of life, i.e., bacteria, eukaryotes, and archaea, but also in viruses[3,4]. Each AQP monomer is composed of an internal repeat of three transmembrane helices (i.e., TM1–TM6) as well as two half helixes that are formed by loop B (LB) and LE through dipping into the membrane[5]. The dual Asn-Pro-Ala (NPA) motifs that are located at the N-terminus of two half helixes act as a size barrier of the pore via creating an electrostatic repulsion of protons, whereas the so-called aromatic/arginine (ar/R) selectivity filter (i.e., H2, H5, LE1, and LE2) determines the substrate specificity by rendering the pore constriction site diverse in both size and hydrophobicity[59]. Based on sequence similarity, AQPs in higher plants could be divided into five subfamilies, i.e., plasma membrane intrinsic protein (PIP), tonoplast intrinsic protein (TIP), NOD26-like intrinsic protein (NIP), X intrinsic protein (XIP), and small basic intrinsic protein (SIP)[1017]. Among them, PIPs, which are typically localized in the cell membrane, are most conserved and play a central role in controlling plant water status[12,1822]. Among two phylogenetic groups present in the PIP subfamily, PIP1 possesses a relatively longer N-terminus and PIP2 features an extended C-terminus with one or more conserved S residues for phosphorylation modification[5,15,17].

    Tigernut (Cyperus esculentus L.), which belongs to the Cyperaceae family within Poales, is a novel and promising herbaceous C4 oil crop with wide adaptability, large biomass, and short life period[2327]. Tigernut is a unique species accumulating up to 35% oil in the underground tubers[2830], which are developed from stolons and the process includes three main stages, i.e., initiation, swelling, and maturation[3133]. Water is essential for tuber development and tuber moisture content maintains a relatively high level of approximately 85% until maturation when a significant drop to about 45% is observed[28,32]. Thereby, uncovering the mechanism of tuber water balance is of particular interest. Despite crucial roles of PIPs in the cell water balance, to date, their characterization in tigernut is still in the infancy[21]. The recently available genome and transcriptome datasets[31,33,34] provide an opportunity to address this issue.

    In this study, a global characterization of PIP genes was conducted in tigernut, including gene localizations, gene structures, sequence characteristics, and evolutionary patterns. Moreover, the correlation of CePIP mRNA/protein abundance with water content during tuber development as well as subcellular localizations were also investigated, which facilitated further elucidating the water balance mechanism in this special species.

    PIP genes reported in Arabidopsis (Arabidopsis thaliana)[10] and rice (Oryza sativa)[11] were respectively obtained from TAIR11 (www.arabidopsis.org) and RGAP7 (http://rice.uga.edu), and detailed information is shown in Supplemental Table S1. Their protein sequences were used as queries for tBLASTn[35] (E-value, 1e–10) search of the full-length tigernut transcriptome and genome sequences that were accessed from CNGBdb (https://db.cngb.org/search/assembly/CNA0051961)[31,34]. RNA sequencing (RNA-seq) reads that are available in NCBI (www.ncbi.nlm.nih.gov/sra) were also adopted for gene structure revision as described before[13], and presence of the conserved MIP (major intrinsic protein, Pfam accession number PF00230) domain in candidates was confirmed using MOTIF Search (www.genome.jp/tools/motif). To uncover the origin and evolution of CePIP genes, a similar approach was also employed to identify homologs from representative plant species, i.e., Carex cristatella (v1, Cyperaceae)[36], Rhynchospora breviuscula (v1, Cyperaceae)[37], and Juncus effusus (v1, Juncaceae)[37], whose genome sequences were accessed from NCBI (www.ncbi.nlm.nih.gov). Gene structure of candidates were displayed using GSDS 2.0 (http://gsds.gao-lab.org), whereas physiochemical parameters of deduced proteins were calculated using ProtParam (http://web.expasy.org/protparam). Subcellular localization prediction was conducted using WoLF PSORT (www.genscript.com/wolf-psort.html).

    Nucleotide and protein multiple sequence alignments were respectively conducted using ClustalW and MUSCLE implemented in MEGA6[38] with default parameters, and phylogenetic tree construction was carried out using MEGA6 with the maximum likelihood method and bootstrap of 1,000 replicates. Systematic names of PIP genes were assigned with two italic letters denoting the source organism and a progressive number based on sequence similarity. Conserved motifs were identified using MEME Suite 5.5.3 (https://meme-suite.org/tools/meme) with optimized parameters as follows: Any number of repetitions, maximum number of 15 motifs, and a width of 6 and 250 residues for each motif. TMs and conserved residues were identified using homology modeling and sequence alignment with the structure resolved spinach (Spinacia oleracea) SoPIP2;1[5].

    Synteny analysis was conducted using TBtools-II[39] as described previously[40], where the parameters were set as E-value of 1e-10 and BLAST hits of 5. Duplication modes were identified using the DupGen_finder pipeline[41], and Ks (synonymous substitution rate) and Ka (nonsynonymous substitution rate) of duplicate pairs were calculated using codeml in the PAML package[42]. Orthologs between different species were identified using InParanoid[43] and information from synteny analysis, and orthogroups (OGs) were assigned only when they were present in at least two species examined.

    Plant materials used for gene cloning, qRT-PCR analysis, and 4D-parallel reaction monitoring (4D-PRM)-based protein quantification were derived from a tigernut variety Reyan3[31], and plants were grown in a greenhouse as described previously[25]. For expression profiling during leaf development, three representative stages, i.e., young, mature, and senescing, were selected and the chlorophyll content was checked using SPAD-502Plus (Konica Minolta, Shanghai, China) as previously described[44]. Young and senescing leaves are yellow in appearance, and their chlorophyll contents are just half of that of mature leaves that are dark green. For diurnal fluctuation regulation, mature leaves were sampled every 4 h from the onset of light at 8 a.m. For gene regulation during tuber development, fresh tubers at 1, 5, 10, 15, 20, 25, and 35 d after tuber initiation (DAI) were collected as described previously[32]. All samples with three biological replicates were quickly frozen with liquid nitrogen and stored at −80 °C for further use. For subcellular localization analysis, tobacco (Nicotiana benthamiana) plants were grown as previously described[20].

    Tissue-specific expression profiles of CePIP genes were investigated using Illumina RNA-seq samples (150 bp paired-end reads) with three biological replicates for young leaf, mature leaf, sheath of mature leaf, shoot apex, root, rhizome, and three stages of developmental tuber (40, 85, and 120 d after sowing (DAS)), which are under the NCBI accession number of PRJNA703731. Raw sequence reads in the FASTQ format were obtained using fastq-dump, and quality control was performed using fastQC (www.bioinformatics.babraham.ac.uk/projects/fastqc). Read mapping was performed using HISAT2 (v2.2.1, https://daehwankimlab.github.io/hisat2), and relative gene expression level was presented as FPKM (fragments per kilobase of exon per million fragments mapped)[45].

    For qRT-PCR analysis, total RNA extraction and synthesis of the first-strand cDNA were conducted as previously described[24]. Primers used in this study are shown in Supplemental Table S2, where CeUCE2 and CeTIP41[25,33] were employed as two reference genes. PCR reaction in triplicate for each biological sample was carried out using the SYBR-green Mix (Takara) on a Real-time Thermal Cycler Type 5100 (Thermal Fisher Scientific Oy). Relative gene abundance was estimated with the 2−ΔΔCᴛ method and statistical analysis was performed using SPSS Statistics 20 as described previously[13].

    Raw proteomic data for tigernut roots, leaves, freshly harvested, dried, rehydrated for 48 h, and sprouted tubers were downloaded from ProteomeXchange/PRIDE (www.proteomexchange.org, PXD021894, PXD031123, and PXD035931), which were further analyzed using Maxquant (v1.6.15.0, www.maxquant.org). Three dominant members, i.e., CePIP1;1, -2;1, and -2;8, were selected for 4D-PRM quantification analysis, and related unique peptides are shown in Supplemental Table S3. Protein extraction, trypsin digestion, and LC-MS/MS analysis were conducted as described previously[46].

    For subcellular localization analysis, the coding region (CDS) of CePIP1;1, -2;1, and -2;8 were cloned into pNC-Cam1304-SubN via Nimble Cloning as described before[30]. Then, recombinant plasmids were introduced into Agrobacterium tumefaciens GV3101 with the helper plasmid pSoup-P19 and infiltration of 4-week-old tobacco leaves were performed as previously described[20]. For subcellular localization analysis, the plasma membrane marker HbPIP2;3-RFP[22] was co-transformed as a positive control. Fluorescence observation was conducted using confocal laser scanning microscopy imaging (Zeiss LMS880, Germany): The wavelength of laser-1 was set as 730 nm for RFP observation, where the fluorescence was excited at 561 nm; the wavelength of laser-2 was set as 750 nm for EGFP observation, where the fluorescence was excited at 488 nm; and the wavelength of laser-3 was set as 470 nm for chlorophyll autofluorescence observation, where the fluorescence was excited at 633 nm.

    As shown in Table 1, a total of 14 PIP genes were identified from eight tigernut scaffolds (Scfs). The CDS length varies from 831 to 882 bp, putatively encoding 276–293 amino acids (AA) with a molecular weight (MW) of 29.16–31.59 kilodalton (kDa). The theoretical isoelectric point (pI) varies from 7.04 to 9.46, implying that they are all alkaline. The grand average of hydropathicity (GRAVY) is between 0.344 and 0.577, and the aliphatic index (II) ranges from 94.57 to 106.90, which are consistent with the hydrophobic characteristic of AQPs[47]. As expected, like SoPIP2;1, all CePIPs include six TMs, two typical NPA motifs, the invariable ar/R filter F-H-T-R, five conserved Froger's positions Q/M-S-A-F-W, and two highly conserved residues corresponding to H193 and L197 in SoPIP2;1 that were proven to be involved in gating[5,48], though the H→F variation was found in CePIP2;9, -2;10, and -2;11 (Supplemental Fig. S1). Moreover, two S residues, corresponding to S115 and S274 in SoPIP2;1[5], respectively, were also found in the majority of CePIPs (Supplemental Fig. S1), implying their posttranslational regulation by phosphorylation.

    Table 1.  Fourteen PIP genes identified in C. esculentus.
    Gene name Locus Position Intron no. AA MW (kDa) pI GRAVY AI TM MIP
    CePIP1;1 CESC_15147 Scf9:2757378..2759502(–) 3 288 30.76 8.82 0.384 95.28 6 47..276
    CePIP1;2 CESC_04128 Scf4:3806361..3807726(–) 3 291 31.11 8.81 0.344 95.95 6 46..274
    CePIP1;3 CESC_15950 Scf54:5022493..5023820(+) 3 289 31.06 8.80 0.363 94.57 6 49..278
    CePIP2;1 CESC_15350 Scf9:879960..884243(+) 3 288 30.34 8.60 0.529 103.02 6 33..269
    CePIP2;2 CESC_00011 Scf30:4234620..4236549(+) 3 293 31.59 9.27 0.394 101.57 6 35..268
    CePIP2;3 CESC_00010 Scf30:4239406..4241658(+) 3 291 30.88 9.44 0.432 98.97 6 31..266
    CePIP2;4 CESC_05080 Scf46:307799..309544(+) 3 285 30.44 7.04 0.453 100.32 6 28..265
    CePIP2;5 CESC_05079 Scf46:312254..314388(+) 3 286 30.49 7.04 0.512 101.68 6 31..268
    CePIP2;6 CESC_05078 Scf46:316024..317780(+) 3 288 30.65 7.68 0.475 103.06 6 31..268
    CePIP2;7 CESC_05077 Scf46:320439..322184(+) 3 284 30.12 8.55 0.500 100.00 6 29..266
    CePIP2;8 CESC_14470 Scf2:4446409..4448999(+) 3 284 30.37 8.30 0.490 106.90 6 33..263
    CePIP2;9 CESC_02223 Scf1:2543928..2545778(–) 3 283 30.09 9.46 0.533 106.47 6 31..262
    CePIP2;10 CESC_10007 Scf27:1686032..1688010(–) 3 276 29.16 9.23 0.560 106.05 6 26..256
    CePIP2;11 CESC_10009 Scf27:1694196..1696175(–) 3 284 29.71 9.10 0.577 105.49 6 33..263
    AA: amino acid; AI: aliphatic index; GRAVY: grand average of hydropathicity; kDa: kilodalton; MIP: major intrinsic protein; MW: molecular weight; pI: isoelectric point; PIP: plasma membrane intrinsic protein; Scf: scaffold; TM: transmembrane helix.
     | Show Table
    DownLoad: CSV

    To uncover the evolutionary relationships, an unrooted phylogenetic tree was constructed using the full-length protein sequences of CePIPs together with 11 OsPIPs and 13 AtPIPs. As shown in Fig. 1a, these proteins were clustered into two main groups, corresponding to PIP1 and PIP2 as previously defined[10,49], and each appears to have evolved into several subgroups. Compared with PIP1s, PIP2s possess a relatively shorter N-terminal but an extended C-terminal with one conserved S residue (Supplemental Fig. S1). Interestingly, a high number of gene repeats were detected, most of which seem to be species-specific, i.e., AtPIP1;1/-1;2/-1;3/-1;4/-1;5, AtPIP2;1/-2;2/-2;3/-2;4/-2;5/-2;6, AtPIP2;7/-2;8, OsPIP1;1/-1;2/-1;3, OsPIP2;1/-2;4/-2;5, OsPIP2;2/-2;3, CePIP1;1/-1;2, CePIP2;2/-2;3, CePIP2;4/-2;5/-2;6/-2;7, and CePIP2;9/-2;10/-2;11, reflecting the occurrence of more than one lineage-specific whole-genome duplications (WGDs) after their divergence[50,51]. In Arabidopsis that experienced three WGDs (i.e. γ, β, and α) after the split with the monocot clade[52], AtPIP1;5 in the PIP1 group first gave rise to AtPIP1;1 via the γ WGD shared by all core eudicots[50], which latter resulted in AtPIP1;3, -1;4, and -1;2 via β and α WGDs; AtPIP2;1 in the PIP2 group first gave rise to AtPIP2;6 via the γ WGD, and they latter generated AtPIP2;2, and -2;5 via the α WGD (Supplemental Table S1). In rice, which also experienced three WGDs (i.e. τ, σ, and ρ) after the split with the eudicot clade[51], OsPIP1;2 and -2;3 generated OsPIP1;1 and -2;2 via the Poaceae-specific ρ WGD, respectively. Additionally, tandem, proximal, transposed and dispersed duplications also played a role on the gene expansion in these two species (Supplemental Table S1).

    Figure 1.  Structural and phylogenetic analysis of PIPs in C. esculentus, O. sativa, and A. thaliana. (a) Shown is an unrooted phylogenetic tree resulting from full-length PIPs with MEGA6 (maximum likelihood method and bootstrap of 1,000 replicates), where the distance scale denotes the number of amino acid substitutions per site. (b) Shown are the exon-intron structures. (c) Shown is the distribution of conserved motifs among PIPs, where different motifs are represented by different color blocks as indicated and the same color block in different proteins indicates a certain motif. (At: A. thaliana; Ce: C. esculentus; PIP: plasma membrane intrinsic protein; Os: O. sativa).

    Analysis of gene structures revealed that all CePIP and AtPIP genes possess three introns and four exons in the CDS, in contrast to the frequent loss of certain introns in rice, including OsPIP1;2, -1;3, -2;1, -2;3, -2;4, -2;5, -2;6, -2;7, and -2;8 (Fig. 1b). The positions of three introns are highly conserved, which are located in sequences encoding LB (three residues before the first NPA), LD (one residue before the conserved L involved in gating), and LE (18 residues after the second NPA), respectively (Supplemental Fig. S1). The intron length of CePIP genes is highly variable, i.e., 109–993 bp, 115–1745 bp, and 95–866 bp for three introns, respectively. By contrast, the exon length is relatively less variable: Exons 2 and 3 are invariable with 296 bp and 141 bp, respectively, whereas Exons 1 and 4 are of 277–343 bp and 93–132 bp, determining the length of N- and C-terminus of PIP1 and PIP2, respectively (Fig. 1b). Correspondingly, their protein structures were shown to be highly conserved, and six (i.e., Motifs 1–6) out of 15 motifs identified are broadly present. Among them, Motif 3, -2, -6, -1, and -4 constitute the conserved MIP domain. In contrast to a single Motif 5 present in most PIP2s, all PIP1s possess two sequential copies of Motif 5, where the first one is located at the extended N-terminal. In CePIP2;3 and OsPIP2;7, Motif 5 is replaced by Motif 13; in CePIP2;2, it is replaced by two copies of Motif 15; and no significant motif was detected in this region of CePIP2;10. PIP1s and PIP2s usually feature Motif 9 and -7 at the C-terminal, respectively, though it is replaced by Motif 12 in CePIP2;6 and OsPIP2;8. PIP2s usually feature Motif 8 at the N-terminal, though it is replaced by Motif 14 in CePIP2;2 and -2;3 or replaced by Motif 11 in CePIP2;10 and -2;11 (Fig. 1c).

    As shown in Fig. 2a, gene localization of CePIPs revealed three gene clusters, i.e., CePIP2;2/-2;3 on Scf30, CePIP2;4/-2;5/-2;6/-2;7 on Scf46, and CePIP2;10/-2;11 on Scf27, which were defined as tandem repeats for their high sequence similarities and neighboring locations. The nucleotide identities of these duplicate pairs vary from 70.5% to 91.2%, and the Ks values range from 0.0971 to 1.2778 (Table 2), implying different time of their birth. According to intra-species synteny analysis, two duplicate pairs, i.e., CePIP1;1/-1;2 and CePIP2;2/-2;4, were shown to be located within syntenic blocks (Fig. 2b) and thus were defined as WGD repeats. Among them, CePIP1;1/-1;2 possess a comparable Ks value to CePIP2;2/-2;3, CePIP1;1/-1;3, and CePIP2;4/-2;8 (1.2522 vs 1.2287–1.2778), whereas CePIP2;2/-2;4 harbor a relatively higher Ks value of 1.5474 (Table 2), implying early origin or fast evolution of the latter. While CePIP1;1/-1;3 and CePIP2;1/-2;8 were characterized as transposed repeats, CePIP2;1/-2;2, CePIP2;9/-2;10, and CePIP2;8/-2;10 were characterized as dispersed repeats (Fig. 2a). The Ks values of three dispersed repeats vary from 0.8591 to 3.0117 (Table 2), implying distinct times of origin.

    Figure 2.  Duplication events of CePIP genes and synteny analysis within and between C. esculentus, O. sativa, and A. thaliana. (a) Duplication events detected in tigernut. Serial numbers are indicated at the top of each scaffold, and the scale is in Mb. Duplicate pairs identified in this study are connected using lines in different colors, i.e., tandem (shown in green), transposed (shown in purple), dispersed (shown in gold), and WGD (shown in red). (b) Synteny analysis within and between C. esculentus, O. sativa, and A. thaliana. (c) Synteny analysis within and between C. esculentus, C. cristatella, R. breviuscula, and J. effusus. Shown are PIP-encoding chromosomes/scaffolds and only syntenic blocks that contain PIP genes are marked, i.e., red and purple for intra- and inter-species, respectively. (At: A. thaliana; Cc: C. cristatella; Ce: C. esculentus; Je: J. effusus; Mb: megabase; PIP: plasma membrane intrinsic protein; Os: O. sativa; Rb: R. breviuscula; Scf: scaffold; WGD: whole-genome duplication).
    Table 2.  Sequence identity and evolutionary rate of homologous PIP gene pairs identified in C. esculentus. Ks and Ka were calculated using PAML.
    Duplicate 1 Duplicate 2 Identity (%) Ka Ks Ka/Ks
    CePIP1;1 CePIP1;3 78.70 0.0750 1.2287 0.0610
    CePIP1;2 CePIP1;1 77.20 0.0894 1.2522 0.0714
    CePIP2;1 CePIP2;4 74.90 0.0965 1.7009 0.0567
    CePIP2;3 CePIP2;2 70.50 0.1819 1.2778 0.1424
    CePIP2;4 CePIP2;2 66.50 0.2094 1.5474 0.1353
    CePIP2;5 CePIP2;4 87.30 0.0225 0.4948 0.0455
    CePIP2;6 CePIP2;5 84.90 0.0545 0.5820 0.0937
    CePIP2;7 CePIP2;6 78.70 0.0894 1.0269 0.0871
    CePIP2;8 CePIP2;4 72.90 0.1401 1.2641 0.1109
    CePIP2;9 CePIP2;10 76.40 0.1290 0.8591 0.1502
    CePIP2;10 CePIP2;8 64.90 0.2432 3.0117 0.0807
    CePIP2;11 CePIP2;10 91.20 0.0562 0.0971 0.5783
    Ce: C. esculentus; Ka: nonsynonymous substitution rate; Ks: synonymous substitution rate; PIP: plasma membrane intrinsic protein.
     | Show Table
    DownLoad: CSV

    According to inter-species syntenic analysis, six out of 14 CePIP genes were shown to have syntelogs in rice, including 1:1, 1:2, and 2:2 (i.e. CePIP1;1 vs OsPIP1;3, CePIP1;3 vs OsPIP1;2/-1;1, CePIP2;1 vs OsPIP2;4, CePIP2;2/-2;4 vs OsPIP2;3/-2;2, and CePIP2;8 vs OsPIP2;6), in striking contrast to a single one found in Arabidopsis (i.e. CePIP1;2 vs AtPIP1;2). Correspondingly, only OsPIP1;2 in rice was shown to have syntelogs in Arabidopsis, i.e., AtPIP1;3 and -1;4 (Fig. 2b). These results are consistent with their taxonomic relationships that tigernut and rice are closely related[50,51], and also imply lineage-specific evolution after their divergence.

    As described above, phylogenetic and syntenic analyses showed that the last common ancestor of tigernut and rice is more likely to possess only two PIP1s and three PIP2s. However, it is not clear whether the gene expansion observed in tigernut is species-specific or Cyperaceae-specific. To address this issue, recently available genomes were used to identify PIP subfamily genes from C. cristatella, R. breviuscula, and J. effuses, resulting in 15, 13, and nine members, respectively. Interestingly, in contrast to a high number of tandem repeats found in Cyperaceae species, only one pair of tandem repeats (i.e., JePIP2;3 and -2;4) were identified in J. effusus, a close outgroup species to Cyperaceae in the Juncaceae family[36,37]. According to homologous analysis, a total of 12 orthogroups were identified, where JePIP genes belong to PIP1A (JePIP1;1), PIP1B (JePIP1;2), PIP1C (JePIP1;3), PIP2A (JePIP2;1), PIP2B (JePIP2;2), PIP2F (JePIP2;3 and -2;4), PIP2G (JePIP2;5), and PIP2H (JePIP2;6) (Table 3). Further intra-species syntenic analysis revealed that JePIP1;1/-1;2 and JePIP2;2/-2;3 are located within syntenic blocks, which is consistent with CePIP1;1/-1;2, CePIP2;2/-2;4, CcPIP1;1/-1;2, CcPIP2;3/-2;4, RbPIP1;1/-1;2, and RbPIP2;2/-2;5 (Fig. 2c), implying that PIP1A/PIP1B and PIP2B/PIP2D were derived from WGDs occurred sometime before Cyperaceae-Juncaceae divergence. After the split with Juncaceae, tandem duplications frequently occurred in Cyperaceae, where PIP2B/PIP2C and PIP2D/PIP2E/PIP2F retain in most Cyperaceae plants examined in this study. By contrast, species-specific expansion was also observed, i.e., CePIP2;4/-2;5, CePIP2;10/-2;11, CcPIP1;2/-1;3, CcPIP2;4/-2;5, CcPIP2;8/-2;9, CcPIP2;10/-2;11, RbPIP2;3/-2;4, and RbPIP2;9/-2;10 (Table 3 & Fig. 2c).

    Table 3.  Twelve proposed orthogroups based on comparison of representative plant species.
    Orthogroup C. esculentus C. cristatella R. breviuscula J. effusus O. sativa A. thaliana
    PIP1A CePIP1;1 CcPIP1;1 RbPIP1;1 JePIP1;1 OsPIP1;3 AtPIP1;1, AtPIP1;2,
    AtPIP1;3, AtPIP1;4,
    AtPIP1;5
    PIP1B CePIP1;2 CcPIP1;2, CcPIP1;3 RbPIP1;2 JePIP1;2
    PIP1C CePIP1;3 CcPIP1;4 RbPIP1;3 JePIP1;3 OsPIP1;1, OsPIP1;2
    PIP2A CePIP2;1 CcPIP2;1 RbPIP2;1 JePIP2;1 OsPIP2;1, OsPIP2;4,
    OsPIP2;5
    AtPIP2;1, AtPIP2;2,
    AtPIP2;3, AtPIP2;4,
    AtPIP2;5, AtPIP2;6
    PIP2B CePIP2;2 CcPIP2;2 RbPIP2;2 JePIP2;2 OsPIP2;2, OsPIP2;3
    PIP2C CePIP2;3 CcPIP2;3 RbPIP2;3, RbPIP2;4
    PIP2D CePIP2;4, CePIP2;5 CcPIP2;4, CcPIP2;5 RbPIP2;5
    PIP2E CePIP2;5 CcPIP2;5 RbPIP2;6
    PIP2F CePIP2;6 CcPIP2;6
    PIP2G CePIP2;7 CcPIP2;7 RbPIP2;7 JePIP2;3, JePIP2;4
    PIP2H CePIP2;8 CcPIP2;8, CcPIP2;9 RbPIP2;8 JePIP2;5 OsPIP2;6 AtPIP2;7, AtPIP2;8
    PIP2I CePIP2;9, CePIP2;10,
    CePIP2;11
    CcPIP2;10, CcPIP2;11 RbPIP2;9, RbPIP2;10 JePIP2;6 OsPIP2;7, OsPIP2;8
    At: A. thaliana; Cc: C. cristatella; Ce: C. esculentus; Je: J. effuses; Os: O. sativa; Rb: R. breviuscula; PIP: plasma membrane intrinsic protein.
     | Show Table
    DownLoad: CSV

    Tissue-specific expression profiles of CePIP genes were investigated using transcriptome data available for young leaf, mature leaf, sheath, root, rhizome, shoot apex, and tuber. As shown in Fig. 3a, CePIP genes were mostly expressed in roots, followed by sheaths, moderately in tubers, young leaves, rhizomes, and mature leaves, and lowly in shoot apexes. In most tissues, CePIP1;1, -2;1, and -2;8 represent three dominant members that contributed more than 90% of total transcripts. By contrast, in rhizome, these three members occupied about 80% of total transcripts, which together with CePIP1;3 and -2;4 contributed up to 96%; in root, CePIP1;1, -1;3, -2;4, and -2;7 occupied about 84% of total transcripts, which together with CePIP2;1 and -2;8 contributed up to 94%. According to their expression patterns, CePIP genes could be divided into five main clusters: Cluster I includes CePIP1;1, -2;1, and -2;8 that were constitutively and highly expressed in all tissues examined; Cluster II includes CePIP2;2, -2;9, and -2;10 that were lowly expressed in all tested tissues; Cluster III includes CePIP1;2 and -2;11 that were preferentially expressed in young leaf and sheath; Cluster IV includes CePIP1;3 and -2;4 that were predominantly expressed in root and rhizome; and Cluster V includes remains that were typically expressed in root (Fig. 3a). Collectively, these results imply expression divergence of most duplicate pairs and three members (i.e. CePIP1;1, -2;1, and -2;8) have evolved to be constitutively co-expressed in most tissues.

    Figure 3.  Expression profiles of CePIP genes in various tissues, different stages of leaf development, and mature leaves of diurnal fluctuation. (a) Tissue-specific expression profiles of 14 CePIP genes. The heatmap was generated using the R package implemented with a row-based standardization. Color scale represents FPKM normalized log2 transformed counts, where blue indicates low expression and red indicates high expression. (b) Expression profiles of CePIP1;1, -2;1, and -2;8 at different stages of leaf development. (c) Expression profiles of CePIP1;1, -2;1, and -2;8 in mature leaves of diurnal fluctuation. Bars indicate SD (N = 3) and uppercase letters indicate difference significance tested following Duncan's one-way multiple-range post hoc ANOVA (p< 0.01). (Ce: C. esculentus; FPKM: Fragments per kilobase of exon per million fragments mapped; PIP: plasma membrane intrinsic protein)

    As shown in Fig. 3a, compared with young leaves, transcriptome profiling showed that CePIP1;2, -2;3, -2;7, -2;8, and -2;11 were significantly down-regulated in mature leaves, whereas CePIP1;3 and -2;1 were up-regulated. To confirm the results, three dominant members, i.e., CePIP1;1, -2;1, and -2;8, were selected for qRT-PCR analysis, which includes three representative stages, i.e., young, mature, and senescing leaves. As shown in Fig. 3b, in contrast to CePIP2;1 that exhibited a bell-like expression pattern peaking in mature leaves, transcripts of both CePIP1;1 and -2;8 gradually decreased during leaf development. These results were largely consistent with transcriptome profiling, and the only difference is that CePIP1;1 was significantly down-regulated in mature leaves relative to young leaves. However, this may be due to different experiment conditions used, i.e., greenhouse vs natural conditions.

    Diurnal fluctuation expression patterns of CePIP1;1, -2;1, and -2;8 were also investigated in mature leaves and results are shown in Fig. 3c. Generally, transcripts of all three genes in the day (8, 12, 16, and 20 h) were higher than that in the night (24 and 4 h). During the day, both CePIP1;1 and -2;8 exhibited an unimodal expression pattern that peaked at 12 h, whereas CePIP2;1 possessed two peaks (8 and 16 h) and their difference was not significant. Nevertheless, transcripts of all three genes at 20 h (onset of night) were significantly lower than those at 8 h (onset of day) as well as 12 h. In the night, except for CePIP2;1, no significant difference was observed between the two stages for both CePIP1;1 and -2;8. Moreover, their transcripts were comparable to those at 20 h (Fig. 3c).

    To reveal the expression patterns of CePIP genes during tuber development, three representative stages, i.e., 40 DAS (early swelling stage), 85 DAS (late swelling stage), and 120 DAS (mature stage), were first profiled using transcriptome data. As shown in Fig. 4a, except for rare expression of CePIP1;2, -2;2, -2;9, and -2;10, most genes exhibited a bell-like expression pattern peaking at 85 DAS, in contrast to a gradual decrease of CePIP2;3 and -2;8. Notably, except for CePIP2;4, other genes were expressed considerably lower at 120 DAS than that at 40 DAS. For qRT-PCR confirmation of CePIP1;1, -2;1, and -2;8, seven stages were examined, i.e., 1, 5, 10, 15, 20, 25, and 35 DAI, which represent initiation, five stages of swelling, and maturation as described before[32]. As shown in Fig. 4b, two peaks were observed for all three genes, though their patterns were different. As for CePIP1;1, compared with the initiation stage (1 DAI), significant up-regulation was observed at the early swelling stage (5 DAI), followed by a gradual decrease except for the appearance of the second peak at 20 DAI, which is something different from transcriptome profiling. As for CePIP2;1, a sudden drop of transcripts first appeared at 5 DAI, then gradually increased until 20 DAI, which was followed by a gradual decrease at two late stages. The pattern of CePIP2;8 is similar to -1;1, two peaks appeared at 5 and 20 DAI and the second peak was significantly lower than the first. The difference is that the second peak of CePIP2;8 was significantly lower than the initiation stage. By contrast, the second peak (20 DAI) of CePIP2;1 was significantly higher than that of the first one (1 DAI). Nevertheless, the expression patterns of both CePIP2;1 and -2;8 are highly consistent with transcriptome profiling.

    Figure 4.  Transcript and protein abundances of CePIP genes during tuber development. (a) Transcriptome-based expression profiling of 14 CePIP genes during tuber development. The heatmap was generated using the R package implemented with a row-based standardization. Color scale represents FPKM normalized log2 transformed counts, where blue indicates low expression and red indicates high expression. (b) qRT-PCR-based expression profiling of CePIP1;1, -2;1, and -2;8 in seven representative stages of tuber development. (c) Relative protein abundance of CePIP1;1, -2;1, and -2;8 in three representative stages of tuber development. Bars indicate SD (N = 3) and uppercase letters indicate difference significance tested following Duncan's one-way multiple-range post hoc ANOVA (p < 0.01). (Ce: C. esculentus; DAI: days after tuber initiation; DAS: days after sowing; FPKM: Fragments per kilobase of exon per million fragments mapped; PIP: plasma membrane intrinsic protein).

    Since protein abundance is not always in agreement with the transcript level, protein profiles of three dominant members (i.e. CePIP1;1, -2;1, and -2;8) during tuber development were further investigated. For this purpose, we first took advantage of available proteomic data to identify CePIP proteins, i.e., leaves, roots, and four stages of tubers (freshly harvested, dried, rehydrated for 48 h, and sprouted). As shown in Supplemental Fig. S2, all three proteins were identified in both leaves and roots, whereas CePIP1;1 and -2;8 were also identified in at least one of four tested stages of tubers. Notably, all three proteins were considerably more abundant in roots, implying their key roles in root water balance.

    To further uncover their profiles during tuber development, 4D-PRM-based protein quantification was conducted in three representative stages of tuber development, i.e., 1, 25, and 35 DAI. As expected, all three proteins were identified and quantified. In contrast to gradual decrease of CePIP2;8, both CePIP1;1 and -2;1 exhibited a bell-like pattern that peaked at 25 DAI, though no significant difference was observed between 1 and 25 DAI (Fig. 4c). The trends are largely in accordance with their transcription patterns, though the reverse trend was observed for CePIP2;1 at two early stages (Fig. 4b & Fig. 4c).

    As predicted by WoLF PSORT, CePIP1;1, -2;1, and -2;8 may function in the cell membrane. To confirm the result, subcellular localization vectors named pNC-Cam1304-CePIP1;1, pNC-Cam1304-CePIP2;1, and pNC-Cam1304-CePIP2;8 were further constructed. When transiently overexpressed in tobacco leaves, green fluorescence signals of all three constructs were confined to cell membranes, highly coinciding with red fluorescence signals of the plasma membrane marker HbPIP2;3-RFP (Fig. 5).

    Figure 5.  (a) Schematic diagram of overexpressing constructs, (b) subcellular localization analysis of CePIP1;1, -2;1, and -2;8 in N. benthamiana leaves. (35S: cauliflower mosaic virus 35S RNA promoter; Ce: C. esculentus; EGFP: enhanced green fluorescent protein; kb: kilobase; NOS: terminator of the nopaline synthase gene; RFP: red fluorescent protein; PIP: plasma membrane intrinsic protein).

    Water balance is particularly important for cell metabolism and enlargement, plant growth and development, and stress responses[2,19]. As the name suggests, AQPs raised considerable interest for their high permeability to water, and plasma membrane-localized PIPs were proven to play key roles in transmembrane water transport between cells[1,18]. The first PIP was discovered in human erythrocytes, which was named CHIP28 or AQP1, and its homolog in plants was first characterized in Arabidopsis, which is known as RD28, PIP2c, or AtPIP2;3[3,7,53]. Thus far, genome-wide identification of PIP genes have been reported in a high number of plant species, including two model plants Arabidopsis and rice[10,11,1317,5456]. By contrast, little information is available on Cyperaceae, the third largest family within the monocot clade that possesses more than 5,600 species[57].

    Given the crucial roles of water balance for tuber development and crop production, in this study, tigernut, a representative Cyperaceae plant producing high amounts of oil in underground tubers[28,30,32], was employed to study PIP genes. A number of 14 PIP genes representing two phylogenetic groups (i.e., PIP1 and PIP2) or 12 orthogroups (i.e., PIP1A, PIP1B, PIP1C, PIP2A, PIP2B, PIP2C, PIP2D, PIP2E, PIP2F, PIP2G, PIP2H, and PIP2I) were identified from the tigernut genome. Though the family amounts are comparative or less than 13–21 present in Arabidopsis, cassava (Manihot esculenta), rubber tree (Hevea brasiliensis), poplar (Populus trichocarpa), C. cristatella, R. breviuscula, banana (Musa acuminata), maize (Zea mays), sorghum (Sorghum bicolor), barley (Hordeum vulgare), and switchgrass (Panicum virgatum), they are relatively more than four to 12 found in eelgrass (Zostera marina), Brachypodium distachyon, foxtail millet (Setaria italic), J. effuses, Aquilegia coerulea, papaya (Carica papaya), castor been (Ricinus communis), and physic nut (Jatropha curcas) (Supplemental Table S4). Among them, A. coerulea represents a basal eudicot that didn't experience the γ WGD shared by all core eudicots[50], whereas eelgrass is an early diverged aquatic monocot that didn't experience the τ WGD shared by all core monocots[56]. Interestingly, though both species possess two PIP1s and two PIP2s, they were shown to exhibit complex orthologous relationships of 1:1, 2:2, 1:0, and 0:1 (Supplemental Table S5). Whereas AcPIP1;1/AcPIP1;2/ZmPIP1;1/ZmPIP1;2 and ZmPIP2;1/AcPIP2;1 belong to PIP1A and PIP2A identified in this study, AcPIP2;2 and ZmPIP2;2 belong to PIP2H and PIP2I, respectively (Supplemental Table S5), implying that the last common ancestor of monocots and eudicots possesses only one PIP1 and two PIP2s followed by clade-specific expansion. A good example is the generation of AtPIP1;1 and -2;6 from AtPIP1;5 and -2;1 via the γ WGD, respectively[17].

    In tigernut, extensive expansion of the PIP subfamily was contributed by WGD (2), transposed (2), tandem (5), and dispersed duplications (3). It's worth noting that, two transposed repeats (i.e., CePIP1;1/-1;3 and CePIP2;1/-2;8) are shared by rice, implying their early origin that may be generated sometime after the split with the eudicot clade but before Cyperaceae-Poaceae divergence. By contrast, two WGD repeats (i.e., CePIP1;1/-1;2 and CePIP2;2/-2;4) are shared by C. cristatella, R. breviuscula, and J. effusus but not rice and Arabidopsis, implying that they may be derived from WGDs that occurred sometime after Cyperaceae-Poaceae split but before Cyperaceae-Juncaceae divergence. The possible WGD is the one that was described in C. littledalei[58], though the exact time still needs to be studied. Interestingly, compared with Arabidopsis (1) and rice (2), tandem/proximal duplications played a more important role in the expansion of PIP genes in tigernut (5) as well as other Cyperaceae species tested (5–6), which were shown to be Cyperaceae-specific or even species-specific. These tandem repeats may play a role in the adaptive evolution of Cyperaceae species as described in a high number of plant species[14,41]. According to comparative genomics analyses, tandem duplicates experienced stronger selective pressure than genes formed by other modes (WGD, transposed duplication, and dispersed duplication) and evolved toward biased functional roles involved in plant self-defense[41].

    As observed in most species such as Arabidopsis[10,1417], PIP genes in all Cyperaceae and Juncaceae species examined in this study, i.e., tigernut, C. cristatella, R. breviuscula, and J. effuses, feature three introns with conserved positions. By contrast, zero to three introns was not only found in rice but also in other Poaceae species such as maize, sorghum, foxtail millet, switchgrass, B. distachyon, and barley[54,55], implying lineage/species-specific evolution.

    Despite the extensive expansion of PIP genes (PIP2) in tigernut even after the split with R. breviuscula, CePIP1;1, -2;1, and -2;8 were shown to represent three dominant members in most tissues examined in this study, i.e., young leaf, mature leaf, sheath, rhizome, shoot apex, and tuber, though the situation in root is more complex. CePIP1;1 was characterized as a transposed repeat of CePIP1;3, which represents the most expressed member in root. Moreover, its recent WGD repeat CePIP1;2 was shown to be lowly expressed in most tested tissues, implying their divergence. The ortholog of CePIP1;1 in rice is OsPIP1;3 (RWC-3), which was shown to be preferentially expressed in roots, stems, and leaves, in contrast to constitutive expression of OsPIP1;1 (OsPIP1a) and -1;2[5961], two recent WGD repeats. Injecting the cRNA of OsPIP1;3 into Xenopus oocytes could increase the osmotic water permeability by 2–3 times[60], though the activity is considerably lower than PIP2s such as OsPIP2;2 and -2;2[6163]. Moreover, OsPIP1;3 was shown to play a role in drought avoidance in upland rice and its overexpression in lowland rice could increase root osmotic hydraulic conductivity, leaf water potential, and relative cumulative transpiration at the end of 10 h PEG treatment[64]. CePIP2;8 was characterized as a transposed repeat of CePIP2;1. Since their orthologs are present in both rice and Arabidopsis (Supplemental Table S3), the duplication event is more likely to occur sometime before monocot-eudicot split. Interestingly, their orthologs in rice, i.e., OsPIP2;1 (OsPIP2a) and -2;6, respectively, are also constitutively expressed[61], implying a conserved evolution with similar functions. When heterologously expressed in yeast, OsPIP2;1 was shown to exhibit high water transport activity[62,6466]. Moreover, root hydraulic conductivity was decreased by approximately four folds in OsPIP2;1 RNAi knock-down rice plants[64]. The water transport activity of OsPIP2;6 has not been tested, however, it was proven to be an H2O2 transporter that is involved in resistance to rice blast[61]. More work especially transgenic tests may improve our knowledge of the function of these key CePIP genes.

    Leaf is a photosynthetic organ that regulates water loss through transpiration. In tigernut, PIP transcripts in leaves were mainly contributed by CePIP1;1, -2;1, and -2;8, implying their key roles. During leaf development, in contrast to gradual decrease of CePIP1;1 and -2;8 transcripts in three stages (i.e. young, mature, and senescing) examined in this study, CePIP2;1 peaked in mature leaves. Their high abundance in young leaves is by cell elongation and enlargement at this stage, whereas upregulation of CePIP2;1 in mature leaves may inform its possible role in photosynthesis[67]. Thus far, a high number of CO2 permeable PIPs have been identified, e.g., AtPIP2;1, HvPIP2;1, HvPIP2;2, HvPIP2;3, HvPIP2;5, and SiPIP2;7[6870]. Moreover, in mature leaves, CePIP1;1, -2;1, and -2;8 were shown to exhibit an apparent diurnal fluctuation expression pattern that was expressed more in the day and usually peaked at noon, which reflects transpiration and the fact that PIP genes are usually induced by light[11,7173]. In rice, OsPIP2;4 and -2;5 also showed a clear diurnal fluctuation in roots that peaked at 3 h after the onset of light and dropped to a minimum 3 h after the onset of darkness[11]. Notably, further studies showed that temporal and dramatic induction of OsPIP2;5 around 2 h after light initiation was triggered by transpirational demand but not circadian rhythm[74].

    As an oil-bearing tuber crop, the main economic goal of tigernut cultivation is to harvest underground tubers, whose development is highly dependent on water available[32,75]. According to previous studies, the moisture content of immature tigernut tubers maintains more than 80.0%, followed by a seed-like dehydration process with a drop of water content to less than 50% during maturation[28,32]. Thereby, the water balance in developmental tubers must be tightly regulated. Like leaves, the majority of PIP transcripts in tubers were shown to be contributed by CePIP1;1, -2;1, and -2;8, which was further confirmed at the protein level. In accordance with the trend of water content during tuber development, mRNA, and protein abundances of CePIP1;1, -2;1, and -2;8 in initiation and swelling tubers were considerably higher than that at the mature stage. High abundances of CePIP1;1, -2;1, and -2;8 at the initiation stage reflects rapid cell division and elongation, whereas upregulation of CePIP1;1 and -2;1 at the swelling stage is in accordance with cell enlargement and active physiological metabolism such as rapid oil accumulation[28,30]. At the mature stage, downregulation of PIP transcripts and protein abundances resulted in a significant drop in the moisture content, which is accompanied by the significant accumulation of late embryogenesis-abundant proteins[23,32]. The situation is highly distinct from other tuber plants such as potato (Solanum tuberosum), which may contribute to the difference in desiccation resistance between two species[32,76]. It's worth noting that, in one study, CePIP2;1 was not detected in any of the four tested stages, i.e., freshly harvested, dried, rehydrated for 48 h, and sprouted tubers[23]. By contrast, it was quantified in all three stages of tuber development examined in this study, i.e., 1, 25, and 35 DAI (corresponding to freshly harvested tubers), which represent initiation, swelling, and maturation. One possible reason is that the protein abundance of CePIP2;1 in mature tubers is not high enough to be quantified by nanoLC-MS/MS, which is relatively less sensitive than 4D-PRM used in this study[30,46]. In fact, nanoLC-MS/MS-based proteomic analysis of 30 samples representing six tissues/stages only resulted in 2,257 distinct protein groups[23].

    Taken together, our results imply a key role of CePIP1;1, -2;1, and -2;8 in tuber water balance, however, the mechanism underlying needs to be further studied, e.g., posttranslational modifications, protein interaction patterns, and transcriptional regulators.

    To our knowledge, this is the first genome-wide characterization of PIP genes in tigernut, a representative Cyperaceae plant with oil-bearing tubers. Fourteen CePIP genes representing two phylogenetic groups or 12 orthogroups are relatively more than that present in two model plants rice and Arabidopsis, and gene expansion was mainly contributed by WGD and transposed/tandem duplications, some of which are lineage or even species-specific. Among these genes, CePIP1;1, -2;1, and -2;8 have evolved to be three dominant members that are constitutively expressed in most tissues, including leaf and tuber. Transcription of these three dominant members in leaves are subjected to development and diurnal regulation, whereas in tubers, their mRNA and protein abundances are positively correlated with the moisture content during tuber development. Moreover, their plasma membrane-localization was confirmed by subcellular localization analysis, implying that they may function in the cell membrane. These findings shall not only provide valuable information for further uncovering the mechanism of tuber water balance but also lay a solid foundation for genetic improvement by regulating these key PIP members in tigernut.

    The authors confirm contribution to the paper as follows: study conception and design, supervision: Zou Z; analysis and interpretation of results: Zou Z, Zheng Y, Xiao Y, Liu H, Huang J, Zhao Y; draft manuscript preparation: Zou Z, Zhao Y. All authors reviewed the results and approved the final version of the manuscript.

    All the relevant data is available within the published article.

    This work was supported by the Hainan Province Science and Technology Special Fund (ZDYF2024XDNY171 and ZDYF2024XDNY156), China; the National Natural Science Foundation of China (32460342, 31971688 and 31700580), China; the Project of Sanya Yazhou Bay Science and Technology City (SCKJ-JYRC-2022-66), China. The funders had no role in study design, data collection and analysis, decision to publish, or preparation of the manuscript.

  • The authors declare that they have no conflict of interest.

  • [1]

    Abdelhedi O, Nasri M. 2019. Basic and recent advances in marine antihypertensive peptides: Production, structure-activity relationship and bioavailability. Trends in Food Science & Technology 88:543−57

    doi: 10.1016/j.jpgs.2019.04.002

    CrossRef   Google Scholar

    [2]

    WHO. 2017. Global Health Observatory (GHO) Data. Raised Blood Pressure-situation and trends

    [3]

    Wu J, Xie D, Chen X, Tang YJ, Wang L, et al. 2019. Inhibitory mechanism of a substrate-type angiotensin I-converting enzyme inhibitory peptide. Process Biochemistry 79:97−104

    doi: 10.1016/j.procbio.2018.12.018

    CrossRef   Google Scholar

    [4]

    Ritchey MD, Gillespie C, Wozniak G, Shay CM, Thompson-Paul AM, et al. 2018. Potential need for expanded pharmacologic treatment and lifestyle modification services under the 2017 ACC/AHA Hypertension Guideline. Journal of Clinical Hypertension 20:1377−91

    doi: 10.1111/jch.13364

    CrossRef   Google Scholar

    [5]

    Tedla YG, Bautista LE. 2016. Drug Side Effect Symptoms and Adherence to Antihypertensive Medication. American Journal of Hypertension 29:772−79

    doi: 10.1093/ajh/hpv185

    CrossRef   Google Scholar

    [6]

    Aluko RE. 2015. Antihypertensive Peptides from Food Proteins. Annual Review of Food Science and Technology 6:235−62

    doi: 10.1146/annurev-food-022814-015520

    CrossRef   Google Scholar

    [7]

    Khurana V, Goswami B. 2022. Angiotensin converting enzyme (ACE). Clinica Chimica Acta 524:113−22

    doi: 10.1016/j.cca.2021.10.029

    CrossRef   Google Scholar

    [8]

    Zhao Y, Xu C. 2008. Structure and Function of Angiotensin Converting Enzyme and Its Inhibitors. Chinese Journal of Biotechnology 24:171−76

    doi: 10.1016/S1872-2075(08)60007-2

    CrossRef   Google Scholar

    [9]

    Qiao QQ, Luo QB, Suo SK, Zhao YQ, Chi CF, et al. 2022. Preparation, characterization, and cytoprotective effects on HUVECs of fourteen novel angiotensin-I-converting enzyme inhibitory peptides from protein hydrolysate of tuna processing by-products. Frontiers in Nutrition 9:868681

    doi: 10.3389/fnut.2022.868681

    CrossRef   Google Scholar

    [10]

    Wei G, Wang T, Li Y, He R, Huang A, et al. 2024. Identification, structural characterization, and molecular dynamic simulation of ACE inhibitory peptides in whey hydrolysates from Chinese Rushan cheese by-product. Food Chemistry: X 21:101211

    doi: 10.1016/j.fochx.2024.101211

    CrossRef   Google Scholar

    [11]

    Lin Z, Wu H, Zhang M. 2023. Isolation, identification, and structure-activity relationship of novel ACE inhibitory peptides from earthworm protein in vitro gastrointestinal digestion product. Food Bioscience 55:103010

    doi: 10.1016/j.fbio.2023.103010

    CrossRef   Google Scholar

    [12]

    Hu YD, Xi QH, Kong J, Zhao YQ, Chi CF, et al. 2023. Angiotensin-I-Converting Enzyme (ACE)-inhibitory peptides from the collagens of Monkfish (Lophius litulon) Swim Bladders: isolation, characterization, molecular docking analysis and activity evaluation. Marine Drugs 21:516

    doi: 10.3390/md21100516

    CrossRef   Google Scholar

    [13]

    Suo SK, Zheng SL, Chi CF, Luo HY, Wang B. 2022. Novel angiotensin-converting enzyme inhibitory peptides from tuna byproducts—milts: Preparation, characterization, molecular docking study, and antioxidant function on H2O2-damaged human umbilical vein endothelial cells. Frontiers in Nutrition 9:957778

    doi: 10.3389/fnut.2022.957778

    CrossRef   Google Scholar

    [14]

    Yushipitsina GG, Chuprova NA, Repyakh SM. 1988. Fractionation and amino acid compositon of proteins of the woody verdure of sea buckthorn. Chemistry of Natural Compounds 24:348−50

    doi: 10.1007/BF00598585

    CrossRef   Google Scholar

    [15]

    Biel W, Telesiński A, Jaroszewska A, Biel W. 2018. Effect of mycorrhization and variety on the chemical composition and antioxidant activity of sea buckthorn berries. Journal of Elementology 23:673−84

    doi: 10.5601/jelem.2017.22.3.1434

    CrossRef   Google Scholar

    [16]

    Larmo PS, Järvinen RL, Setälä NL, Yang B, Viitanen MH, et al. 2010. Oral sea buckthorn oil attenuates tear film osmolarity and symptoms in individuals with dry eye. The Journal of Nutrition 140:1462−68

    doi: 10.3945/jn.109.118901

    CrossRef   Google Scholar

    [17]

    Xing J, Yang B, Dong Y, Wang B, Wang J, et al. 2002. Effects of sea buckthorn (Hippophaë rhamnoides L.) seed and pulp oils on experimental models of gastric ulcer in rats. Fitoterapia 73:644−50

    doi: 10.1016/s0367-326x(02)00221-6

    CrossRef   Google Scholar

    [18]

    Li J, Su J, Chen M, Chen J, Ding W, et al. 2021. Two novel potent ACEI peptides isolated from Pinctada fucata meat hydrolysates using in silico analysis: identification, screening and inhibitory mechanisms. RSC Advances 11:12172−82

    doi: 10.1039/D0RA10476K

    CrossRef   Google Scholar

    [19]

    Sosulski FW, Holt NW. 1980. Amino acid composition and nitrogen-to-protein factors for grain legumes. Canadian Journal of Plant Science 60:1327−31

    doi: 10.4141/cjps80-187

    CrossRef   Google Scholar

    [20]

    Zhu Y, Huang Y, Li M, Sun B, Liu L, et al. 2023. High Fischer ratio peptide of hemp seed: Preparation and anti-fatigue evaluation in vivo and in vitro. Food Research International 165:112534

    doi: 10.1016/j.foodres.2023.112534

    CrossRef   Google Scholar

    [21]

    Zhao C, Chu Z, Miao Z, Liu J, Liu J, et al. 2021. Ultrasound heat treatment effects on structure and acid-induced cold set gel properties of soybean protein isolate. Food Bioscience 39:100827

    doi: 10.1016/j.fbio.2020.100827

    CrossRef   Google Scholar

    [22]

    Lin N, Liu B, Liu Z, Qi T. 2020. Effects of different drying methods on the structures and functional properties of phosphorylated Antarctic krill protein. Journal of Food Science 85:3690−99

    doi: 10.1111/1750-3841.15503

    CrossRef   Google Scholar

    [23]

    Lear S, Cobb SL. 2016. Pep-Calc.com: a set of web utilities for the calculation of peptide and peptoid properties and automatic mass spectral peak assignment. Journal of Computer-Aided Molecular Design 30:271−77

    doi: 10.1007/s10822-016-9902-7

    CrossRef   Google Scholar

    [24]

    Cushman DW, Cheung HS. 1971. Spectrophotometric assay and properties of the angiotensin-converting enzyme of rabbit lung. Biochemical Pharmacology 20:1637−48

    doi: 10.1016/0006-2952(71)90292-9

    CrossRef   Google Scholar

    [25]

    Yang B, Kallio H. 2002. Effects of harvesting time on triacylglycerols and glycerophospholipids of sea buckthorn (Hippophaë rhamnoides L.) berries of different origins. Journal of Food Composition and Analysis 15:143−57

    doi: 10.1006/jfca.2001.1041

    CrossRef   Google Scholar

    [26]

    Lee SH, Qian ZJ, Kim SK. 2010. A novel angiotensin I converting enzyme inhibitory peptide from tuna frame protein hydrolysate and its antihypertensive effect in spontaneously hypertensive rats. Food Chemistry 118:96−102

    doi: 10.1016/j.foodchem.2009.04.086

    CrossRef   Google Scholar

    [27]

    Fu X, Yang H, Ma C, Li X, Li D, et al. 2020. Characterization and inhibitory activities on α-amylase and α-glucosidase of the polysaccharide from blue honeysuckle berries. International Journal of Biological Macromolecules 163:414−22

    doi: 10.1016/j.ijbiomac.2020.06.267

    CrossRef   Google Scholar

    [28]

    Li L, Cai Y, Sun X, Du X, Jiang Z, et al. 2021. Tyrosinase inhibition by p-coumaric acid ethyl ester identified from camellia pollen. Food Science & Nutrition 9:389−400

    doi: 10.1002/fsn3.2004

    CrossRef   Google Scholar

    [29]

    Wang C, Tian J, Wang Q. 2011. ACE inhibitory and antihypertensive properties of apricot almond meal hydrolysate. European Food Research and Technology 232:549−56

    doi: 10.1007/s00217-010-1411-7

    CrossRef   Google Scholar

    [30]

    Ciesarová Z, Murkovic M, Cejpek K, Kreps F, Tobolková B, et al. 2020. Why is sea buckthorn (Hippophae rhamnoides L.) so exceptional? A review. Food Research International 133:109170

    doi: 10.1016/j.foodres.2020.109170

    CrossRef   Google Scholar

    [31]

    Zhang Z, Wang Y, Dai C, He R, Ma H. 2018. Alkali extraction of rice residue protein isolates: Effects of alkali treatment conditions on lysinoalanine formation and structural characterization of lysinoalanine-containing protein. Food Chemistry 261:176−83

    doi: 10.1016/j.foodchem.2018.04.027

    CrossRef   Google Scholar

    [32]

    Ghribi AM, Gafsi IM, Blecker C, Danthine S, Attia H, et al. 2015. Effect of drying methods on physico-chemical and functional properties of chickpea protein concentrates. Journal of Food Engineering 165:179−88

    doi: 10.1016/j.jfoodeng.2015.06.021

    CrossRef   Google Scholar

    [33]

    Hu Y, Que T, Fang Z, Liu W, Chen S, et al. 2013. Effect of Different Drying Methods on the Protein and Product Quality of Hairtail Fish Meat Gel. Drying Technology 31:1707−14

    doi: 10.1080/07373937.2013.794831

    CrossRef   Google Scholar

    [34]

    Suetsuna K, Nakano T. 2000. Identification of an antihypertensive peptide from peptic digest of wakame (Undaria pinnatifida). The Journal of Nutritional Biochemistry 11:450−54

    doi: 10.1016/S0955-2863(00)00110-8

    CrossRef   Google Scholar

    [35]

    Cheung HS, Wang FL, Ondetti MA, Sabo EF, Cushman DW. 1980. Binding of peptide substrates and inhibitors of angiotensin-converting enzyme. Importance of the COOH-terminal dipeptide sequence. Journal of Biological Chemistry 255:401−7

    Google Scholar

    [36]

    Hayes M, Mora L, Hussey K, Aluko RE. 2016. Boarfish protein recovery using the pH-shift process and generation of protein hydrolysates with ACE-I and antihypertensive bioactivities in spontaneously hypertensive rats. Innovative Food Science & Emerging Technologies 37:253−60

    doi: 10.1016/j.ifset.2016.03.014

    CrossRef   Google Scholar

    [37]

    Badertscher M, Bühlmann P, Pretsch E. 2009. Structure determination of organic compounds: Tables of Spectral Data. 4th Edition. Heidelberg: Springer Berlin. doi: 10.1007/978-3-540-93810-1

    [38]

    Ma FF, Wang H, Wei CK, Thakur K, Wei ZJ, et al. 2018. Three novel ACE inhibitory peptides isolated from Ginkgo biloba seeds: purification, inhibitory kinetic and mechanism. Frontiers in Pharmacology 9:1579

    doi: 10.3389/fphar.2018.01579

    CrossRef   Google Scholar

    [39]

    Toopcham T, Mes JJ, Wichers HJ, Roytrakul S, Yongsawatdigul J. 2017. Bioavailability of angiotensin I-converting enzyme (ACE) inhibitory peptides derived from Virgibacillus halodenitrificans SK1-3-7 proteinases hydrolyzed tilapia muscle proteins. Food Chemistry 220:190−97

    doi: 10.1016/j.foodchem.2016.09.183

    CrossRef   Google Scholar

    [40]

    Zhang Y, Pan D, Yang Z, Gao X, Dang Y. 2021. Angiotensin I-Converting enzyme (ACE) inhibitory and dipeptidyl Peptidase-4 (DPP-IV) inhibitory activity of umami peptides from Ruditapes philippinarum. LWT 144:111265

    doi: 10.1016/j.lwt.2021.111265

    CrossRef   Google Scholar

    [41]

    Chen J, Ryu B, Zhang Y, Liang P, Li C, et al. 2020. Comparison of an angiotensin-I-converting enzyme inhibitory peptide from tilapia (Oreochromis niloticus) with captopril: inhibition kinetics, in vivo effect, simulated gastrointestinal digestion and a molecular docking study. Journal of the Science of Food and Agriculture 100:315−24

    doi: 10.1002/jsfa.10041

    CrossRef   Google Scholar

    [42]

    Quirós A, Ramos M, Muguerza B, Delgado MA, Miguel M, et al. 2007. Identification of novel antihypertensive peptides in milk fermented with Enterococcus faecalis. International Dairy Journal 17:33−41

    doi: 10.1016/j.idairyj.2005.12.011

    CrossRef   Google Scholar

    [43]

    Iroyukifujita H, Eiichiyokoyama K, Yoshikawa M. 2000. Classification and Antihypertensive Activity of Angiotensin I-Converting Enzyme Inhibitory Peptides Derived from Food Proteins. Journal of Food Science 65:564−69

    doi: 10.1111/j.1365-2621.2000.tb16049.x

    CrossRef   Google Scholar

    [44]

    Natesh R, Schwager SLU, Sturrock ED, Acharya KR. 2003. Crystal structure of the human angiotensin-converting enzyme-lisinopril complex. Nature 421:551−54

    doi: 10.1038/nature01370

    CrossRef   Google Scholar

    [45]

    Sánchez-Rivera L, Ares I, Miralles B, Gómez-Ruiz JÁ, Recio I, et al. 2014. Bioavailability and Kinetics of the Antihypertensive Casein-Derived Peptide HLPLP in Rats. Journal of Agricultural and Food Chemistry 62:11869−75

    doi: 10.1021/jf5035256

    CrossRef   Google Scholar

    [46]

    Wu J, Aluko RE, Nakai S. 2006. Structural requirements of angiotensin I-converting enzyme inhibitory peptides: quantitative structure−activity relationship study of di- and tripeptides. Journal of Agricultural and Food Chemistry 54:732−38

    doi: 10.1021/jf051263l

    CrossRef   Google Scholar

    [47]

    Wu J, Liao W, Udenigwe CC. 2017. Revisiting the mechanisms of ACE inhibitory peptides from food proteins. Trends in Food Science & Technology 69:214−19

    doi: 10.1016/j.jpgs.2017.07.011

    CrossRef   Google Scholar

    [48]

    Li M, Fan W, Xu Y. 2021. Identification of angiotensin converting enzyme (ACE) inhibitory and antioxidant peptides derived from Pixian broad bean paste. LWT 151:112221

    doi: 10.1016/j.lwt.2021.112221

    CrossRef   Google Scholar

    [49]

    Fan H, Wang J, Liao W, Jiang X, Wu J. 2019. Identification and Characterization of Gastrointestinal-Resistant Angiotensin-Converting Enzyme Inhibitory Peptides from Egg White Proteins. Journal of Agricultural and Food Chemistry 67:7147−56

    doi: 10.1021/acs.jafc.9b01071

    CrossRef   Google Scholar

    [50]

    Fan H, Wu J. 2021. Purification and identification of novel ACE inhibitory and ACE2 upregulating peptides from spent hen muscle proteins. Food Chemistry 345:128867

    doi: 10.1016/j.foodchem.2020.128867

    CrossRef   Google Scholar

    [51]

    Ma T, Fu Q, Mei Q, Tu Z, Zhang L. 2021. Extraction optimization and screening of angiotensin-converting enzyme inhibitory peptides from Channa striatus through bioaffinity ultrafiltration coupled with LC-Orbitrap-MS/MS and molecular docking. Food Chemistry 354:129589

    doi: 10.1016/j.foodchem.2021.129589

    CrossRef   Google Scholar

    [52]

    Wei D, Fan WL, Xu Y. 2021. Identification of water-soluble peptides in distilled spent grain and its angiotensin converting enzyme (ACE) inhibitory activity based on UPLC-Q-TOF-MS and proteomics analysis. Food Chemistry 353:129521

    doi: 10.1016/j.foodchem.2021.129521

    CrossRef   Google Scholar

    [53]

    Lu Y, Wang Y, Huang D, Bian Z, Lu P, et al. 2021. Inhibitory mechanism of angiotensin-converting enzyme inhibitory peptides from black tea. Journal of Zhejiang University: Science 22:575−89

    doi: 10.1631/jzus.B2000520

    CrossRef   Google Scholar

  • Cite this article

    Zheng Y, Wang D, Zhou Y, Yuen M, Yuen T, et al. 2024. Characterization and angiotensin-converting enzyme inhibitory activity of peptides of seabuckthorn (Hippophae rhamnoides L.) seed meal. Food Innovation and Advances 3(3): 295−304 doi: 10.48130/fia-0024-0029
    Zheng Y, Wang D, Zhou Y, Yuen M, Yuen T, et al. 2024. Characterization and angiotensin-converting enzyme inhibitory activity of peptides of seabuckthorn (Hippophae rhamnoides L.) seed meal. Food Innovation and Advances 3(3): 295−304 doi: 10.48130/fia-0024-0029

Figures(4)  /  Tables(4)

Article Metrics

Article views(1626) PDF downloads(269)

ARTICLE   Open Access    

Characterization and angiotensin-converting enzyme inhibitory activity of peptides of seabuckthorn (Hippophae rhamnoides L.) seed meal

Food Innovation and Advances  3 2024, 3(3): 295−304  |  Cite this article

Abstract: Given the side effects associated with synthetic antihypertensive drugs, there is a growing need among researchers to investigate angiotensin-converting enzyme (ACE) inhibitory peptides derived from food protein as safer therapeutic alternatives. This study used seabuckthorn (Hippophae rhamnoides L.) seed meal as the raw material, and the protein was extracted by alkaline extraction and acid precipitation. After enzymatic digestion, peptides with molecular weight less than 3 kDa were selected for study. The screened peptide had an IC50 value of 4.358 mg/mL on ACE with a non-competitive inhibition mechanism and good inhibition stability. By employing infrared (IR) analysis, exclusively β-fold and β-helix structures were identified in the hydrolysate, while no other structural motifs were detected. X-ray diffraction revealed that it had an irregular amorphous structure. The peptide contains 17 amino acids that are both highly acidic and hydrophobic, with glutamic acid ranking first in terms of the number of individual amino acids. Compared with the database (NCBI, Uniport), ten peptides with ACE inhibitory activity were detected, and molecular docking showed the mechanism of each peptide inhibiting ACE, FRVAWTEKNDGQRAPLANN, LIISVAYARVAKKLWLCNMIGDVT-TEQY, VIRSRASDGCLEVKEFEDIPP, AGGGG-GGGGGGSRRL, LQPREGPAGGTT-ALREELSLGPEAALDTPPAGP, DDEARINQLFL, FAVSTLTSYDWSDRDDATQGR-KL, RQLSLEGSGLGVEDLKDN, GGGGGGGGGGGGGGGIGGGGGGGGGGGAR, and KEALGEGCFGNRIDRIGD. According to the results, AGGGGGG-GGGGSRRL is more stable in binding to ACE and may have better inhibitory activity. It has been shown that seabuckthorn protein can be an alternative source of ACE inhibitory peptides.

    • As societal standards have risen, hypertension has emerged as a significant chronic health concern, affecting approximately 30% of the adult population in most countries[1,2]. Furthermore, it has been identified as the leading cause of mortality worldwide, accounting for 12.8% of all deaths[2]. The population of hypertension patients is expected to increase to 1.5 billion by 2025[3]. Despite synthetic drugs being a standard treatment for hypertension, 50% of patients still have blood pressure that is not adequately controlled[4]. In addition, the long-term use of drugs will produce potential side effects, increase patients' non-compliance to drugs, and endanger patients' health[5]. This has led to a new trend to find food-derived active peptides that effectively inhibit hypertension instead of chemical synthetic agents[6].

      Angiotensin-converting enzyme (ACE) was isolated in 1956 and used as a 'hypertension-converting enzyme'[7]. ACE is a chloride and zinc-dependent dipeptidase that plays a vital role in the regulation of electrolyte balance, blood pressure regulation, cardiovascular system development, and vascular remodeling by converting angiotensin I (Ang I) to angiotensin II (Ang II) in body fluids[8]. The potential of ACE inhibitory peptides to lower blood pressure has been the subject of considerable research. The peptides have been found to exert this effect by inhibiting the binding between Ang II and the receptor, or by increasing nitric oxide (NO) levels[6,9]. For instance, in cellular experiments conducted by Qiao et al., it was demonstrated that the ACE inhibitory peptides derived from tuna effectively suppressed the binding of Ang II to its receptor on ACE through an increase in NO content[9]. Wei et al. identified two ACE inhibitory peptides, FDRPFL and KWEKPF, by enzymatic digestion of Chinese Rushan cheese by-product[10]; Lin et al. investigated the digestion products of earthworm proteins, from which they isolated seven ACE inhibitory peptides SSPLWER, RFFGP, LERWP, MFPGIADR, FPGIADR, SADRISHGF, and ADRYSSWP[11]; Hu et al. isolated three ACE inhibitory peptides, SEGPK, FDGPY, and SPGPW, from Monkfish (Lophius litulon) swim bladders[12]; Suo et al. employed alkaline protease for the preparation of tuna byproducts-milts hydrolysates and identified ten ACE inhibitory peptides[13].

      Seabuckthorn is a premium source of bioactive peptides, given its comprehensive range of amino acids and elevated proportion of essential amino acids[14]. The total protein content of various seabuckthorn from India has been reported to range from 46 to 129 g/kg dry weight (DW). The protein content in the Polish seabuckthorn variety is 93 g/kg DW[15]. It is characterized by high protein content compared to other berries such as strawberry (Fragaria ananassa Duch.) (9 g/kg DW), golden berry (Solanum mammosum L.) (18.5 g/kg DW)[16], raspberry (Rubus idaeus L.) (33−44 g/kg DW)[17]. Seabuckthorn seed meal is a by-product generated during the supercritical CO2 extraction of seabuckthorn oil. Currently, most of this by-product is employed as animal feed or discarded as waste, resulting in a significant loss of resources. The objective of this study is to extract proteins and peptides from seabuckthorn seed meals that inhibit ACE activity, thereby increasing the utilization of seabuckthorn seed meal, reducing the waste of resources, and providing an alternative option for hypertensive patients.

      In this paper, seabuckthorn seed meal protein was hydrolyzed, investigated its inhibitory activity for ACE, determined its inhibitor value, and characterized its structure. Finally, ten peptides with ACE inhibitory activity were identified by mass spectrometry and further elucidated the mechanism of its interaction at the molecular level through molecular docking.

    • The seabuckthorn seed meal was provided by Puredia Limited (Xining, Qinghai, China) and was identified to contain 30.80 g of protein per 100 g of seed meal; Sunflower oil purchased from Yihai Kerry Arawana Holdings Co. (Shanghai, China); Compound enzyme preparation ZF101 from Angel Yeast Co. (Yichang, Hubei, China); Angiotensin-converting enzyme (ACE), and Hippuryl-histidyl-leucine (HHL) from Sigma-Aldrich Chemical Co. (Beijing, China); Protein Content Assay Kit, Amino Acid (20AA), Pepsin (1:3000), Trypsin (1:250) from Beijing Solarbio Science & Technology Co. (Beijing, China), Sodium hydroxide, hydrochloric acid from Tianjin Damao Chemical Reagent Factory (Tianjin, China).

    • The seabuckthorn seed meal was crushed and screened using a 120-mesh sieve, seabuckthorn seed meal with a mesh size greater than 120 continued to be crushed until all samples passed through the sieve. The screened seabuckthorn seed meal was added with water to make a suspension with a material-to-liquid ratio of 1:30. The pH of the system was adjusted to 10 with 1 M NaOH, and the pH of the system was maintained at this level. The extraction was conducted using a magnetic stirring water bath (SHJ-2A, Changzhou Jintan Liangyou Instrument Co., Limited) at 60 °C for 80 min. Once the extraction process was complete, the supernatant was collected and the pH was adjusted to 3 with 1 M HCl. The solution was then allowed to stand for 30 min, after which centrifugation was performed at 1,043 g for 10 min. The precipitate, which constituted the seabuckthorn seed meal protein, was then lyophilized for subsequent use.

      The formula for protein yield calculation:

      Proteinyield(%)=m1m×100

      where, m1: the amount of protein extracted; m: the quality of seabuckthorn seed meal used.

    • The protein of seabuckthorn seed meal was dissolved in water and prepared into a 7% (w/v) protein solution. Enzymolysis with 4.2% (w/w) compound enzyme preparation ZF101 was performed at 55 °C for 6.38 h. According to Li et al.[18], it has been demonstrated that ACE inhibitory activity is more pronounced for peptides smaller than 3 kDa. The enzyme solution was filtered through a 5 μm filter bag and then a 3 kDa filter membrane. The enzyme hydrolysate less than 3 kDa was retained for analysis.

    • Sample pretreatment

      Approximately 100 mg of the sample was placed in a 10 mL volumetric flask, then the mobile phase was sucked into the volumetric flask until it reached the calibration line, then processed with 100 W/L ultrasonic density for 5 min, centrifuged at 261 g, filtered with microporous filter membrane, and waited for sample injection.

      High-performance gel chromatography was employed to ascertain the molecular weight distribution of peptides and seabuckthorn seed meal proteins. The Waters 2695 HPLC (equipped with a 2487 UV detector and Empower workstation GPC software) was employed to ascertain the chromatographic conditions. The TSKgel 2000 SWXL column (Tosoh Biotechnology Co., LTD, Shanghai, China) was 300 mm × 7.8 mm in diameter and the mobile phase consisted of acetonitrile/water/trifluoroacetic acid in a ratio of 45/55/0.1 (V/V). Detection was carried out using a wavelength of 220 nm, with a flow rate of 0.5 mL/min, and the temperature of the column was set at 30 °C (Sigma Aldrich Trading Co., Ltd., Shanghai, China). The following compounds were used as standards for the molecular weight correction curve of seabuckthorn seed meal proteins (Sigma Aldrich Trading Co., Ltd., Shanghai, China): cytochrome C (MW 12384), trypsin inhibitor (MW 6500), bacitracin (MW 1422), Gly-Gly-Tyr-Arg (MW 451), and Gly-Gly-Gly (MW 189). Bovine albumin (MW 67000), ovalbumin (MW 45000), chymotrypsinogen A (MW 24000), and lysozyme (MW 14300).

    • The trichloroacetic acid nitrogen solubility index method (TCA-SNI) was employed, with slight modification. Insoluble proteins in solution were precipitated with trichloroacetic acid, and following centrifugation, the nitrogen content in the supernatant was determined using the Kjeldahl nitrogen method[19]. The specific method was to take 1 mL of protein hydrolysate, add 3 mL trichloroacetic acid solution, shake and mix for 15 min, then centrifuge at 1,043 g for 10 min, take the supernatant, and use a Protein Content Assay Kit (Biuret Method) to determine peptide content.

      The formula for the calculation of polypeptide yield:

      Yieldofpeptides(%)=n1n×100

      where, n1: peptide content in the supernatant; n: the amount of protein consumed.

    • With certain modifications based on the methodology proposed by Zhu et al.[20]. A quantity of the sample was subjected to hydrolysis with 6 M HCl at 110 °C for 22 h, then removed and neutralized with NaOH. Following this, it was filtered through a 22 μm membrane and assayed. HPLC parameters (Waters2695, equipped with 2487 UV detector and Empower workstation GPC software, Agilent, USA), chromatographic conditions: Column: C18 SHISEIDO (Shanghai Inguang Trading Co., Ltd., Shanghai, China) (4.6 mm × 250 mm × 5 μm); injection volume: 10 μL; column temperature: 40 °C; The flow rate was stabilized at 1.0 mL/min. UV detection conditions were as follows: the wavelength was 338 nm and changed to 262 nm at 22.5 min. Fluorescence detector conditions: excitation wavelength 340 nm, emission wavelength 450 nm, 22.5 min excitation wavelength changed to 266 nm, emission wavelength 305 nm; Mobile phase: A: sodium acetate-triethylamine-tetrahydrofuran solution, B: sodium acetate-acetonitrile-methanol solution; Standard: 17 amino acids (Sigma Aldrich Trading Co., ltd., Shanghai, China).

    • The sample lyophilized powder (2 mg) was mixed with 200 mg of dried KBr. The mixture was then ground evenly with an agate mortar, pressed, and scanned with an infrared spectrometer (VERTEX70, VERTEX, Germany) with a KBr background in the spectral range 4,000−500 cm−1. Software Origin 2019 was used for mapping, and PeakFit v4.12 software was used for analysis. Two-point baseline correction was performed in the spectral range 1,600−1,700 cm−1, followed by Savitsky-Golay function smoothing, and fitted in second derivative spectra. Manual fitting can be performed multiple times to reduce the residual error (R2 ≥ 0.999). The percentage of secondary structure based on the area of each peak was calculated[21].

    • Adjustments were made according to Lin et al.[22]. Samples were examined using an X-ray diffractometer (D8ADVANCEA25, Bruker, Germany) at a voltage of 40 kV and a current of 40 mA with a step scan of 0.02° from 5° to 70°.

    • Peptides were identified by Quadrupole-TOF LC-MS/MS System. The analytical column used in capillary liquid chromatography: Mobile phase A: 0.1% formic acid; Mobile phase B: 0.1% formic acid and 80% acetonitrile; Flow rate: 300 nL/min. Primary mass spectrometry parameters: Resolution: 60000; AGC target: 4.0e5; Maximum IT: 100 ms; Scan range: 375−1,500. Secondary mass spectrometry parameters: Resolution: 15,000; AGC target: 5.0e4; Maximum IT: 256 ms. The range scan mode is m/z Normal (Auto), and the HCD Collision Energy (%) is 30. The isoelectric point (pI), net charge, and solubility of peptides were calculated using the method used by Lear & Cobb[23].

    • The borate buffer was prepared with a pH of 8.3, an 8 mM HHL solution, and an ACE solution with an activity of 0.1 U/mL. Three test tubes were prepared and designated as sample A, control B, and blank C. Each test tube was then supplied with 200 mL of the HHL solution, 250 mL of HCl to test tube C and 100 mL of the enzymatic hydrolysate. Test tube A was placed in a water bath set at 37 °C for 5 min. Subsequently, 20 mL of ACE solution was added to each of the three test tubes, which were then incubated in the water bath for an additional 30 min. Then, an HCl solution was added to test tubes A and B, and a borate buffer solution was added to test tubes B and C to make them react. After the reaction, 1.7 mL ethyl acetate was added to each tube and full reaction 20 s before allowing it to stand until the liquid stratified. 1 mL of the ethyl acetate layer was removed from each tube and placed into a drying oven at 120 °C for 30 min. After drying, the tube was removed and the solution was prepared in 3 mL of ultra-pure water. The UV spectrophotometer was then calibrated to 228 nm to measure the absorbance value of the dissolved solution[2426]. The enzymatic solution was diluted to five concentration gradients, and the measured results were analyzed by IC50. The calculation formula is as follows:

      ACEinhibitionrate(%)=ABAAABAC×100

      where, AB: Absorbance of the control tube; AA: Absorbance of the sample tube; AC: Absorbance values of blank tubes.

    • Peptides less than 3 kDa were diluted and divided into three concentrations: 19.5, 9.75, and 0 mg/mL. The reaction was carried out at four different concentrations of HHL (8.0, 4.0, 2.0, and 0.8 mmol/L, respectively). The reciprocal of the reaction rate (1/V) is used as the ordinate and the reciprocal of the substrate concentration (1/[S]) as the abscissa Lineweaver-Burk double reciprocal plot was made to analyze the inhibition pattern, and the inhibition constants Km and Vmax were calculated by the intercept between the line and the horizontal and vertical coordinates[27,28].

    • According to Wang's team[29], the stability of peptides at different temperatures and pH was determined. Peptide solutions with a molecular weight of less than 3 kDa were subjected to a water bath treatment at temperatures of 4, 20, 40, 80, and 100 °C for 2 h. Following this, the inhibitory rate on ACE was determined. The peptide solution of less than 3 kDa was kept at pH 2, 4, 6, 8, 10, and 12 at 37 °C for 2 h, and the pH was adjusted to 8.3 to determine the ACE inhibition rate of the peptide.

    • The 1O8A crystal in the RCSB PDB database (PDB DOI: 10.2210/pdb1O8A/pdb) was used as the acceptor ACE structure in this section, and the Zn and Cl atoms in 1O8A were retained and saved in pdb format for use during docking. The molecular structure of the ACE inhibitory peptide was plotted using the Chemdraw18.0 software, and the energy of the molecular structure was minimized. The molecular docking was performed with the software AutoDockTools-1.5.6, and the center coordinates of the docking box were 40.575 in x, 37.430 in y, and 43.759 in z. The Analyze program in AutoDockTools-1.5.6 software was used to view and analyze the results, and PyMOL software was used to plot the docking results for ACE and peptides.

    • ​All samples were measured at least three times, and data were represented as average ± standard deviation. The data were analyzed using IBM SPSS Statistics 27.

    • The preparation of seabuckthorn seed meal peptides is shown in Fig. 1. Seabuckthorn seed meal, which is a byproduct of the oil extracted from seabuckthorn seeds, contains a considerable concentration of protein and a plethora of amino acids. This quality renders seabuckthorn seed meal a superior source of protein[30]. In this experiment, seabuckthorn seed meal was crushed, and seabuckthorn protein was extracted by alkaline extraction and acid precipitation, and the protein yield was 27.66%. The protein extraction rate increased with the increase in pH. However, too high a pH leads to the production of a toxic lysinoalalnine protein that leads to the passivation of metalloenzymes and nephrotoxicity and further compromises the nutritional value of foods[31]. To better preserve the flavor, color, structure, and nutrition of seabuckthorn seed meal protein, freeze-drying was selected[32,33]. To optimize the industrial production of seabuckthorn seed meal peptide, a food-grade enzyme preparation was used. The optimal pH for enzyme activity was neutral, which reduced the production of inorganic salts and avoided the loss of equipment in the production process. After enzymatic digestion with ZF101 protein, the yield of polypeptides obtained from seabuckthorn seed meal was 24.29%.
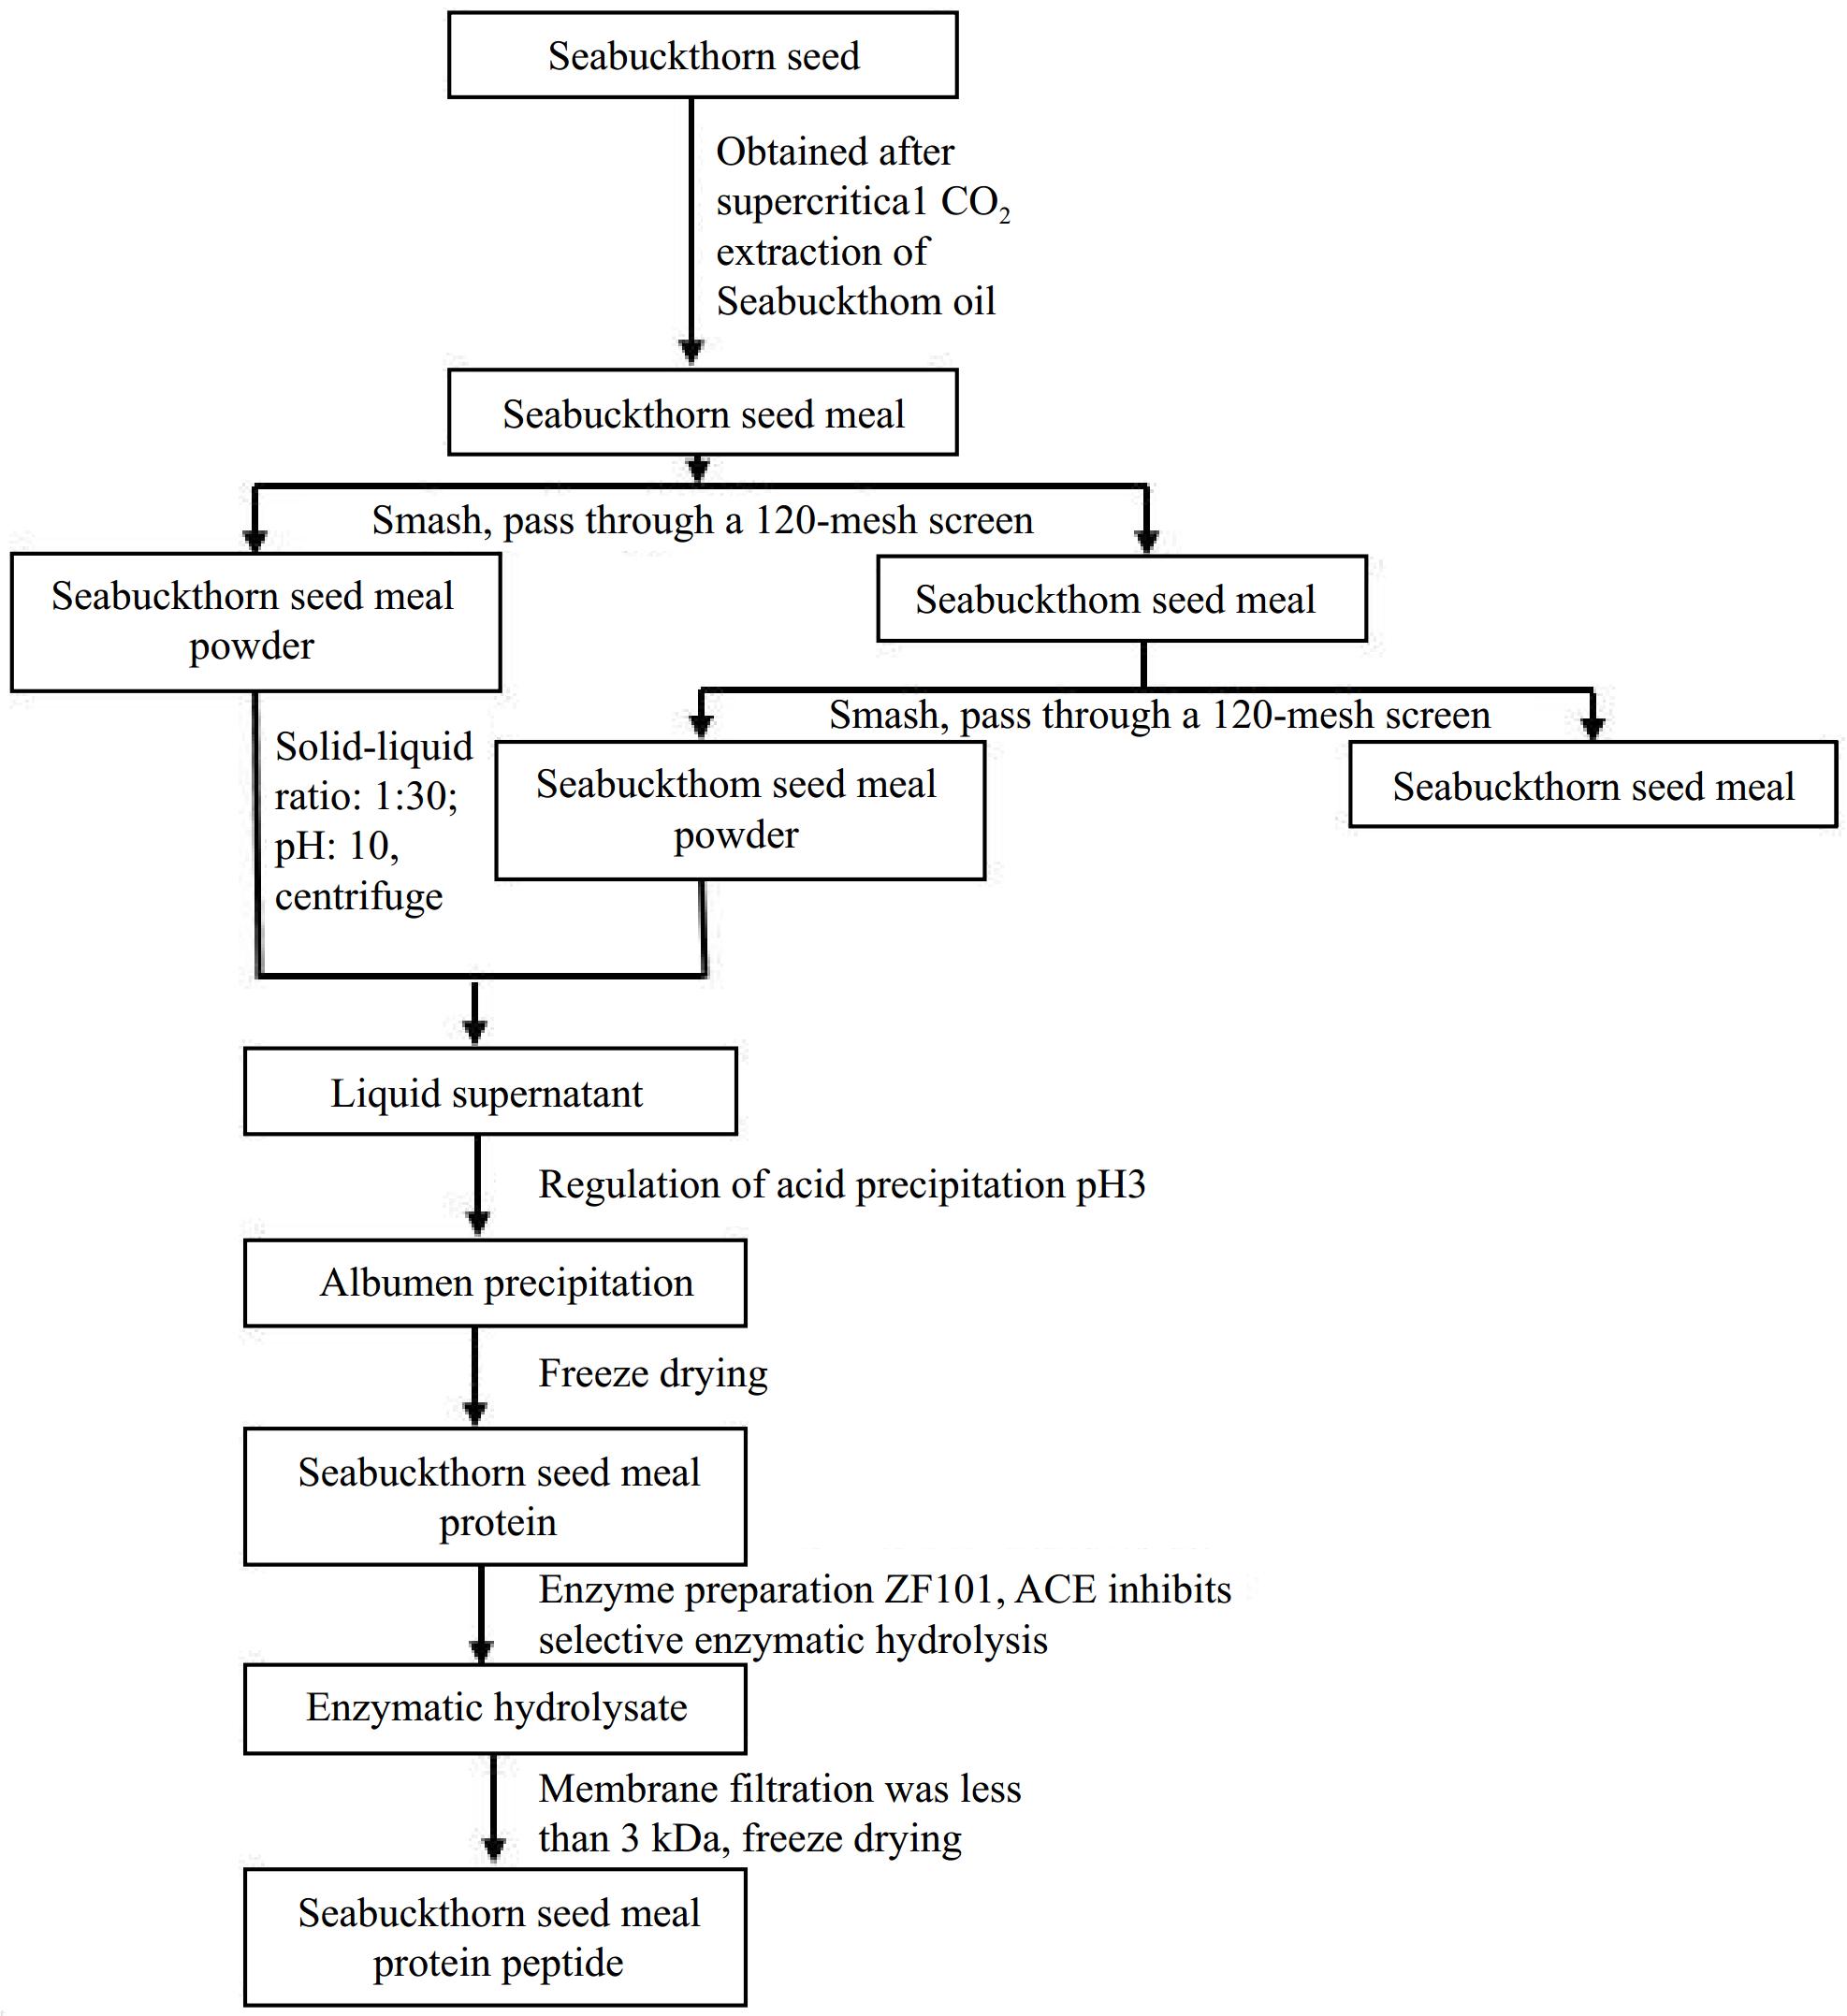
      Figure 1. 

      Preparation of ACE inhibitory peptides from seabuckthorn seed meal.

    • The MW distribution of seabuckthorn seed meal protein before and after enzymatic digestion is shown in Tables 1 & 2. Table 1 shows that the molecular weight of seabuckthorn seed meal protein is relatively large, mainly distributed in the range of 50~10 kDa, with an average molecular weight of 170,280 Da. Following enzymatic hydrolysis, the molecular weight of peptides is markedly diminished, with the average molecular weight reduced to 2,842 Da. Most of these peptides have a molecular weight below 3 kDa, representing 63.41% of the total. The free amino group (< 180 Da) was 14.44%. The content of peptides in the range of 180−3,000 Da was 48.97%.

      Table 1.  Test results of protein MW of seabuckthorn seed meal.

      MW (Da) PAP (%) NAMW (Da) WAMW (Da)
      > 500 k 13.98 768,704 803,432
      500 k~100 k 15.45 191,719 239,242
      100 k~50 k 11.52 67,218 69,982
      50 k~20 k 26.88 30,453 32,557
      20 k~10 k 24.98 14,362 14,858
      < 10 k 7.19 4,191 6,573

      Table 2.  Determination of polypeptide MW of seabuckthorn seed meal.

      MW (Da) PAP (%) NAMW (Da) WAMW (Da)
      > 10000 3.26 11,507 11,678
      10,000~5,000 19.40 6,760 7,012
      5,000~3,000 13.93 3,871 3,956
      3,000~2,000 8.84 2,448 2,482
      2,000~1,000 12.38 1,401 1,458
      1,000~500 11.09 698 725
      500~180 16.66 283 304
      < 180 14.44 / /
      MW, Molecular weight; PAP, peak area percentage; NAMW, number average molecular weight; WAMW, weight average molecular weight.
    • Based on the analysis shown in Table 3, the polypeptide of seabuckthorn seed meal contains 17 amino acids, a total of 53.61 g/100 g, of which the proportion of essential amino acids is 27.88. According to the nature of amino acids, the content of acidic amino acids was the highest (39.33%), followed by hydrophobic amino acids (29.24%) and aromatic amino acids (5.88%). According to Cheung et al. and Suetsuna's & Nakano, the composition and content of amino acids play an essential role in ACE inhibition[34,35]. Hayes et al. found that hydrophobic amino acids, such as Phe, Trp, Tyr, Val, Leu, and Ile, favored to combine with the C-terminal active site of ACE[36]. Additionally, C-terminal amino acid residues containing positive charge, such as Lys and Arg, could be conducive to increasing the ACEi activity of peptides. Pro arouses great attention of researchers because Pro occurs frequently at the C-terminus of antihypertensive peptides, such as LYPPP, YSMYPP, VGLYP, EVSQGRP, YP, and KDEDTEEVP[1]. This is consistent with the amino acid composition analyzed in this assay.

      Table 3.  Amino acid composition analysis.

      Name Time
      (min)
      Area
      (mau*s)
      Content
      (g/100 g)
      Proportion of
      total amino
      acid content
      Aspartic acid (Asp) 2.953 696.862 6.366 11.873%
      Glutamic (Glu) 3.400 1327.706 14.757 27.525%
      Serine (Ser) 6.851 363.541 2.638 4.921%
      Histidine (His) 7.780 62.961 1.148 2.141%
      Glycine (Gly) 8.724 412.175 2.162 4.033%
      Threonine (Thr) 9.093 180.797 1.534 2.860%
      Arginine (Arg) 10.430 696.119 8.622 16.082%
      Alanine (Ala) 11.566 339.348 2.072 3.864%
      Tyrosine (Tyr) 13.934 90.650 1.239 2.311%
      Valine (Val) 17.986 294.825 2.415 4.505%
      Methionine (Met) 18.348 17.390 0.177 0.330%
      Phenylalanine (Phe) 20.963 162.056 1.918 3.577%
      Isoleucine (Ile) 21.412 217.560 1.984 3.701%
      Leucine (Leu) 22.678 399.479 3.569 6.657%
      Lysine (Lys) 23.488 243.452 1.468 2.739%
      Proline (Pro) 29.987 291.578 1.391 2.594%
      Cystine (Cys) 16.960 10.302 0.154 0.287%
    • There is an essential relationship between the secondary structure of peptides and their intramolecular bonding. Fourier transform infrared spectroscopy is a powerful method. Figure 2a shows that the peptide contains C-H, N-H, C=O, C-N, and -COO functional groups according to the fluctuations in the IR spectra[37]. According to Zhao et al.[21], the band ranges of β-folding, random coil, α-helix, and β-angle were 1,600−1,640, 1,640−1,650, 1,650−1,660, and 1,660−1,700 cm−1, respectively, which were processed by software PeakFit v4.12. The results of the amide I band (1,600−1,700 cm−1) showed that the β-fold structure was the main secondary structure with a content of 61.87% ± 1.42%. The content of the β-turn structure was 38.13% ± 1.42%, while no other structural motifs were detected.
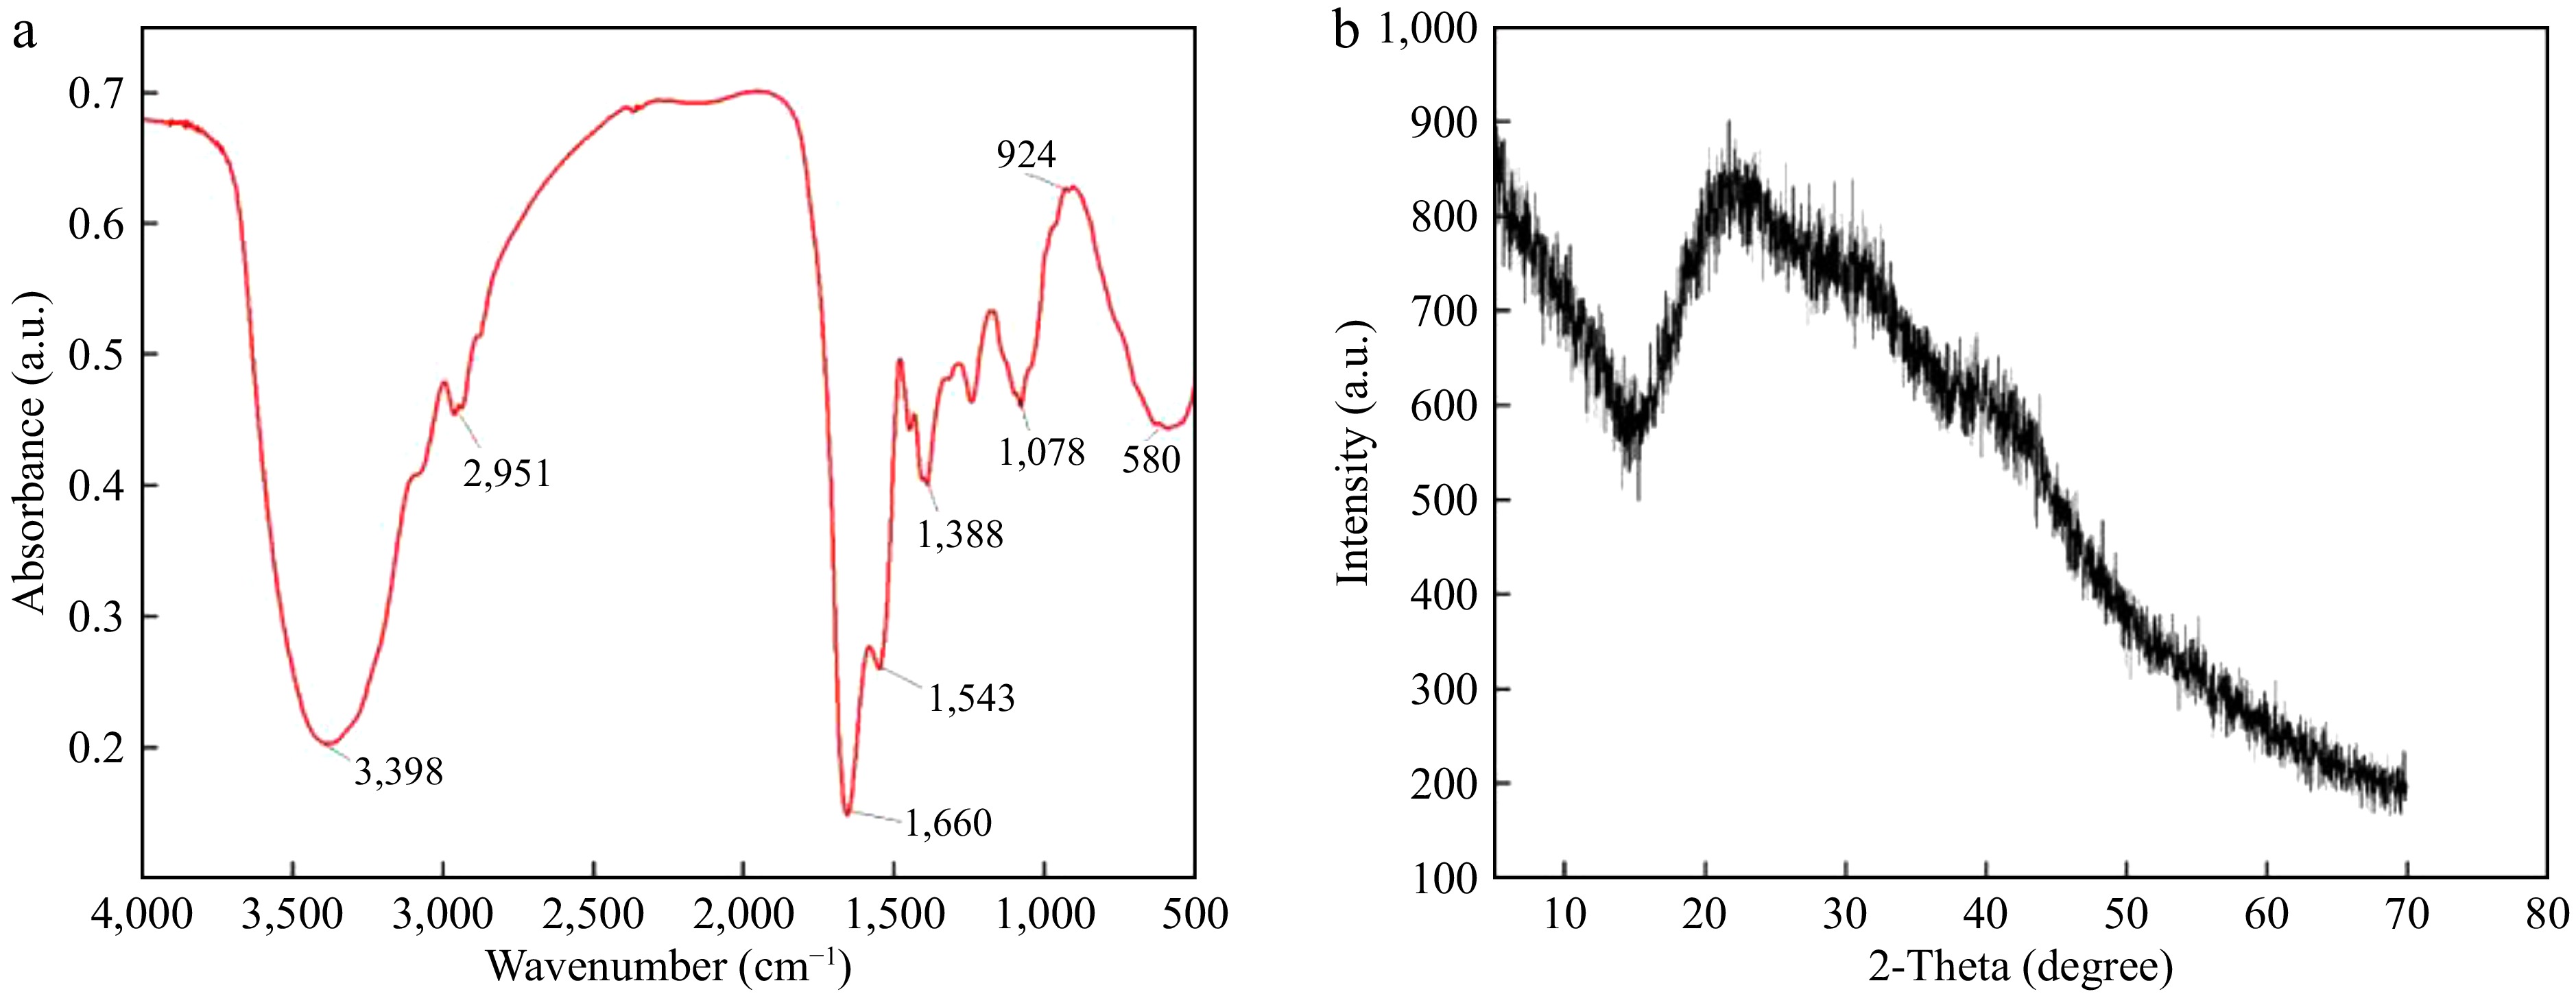
      Figure 2. 

      (a) Infrared diffraction spectra of peptides. (b) X-ray diffraction results of peptides

    • As can be seen in Fig. 2b, the sample has a diffraction angle of 22. The figure shows a diffraction absorption characteristic peak. However, the peak intensity is low, and the background is broad, which indicates that the ACE inhibitory peptide of seabuckthorn seed meal has a random amorphous structure.

    • The detection results of peptides < 3 kDa were compared with the NCBI and Uniprot databases of ACE inhibitory peptides, and 10 ACE inhibitory peptides were detected. The results are shown in Table 4. The molecular distributions of the peptides measured in this study range from 1,000 to 3,000 Da. Except for the peptides AGGGGGGGGGGSRRL and DDEARINQLFL, which are slightly larger than 1 kDa, the rest of the peptides are more significant than 1.5 kDa, presumably because most of the peptides obtained by enzymatic hydrolysis are not recorded in the database and are not detected. Ma et al. and Toopcham's team arginine could enhance the ACE-inhibiting activity of peptides, and most of the peptides screened in this study contained arginine, similar to the amino acid sequence screened[38,39].

      Table 4.  Peptide detection results and physicochemical properties.

      Serial number Amino acid sequence Mass-to-charge ratio Isoelectric point Static charge Solubility
      1 FRVAWTEKNDGQRAPLANN 2187.105 pH 9.86 1 Good
      2 LIISVAYARVAKKLWLCNMIGDVTTEQY 3198.705 pH 8.70 0.9 Poor
      3 VIRSRASDGCLEVKEFEDIPP 2360.191 pH 4.16 −2.1 Good
      4 AGGGGGGGGGGSRRL 1172.588 pH 12.10 2 Good
      5 LQPREGPAGGTTALREELSLGPEAALDTPPAGP 3268.681 pH 3.88 −3 Good
      6 DDEARINQLFL 1333.675 pH 3.54 −2 Good
      7 FAVSTLTSYDWSDRDDATQGRKL 2632.264 pH 4.19 −1 Good
      8 RQLSLEGSGLGVEDLKDN 1929.988 pH 3.93 −2 Good
      9 GGGGGGGGGGGGGGGIGGGGGGGGGGGAR 1841.798 pH 10.84 1 Good
      10 KEALGEGCFGNRIDRIGDVSGMGCNRRTPAP 3276.578 pH 8.07 0.9 Good
    • The relationship between the concentration of ACE inhibitory peptide and the inhibition rate of seabuckthorn seed meal is shown in Fig. 3a (R2 = 0.9538). ACE inhibitory peptide concentration and inhibitory activity show a positive correlation. Based on the correlation curves in Fig. 3b, the IC50 is 4.358 mg/mL.
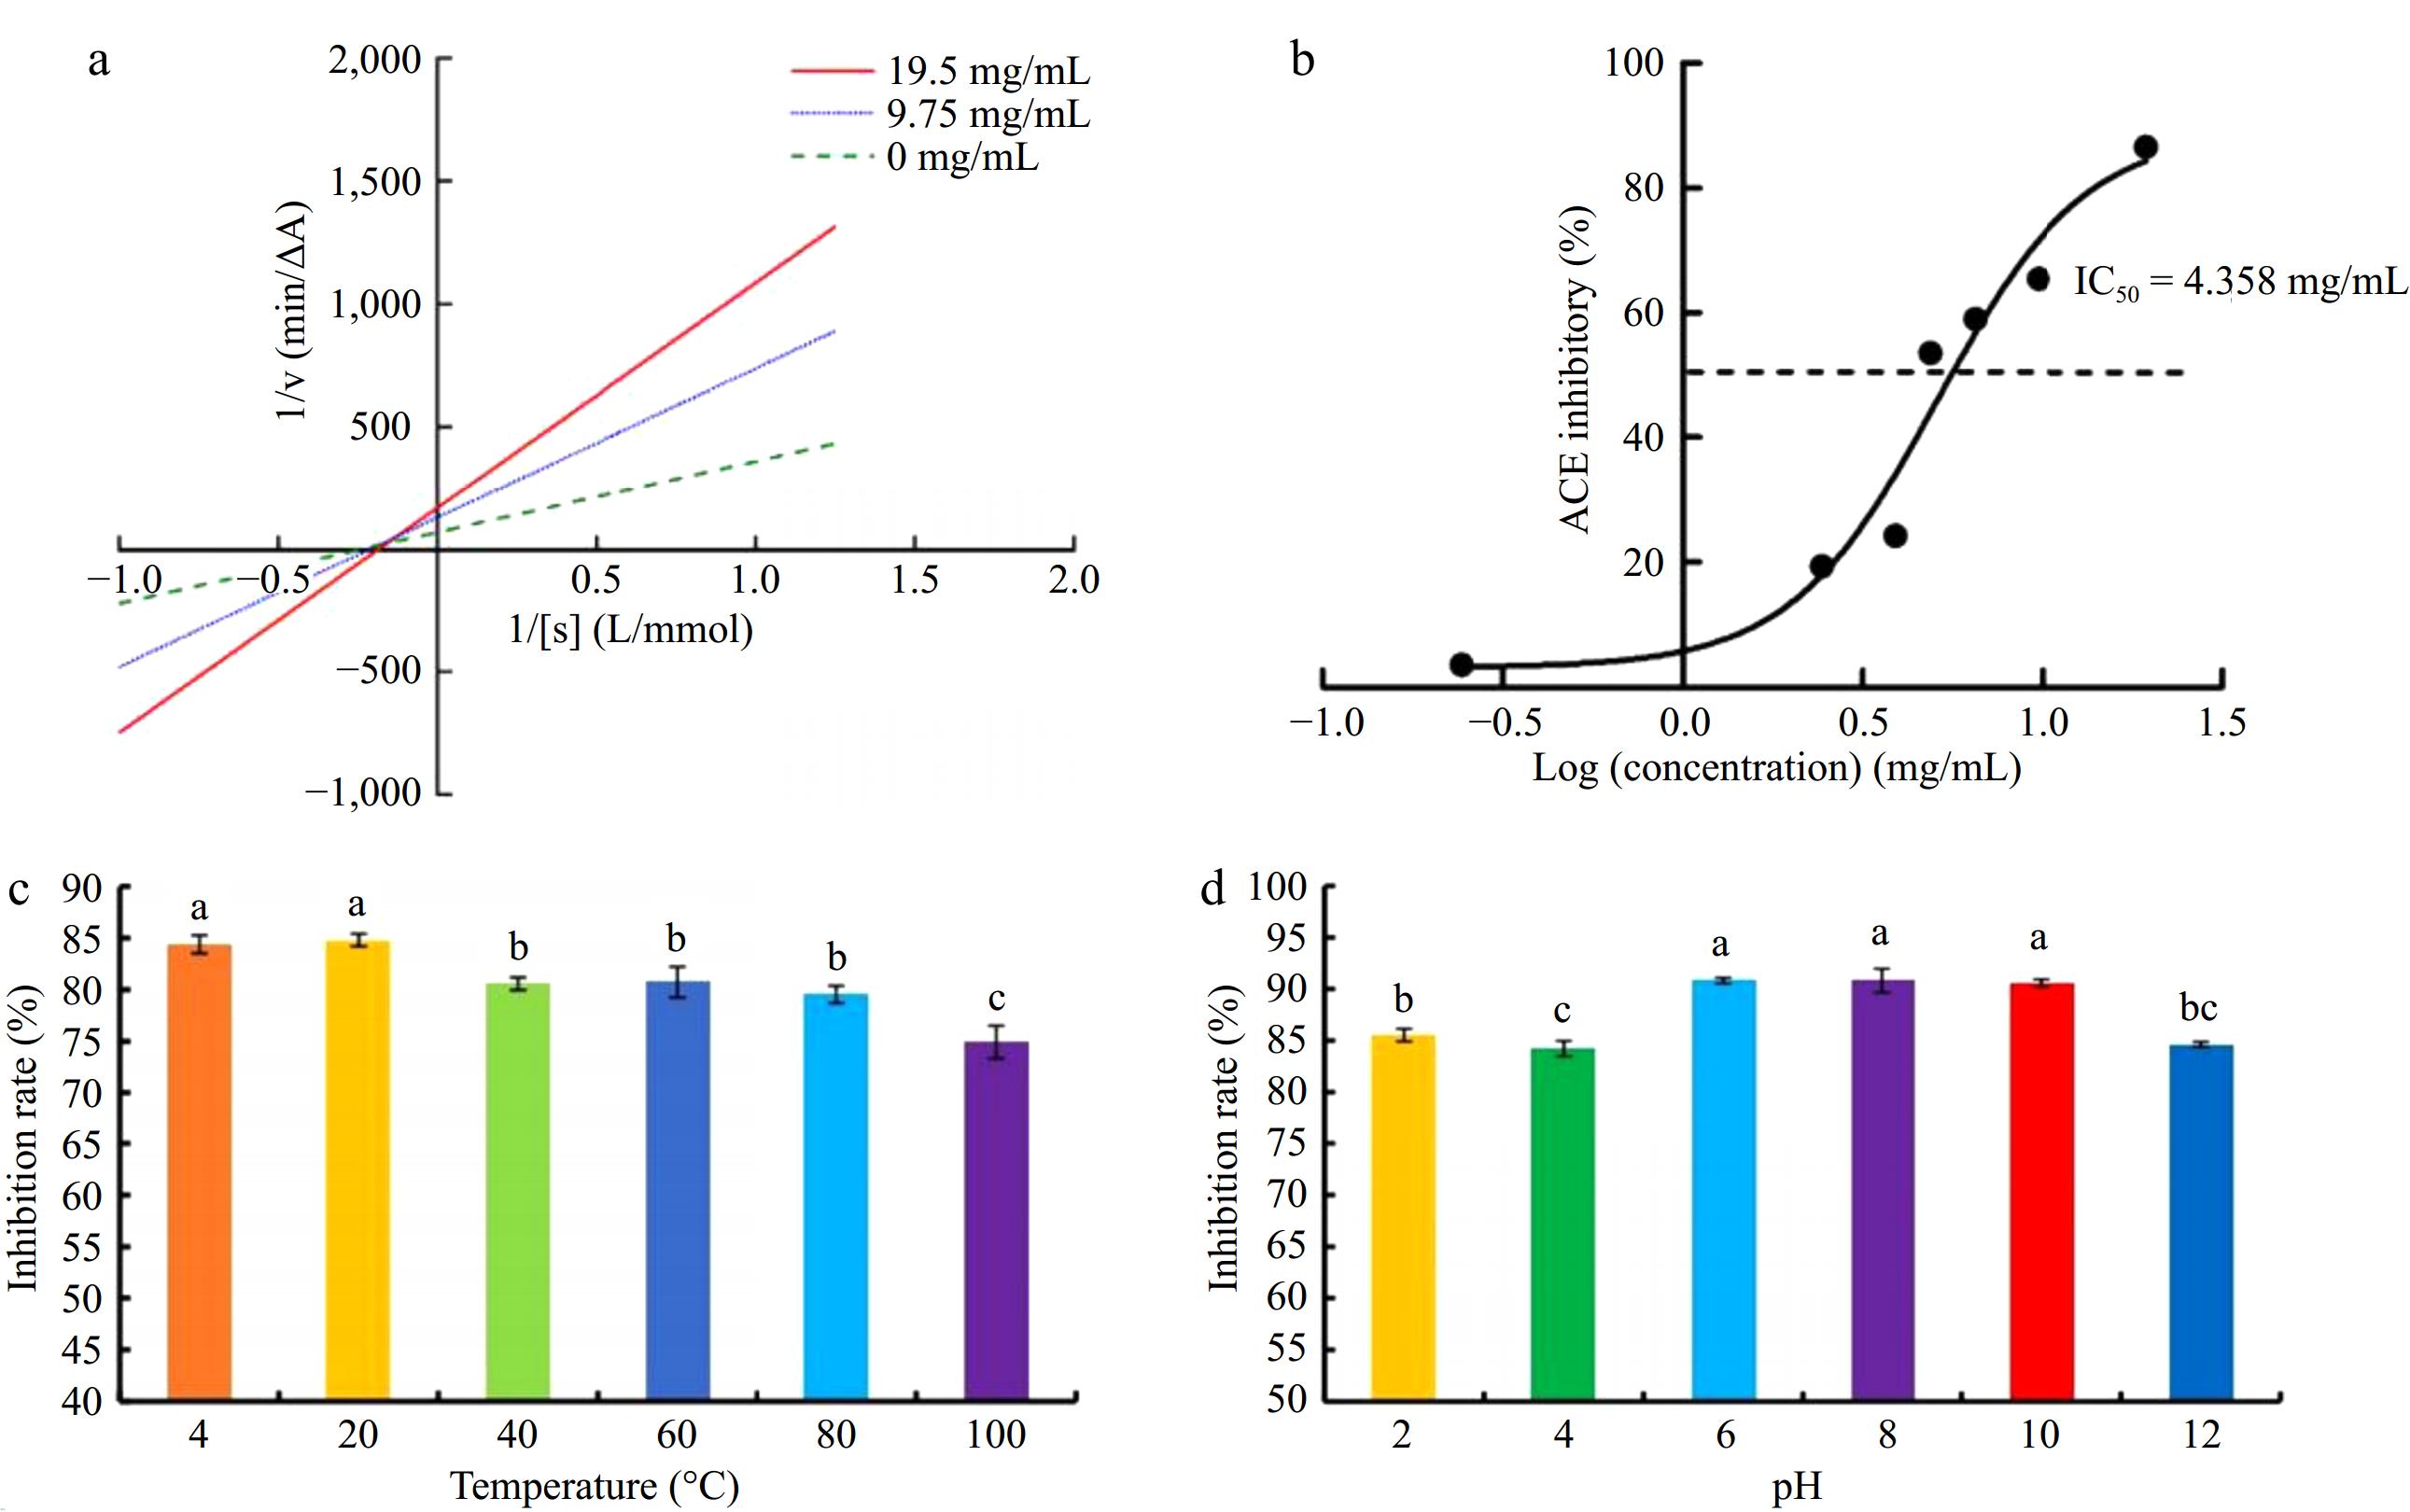
      Figure 3. 

      (a) Relationship between ACE inhibitory peptide concentration and inhibitory activity of seabuckthorn seed meal. (b) Kinetic double reciprocal diagram of seabuckthorn seed meal polypeptide inhibiting ACE. (c) The ACE inhibition rate of seabuckthorn seed meal peptides treated at different temperatures. (d) The ACE inhibition rate of seabuckthorn seed meal peptides treated at different pH. Different letters represent significant differences at p < 0.05.

    • Lineweaver-Burk plots were used to analyze the kinetic mechanism of ACE inhibition of seabuckthorn seed meal peptides. As shown in Fig. 3a, the Lineweaver-Burk line of seabuckthorn seed meal peptide intersects 1/[S], indicating that the inhibition type of ACE by seabuckthorn seed meal peptide is non-competitive. This proved that the seabuckthorn seed meal polypeptide does not compete with the substrate and can bind to the ACE-HHL complex or sites other than the ACE active site, changing the spatial formulation of ACE and reducing the activity[40]. The ACE inhibition rate of the polypeptides from seabuckthorn seed meal was positively correlated with the concentration, similar to the inhibition mode of the ACE inhibitory peptide derived from tilapia skin gelatin[41]. The tetrapeptide FRVM from the algae[18], and all of them were non-competitive.

    • Figure 3c & d shows the results of the inhibition rate determined after treatment of peptide solution < 3 kDa at different temperatures and pH for 2 h. There was no significant change in the inhibition rate of ACE by the polypeptides of seabuckthorn seed meal, which indicated that peptides < 3 kDa had good thermal stability and pH stability.

      The ACE inhibition rate of 1% (w/v) peptide solution was 67.46% ± 3.83%. The undigested peptide solution was digested by pepsin and trypsin, and its structure was destroyed. In general, the ACE inhibitory peptide of seabuckthorn seed meal peptides still has an excellent inhibitory ability after digestion. This suggests that the performance of the peptides is stable after oral administration[29]. Studies have shown that some ACE-inhibitory peptides do not achieve the desired effect after they enter the body because they are broken down into peptides with low ACE-inhibitory activity in the stomach[42,43].

    • Molecular simulation docking was performed on ten selected peptides with ACE inhibitory activity, and the docking results are shown in Fig. 4. According to Natesh's team[44], the active sites in ACE can be divided into three pockets, namely S1, S2, and S1′. S1 contains Glu384 and Tyr523. S2 contains His353, Ala354, Cys511, His513 and Tyr520. S1′ contains Gln162, Asp377, and a triplex of catalytic sites for His383, His387, Glu411, and Zn2+.
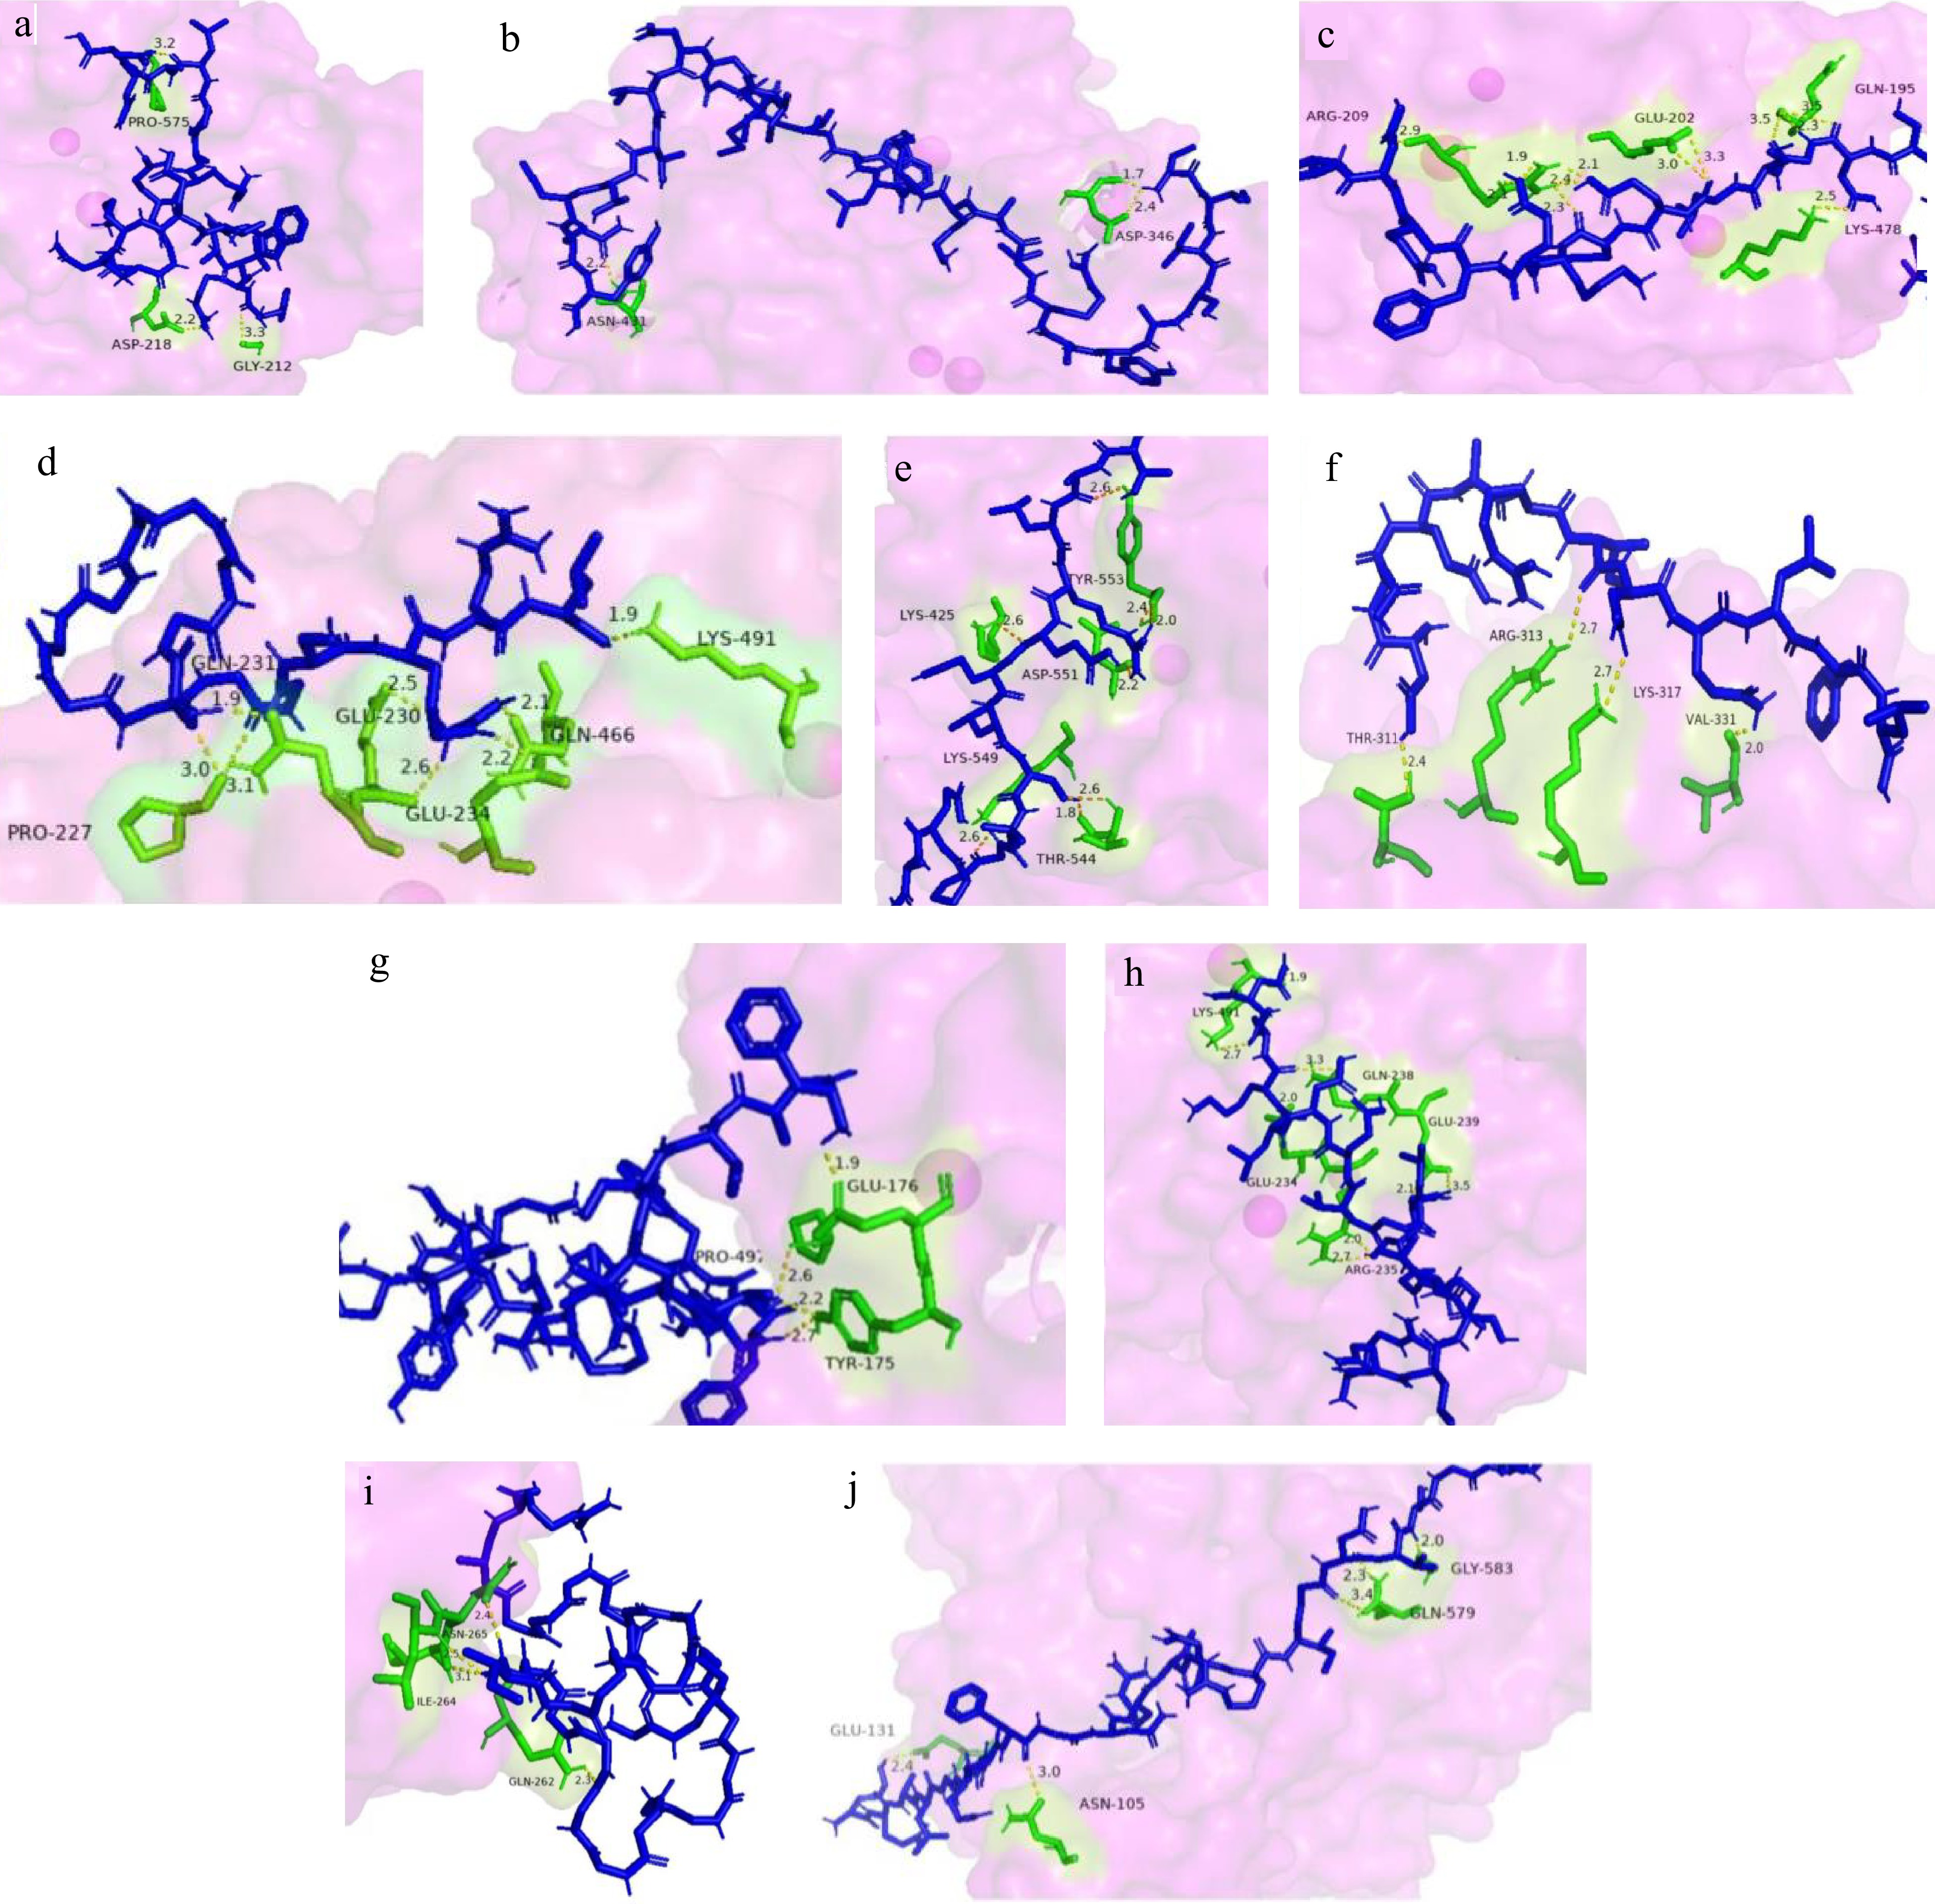
      Figure 4. 

      Molecular docking results of peptides and ACE (1−10 docking results of 10 peptides in Table 2). Blue is peptide; Purple is ACE; Green is amino acid; Yellow is the bond created by the interaction.

      Using simulated docking, it was found that ten peptides interact with ACE at different sites and form different numbers of hydrogen bonds with ACE. Only the fifth peptide and ACE interact in chain-to-chain, and no bonds are formed at the atomic level. The binding ability of inhibitory peptides and ACE is related to the number and length of hydrogen bonds they form. In the results of this simulation, peptide 3 forms many hydrogen bonds with ACE, including Arg209, Glu202, Gln195, and Lys478, to form 12 hydrogen bonds, six of which were formed with Arg209, followed by peptides 4 and 8. The binding sites of peptide 4 are Gln231, Pro227, Glu230, Glu234, Gln466, and Lys491. Although the binding sites are not located at the active center of the ACE, they are all located near Zn2+. Peptides 1 and 2 form the fewest hydrogen bonds (only three), and none of them are in the ACE active site, but they are still close to the active pocket. In addition to hydrogen bonding, interactions between peptide chains are also crucial in maintaining the stability of the complexes they form.

    • Over the past decade, there has been a growing interest in the extraction of bioactive peptides from food. There is a trend towards the screening of bioactive peptides for use as drug substitutes in the treatment of hypertension[6]. A significant number of papers have investigated the structural characterization, bioavailability, functional effects, and inhibitory mechanisms of peptides[43,4547]. A significant number of studies have employed molecular docking, bioinformatics technology, and biological protein databases to analyze the relationship between the structure and biological activity of ACE-inhibitory peptides and to elucidate the inhibitory mechanism of ACE-inhibitory peptides[48]. According to existing literature, for ACE-inhibitory peptides, peptides with smaller molecular weights have more potent biological activity than peptides with larger molecular weights[49,50]. To enhance the biological activity of the protein hydrolysate, it was subjected to a series of separation and purification processes, with the aim of aligning the final product with the specific requirements of the target market. This involved the utilization of membrane separation technology, which allowed for the separation of peptides according to their characteristics. Ultrafiltration technology has been widely used in the production of proteins and polypeptides in factories, but the size of the separation molecular weight is negatively correlated with the cost of the factory; that is, the smaller the molecular weight, the more the cost of the factory, so the factory generally chooses to use 3 kDa ultrafiltration membrane for production. Since this study will be applied to factory production, peptides < 3 kDa were selected for study.

      The present study focuses on the characterization of polypeptides from the seed meal of seabuckthorn and their inhibitory activity and mechanism against ACE. Infrared spectroscopic scans, X-ray diffraction, and Quadrupole-TOF LC-MS/MS System have been used mainly for secondary and primary structure studies. The molecular weight of some active peptides identified in this study was higher than that of peptides obtained by other scholars, which may be because, for the practicality of the factory, too many separation and purification steps were not performed, and a specific peptide was not locked before identification, but the ultrafiltration samples were directly identified. In addition, the methods and databases used to identify ACE-inhibitory peptides may also lead to discrepancies and deficiencies in the results. Enzymatic products may contain short peptides not listed in the ACE inhibitor peptide database. Other reasons may be the difference in enzymes used. The enzymatic hydrolysis of food-grade enzyme preparations is weaker than that of chemical grade. Although the molecular weight of the identified peptides is slightly higher than that of other scholars, the results of previous specific research on the overall activity of ACE inhibitory peptides have shown better and can be applied in practical production.

      Molecular simulation docking technology is a commonly used method to study the active mechanism of active peptides. This technology can interact with small molecules and proteins through specific algorithms and continuously optimize information such as ligand positions, amino acid side chains, and bond angles. By obtaining the binding energy of each binding mode, researchers could quickly screen out peptides with better activity based on the binding energy. This approach has extensively promoted the development of active peptide research. Li's team[48] extracted RGLSK from Pixian bean sauce, which showed vigorous ACE inhibitory activity, and Ma's team[51] extracted EYFR and LPGP from the hydrolysate of Channa striatus, which may have ACE inhibitory function. Wei's team[52] extracted seven ACE inhibitory peptides from distillers' grains, and Lu's team[53] extracted four ACE inhibitory peptides from black tea, including QTDEYGNPPR, AGFAGDDAPR, IQDKEGIPPDQQR, and SIDELR, and understood their inhibitory mechanism through molecular simulation docking technology.

      This experiment uses food-grade enzymes for enzymatic hydrolysis, which avoids the distinction between chemical enzyme preparation and industrial enzyme preparation, making the experimental results more relevant to actual production and better applicable to industrial production. In this experiment, the selected peptide was not purified and synthesized, which made the ACE inhibitory peptide obtained had a higher IC50 than the peptide obtained in previous experiments, but we believe that this is in line with the needs of practical production. Moreover, the seabuckthorn seed meal peptide prepared in this study has only been tested for in vitro activity. The inhibitory effect in vivo has yet to be discovered, and further in-depth research is needed.

      In this experiment, seabuckthorn seed meal protein was used as raw material, food-grade enzyme preparation was used for enzymatic hydrolysis, the yield of peptide was 24.29%, and the structure of the obtained peptide solution was characterized and the effect of ACE inhibition activity was studied. The peptide solution was ultrafiltrated, and the peptide fragment < 3 kDa was selected for structural characterization. The structure of the peptide contained in the peptide solution was mainly β-fold and β-turn structure, and it was an amorphous structure. This makes the peptide more stable and will not change in actual production. Ten peptides with ACE inhibitory activity were screened by LC-MS/MS analysis, and compared with NCBI and Uniprot databases. Molecular docking showed the conformational relationship between each peptide and ACE. The experimental analysis showed that the inhibition mode of ACE by seabuckthorn seed meal protein peptide was non-competitive. No significant effect of the inhibitory activity of the peptide occurred at different temperatures and pH. In conclusion, polypeptides from seabuckthorn seed meal showed good inhibitory stability against ACE and could be a potential drug source for the treatment of hypertension.

    • The authors confirm contribution to the paper as follows: project administration: Peng Q; formal analysis, data curation: Zheng Y, Wang D; resources, writing - review & editing: Peng Q, Yuen M, Yuen T, Yuen H; funding acquisition: Peng Q, Yuen T; validation: Zheng Y, Wang D, Yuen H; visualization: Zhou Y, Wang D; investigation: Wang D, Zhou Y, Yuen M, Yuen T; methodology: Zheng Y; writing - original draft: Zheng Y, Wang D, Zhou Y. All authors reviewed the results and approved the final version of the manuscript.

    • The datasets generated during and/or analyzed during the current study are available from the corresponding author on reasonable request.

      • This research was financially supported by the Science and Technology Project of Xining (Grant No. 2022-Y-12) and Northwest A&F University College Students' Innovation and Entrepreneurship Training Programme (Grant No. 202410712287). The authors would also like to thank the instrument shared platform of College of Food Science & Engineering of Northwest A&F University, for the assistance in High Performance Liquid Chromatography (HPLC)/Fourier transform infrared spectrometer.

      • The authors declare that they have no conflict of interest.

      • Copyright: © 2024 by the author(s). Published by Maximum Academic Press on behalf of China Agricultural University, Zhejiang University and Shenyang Agricultural University. This article is an open access article distributed under Creative Commons Attribution License (CC BY 4.0), visit https://creativecommons.org/licenses/by/4.0/.
    Figure (4)  Table (4) References (53)
  • About this article
    Cite this article
    Zheng Y, Wang D, Zhou Y, Yuen M, Yuen T, et al. 2024. Characterization and angiotensin-converting enzyme inhibitory activity of peptides of seabuckthorn (Hippophae rhamnoides L.) seed meal. Food Innovation and Advances 3(3): 295−304 doi: 10.48130/fia-0024-0029
    Zheng Y, Wang D, Zhou Y, Yuen M, Yuen T, et al. 2024. Characterization and angiotensin-converting enzyme inhibitory activity of peptides of seabuckthorn (Hippophae rhamnoides L.) seed meal. Food Innovation and Advances 3(3): 295−304 doi: 10.48130/fia-0024-0029

Catalog

  • About this article

/

DownLoad:  Full-Size Img  PowerPoint
Return
Return