-
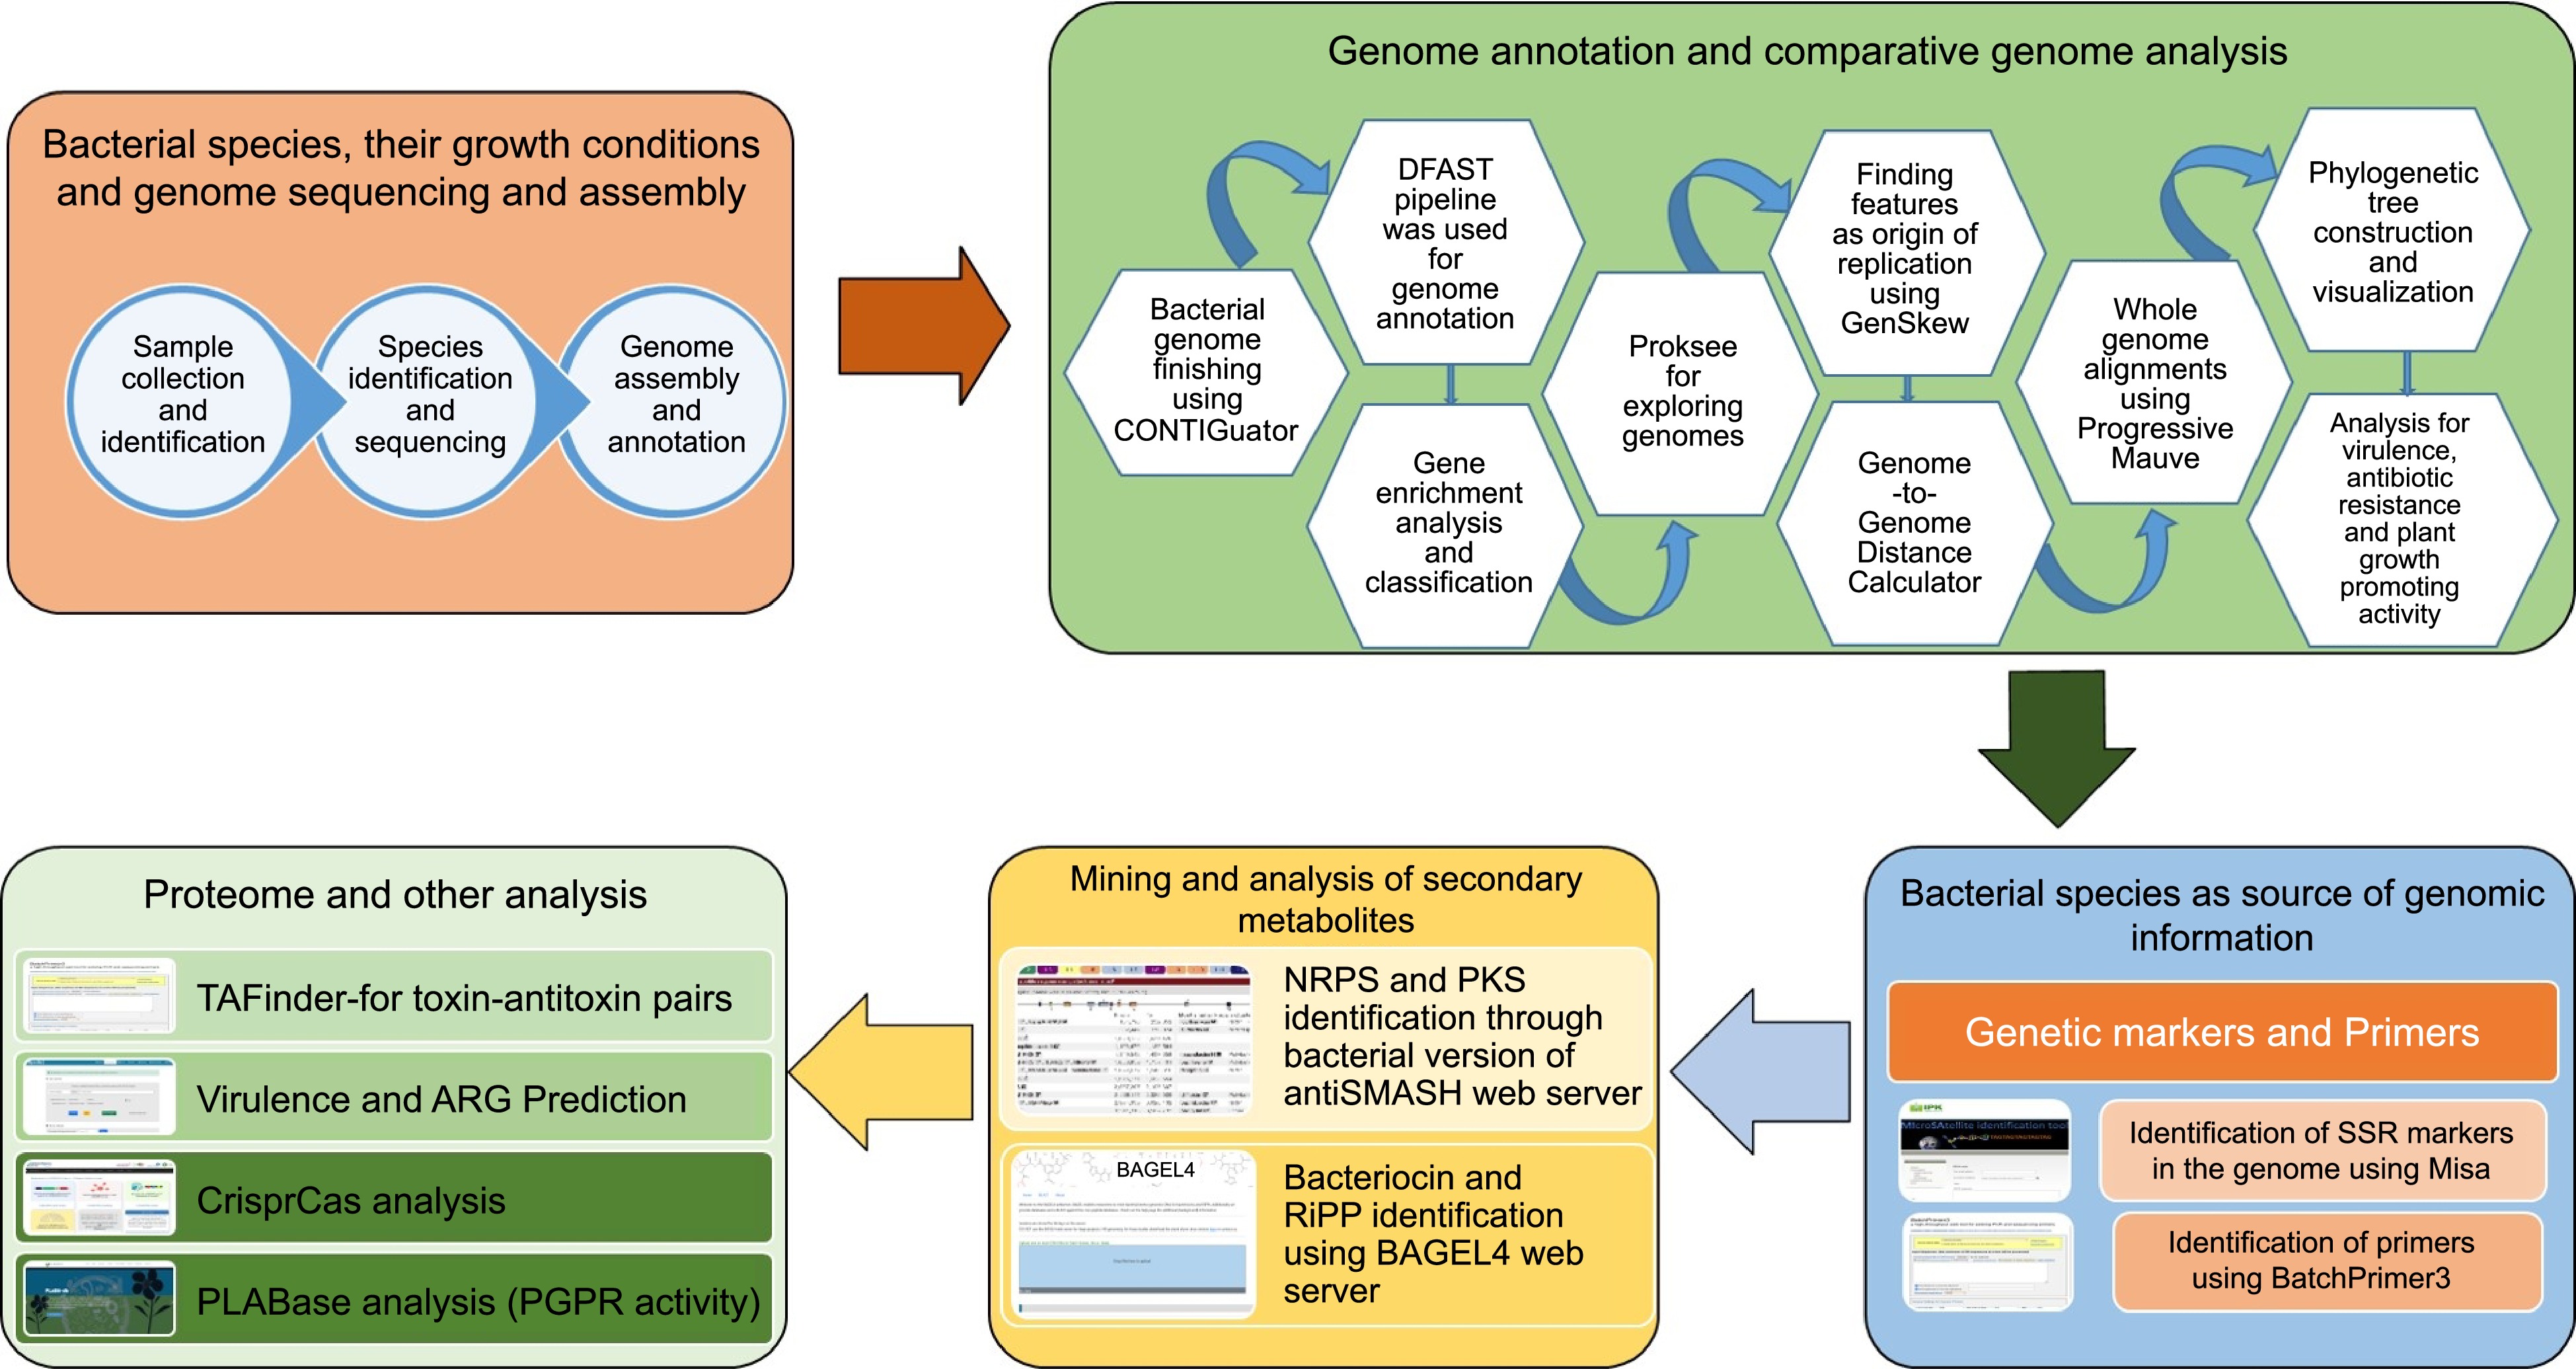
Figure 1.
Overall workflow of the BIK2, BIK3, and BIK3 analysis.
-
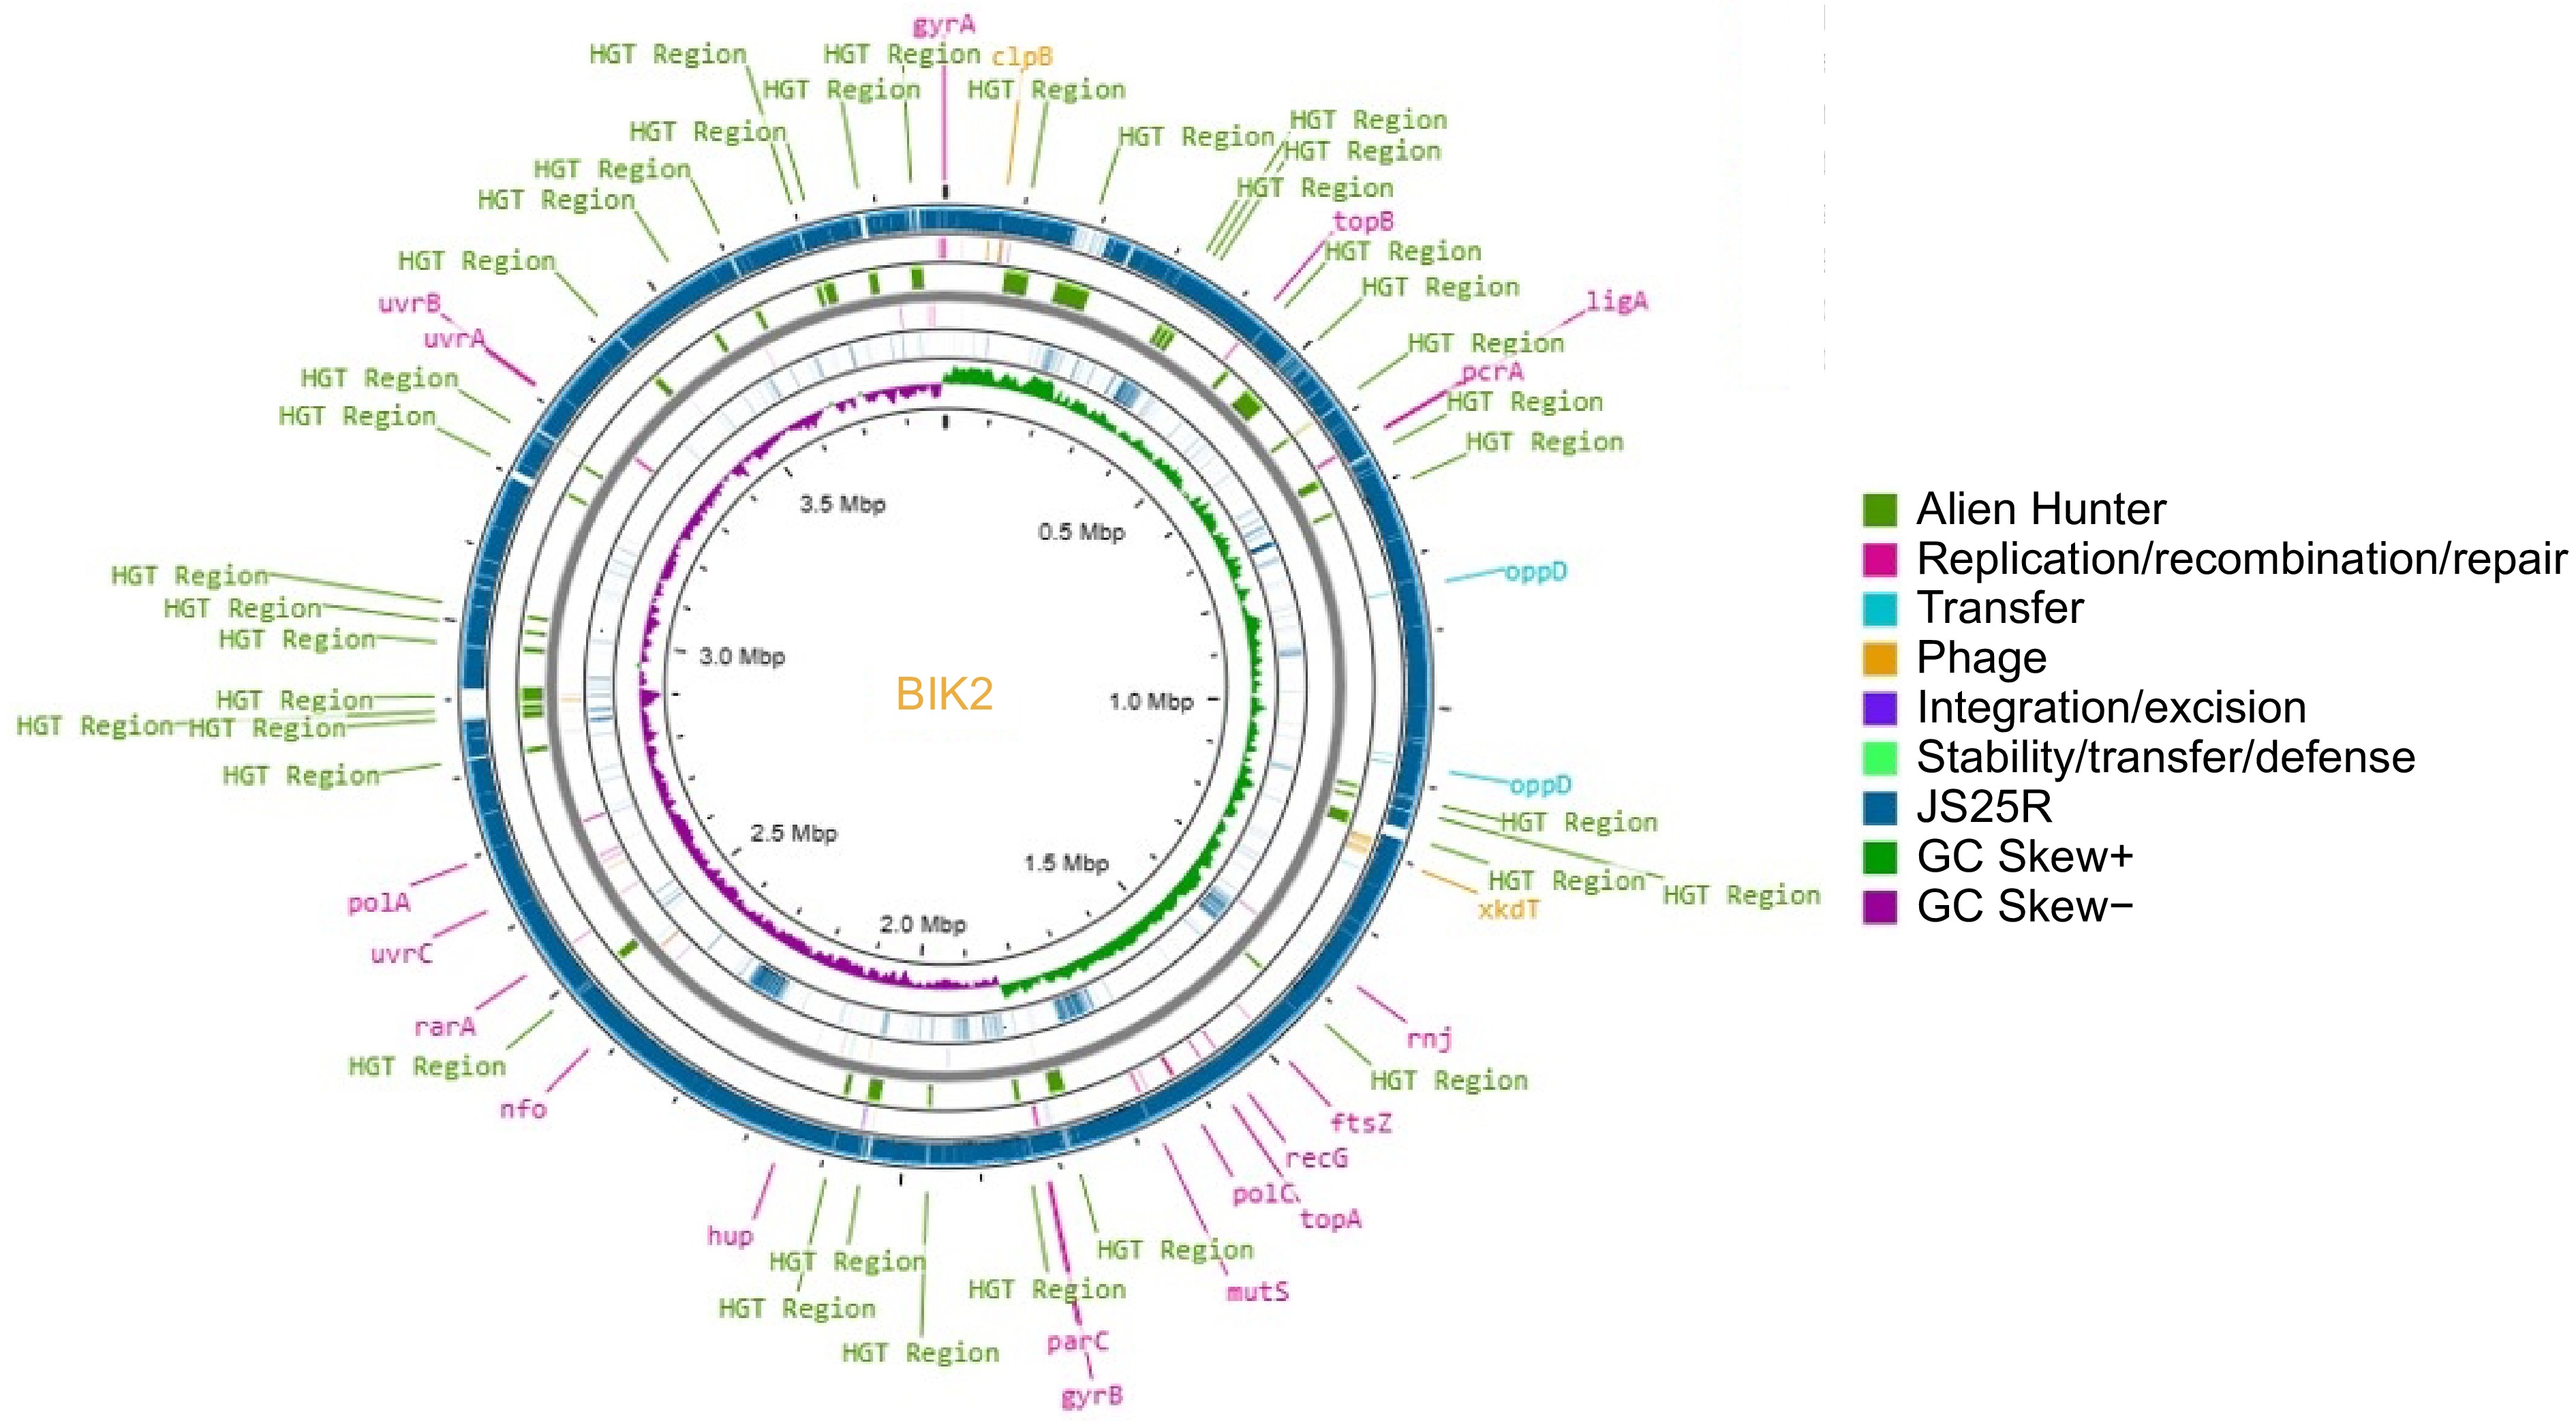
Figure 2.
Circular representation of BIK2 genome (innermost ring) along with reference genome B. velezensis JS25R. Putative Horizontal Gene Transfer (HGT) events were Predicted using Alien Hunter and are represented in green. The reference genome JSR is presented in teal, GC skew+ in green, and GC screw− in purple. Legends of genes in yellow represent the prophage genes, mustard yellow represent transfer-related mobile elements. Pink legends are for replication/recombination/repair genes, likewise.
-
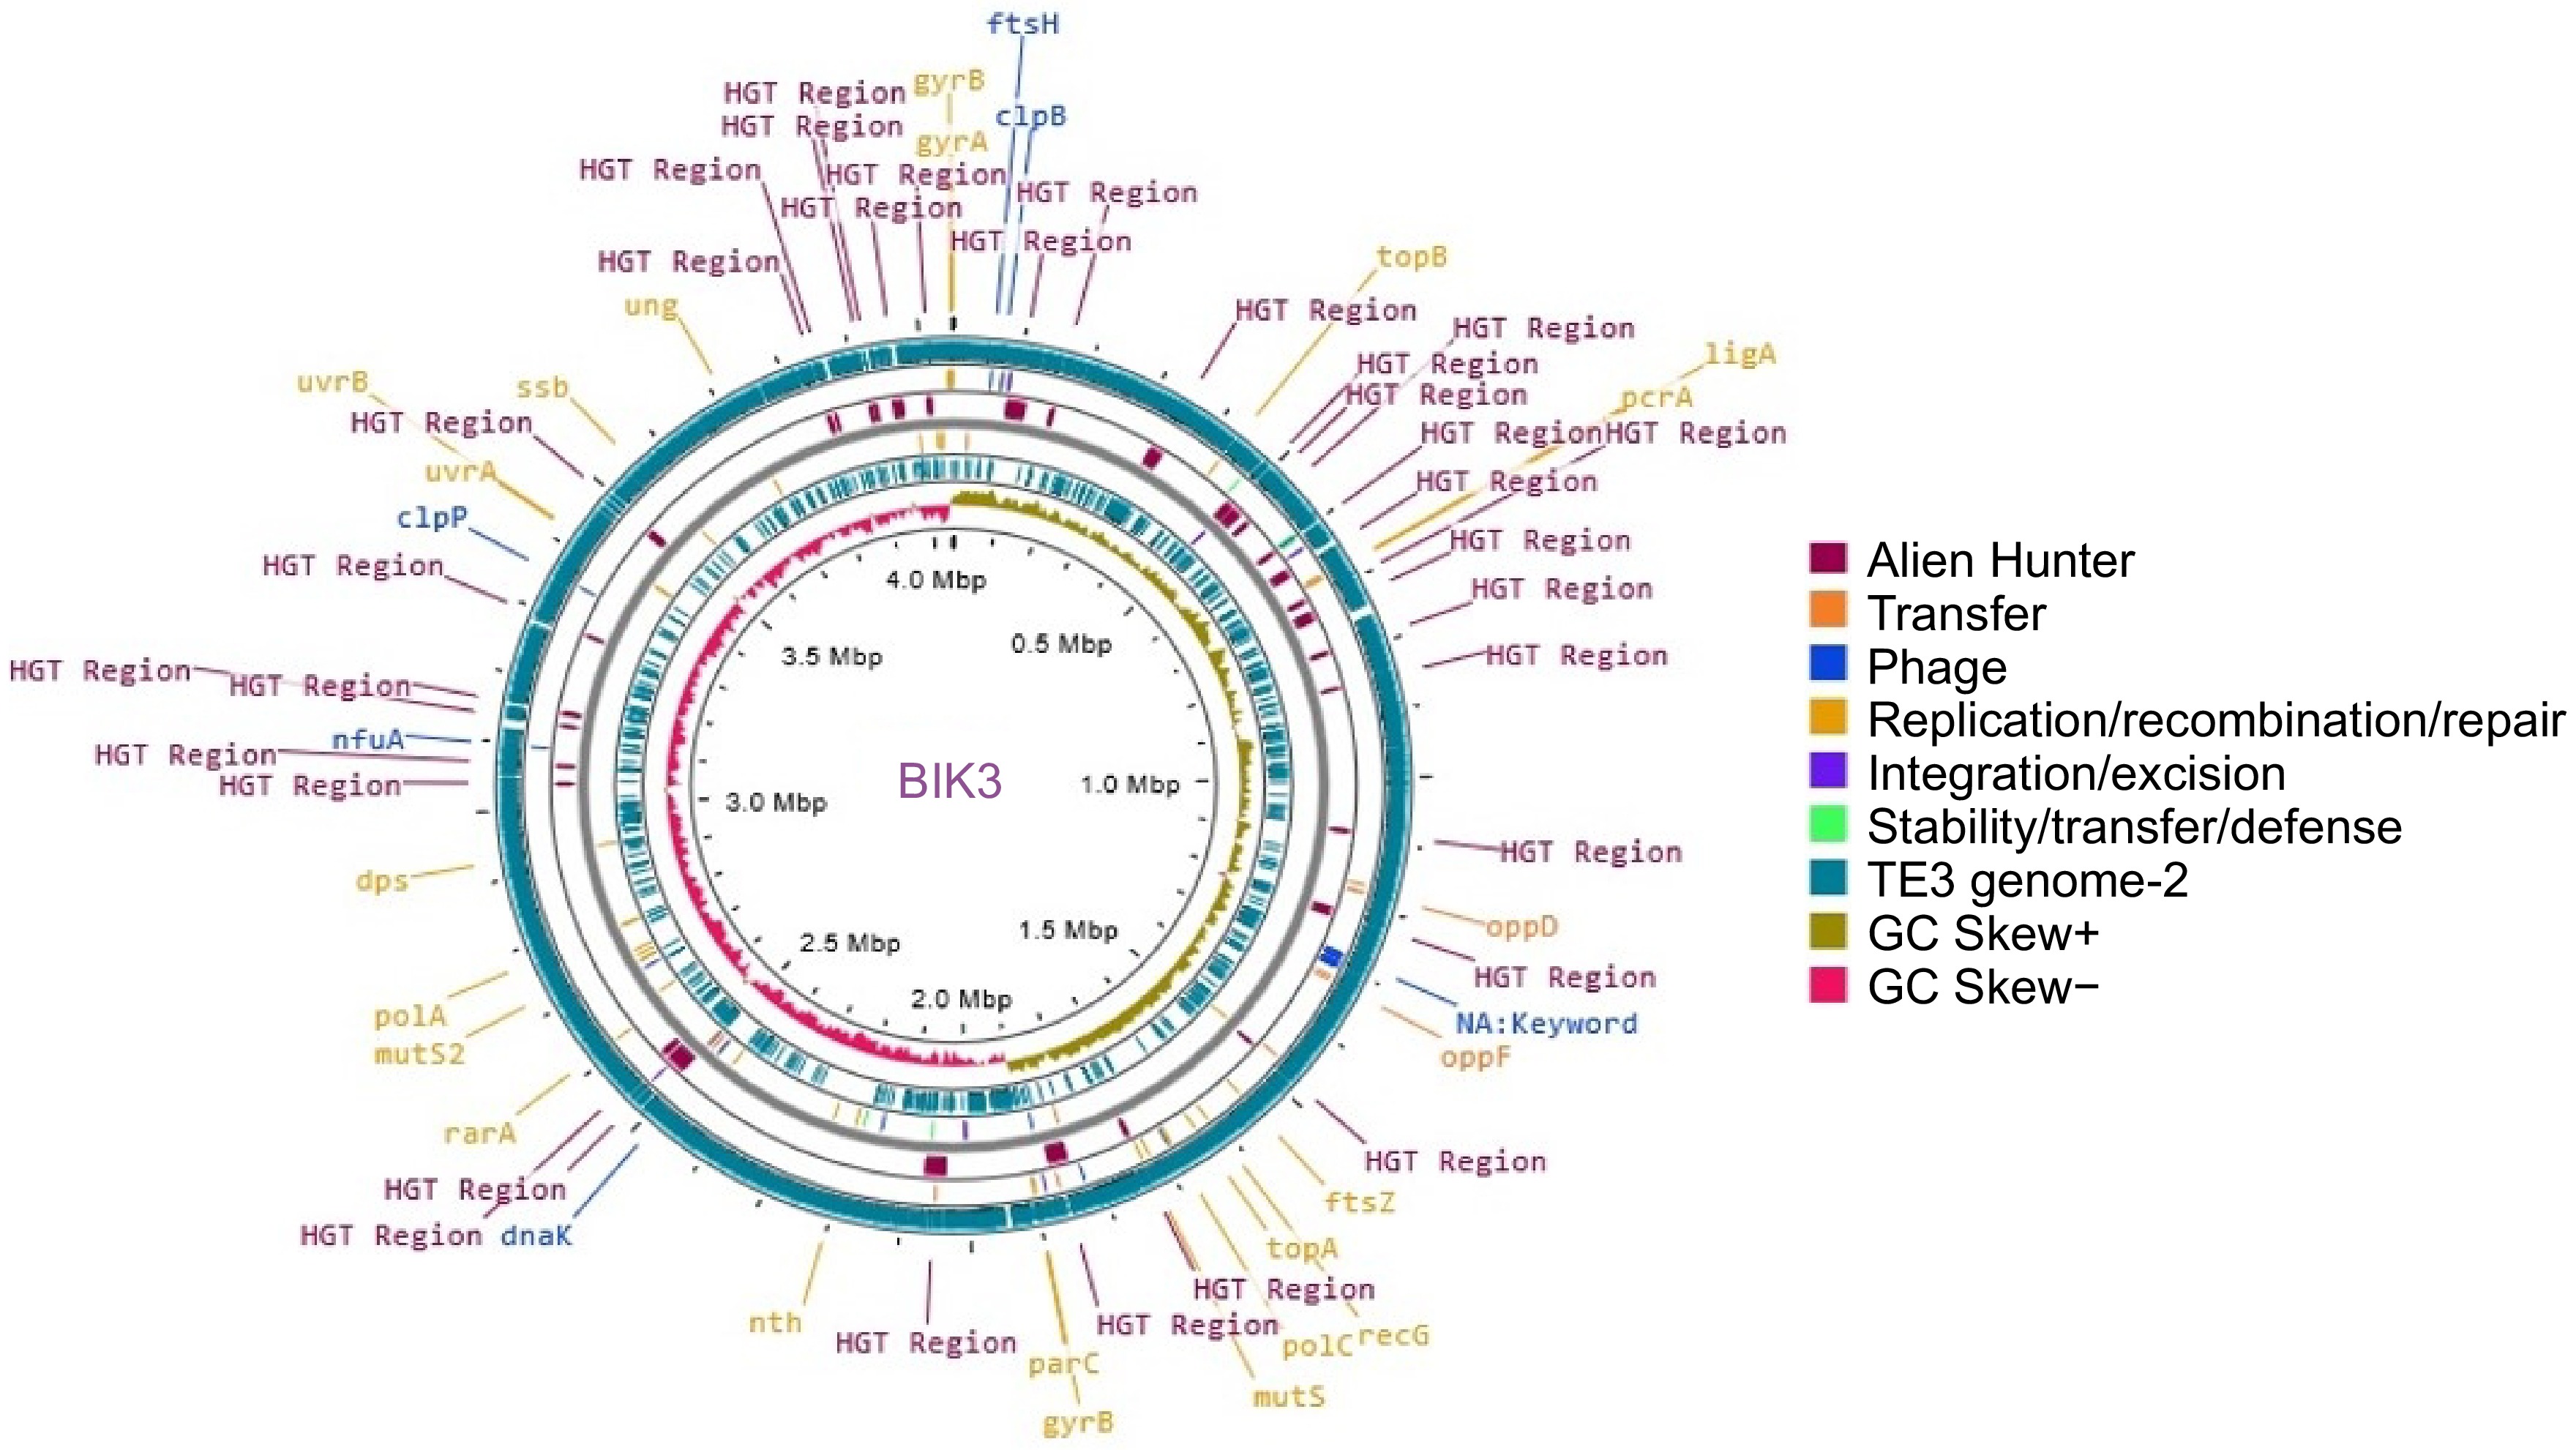
Figure 3.
Circular representation of BIK3 (innermost ring) along with reference genome B. cabrialesii TE3. Putative Horizontal Gene Transfer (HGT) events were predicted using Alien Hunter and are represented in maroon. The reference genome TE3 is presented in teal, with GC skew, and mobile genetic elements.
-
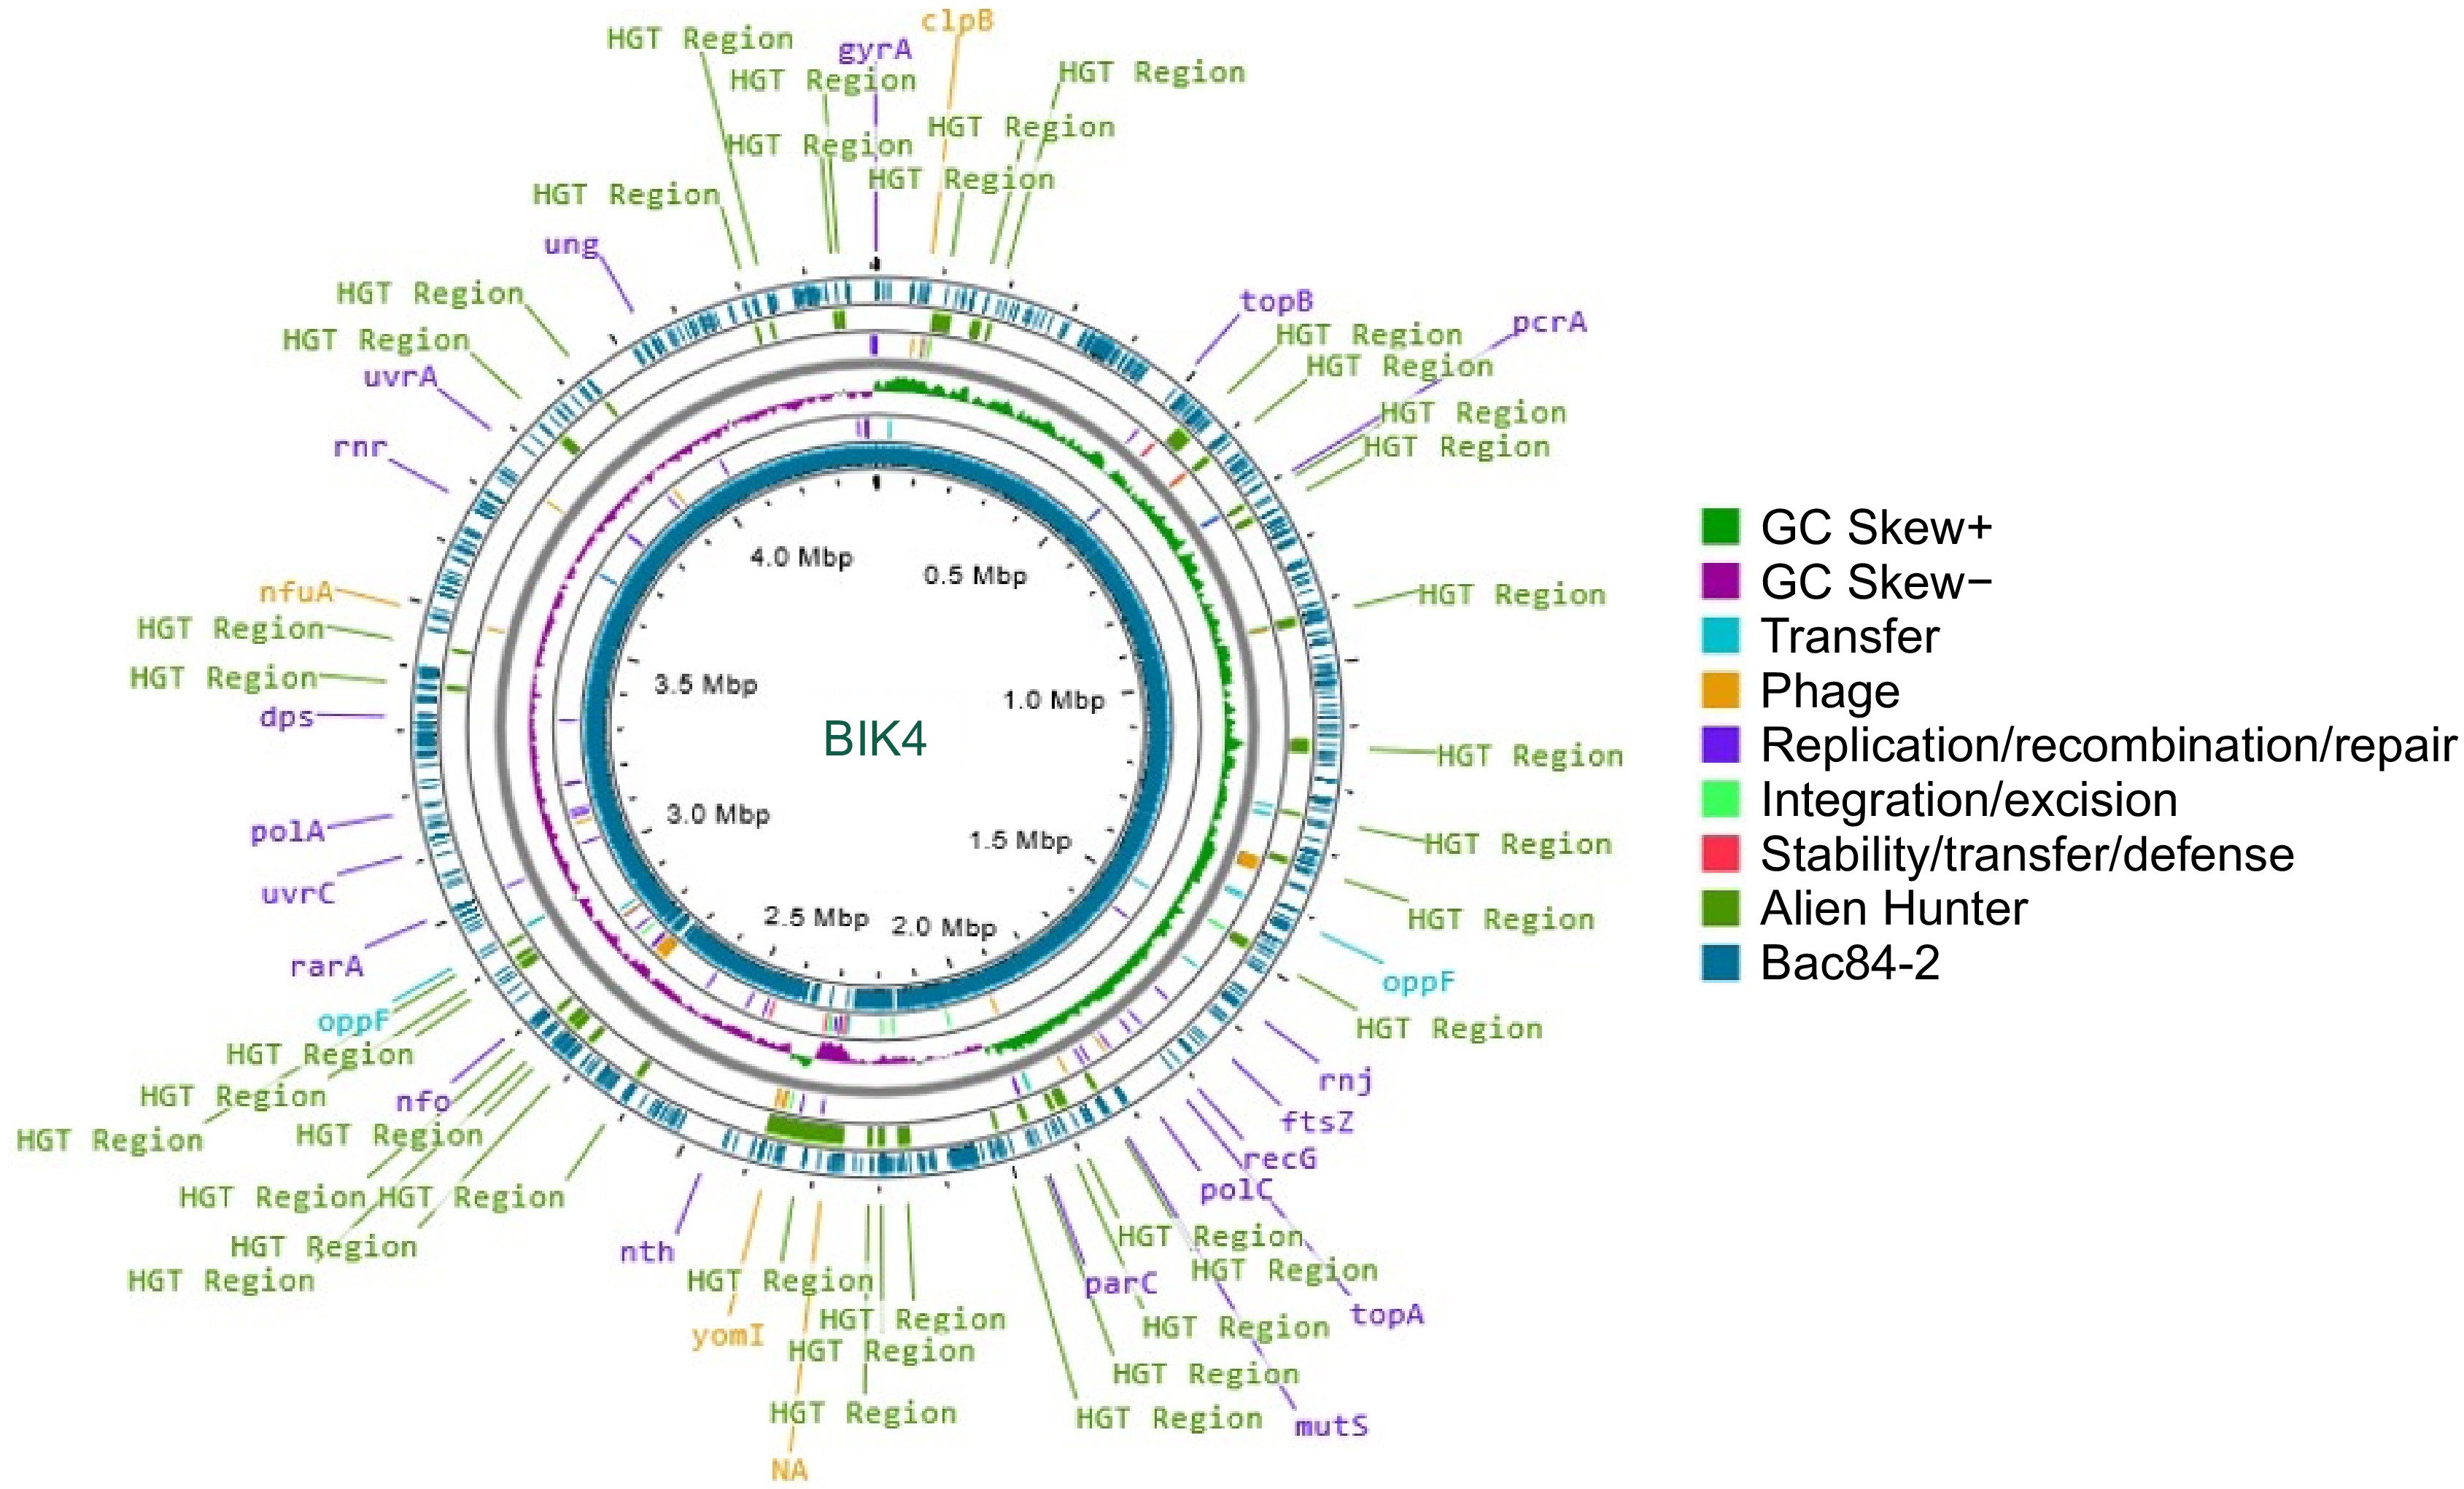
Figure 4.
Circular representation of BIK4 (innermost ring) along with reference genome B. paralicheniformis Bac84. Putative Horizontal Gene Transfer (HGT) events were predicted using Alien Hunter and are represented in green and prophage genes in yellow. The reference genome Bac84 is presented in teal, with GC skew, and mobile genetic elements.
-
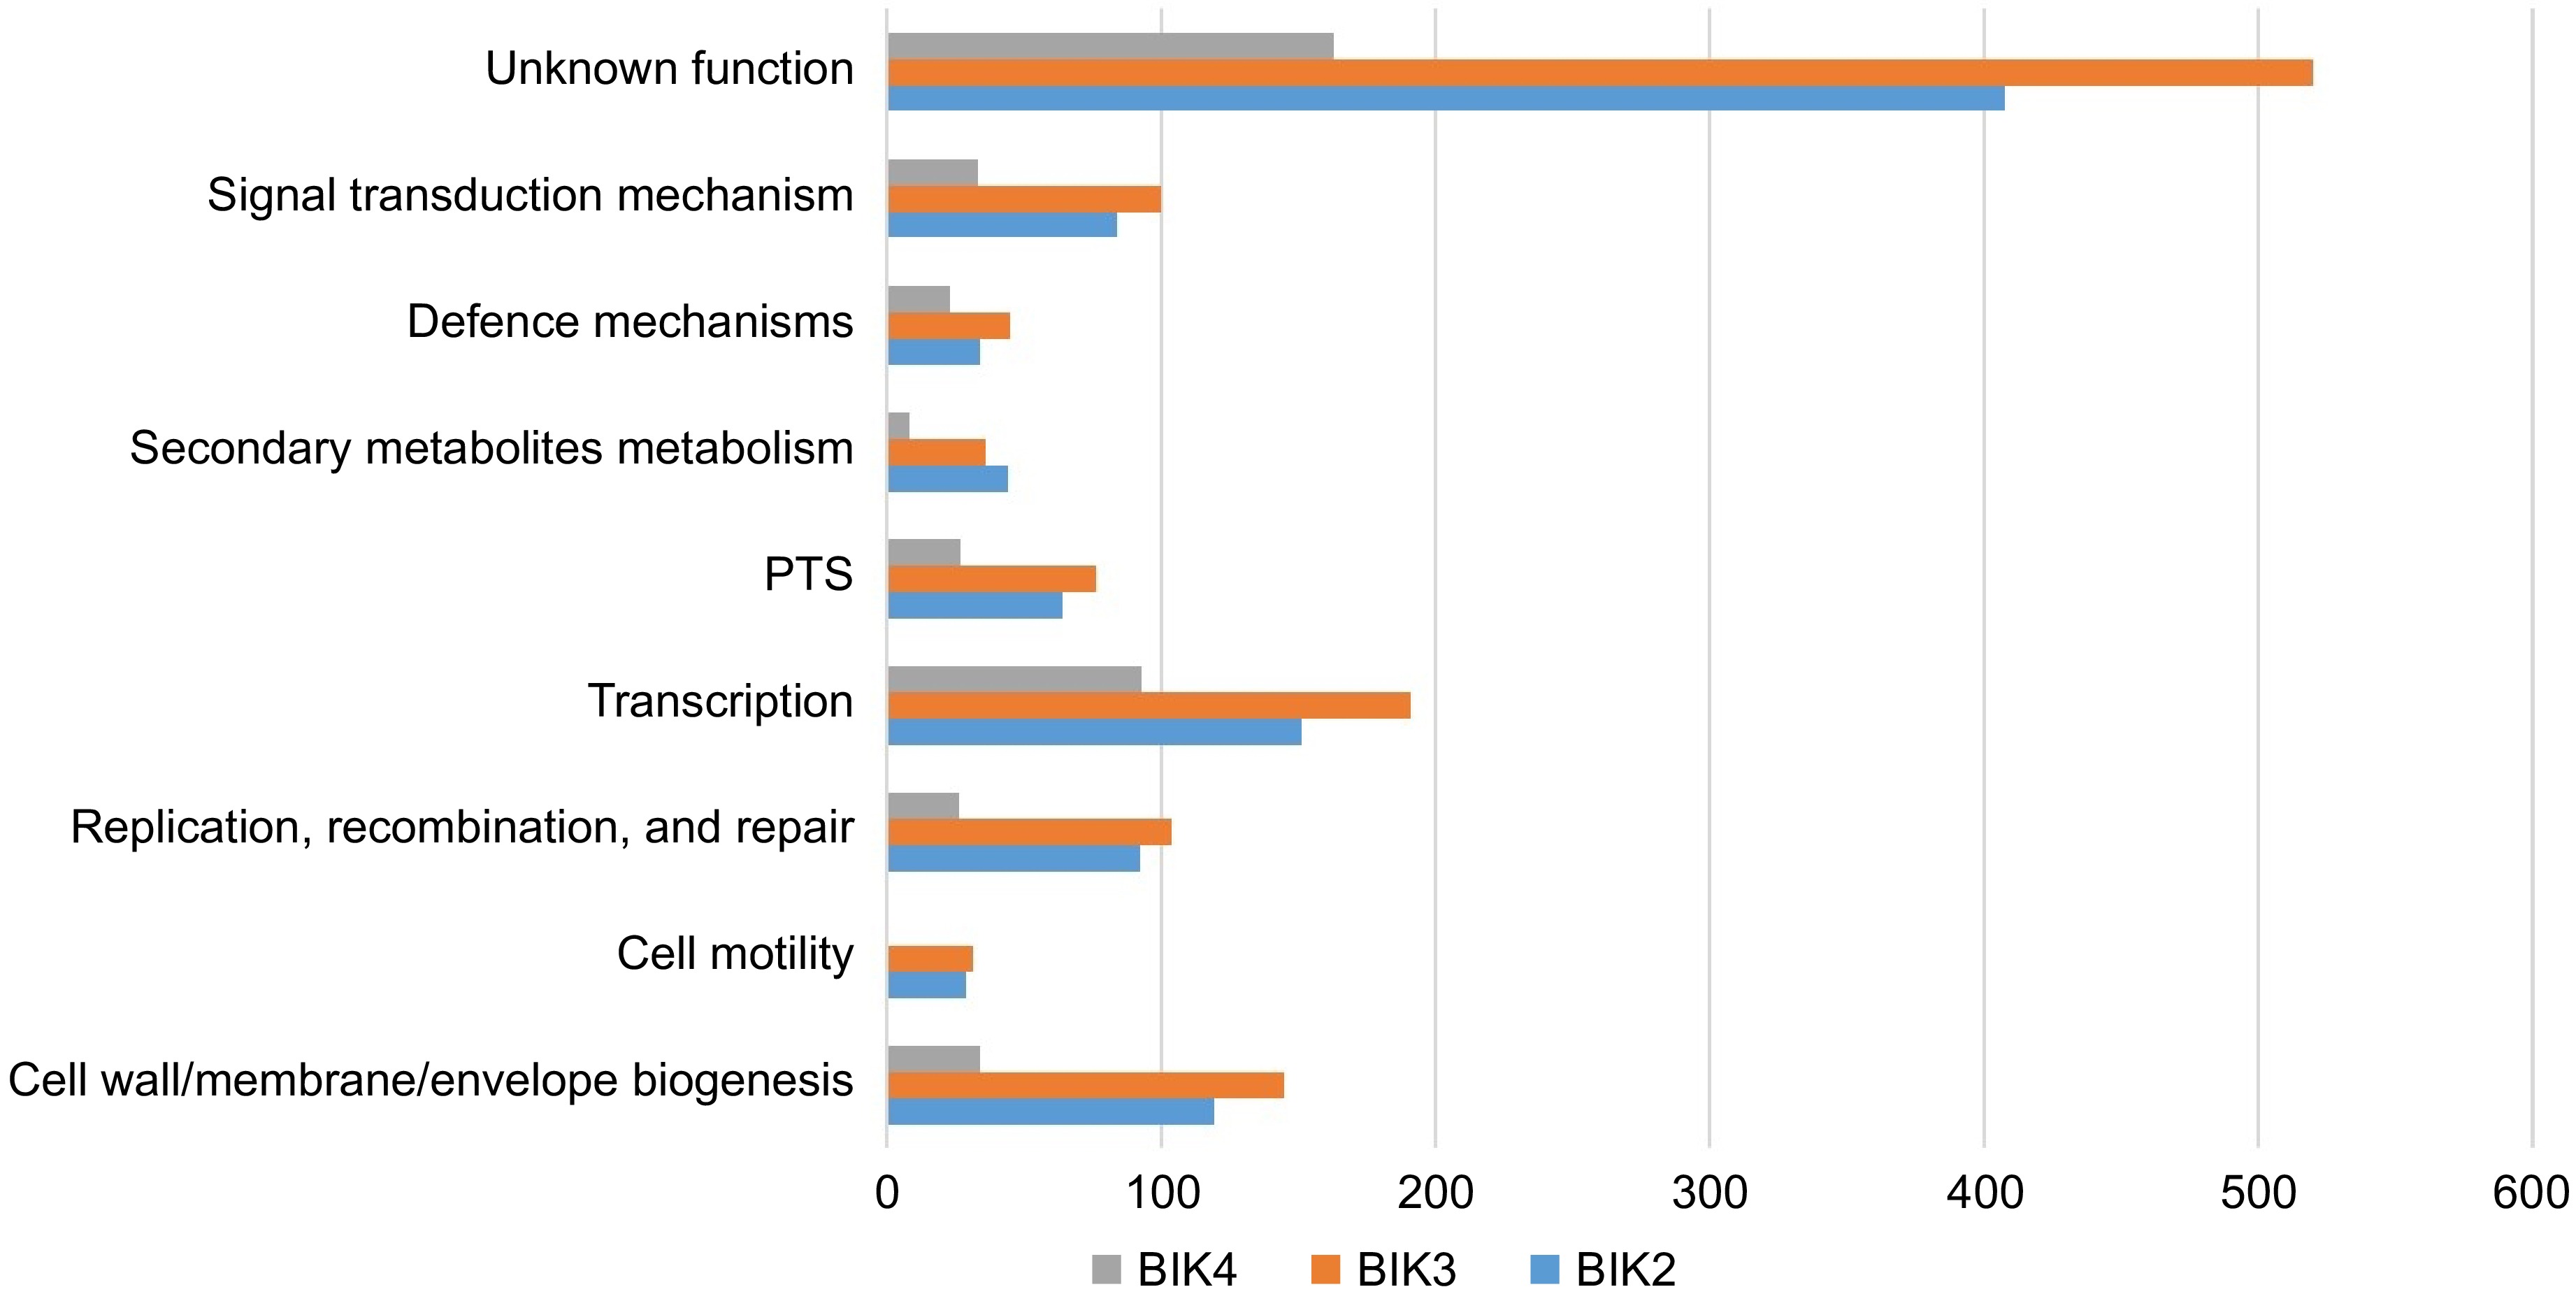
Figure 5.
Comparative analysis of BIK2, BIK3, and BIK4 major classes of proteins involved in different processes. PTS-post-translational modifications, protein turnover, and chaperones (bar diagram), shows the classification of BIK2, BIK3, and BIK4 proteins under some of the major processes.
-
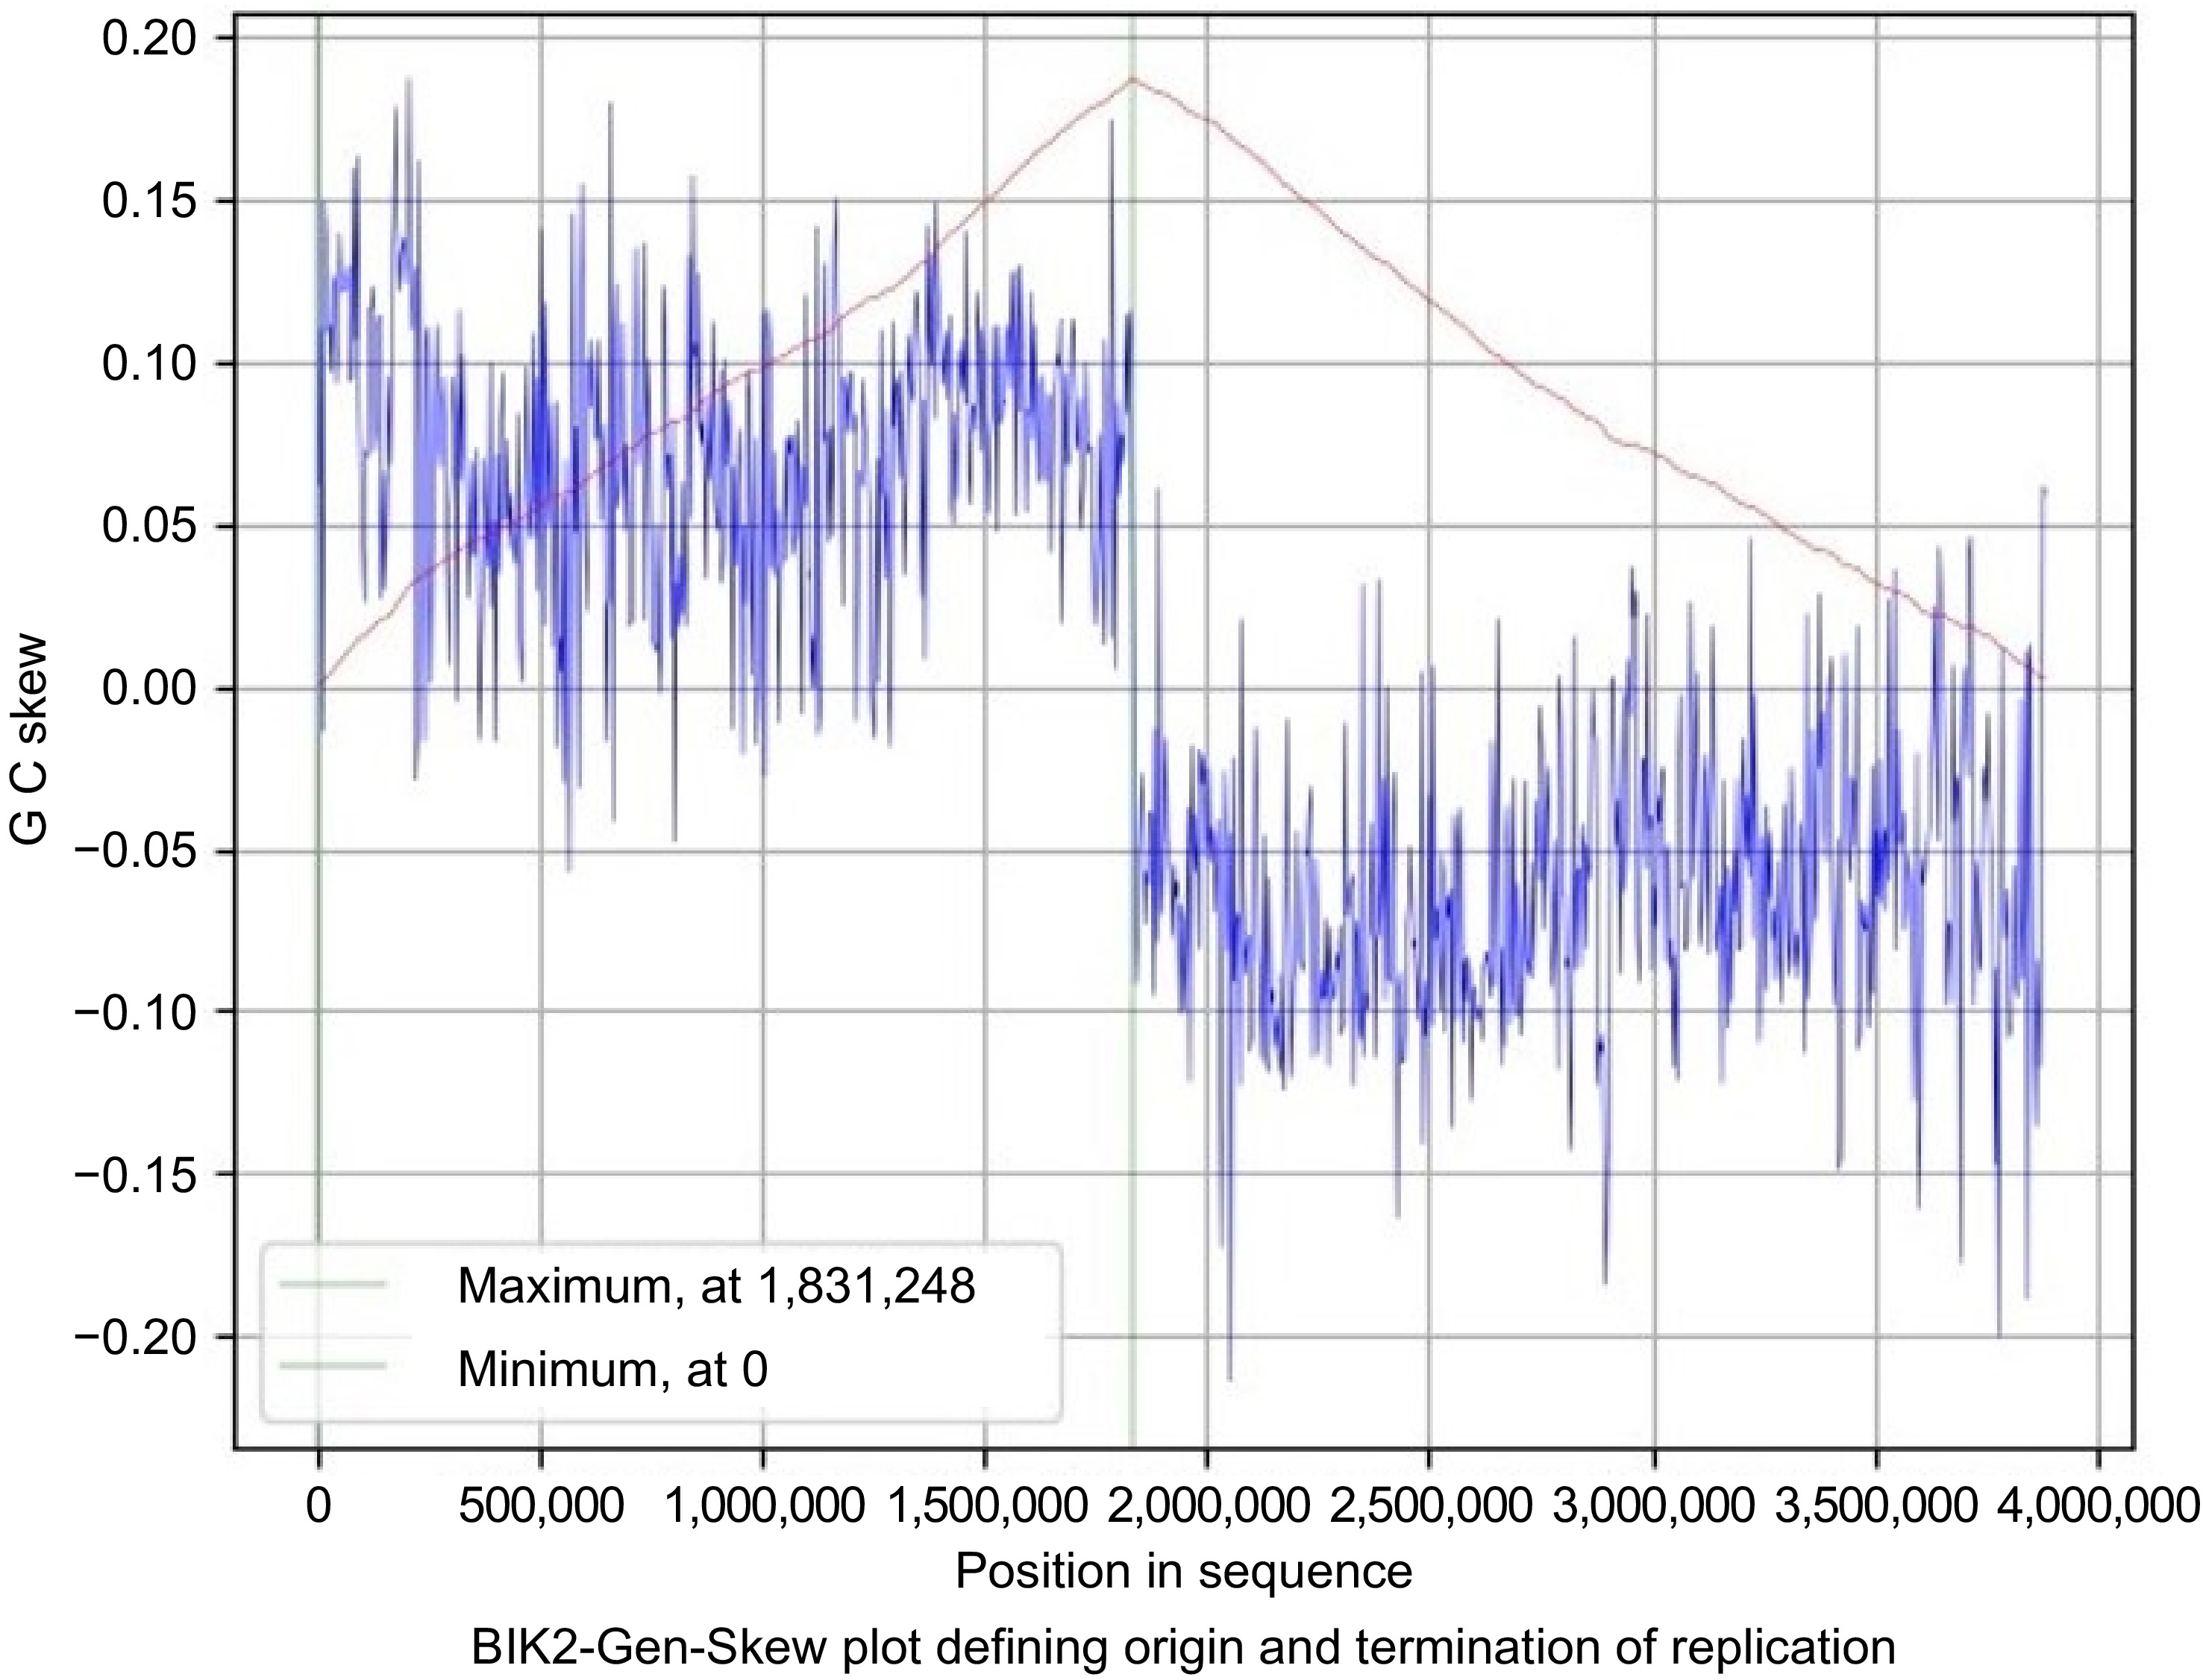
Figure 6.
Gen-Skew: predicting the origin of replication for BIK2. The above figure shows the cumulative line in red and the skew line in blue, with minimum as origin of replication and maximum as termination of replication. X-axis denotes the positions in genomes and Y-axis denotes skew. For BIK2, replication starts at 0 position and terminates at 1,831,248 position.
-
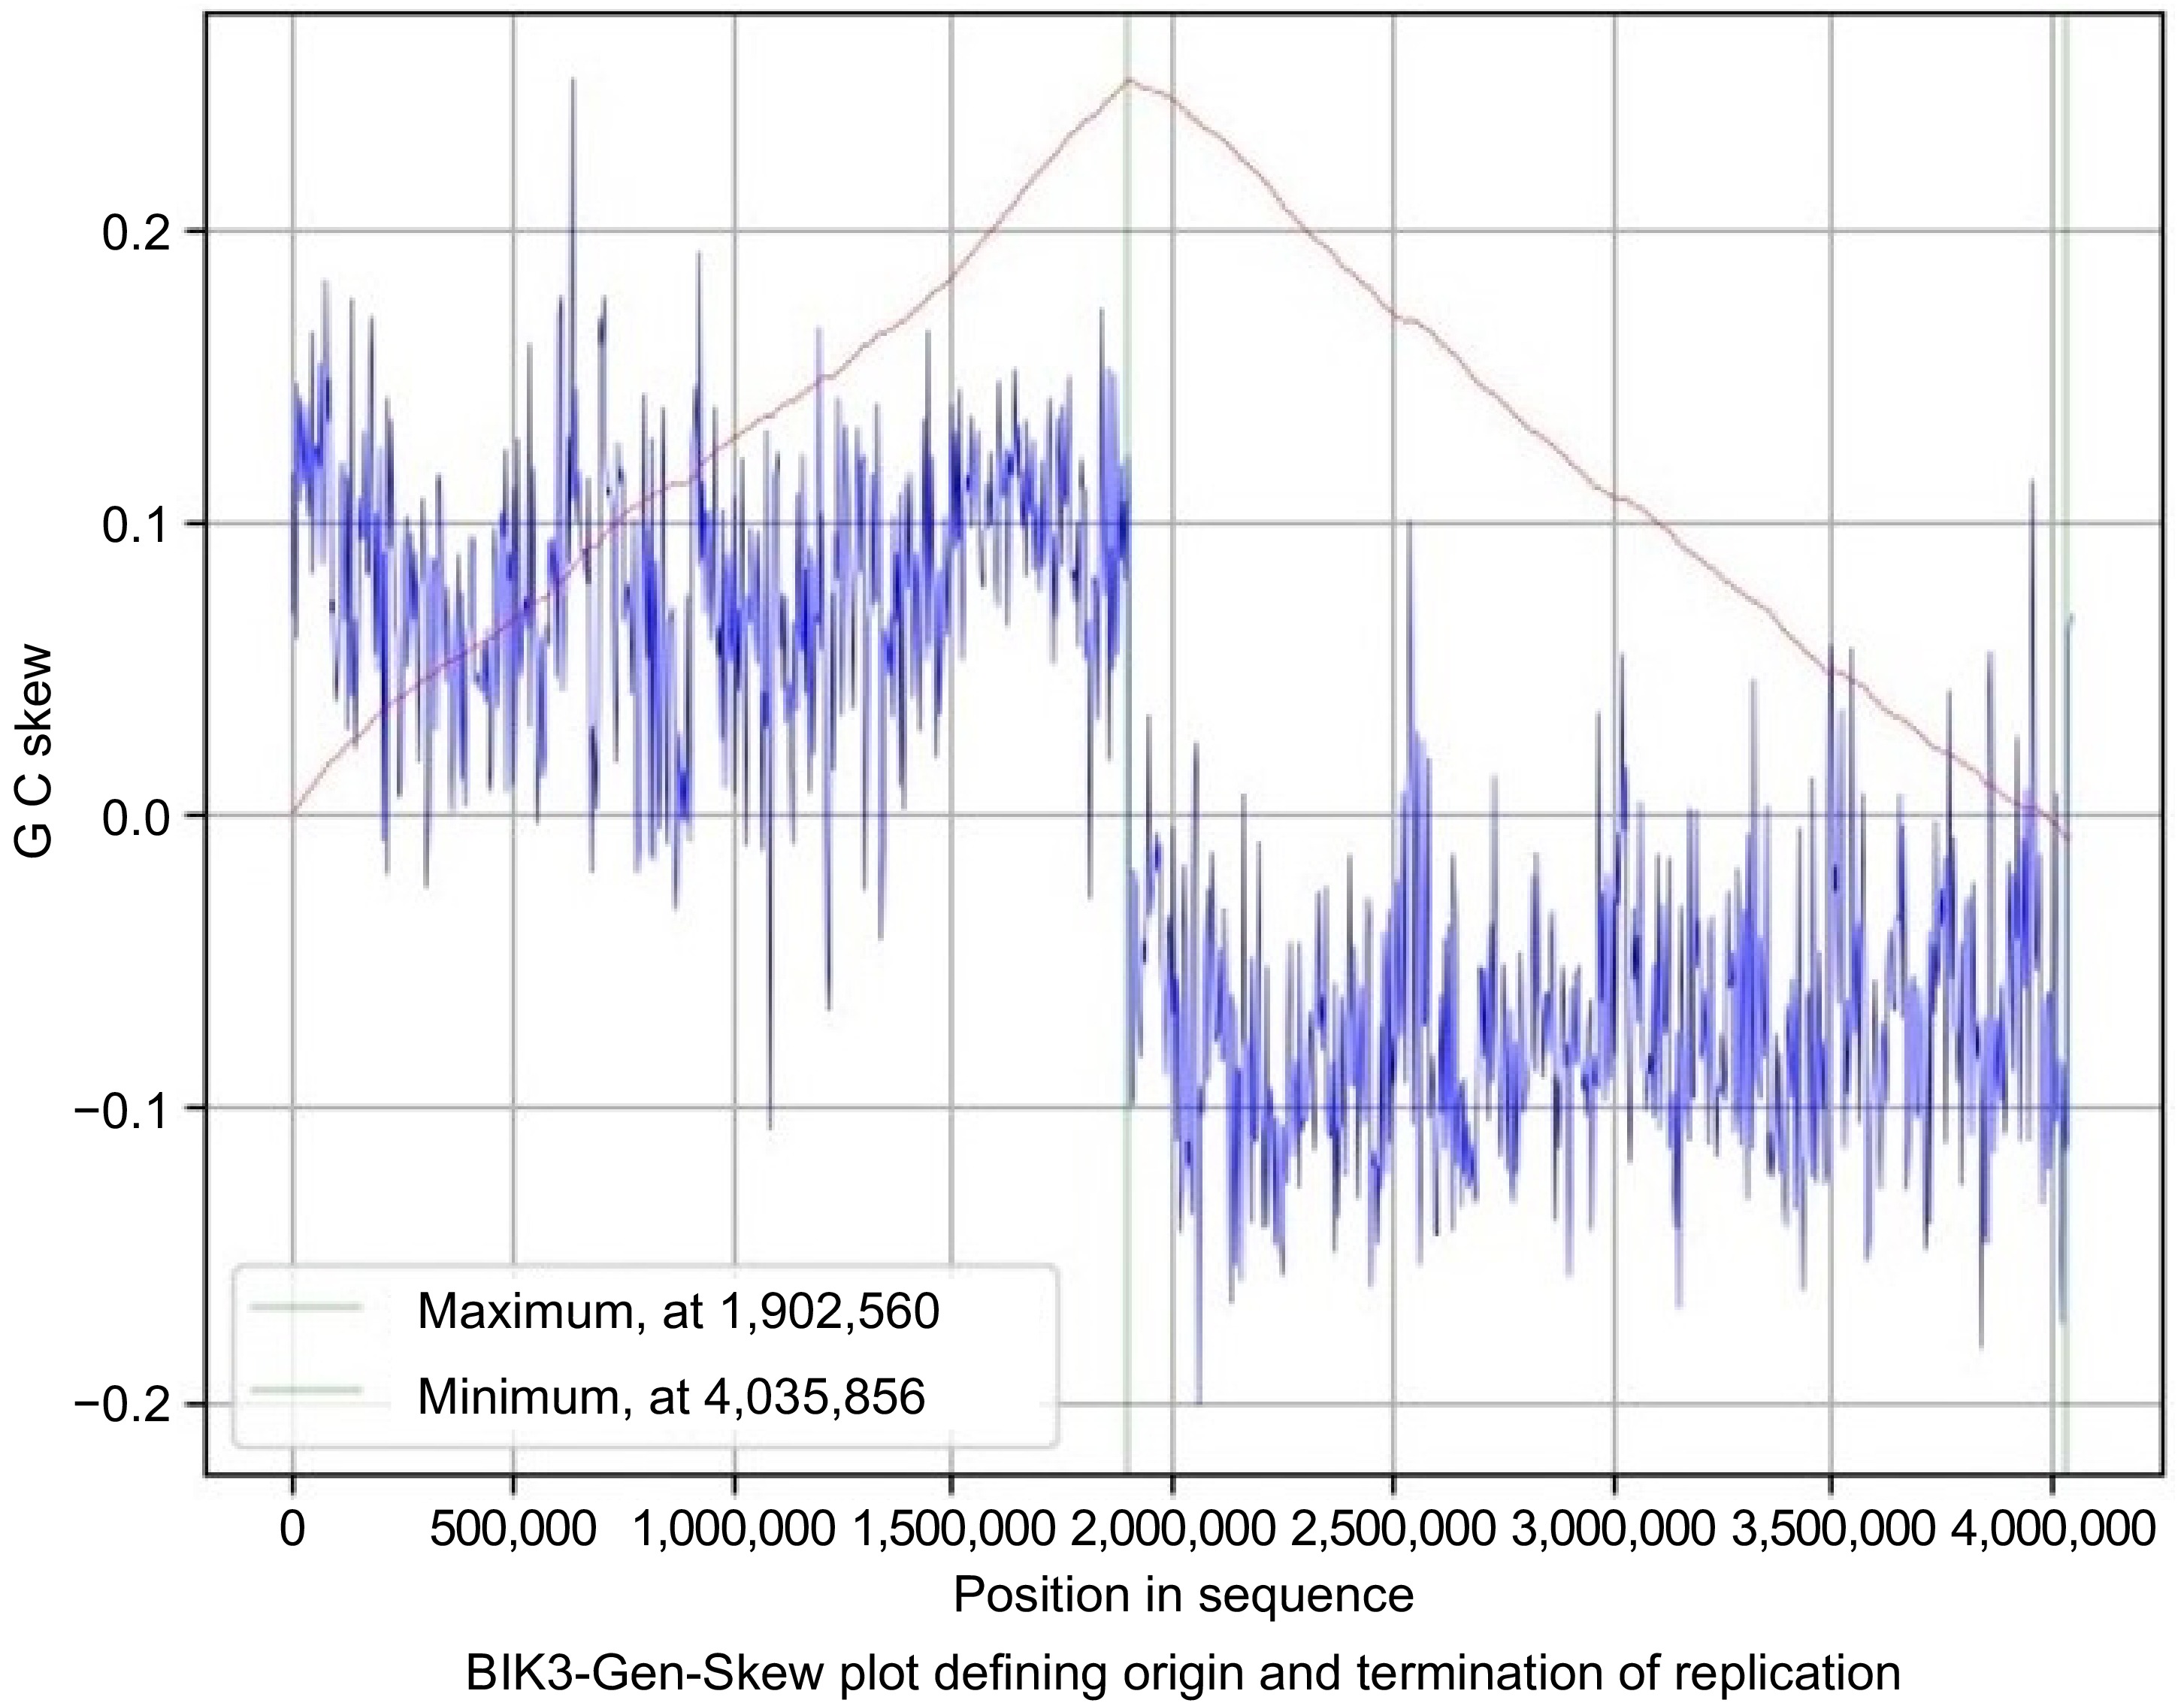
Figure 7.
Gen-Skew: predicting the origin of replication for BIK3. The above figure shows the cumulative line in red and the skew line in blue, with minimum as origin of replication and maximum as termination of replication. X-axis denotes the positions in genomes and Y-axis denotes skew. For BIK3, replication starts at 4,035,856 position and terminates at 1,902,560 position.
-
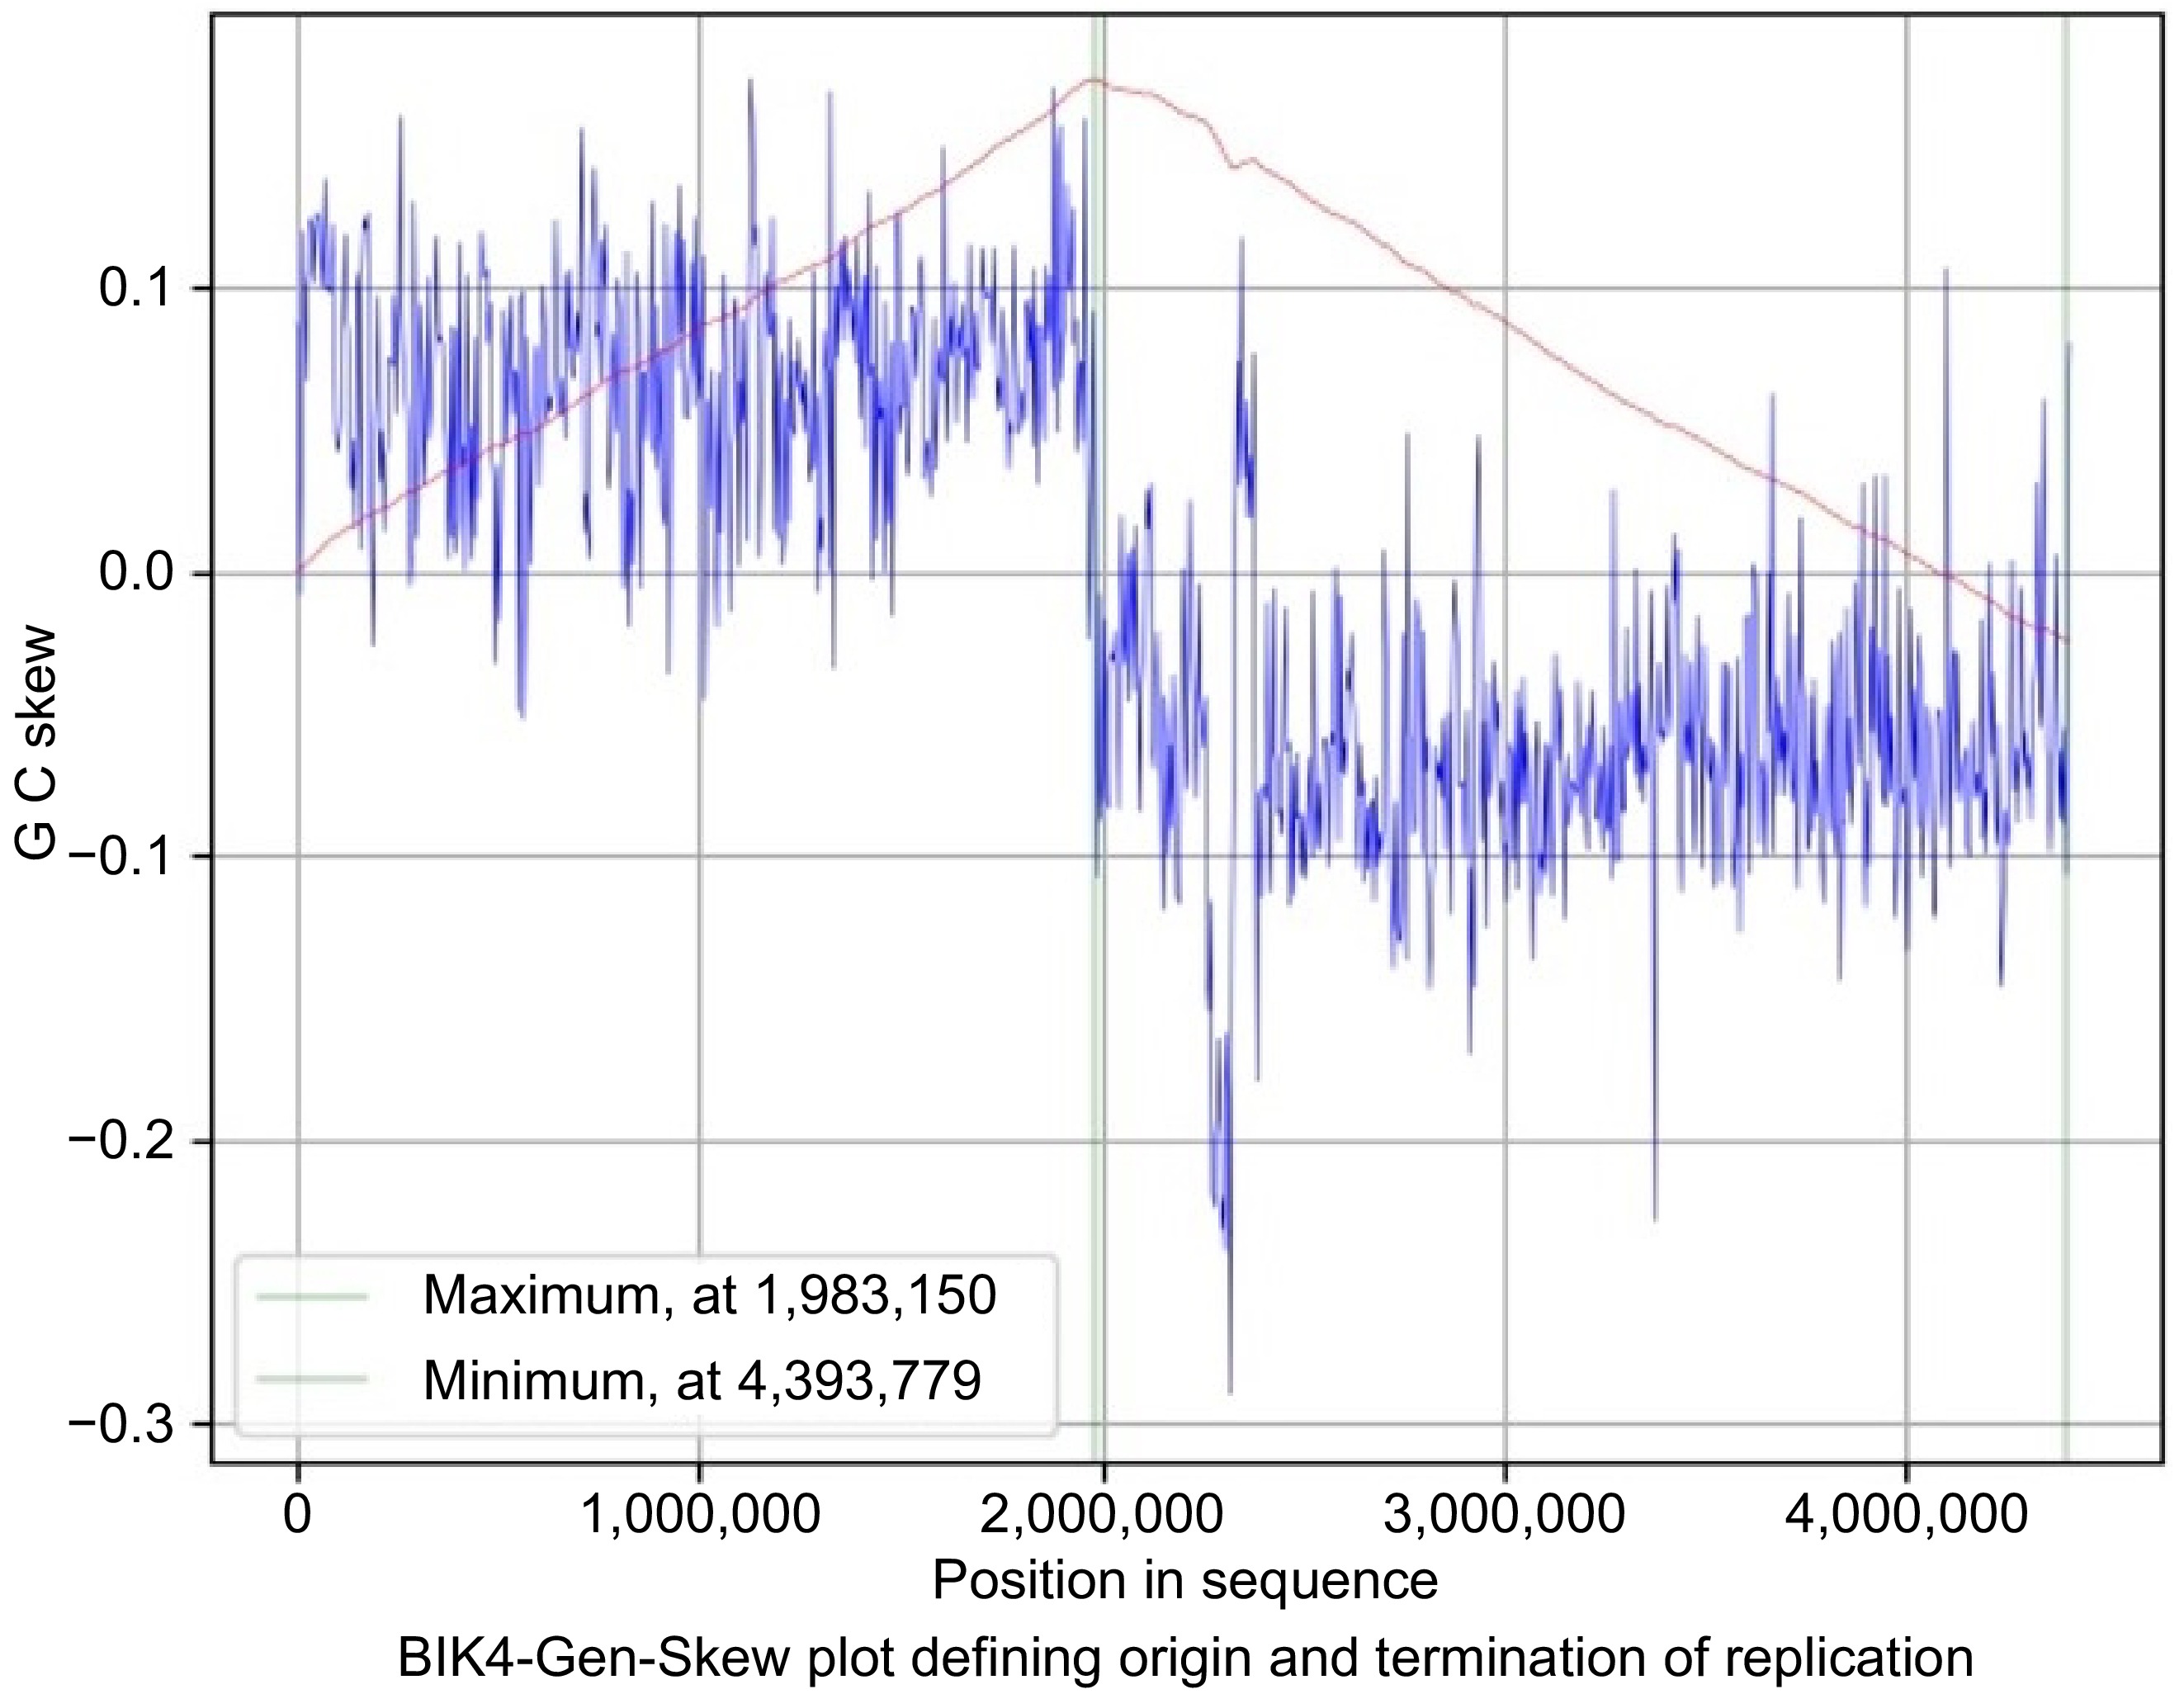
Figure 8.
Gen-Skew: predicting the origin of replication for BIK4. The above figure shows the cumulative line in red and the skew line in blue, with minimum as origin of replication and maximum as termination of replication. X-axis denotes the positions in genomes and Y-axis denotes skew. For BIK4, replication starts at 4,393,779 position and terminates at 1,983,150 position.
-
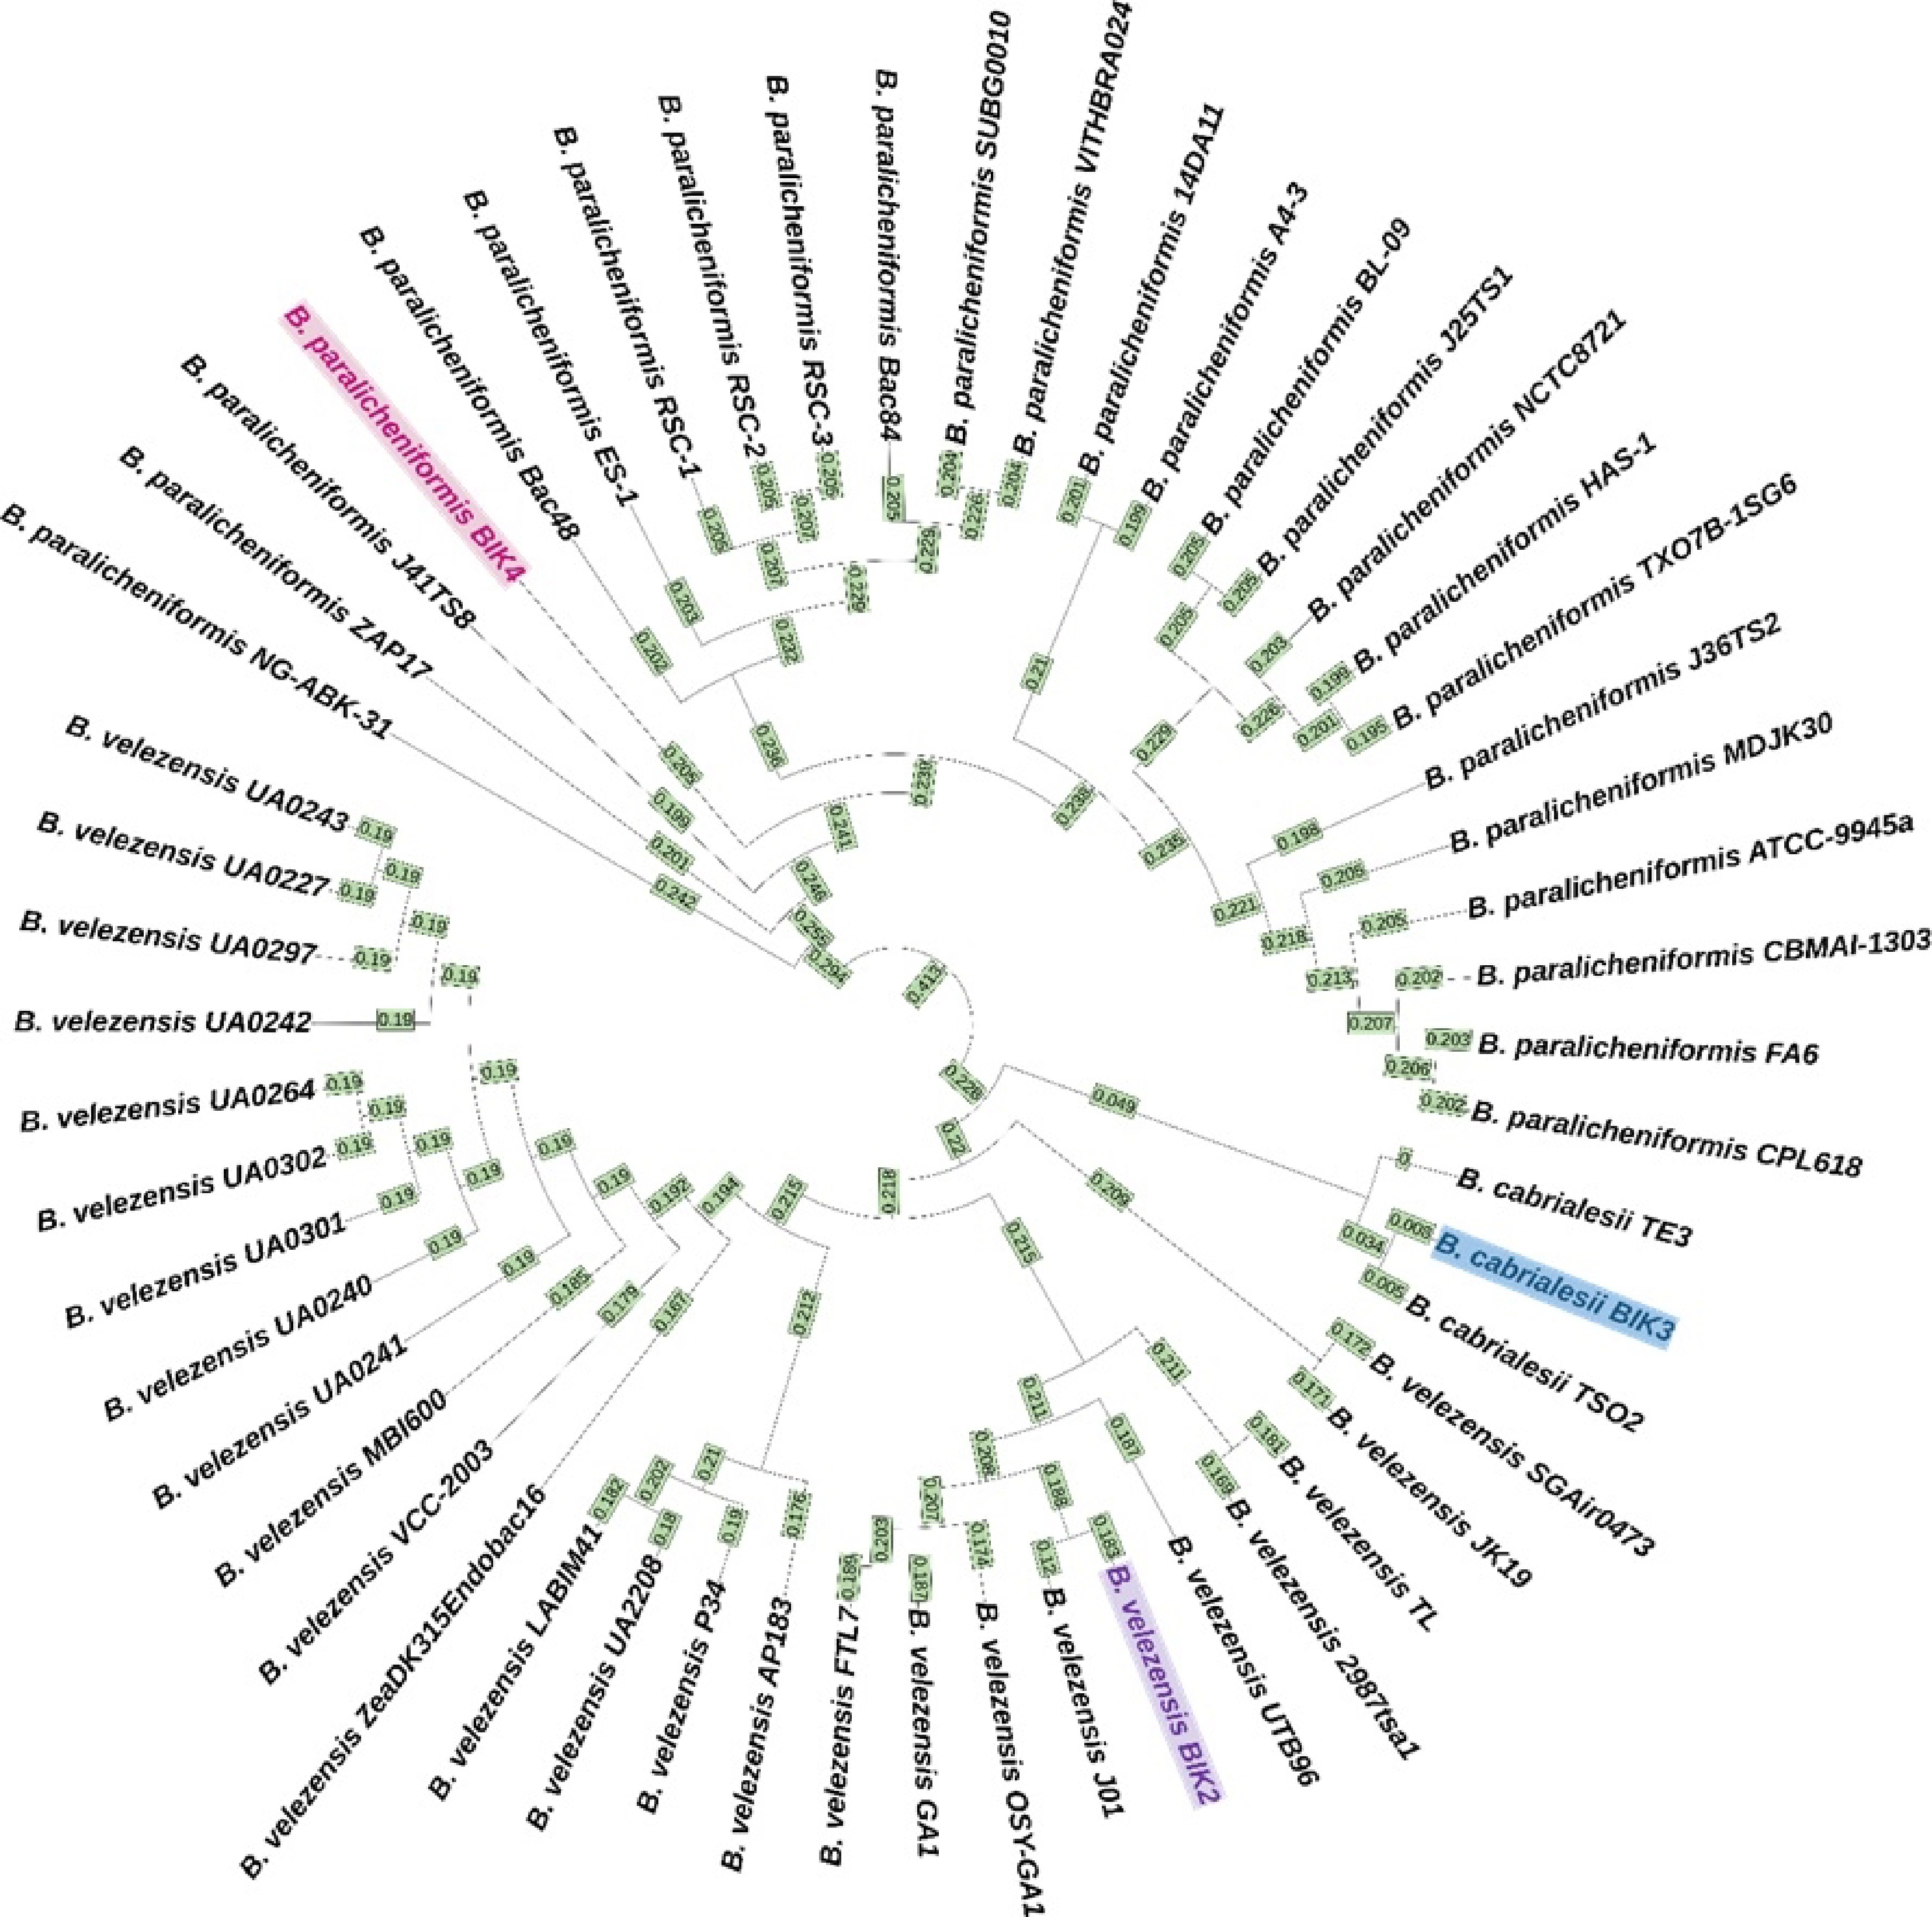
Figure 9.
Whole genome phylogenetic tree of BIK-2, 3 and 4. The tree is generated after whole genome alignment visualized with iTOL version 6.6. The isolates BIK-2, 3 and 4 are highlighted in different colours. Numbers on the branches denote the age of the node instead of raw branch length values. Farthest leaf in the tree has the age zero, and the age increases towards the root of the tree. Here, B. cabrialesii TE3 has node age 0, meaning that it is the farthest node. (The node age is restricted to three decimals).
-
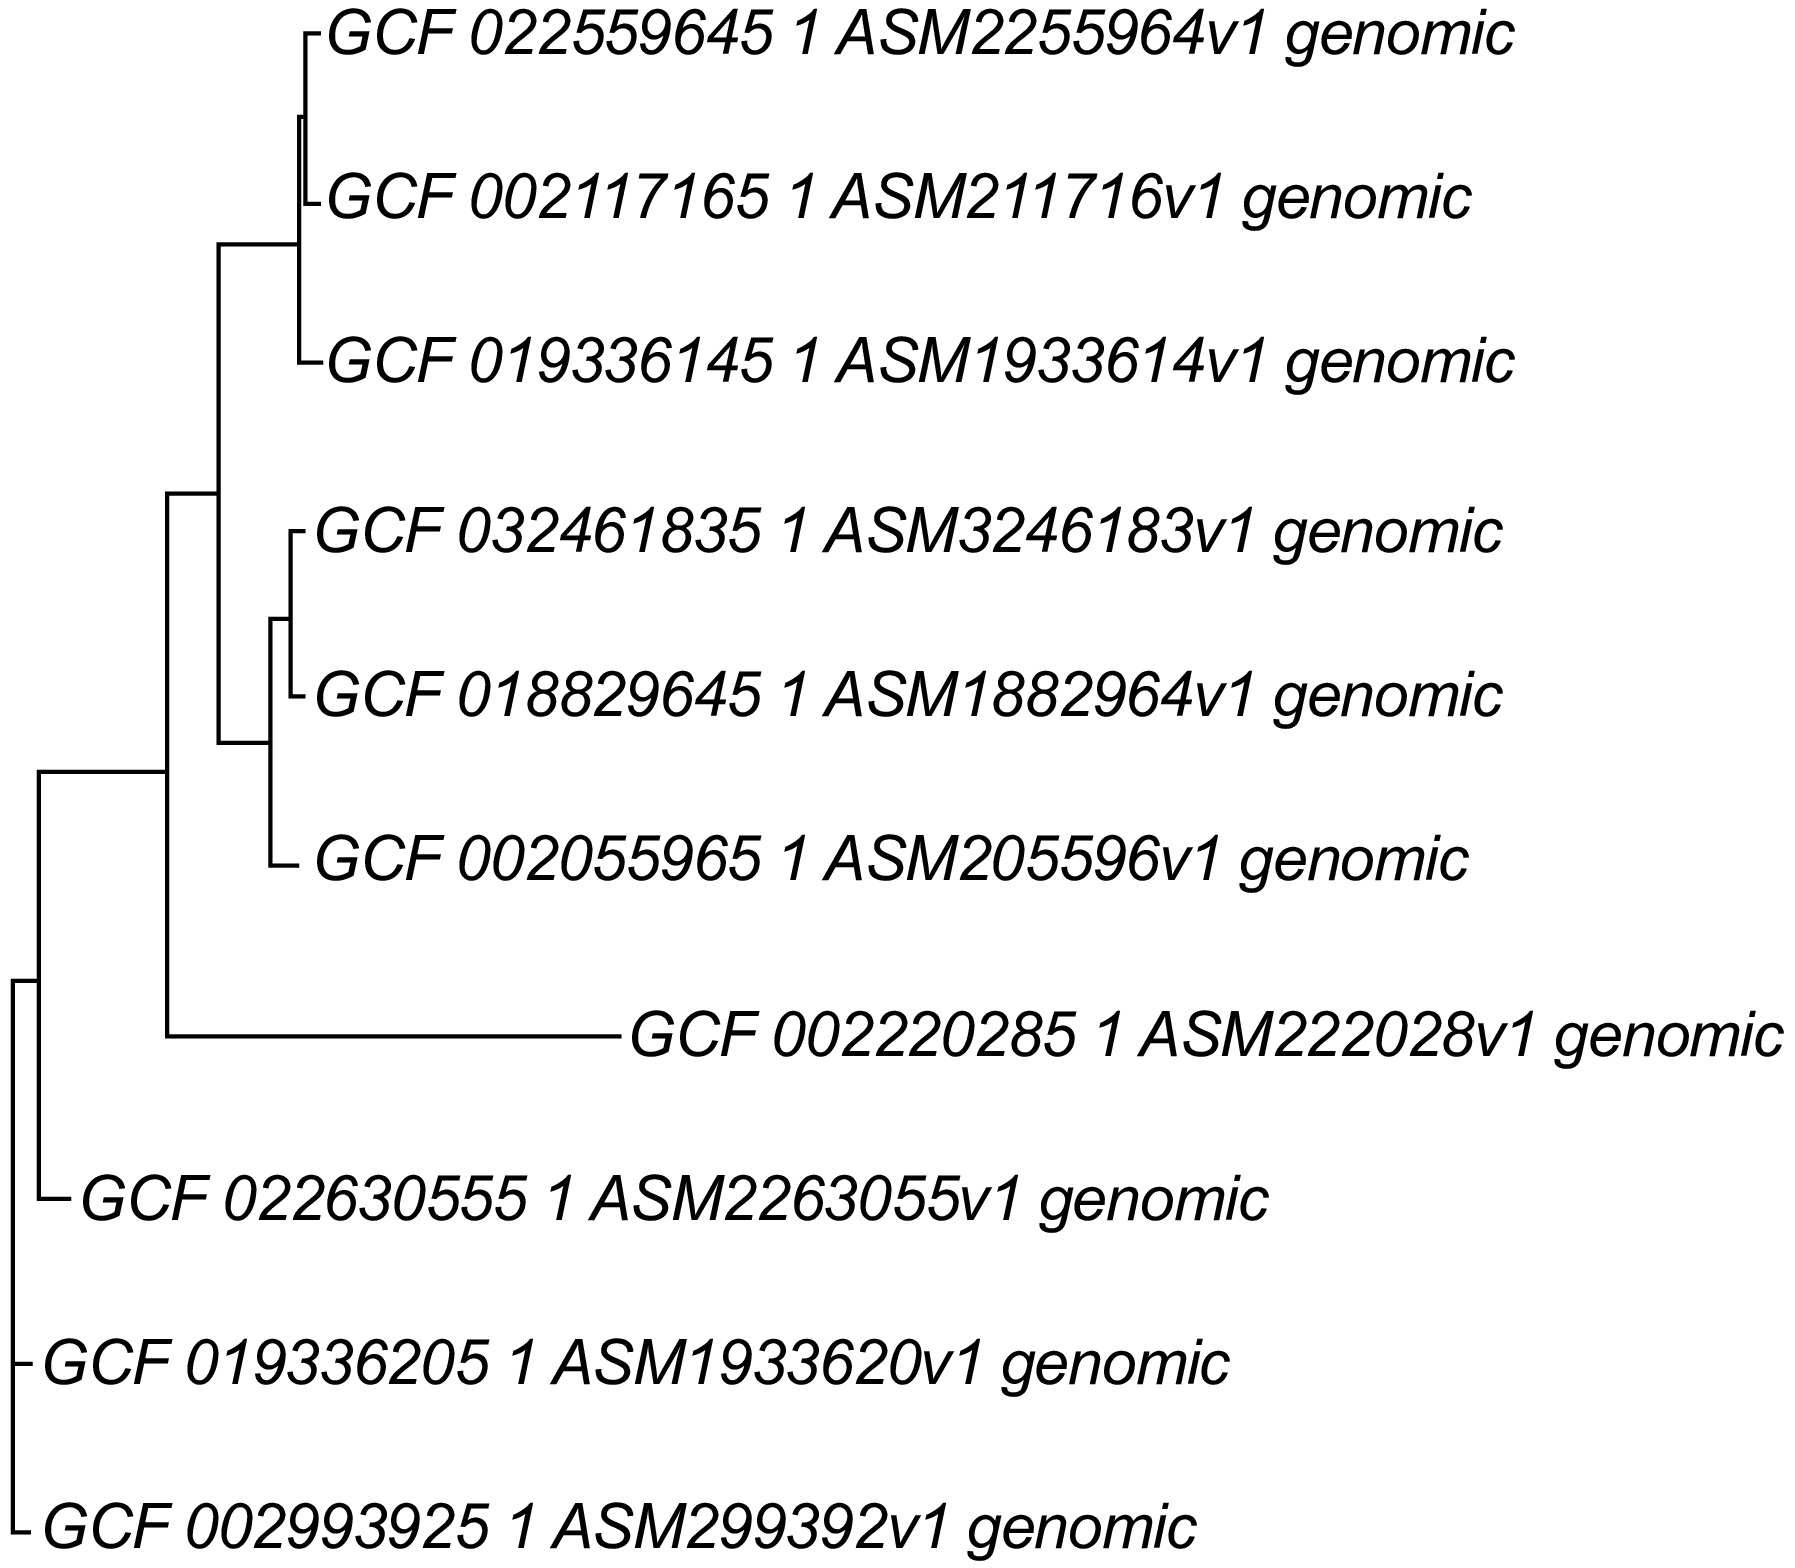
Figure 10.
Whole genome phylogeny using of beneficial Bacillus species using REALPHY programme. REALPHY web-based programme. Bacillus velezensis-BIK2 (GCF_019336145.1), Bacillus cabrialesii-BIK3 (GCF_018829645.1), Bacillus paralicheniformis-BIK4 (GCF_019336205.1), Bacillus amyloliquefaciens (GCF_022559645.1), Bacillus subtilis (GCF_002055965.1), Bacillus licheniformis (GCF_022630555.1), Bacillus velezensis (GCF_002117165.1), Bacillus cabrialesii (GCF_032461835.1), Bacillus paralicheniformis (GCF_002993925.1), Bacillus cereus (GCF_002220285.1). REALPHY uses phyML fast maximum likelihood methods for the analysis.
-

Figure 11.
Distribution of BIK2 proteins. The figure explains PIFAR-Pred annotation and classification of BIK2 proteins interacting with host plants. Annotations are obtained from PIFAR protein collection after blastp + hmmer analysis.
-
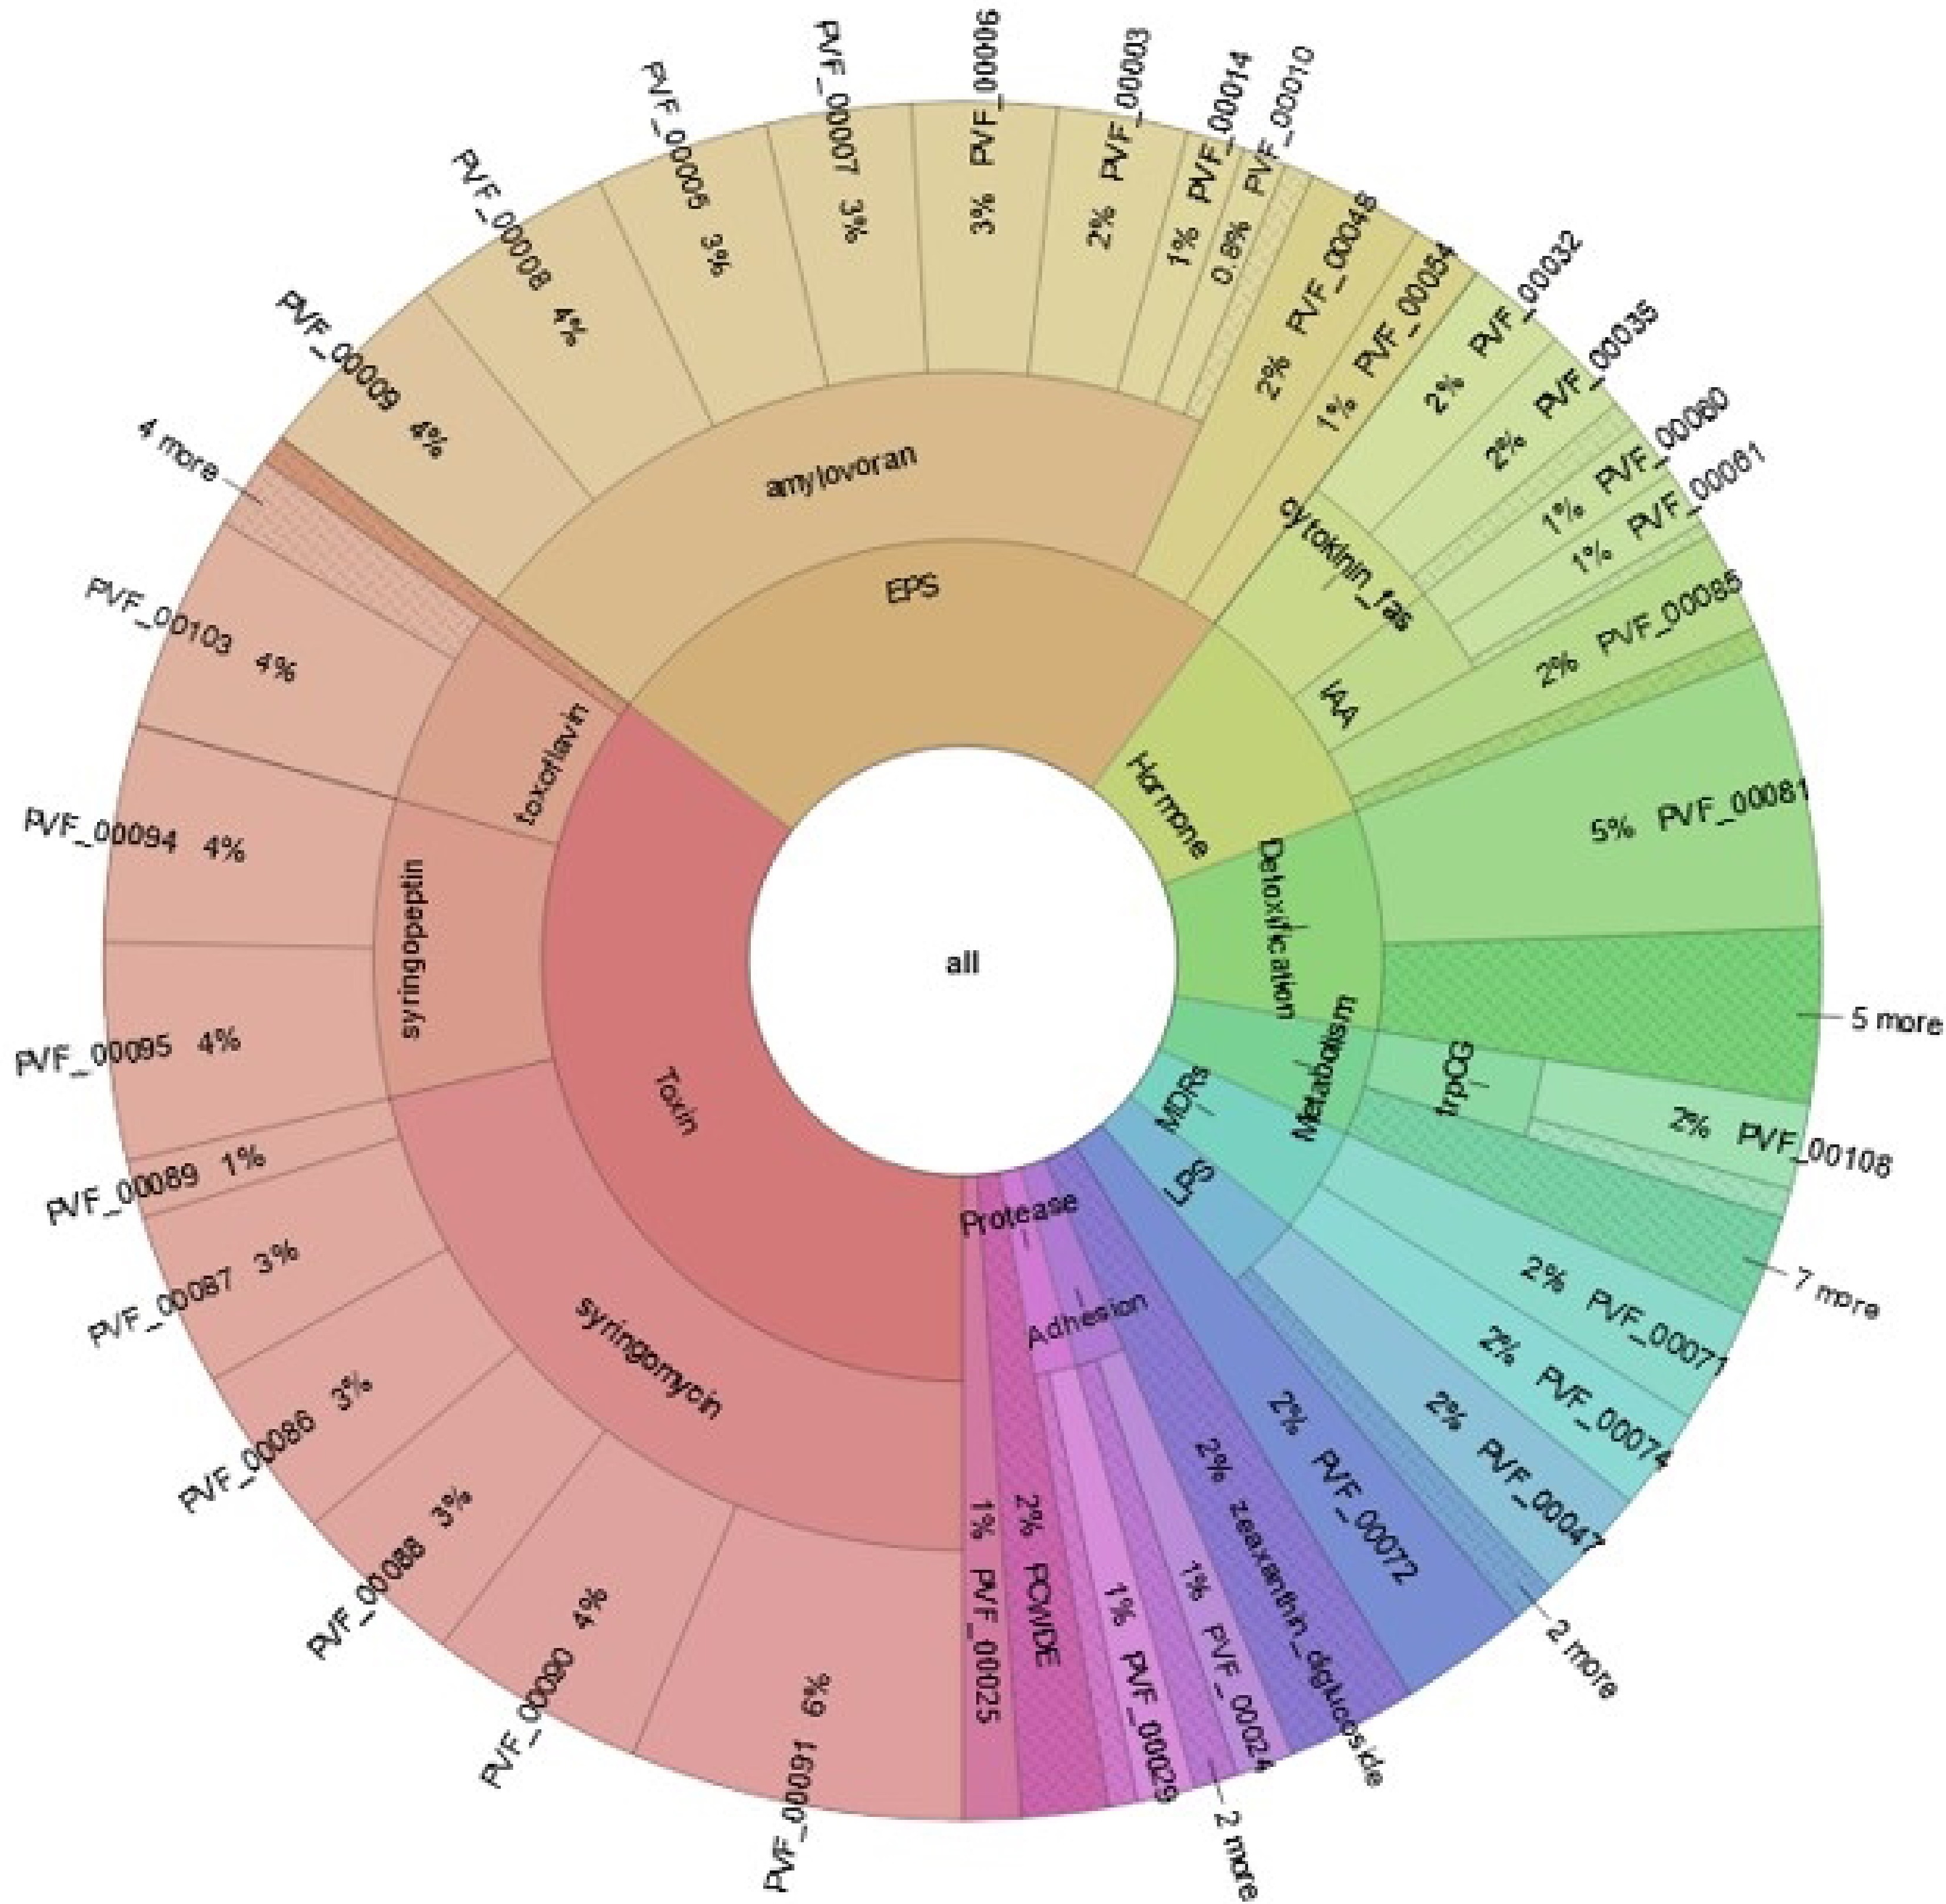
Figure 12.
Distribution of BIK3 proteins. The figure explains PIFAR-Pred annotation and classification of BIK3 proteins interacting with host plants. Annotations are obtained from PIFAR protein collection after blastp + hmmer analysis.
-
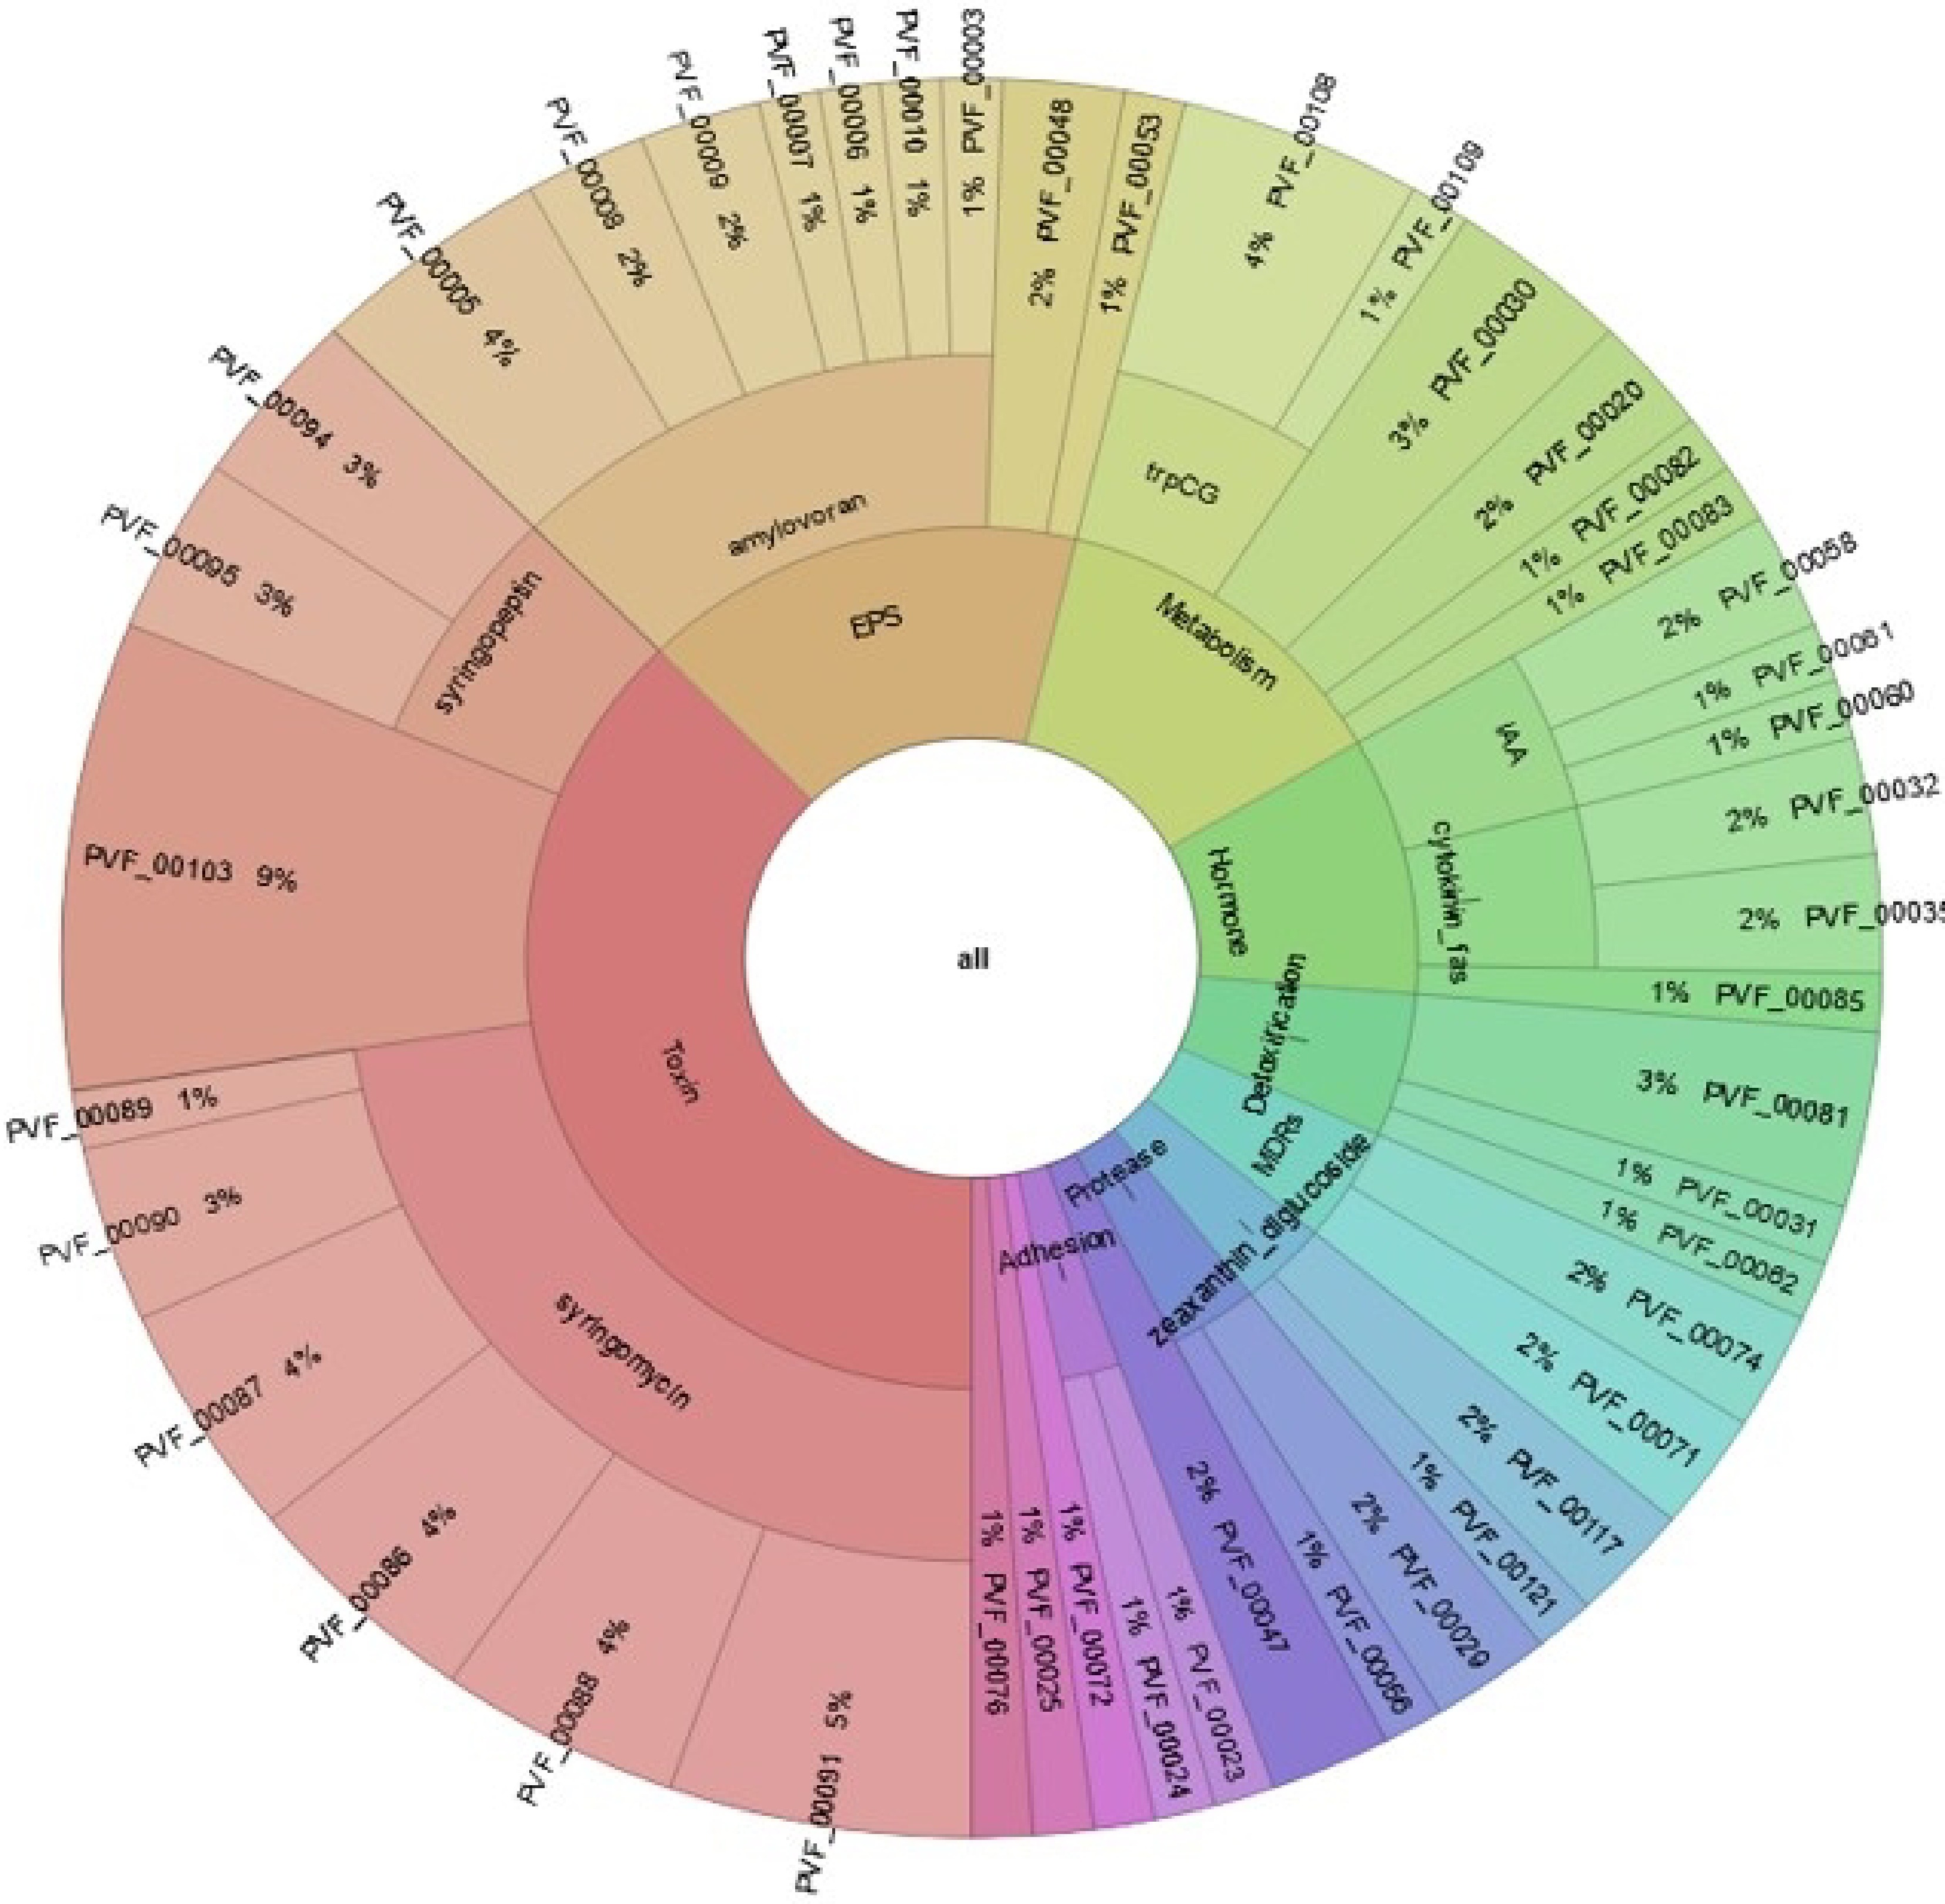
Figure 13.
Distribution of BIK4 proteins. The figure explains PIFAR-Pred annotation and classification of BIK4 proteins interacting with host plants. Annotations are obtained from PIFAR protein collection after blastp + hmmer analysis.
-
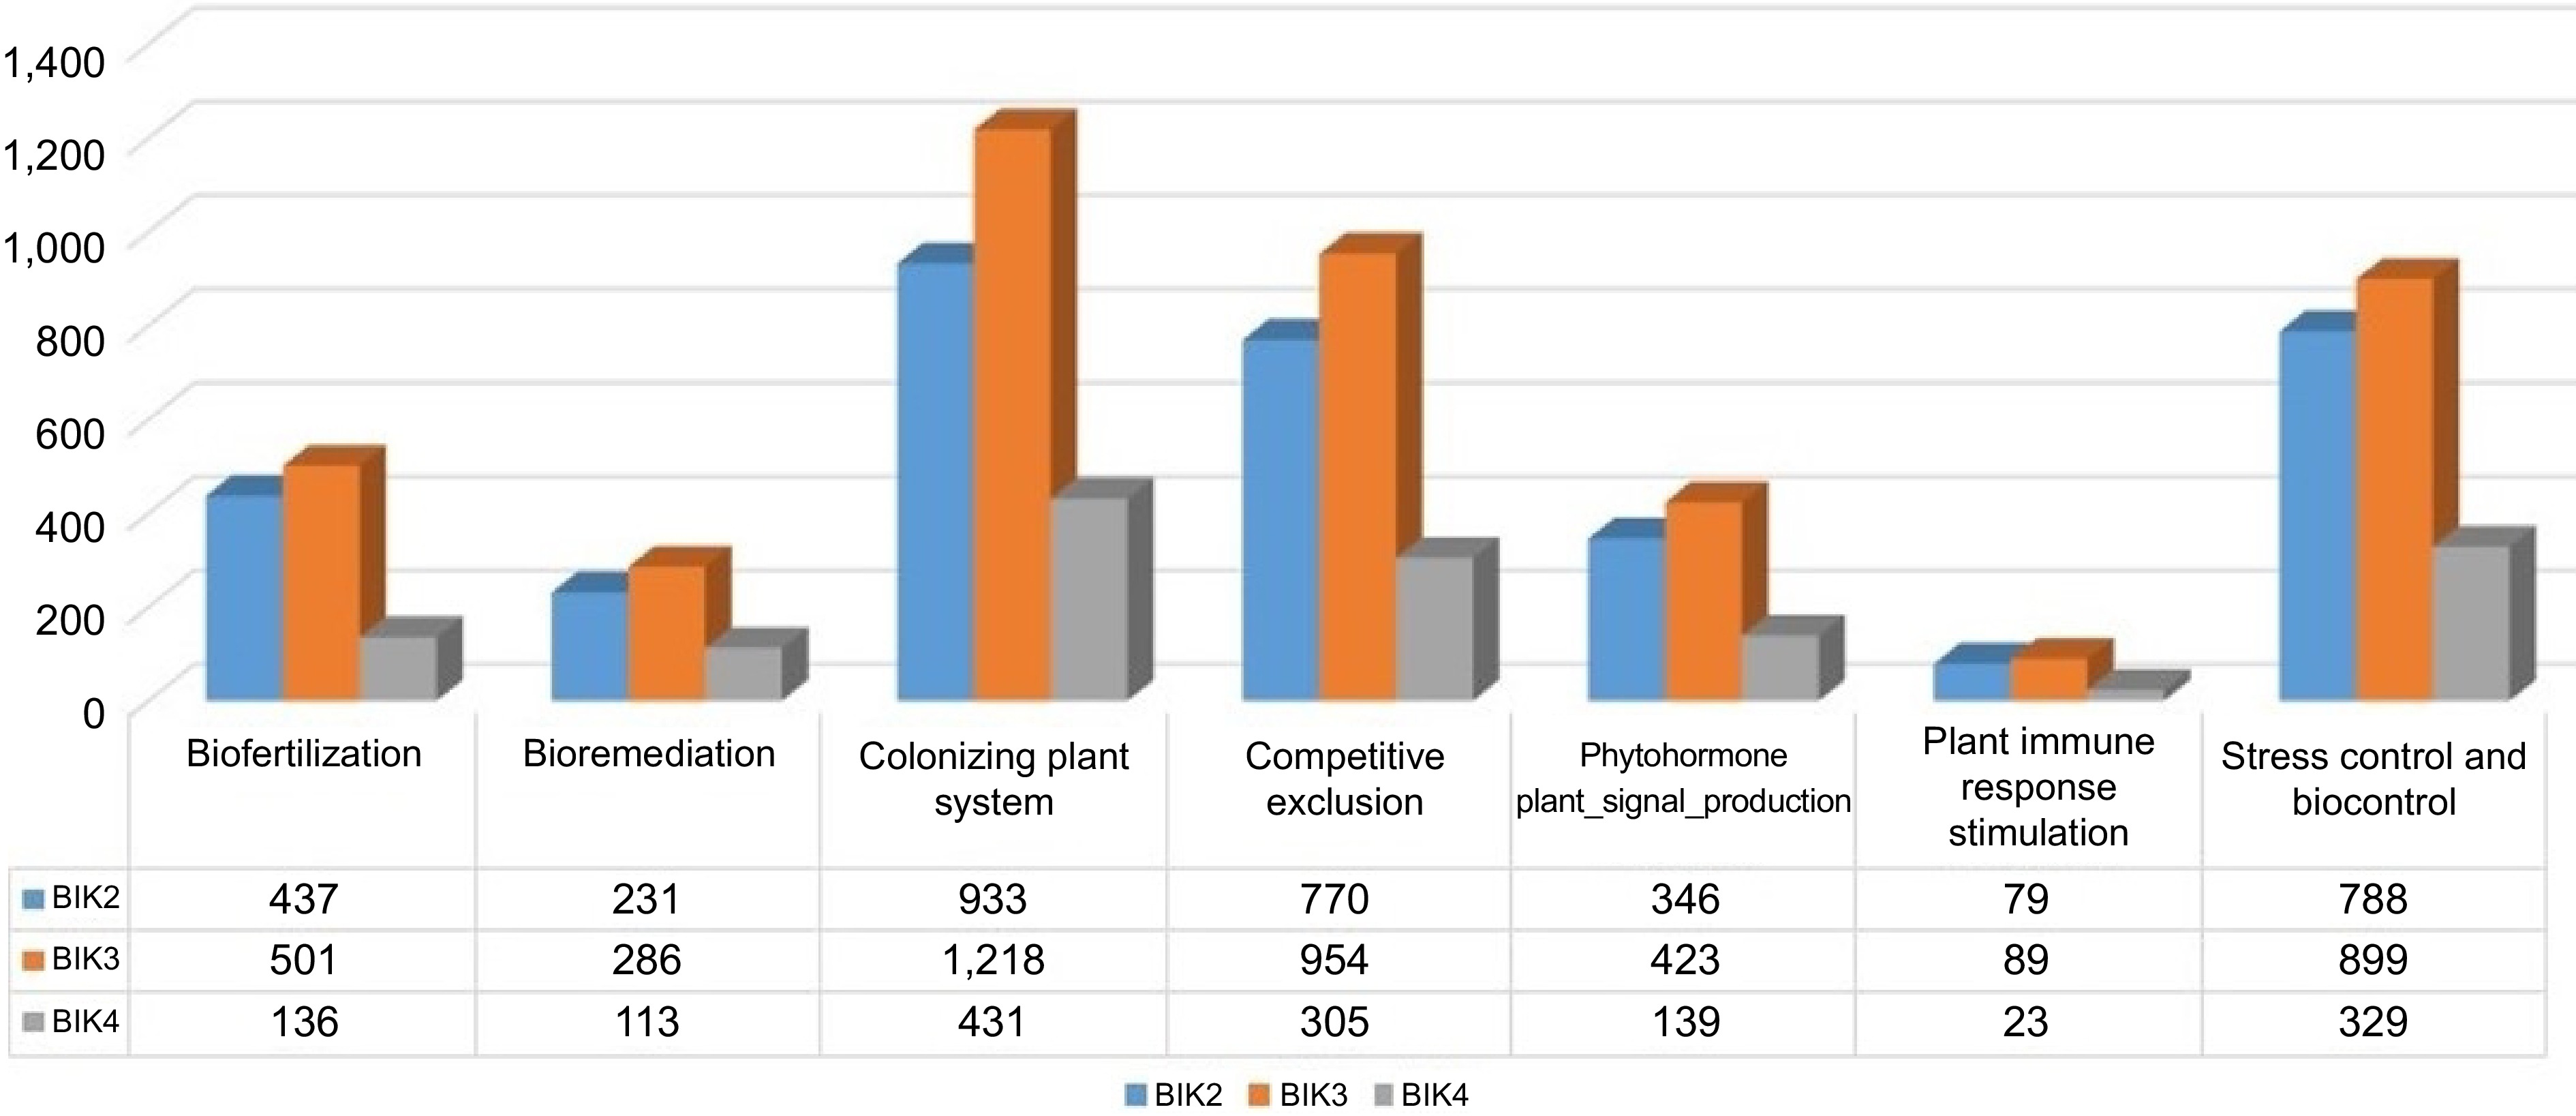
Figure 14.
Histogram showing distribution of bacterial proteins interacting with plant. BIK2, BIK3, and BIK4 proteins are found to interact with plants in various ways. Molecules are classified under different stages of interaction.
-
Variables B. velezensis BIK2 B. cabrialesii BIK3 B. paralicheniformis BIK4 Scaffolding with CONTIGuator Input contigs 37 (3,902,606 bp) 49 (4,113,954 bp) 56 (4,424,204 bp) Mappeda contigs 15 (3,887,215 bp) 21 (4,046,514 bp) 21 (4,405,346 bp) Unmappedb contigs 22 (15,391 bp) 28 (67,440 bp) 35 (18,858 bp) Unmapped: short contigs 18 (7,793 bp) 22 (5,737 bp) 32 (10,951 bp) Unmapped: poor coverage 0 4 (57,117 bp) 1 (3,632 bp) Unmapped: duplicated hits 4 (7,598 bp) 2 (4,586 bp) 2 (4,275 bp) Annotation of scaffolds N50 (bp) 3,888,615 4,048,514 4,407,346 Completeness (BUSCO) 99.41% 99.41% 100% Gap ratio (%) 0.036003 0.049401 0.045379 GC content (%) 46.5 44.2 45.5 Number of CDSs 3,743 4,008 4,507 Coding ratio (%) 89.5 88.9 87.9 Number of rRNAs 0 1 2 Number of tRNAs 59 59 70 Pseudogenes 146 115 184 Gene enrichment analysis GO terms 1,955c uniques
(8,176d duplicates)2,262 uniques
(10,047 duplicates)1,011 uniques
(2,826 duplicates)COG categories 1,923 2,342 777 Cellular processes and signaling 363 433 124 Information storage and processing 367 435 186 Metabolism 787 953 305 Poorly characterised/ unknown functions 408 520 162 a, Contigs those aligned to reference genome; b, Contigs not aligned to reference genome; c, Uniques are those genes involved in single activity d, Duplicates are those involved in multiple activities. Table 1.
Scaffolding and annotation summary of BIK2, BIK3, and BIK4 along gene enrichment analysis.
-
Type Biosynthetic class Location Most similar known cluster Similarity (%) transAT-PKS Polyketide 1,349,542−1,437,358 Macrolactin H 100% transAT-PKS, T3PKS, NRPS Polyketide + NRP 1,656,859−1,757,461 Bacillaene 100% NRPS, transAT-PKS, betalactone NRP 1,822,672−1,948,610 Fengycin 100% NRPS, RiPP-like NRP 2,974,339−3,026,132 Bacillibactin 100% Other Other 3,541,315−3,582,733 Bacilysin 100% transAT-PKS Polyketide + NRP 2,236,311−2,326,509 Difficidin 100% NRPS NRP 302,447−378,024 Surfactin 82% Table 2.
antiSMASH bacterial version results of B. velezensis BIK2.
-
Type Biosynthetic class Location Most similar known cluster Similarity (%) NRPS NRP: Lipopeptide 314,344−378,335 Surfactin 86% TransAT-PKS, T3PKS, NRPS Polyketide + NRP 1,718,221−1,823,173 Bacillaene 100% NRPS, transAT-PKS, betalactone NRP 1,893,277−2,016,972 Fengycin 100% NRPS NRP 3,046,631−3,093,767 Bacillibactin 100% Sactipeptide RiPP: Thiopeptide 3,643,594−3,665,205 Subtilosin 100% Other Other 3,668,257−3,709,675 Bacilysin 100% Table 3.
Secondary metabolites identified by antiSMASH bacterial version for B. cabrialesii BIK3 scaffold.
-
Type Biosynthetic class Location Most similar
known clusterSimilarity
(%)NRPS NRP 334,165−396,222 Lichenycin 100% NRPS, betalactone NRP 2,028,578−2,099,
311Fengycin 86% Molecules having less than threshold % similarity were discarded. Table 4.
Secondary metabolites identified by antiSMASH bacterial version for Bacillus paralicheniformis BIK4 scaffold.
-
Parameters of SSR search BIK2 BIK3 BIK4 Parameters CDS CDS CDS The total number of sequences
examined3,743 3,326 1,238 The total size of examined
sequences (bp)3,481,005 2,998,222 1,108,330 A total number of identified SSRs 10 12 1 Number of SSR-containing sequences 10 12 1 Trimers 1 3 − Pentamers 4 5 1 Hexamers 5 4 − Table 5.
Frequency of identified SSR motifs in BIK2, BIK3, and BIK4.
Figures
(14)
Tables
(5)