-
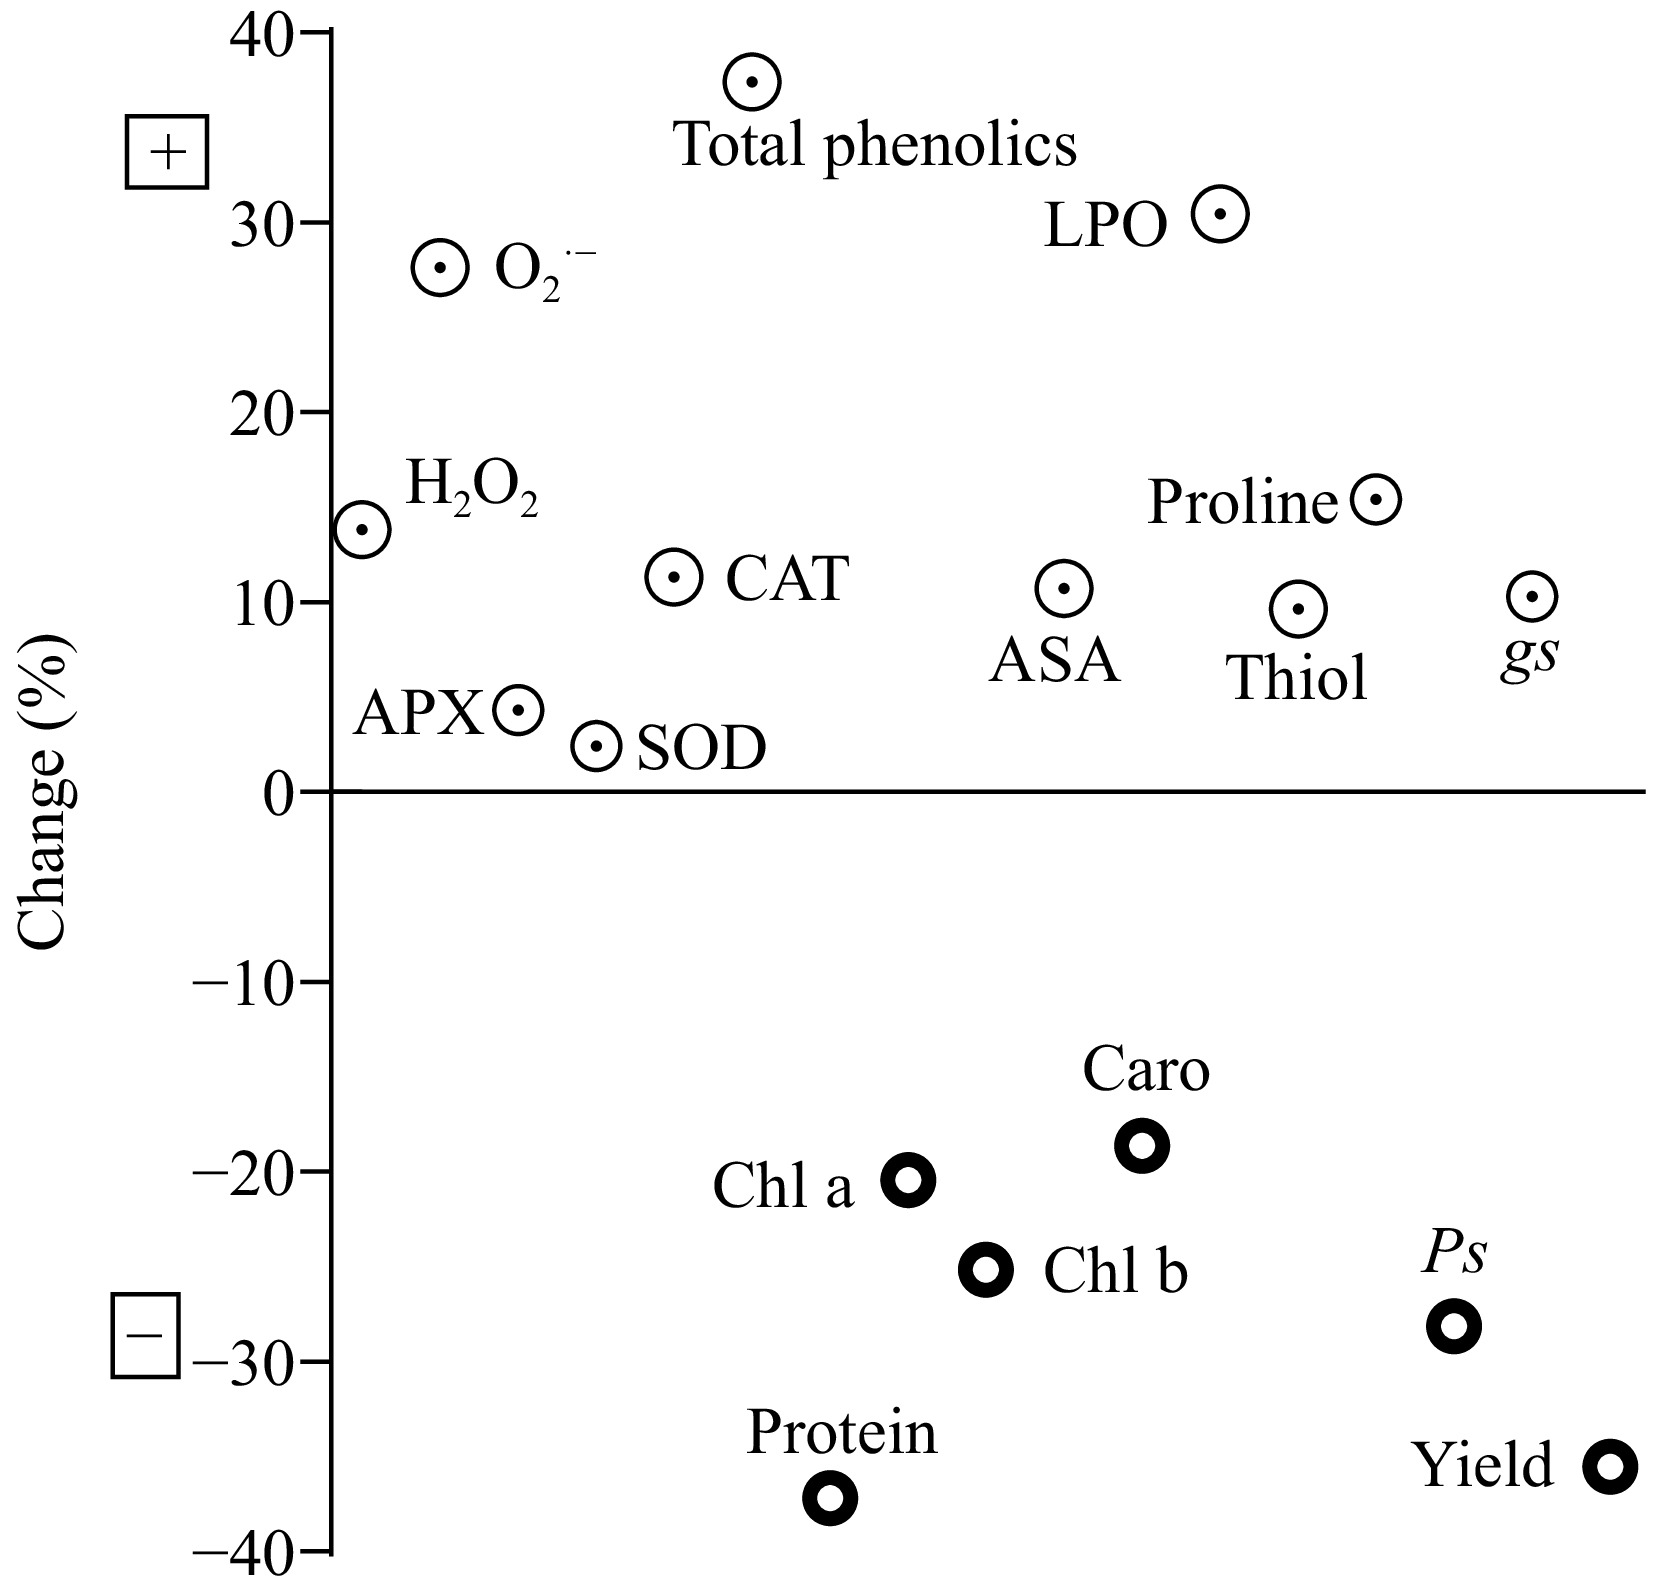
Figure 1.
Assessment of toxic effects of EC50 Cd dose on selected characteristics of Beta vulgaris L. Upper quadrant is showing a positive percentage change and lower quadrant is showing a negative percentage change in enzymatic, nonenzymatic, pigment contents, and physiological parameters during treatments. LPO: lipid peroxidation, H2O2: hydrogen peroxides, O2·−: superoxide, SOD: superoxide dismutase, CAT: catalase, AsA: ascorbic acid, APX: ascorbate peroxidase, Ps: net photosynthetic rate, gs: stomatal conductance, chl a: chlorophyll a, chl b: chlorophyll b, caro: carotienoid.
-
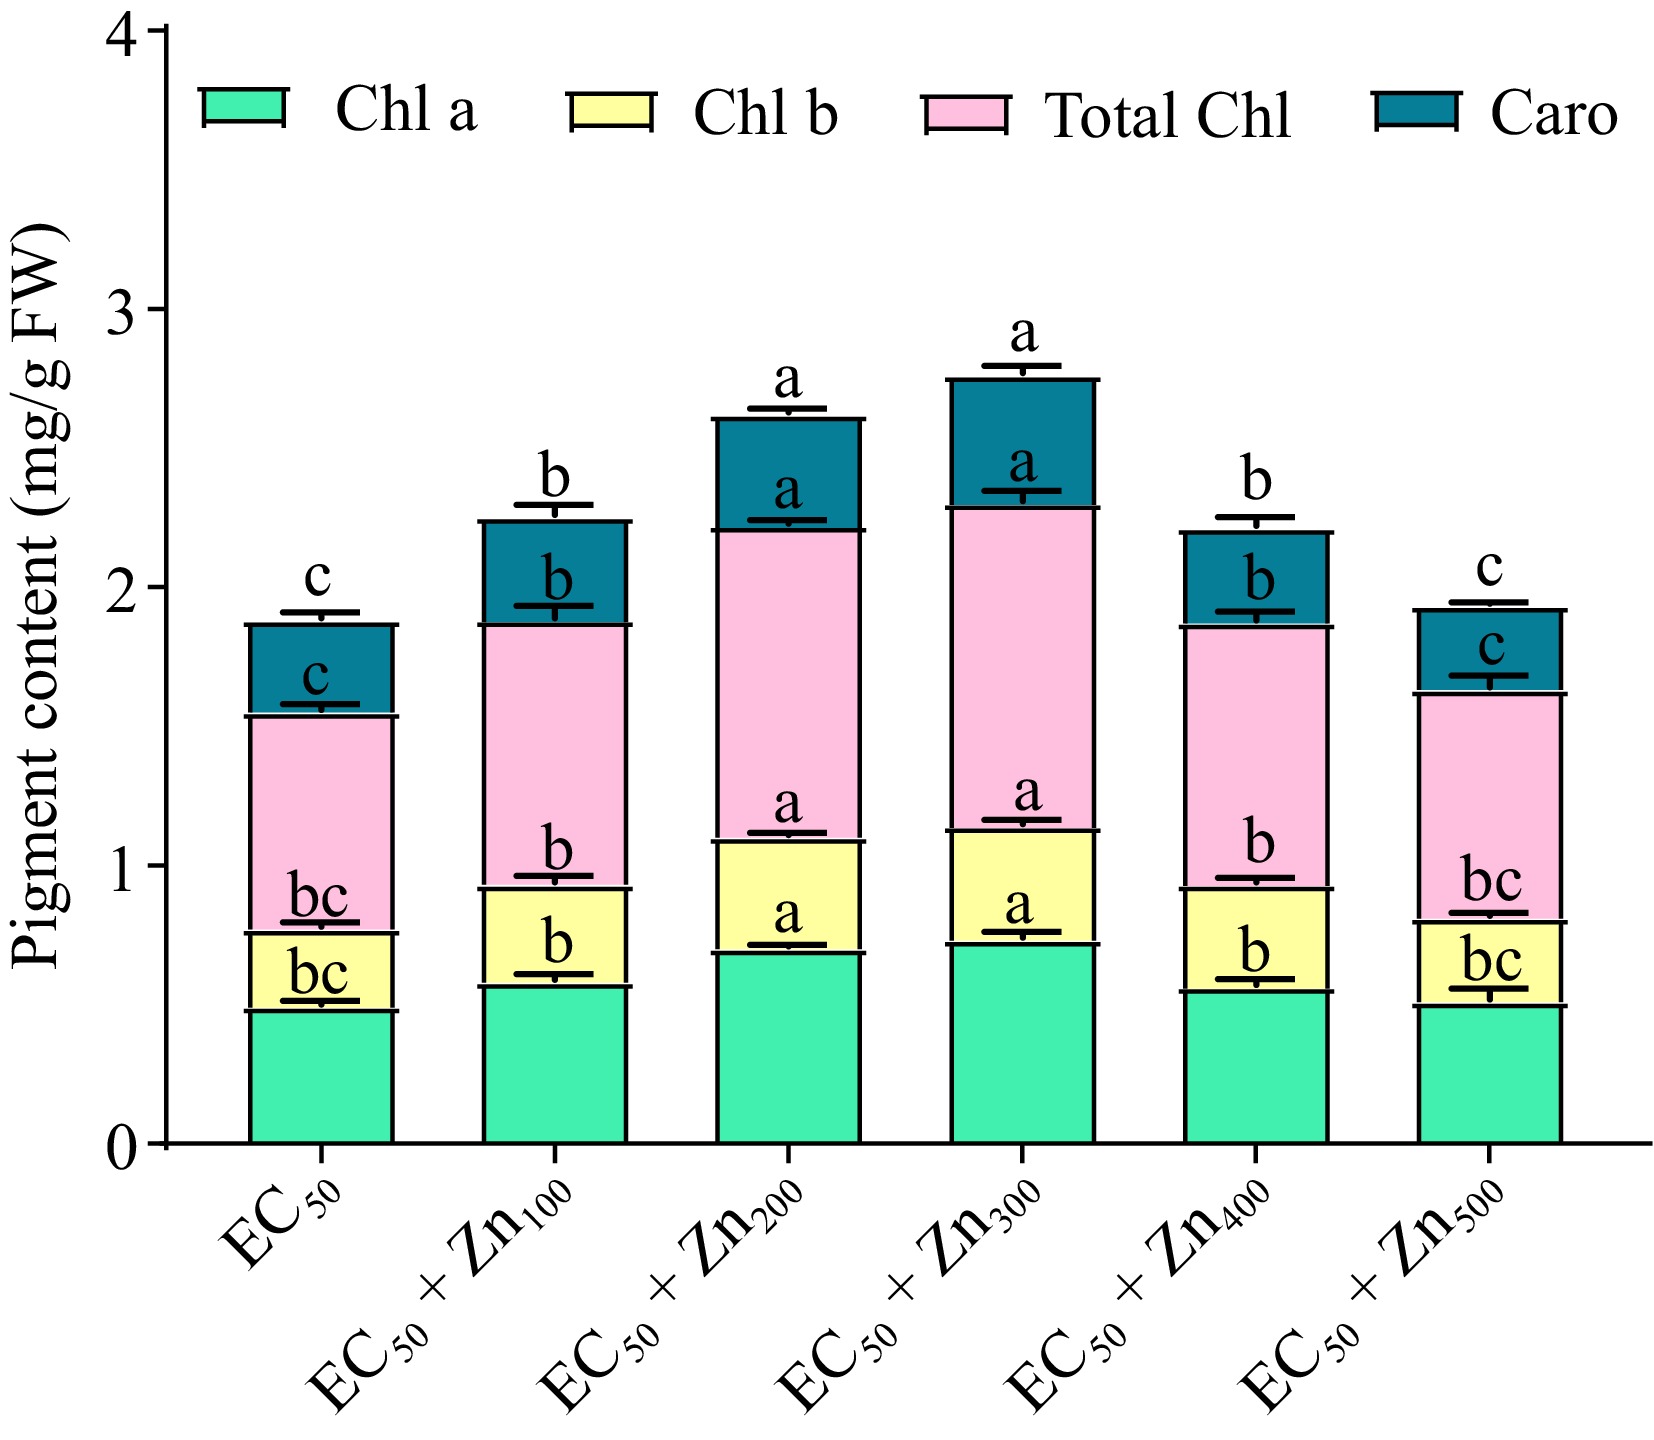
Figure 2.
Variations in pigment contents (chlorophyll a, chlorophyll b, total chlorophyll, and carotenoids) of Beta vulgaris L. plants treated with combined EC50 Cd and doses of Zn at 45 DAE. Bars represent Mean ± S.E. Different colors represent photosynthetic pigments (green; chlorophyll a, yellow; chlorophyll b, pink; total chlorophyll and teal blue; carotenoid) (p < 0.05).
-
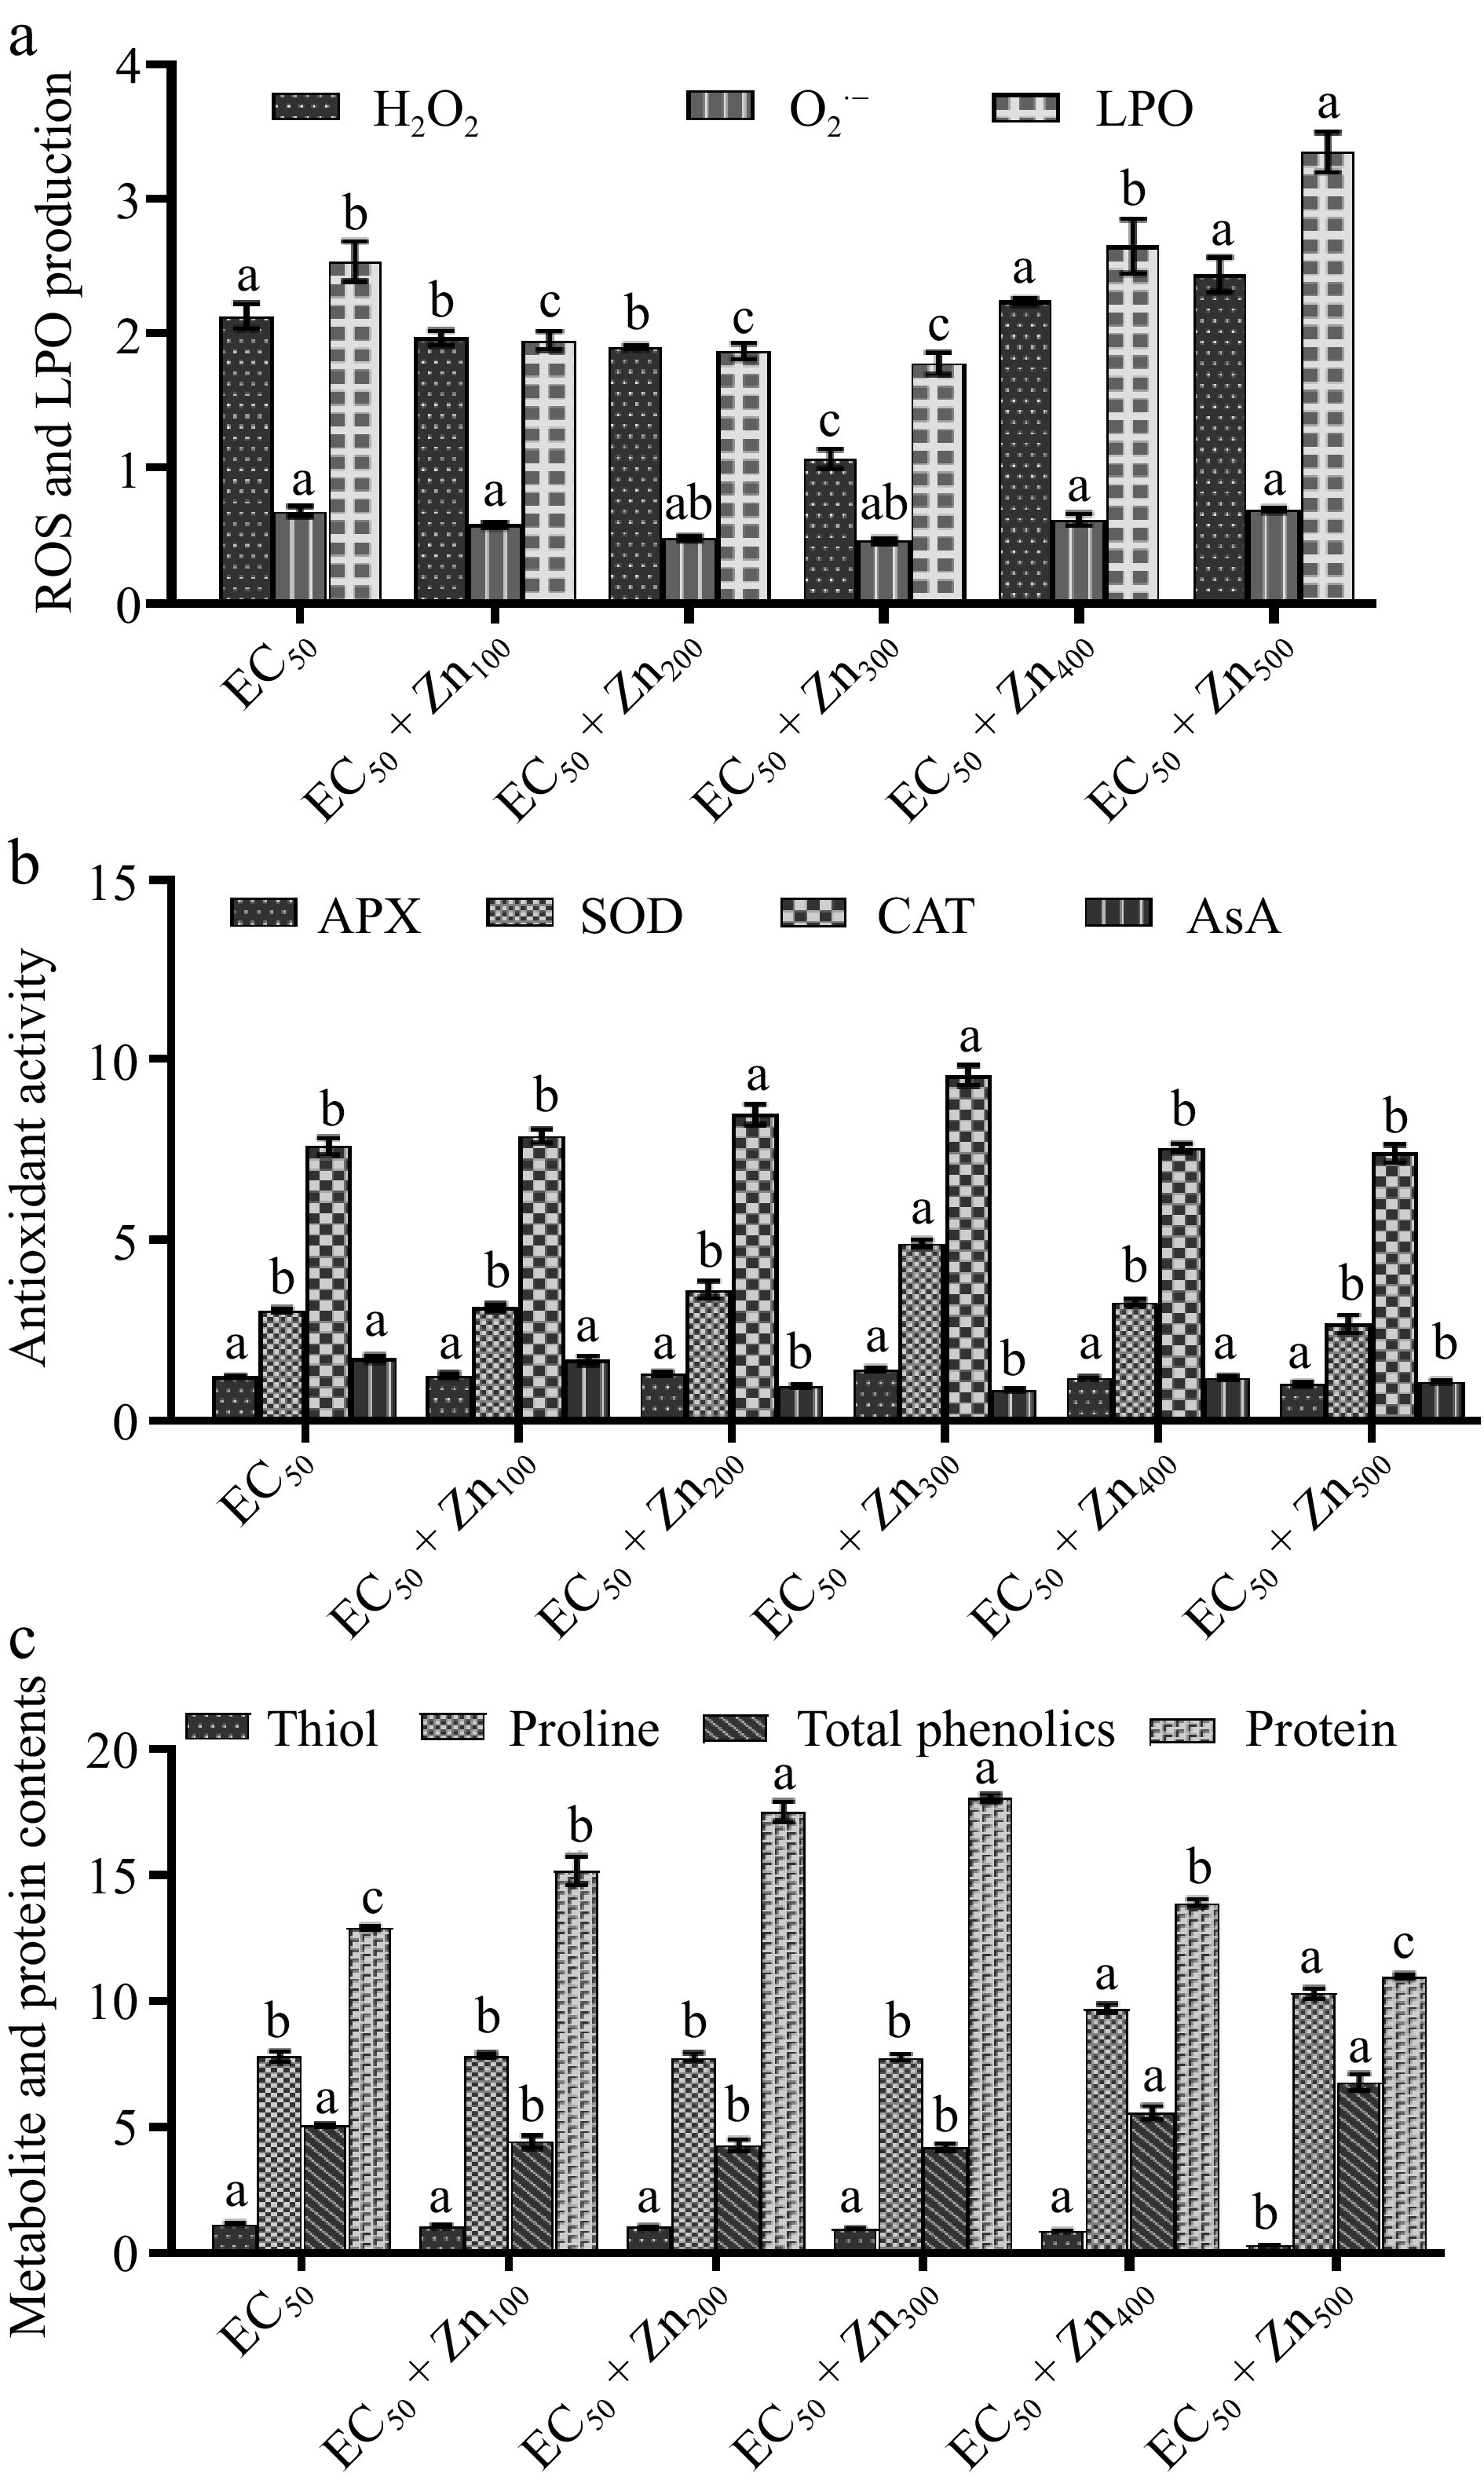
Figure 3.
Bar graph showing variations in the response of (a) ROS (H2O2; μmol/g FW and O2·−; nmol/min/g), malondialdehyde (MDA) content; nmol/mL. (b) Antioxidant (ascorbate peroxidase; APX; nmol/min/g FW catalase; CAT; μM H2O2 oxidized min−1 g−1 FW, superoxide dismutase; SOD; g−1 FW) and ascorbic acid; AsA; mg/g FW). (c) Protein; mg/g DW, and metabolites (thiol; μM DW, proline; mg/g FW and phenol; mg/g FW) of Beta vulgaris L. plants treated with combined EC50 Cd and doses of Zn at 45 DAE. X-axis shows doses of Zn with EC50 Cd dose. Bar are mean ± S.E. Bars with different letters indicate significant variation at p < 0.05.
-
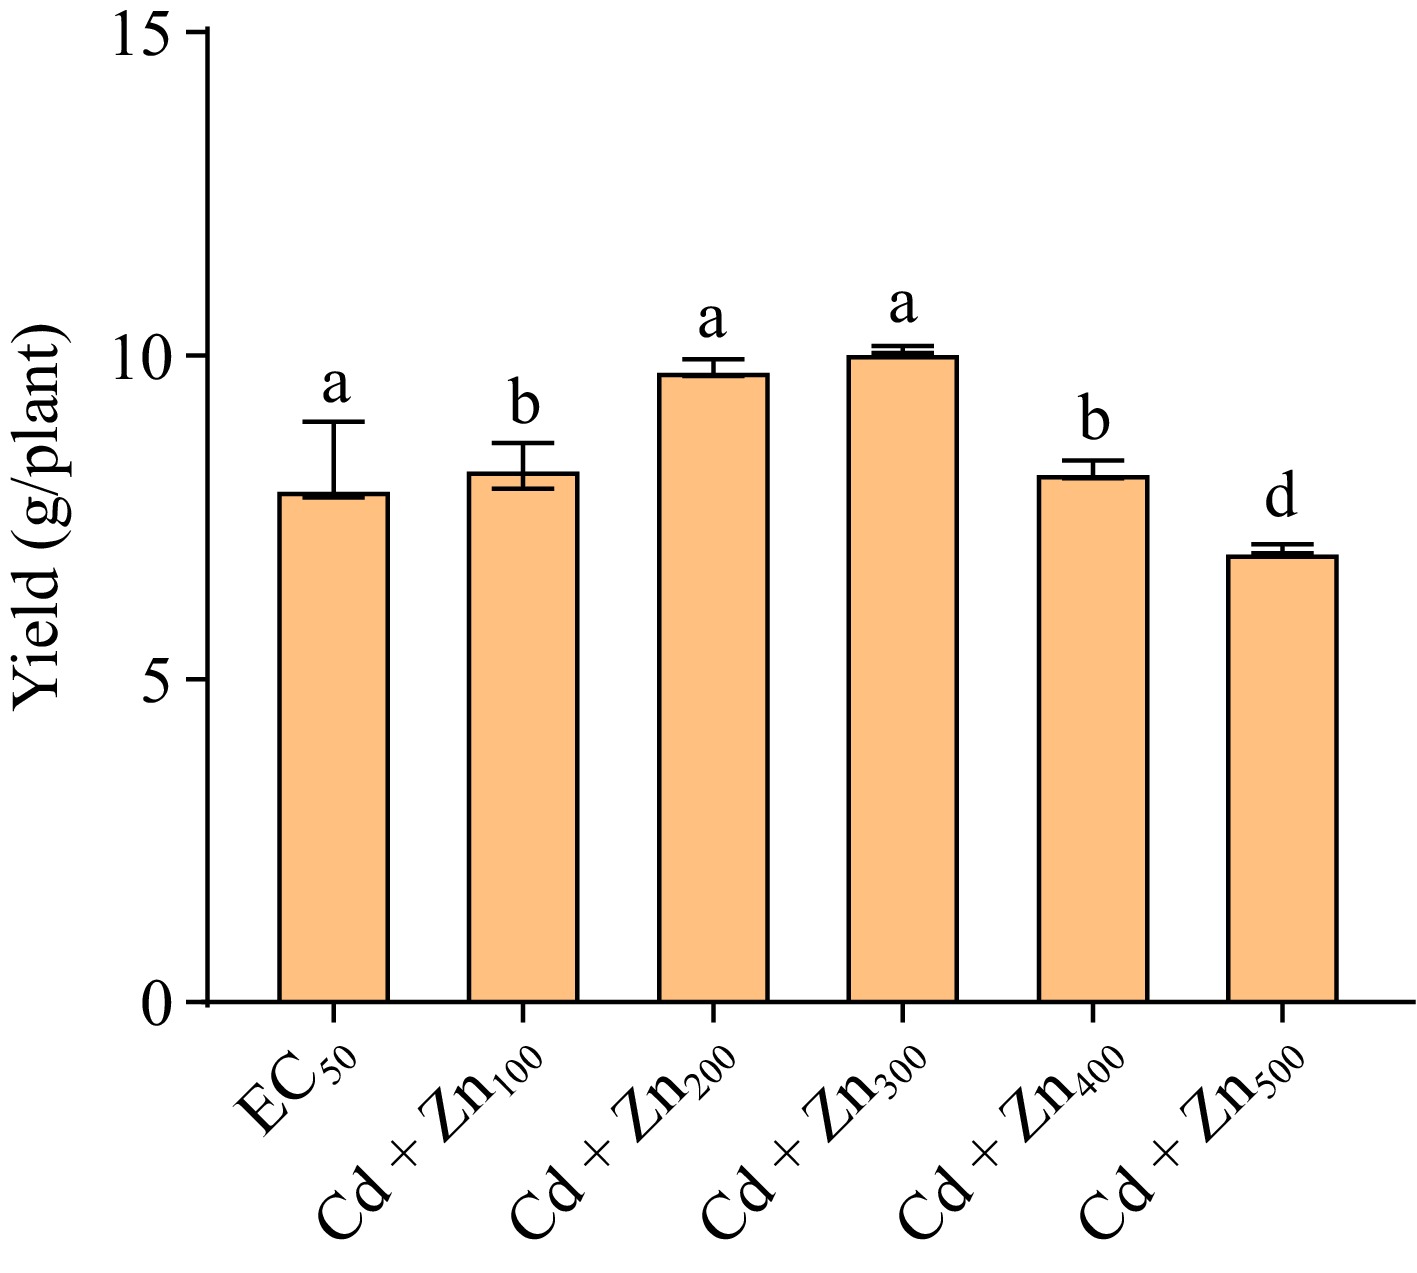
Figure 4.
Bar graph showing variations in yield of Beta vulgaris L. plants treated with combined EC50 Cd dose and different doses of Zn at 45 DAE. Bar are mean ± S.E. Bars with different letters indicate significant variation at p < 0.05. The Y-axis showed the unit of yield (g/plant).
-
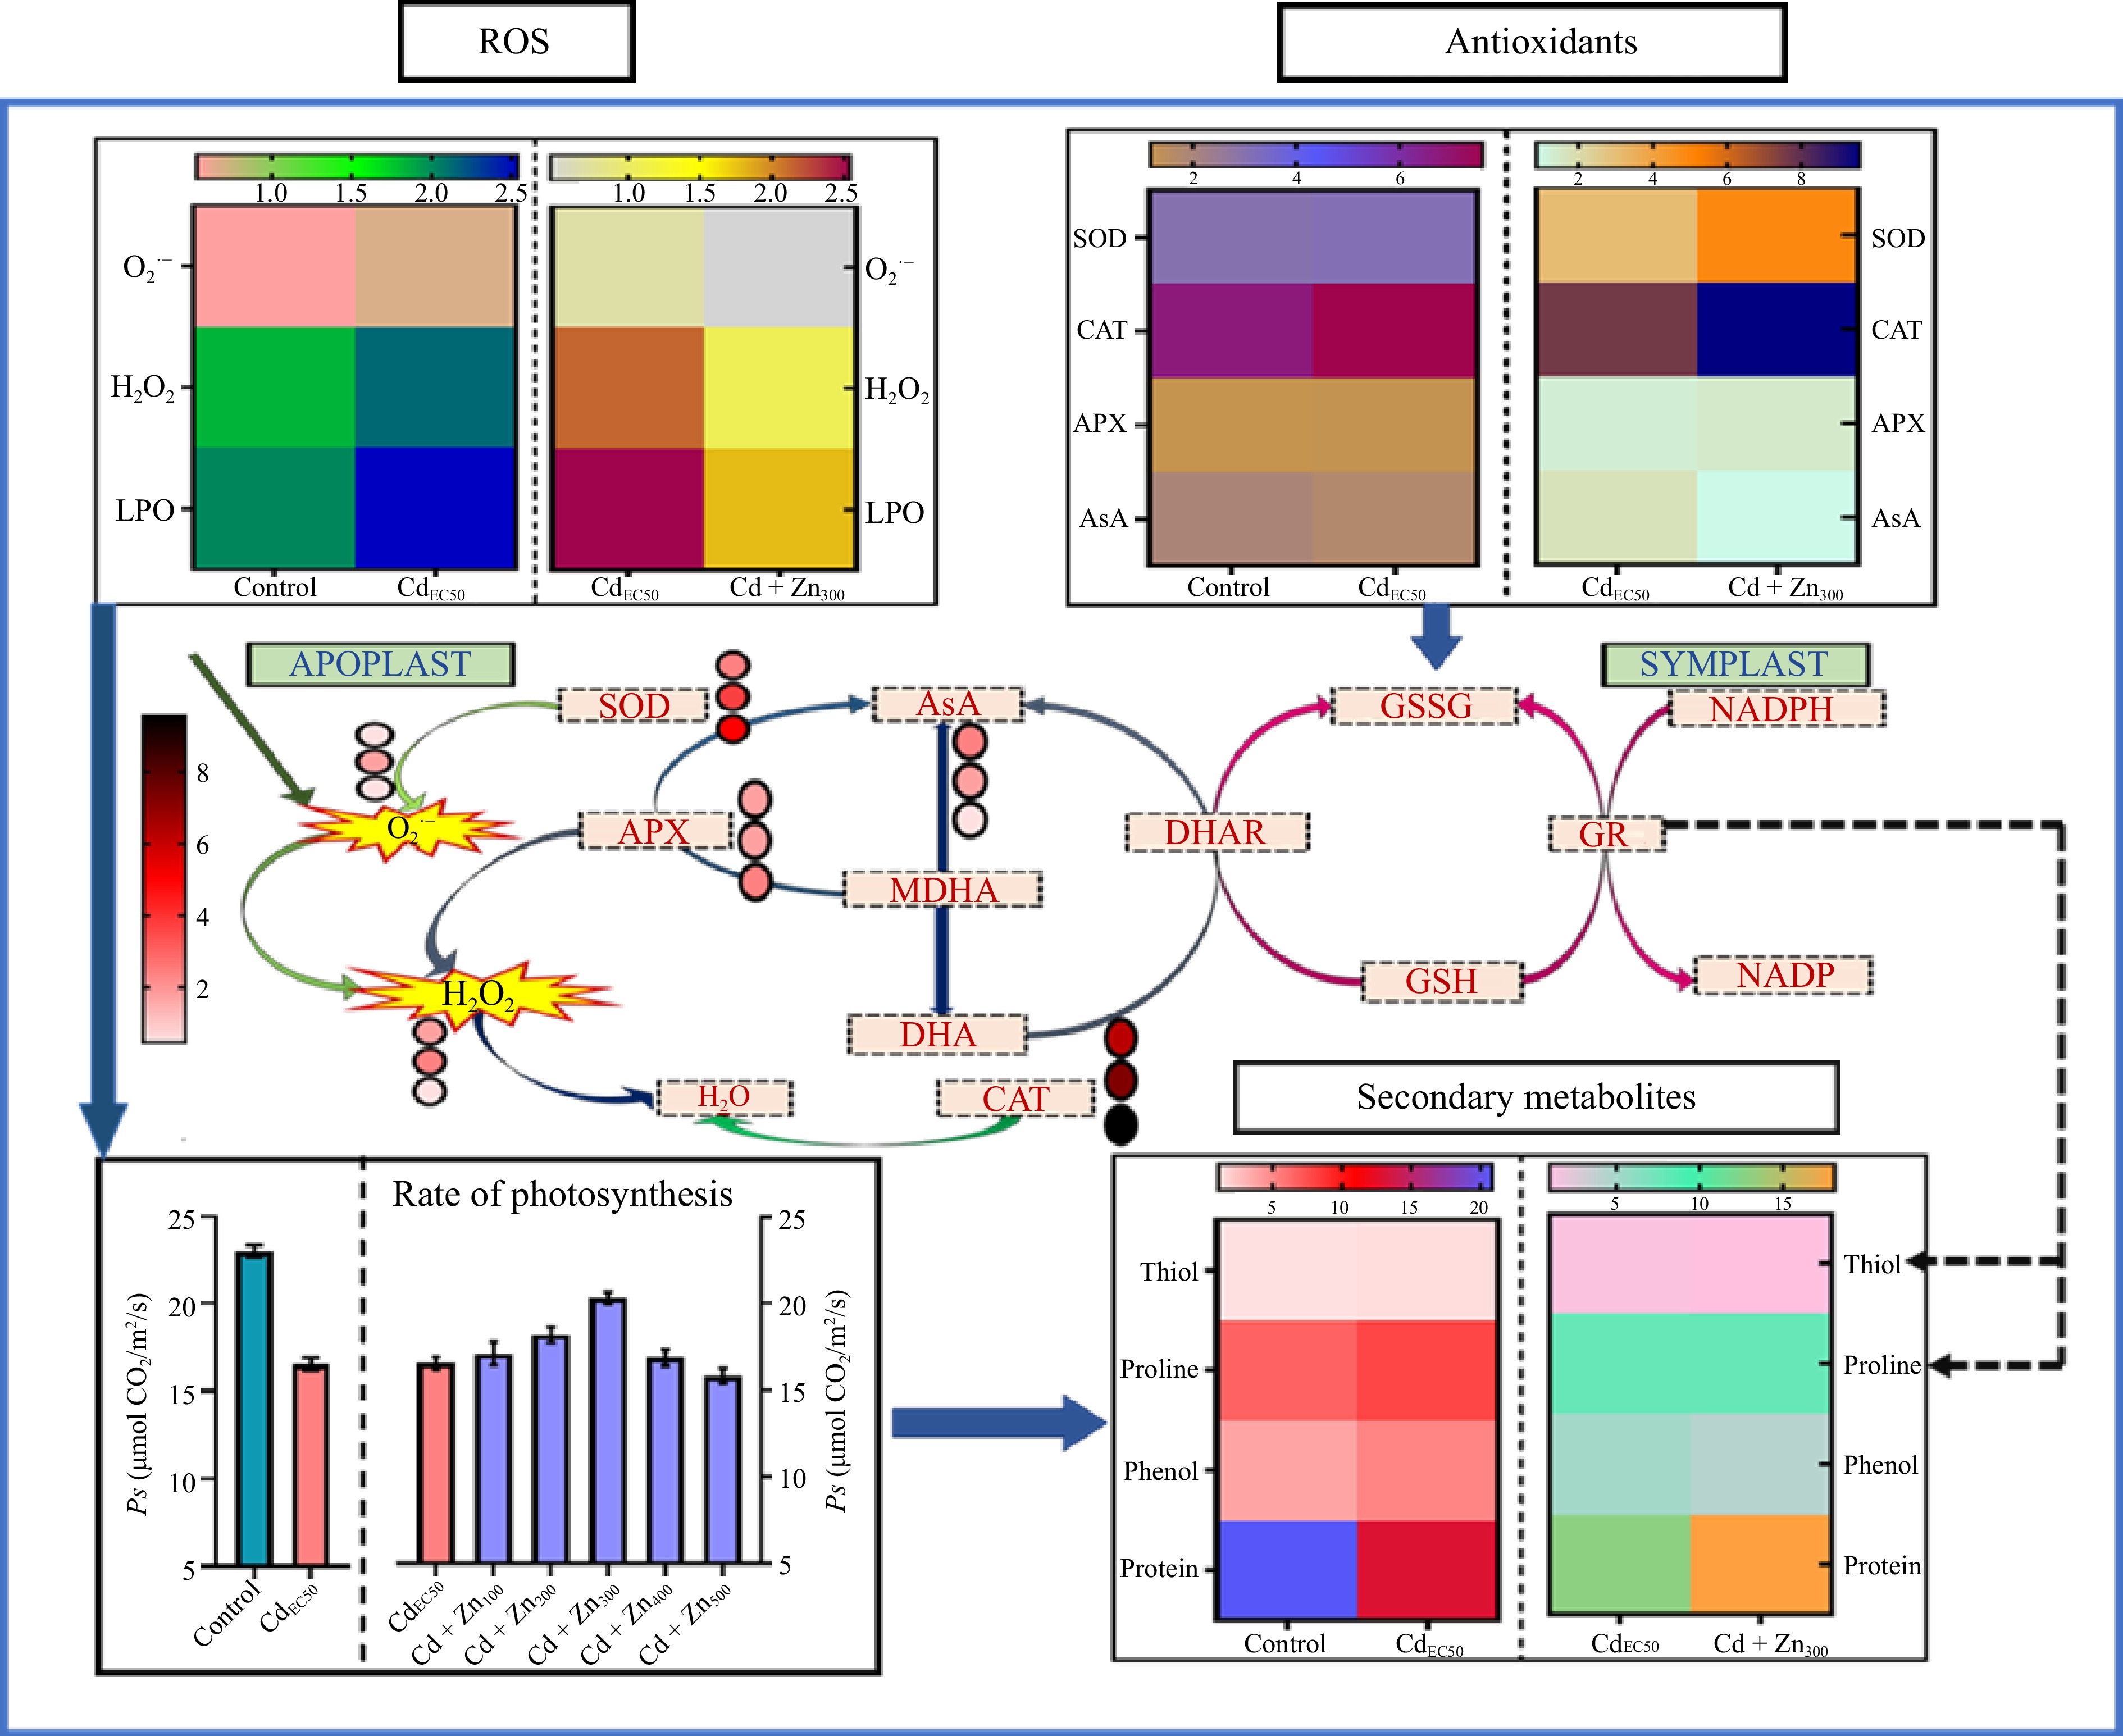
Figure 5.
Comparative analysis of the effect of treatments (Control-CdEC50 and CdEC50-CdEC50 combined with doses of Zn) on ROS (H2O2 and O2·−) generation, lipid peroxidation (LPO), antioxidative response, rate of photosynthesis, secondary metabolite and protein contents of Beta vulgaris L. plants. The color gradient of the heatmap shows the variation in ROS, antioxidants and secondary metabolites. Lighter colors are showing lower concentration and dark colors are showing higher concentration. The pathway is showing conversion of antioxidant machinery with the color gradient of the heatmap showing lower (light color) to higher concentrations (dark color) of antioxidants. Legend numbers represent the concentration of antioxidant machinery. LPO: lipid peroxidation, H2O2: hydrogen peroxides, O2·−: superoxide, SOD: superoxide dismutase, CAT: catalase, AsA: ascorbic acid, DHA: dehydroascorbate, MDHA: monodehydroascorbate, GSH: glutathione, GSSG: glutathione, APX: ascorbate peroxidase, DHAR: dehydroascorbate reductase, MDHAR: monodehydroascorbate reductase, GR: glutathione reductase, NADP reductase; NADP: nicotinamide adenine dinucleotide phosphate; NADPH: reduced nicotinamide adenine dinucleotide phosphate, ROS: reactive oxygen species, Ps: net photosynthetic rate, gs: stomatal conductance.
-
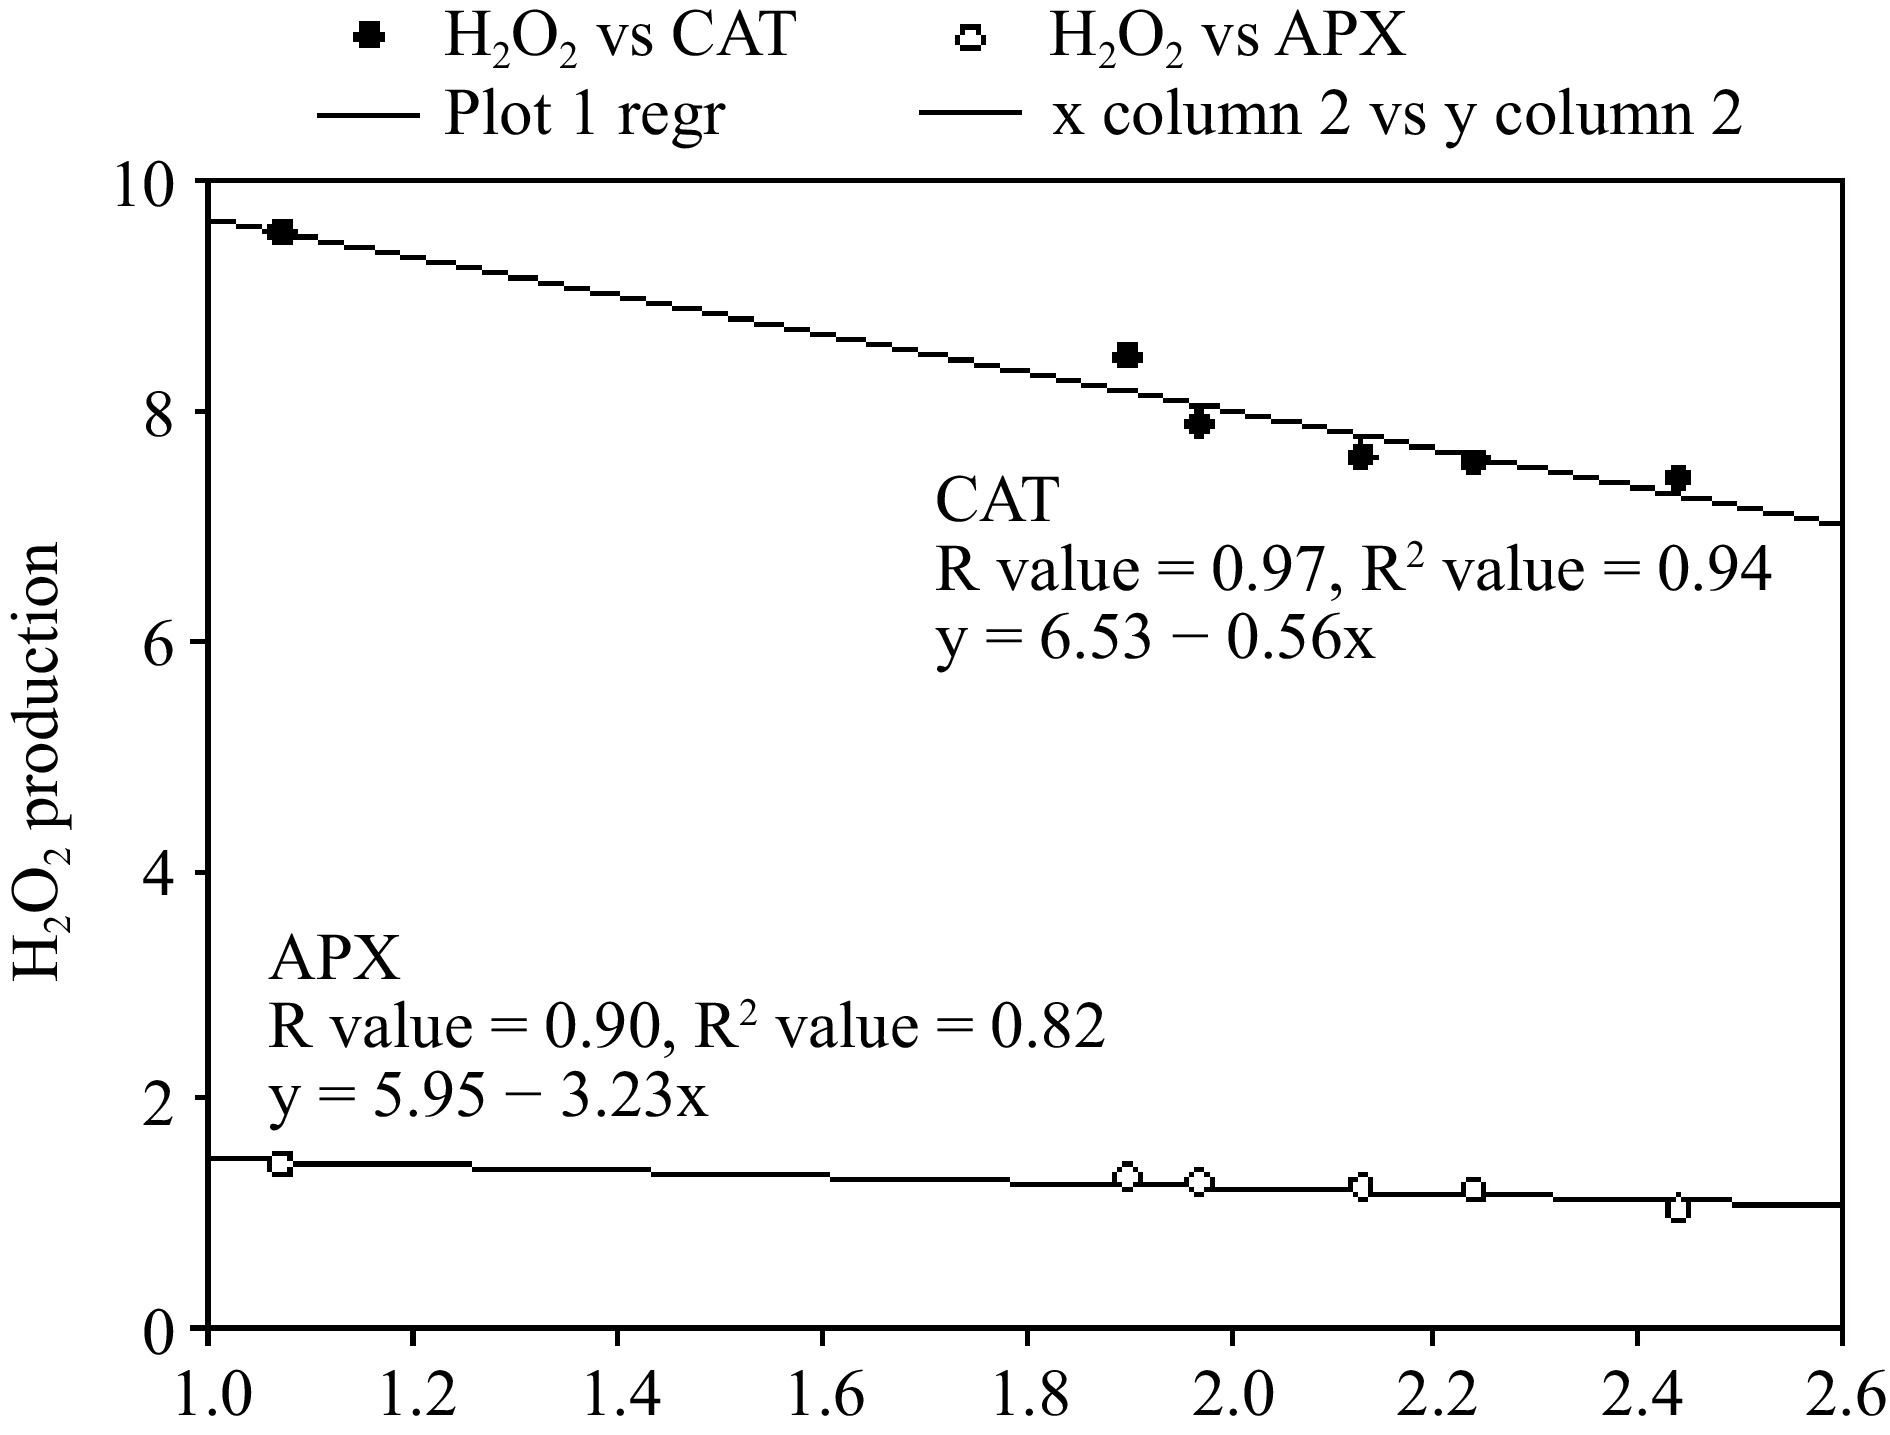
Figure 6.
Regression analysis to estimate the correlation of H2O2 with ascorbate peroxidase (APX) and catalase (CAT) in Beta vulgaris L. plants treated with combined EC50 Cd dose and different doses of Zn at 45 DAE. X-axis shows enzymatic antioxidants.
-
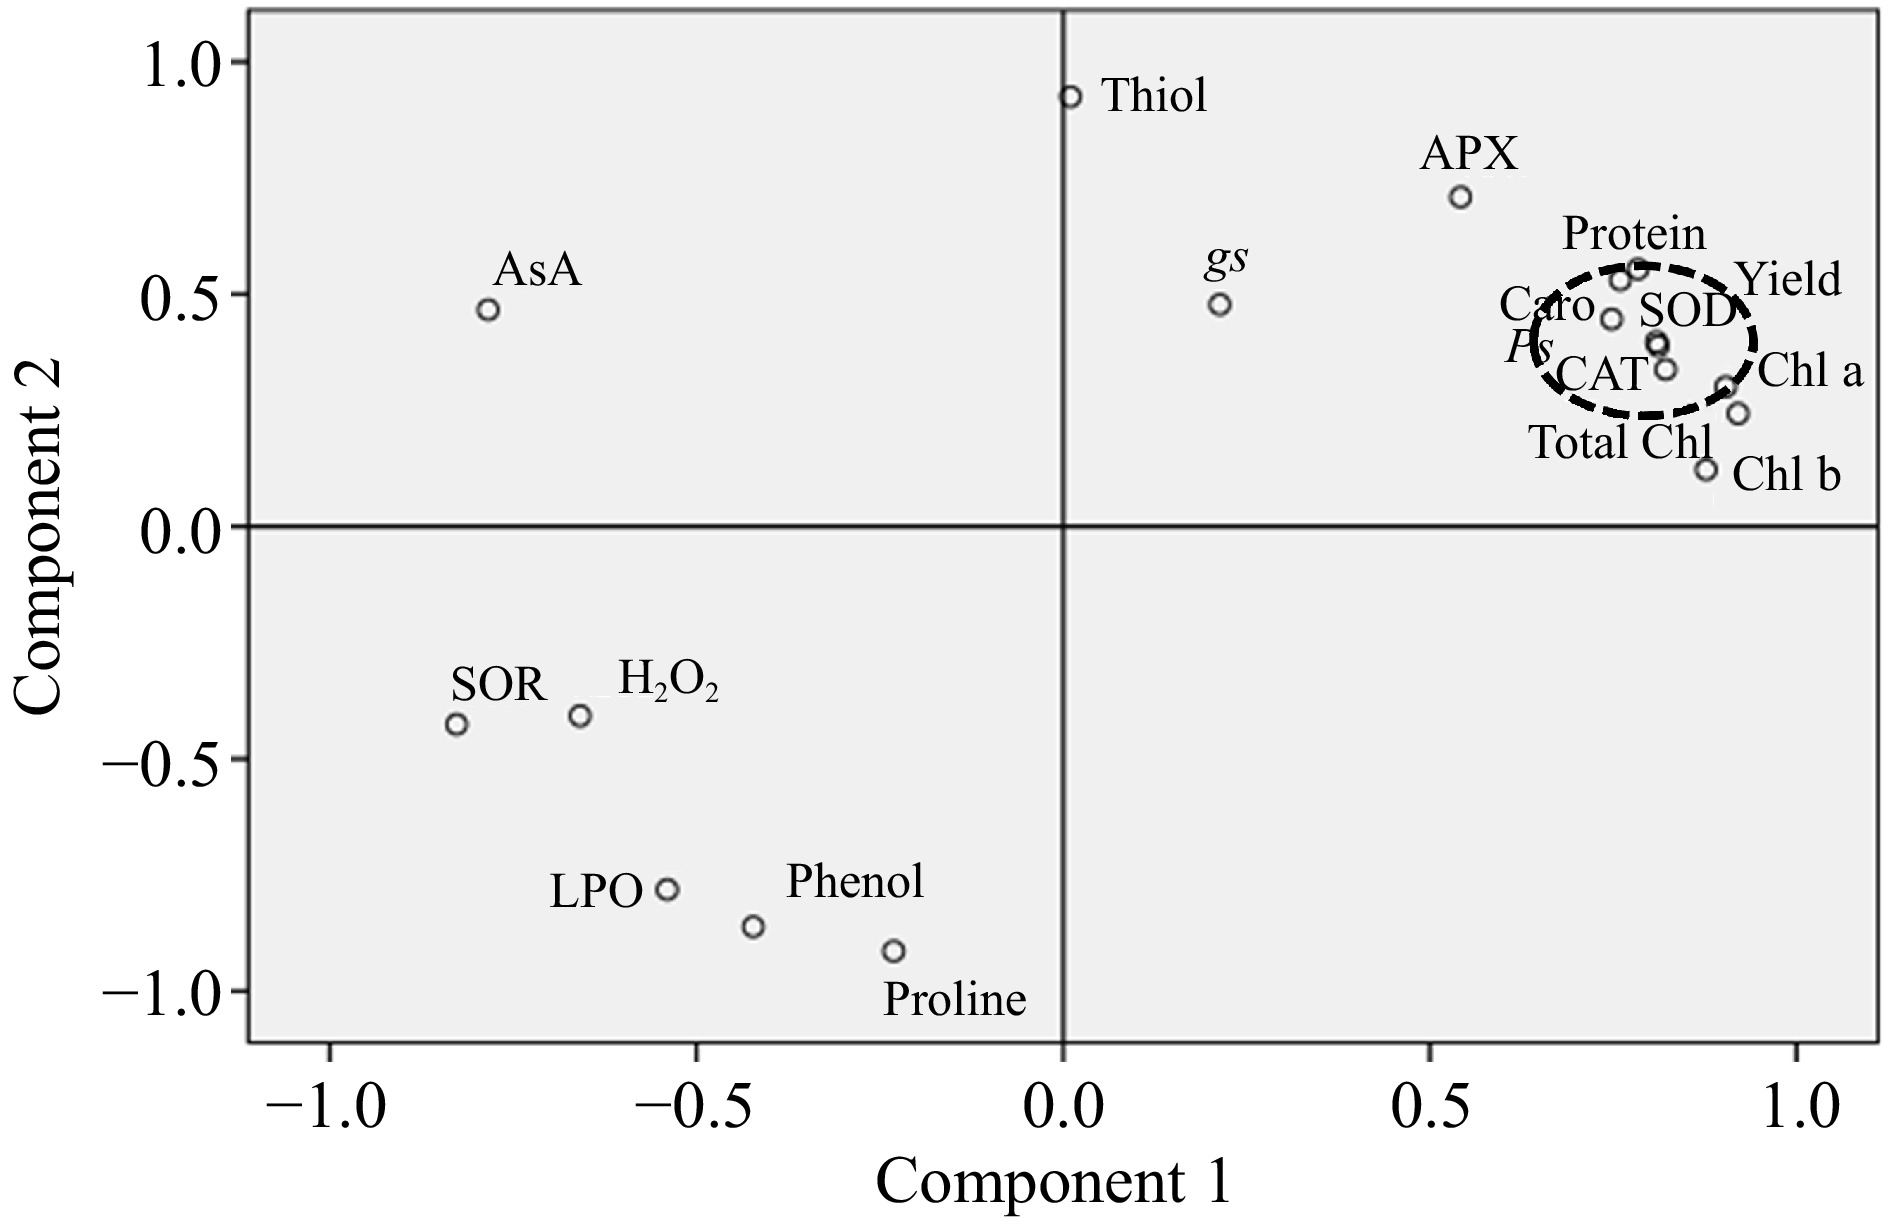
Figure 7.
Principal component analysis (PCA) showing the effect of cadmium (Cd) and zinc (Zn) on considered biochemical, physiological and yield parameters of spinach. The parameters studied are Total Chl (total chlorophyll), Chl a (chlorophyll a), Chl b (chlorophyll b), Caro (carotenoids), AsA (ascorbic acid), phenol, proline, APX (ascorbate peroxidase), SOD (superoxide dismutase), CAT (catalase), gs (stomatal conductance), Ps (rate of photosynthesis), Thiol, Protein, LPO (lipid peroxidation), H2O2 (hydrogen peroxide), and SOR (superoxide radical). Black dotted circles showed the synchronization of SOD and CAT.
-
Treatment Rate of photosynthesis
(Ps; mmol CO2/m2/s)Stomatal gas conductance
(gs; mmol CO2/m2/s)EC50 16.56cd ± 0.376 1.40c ± 0.25 EC50 + Zn100 17.11c ± 0.664 1.48b ± 0.05 EC50 + Zn200 18.20b ± 0.459 1.51b ± 0.25 EC50 + Zn300 20.31a ± 0.344 1.55a ± 0.09 EC50 + Zn400 16.88cd ± 0.485 1.28d ± 0.11 EC50 + Zn500 15.82e ± 0.437 1.20d ± 0.05 Values are mean ± S.E. Different letters indicate significant variation at p < 0.05. Table 1.
Variation in rate of photosynthesis (Ps; mmol CO2/m2/s) and stomatal conductance (gs; mmol CO2/m2/s) of Beta vulgaris L. plants treated with combined EC50 Cd and doses of Zn at 45 DAE.
Figures
(7)
Tables
(1)