-
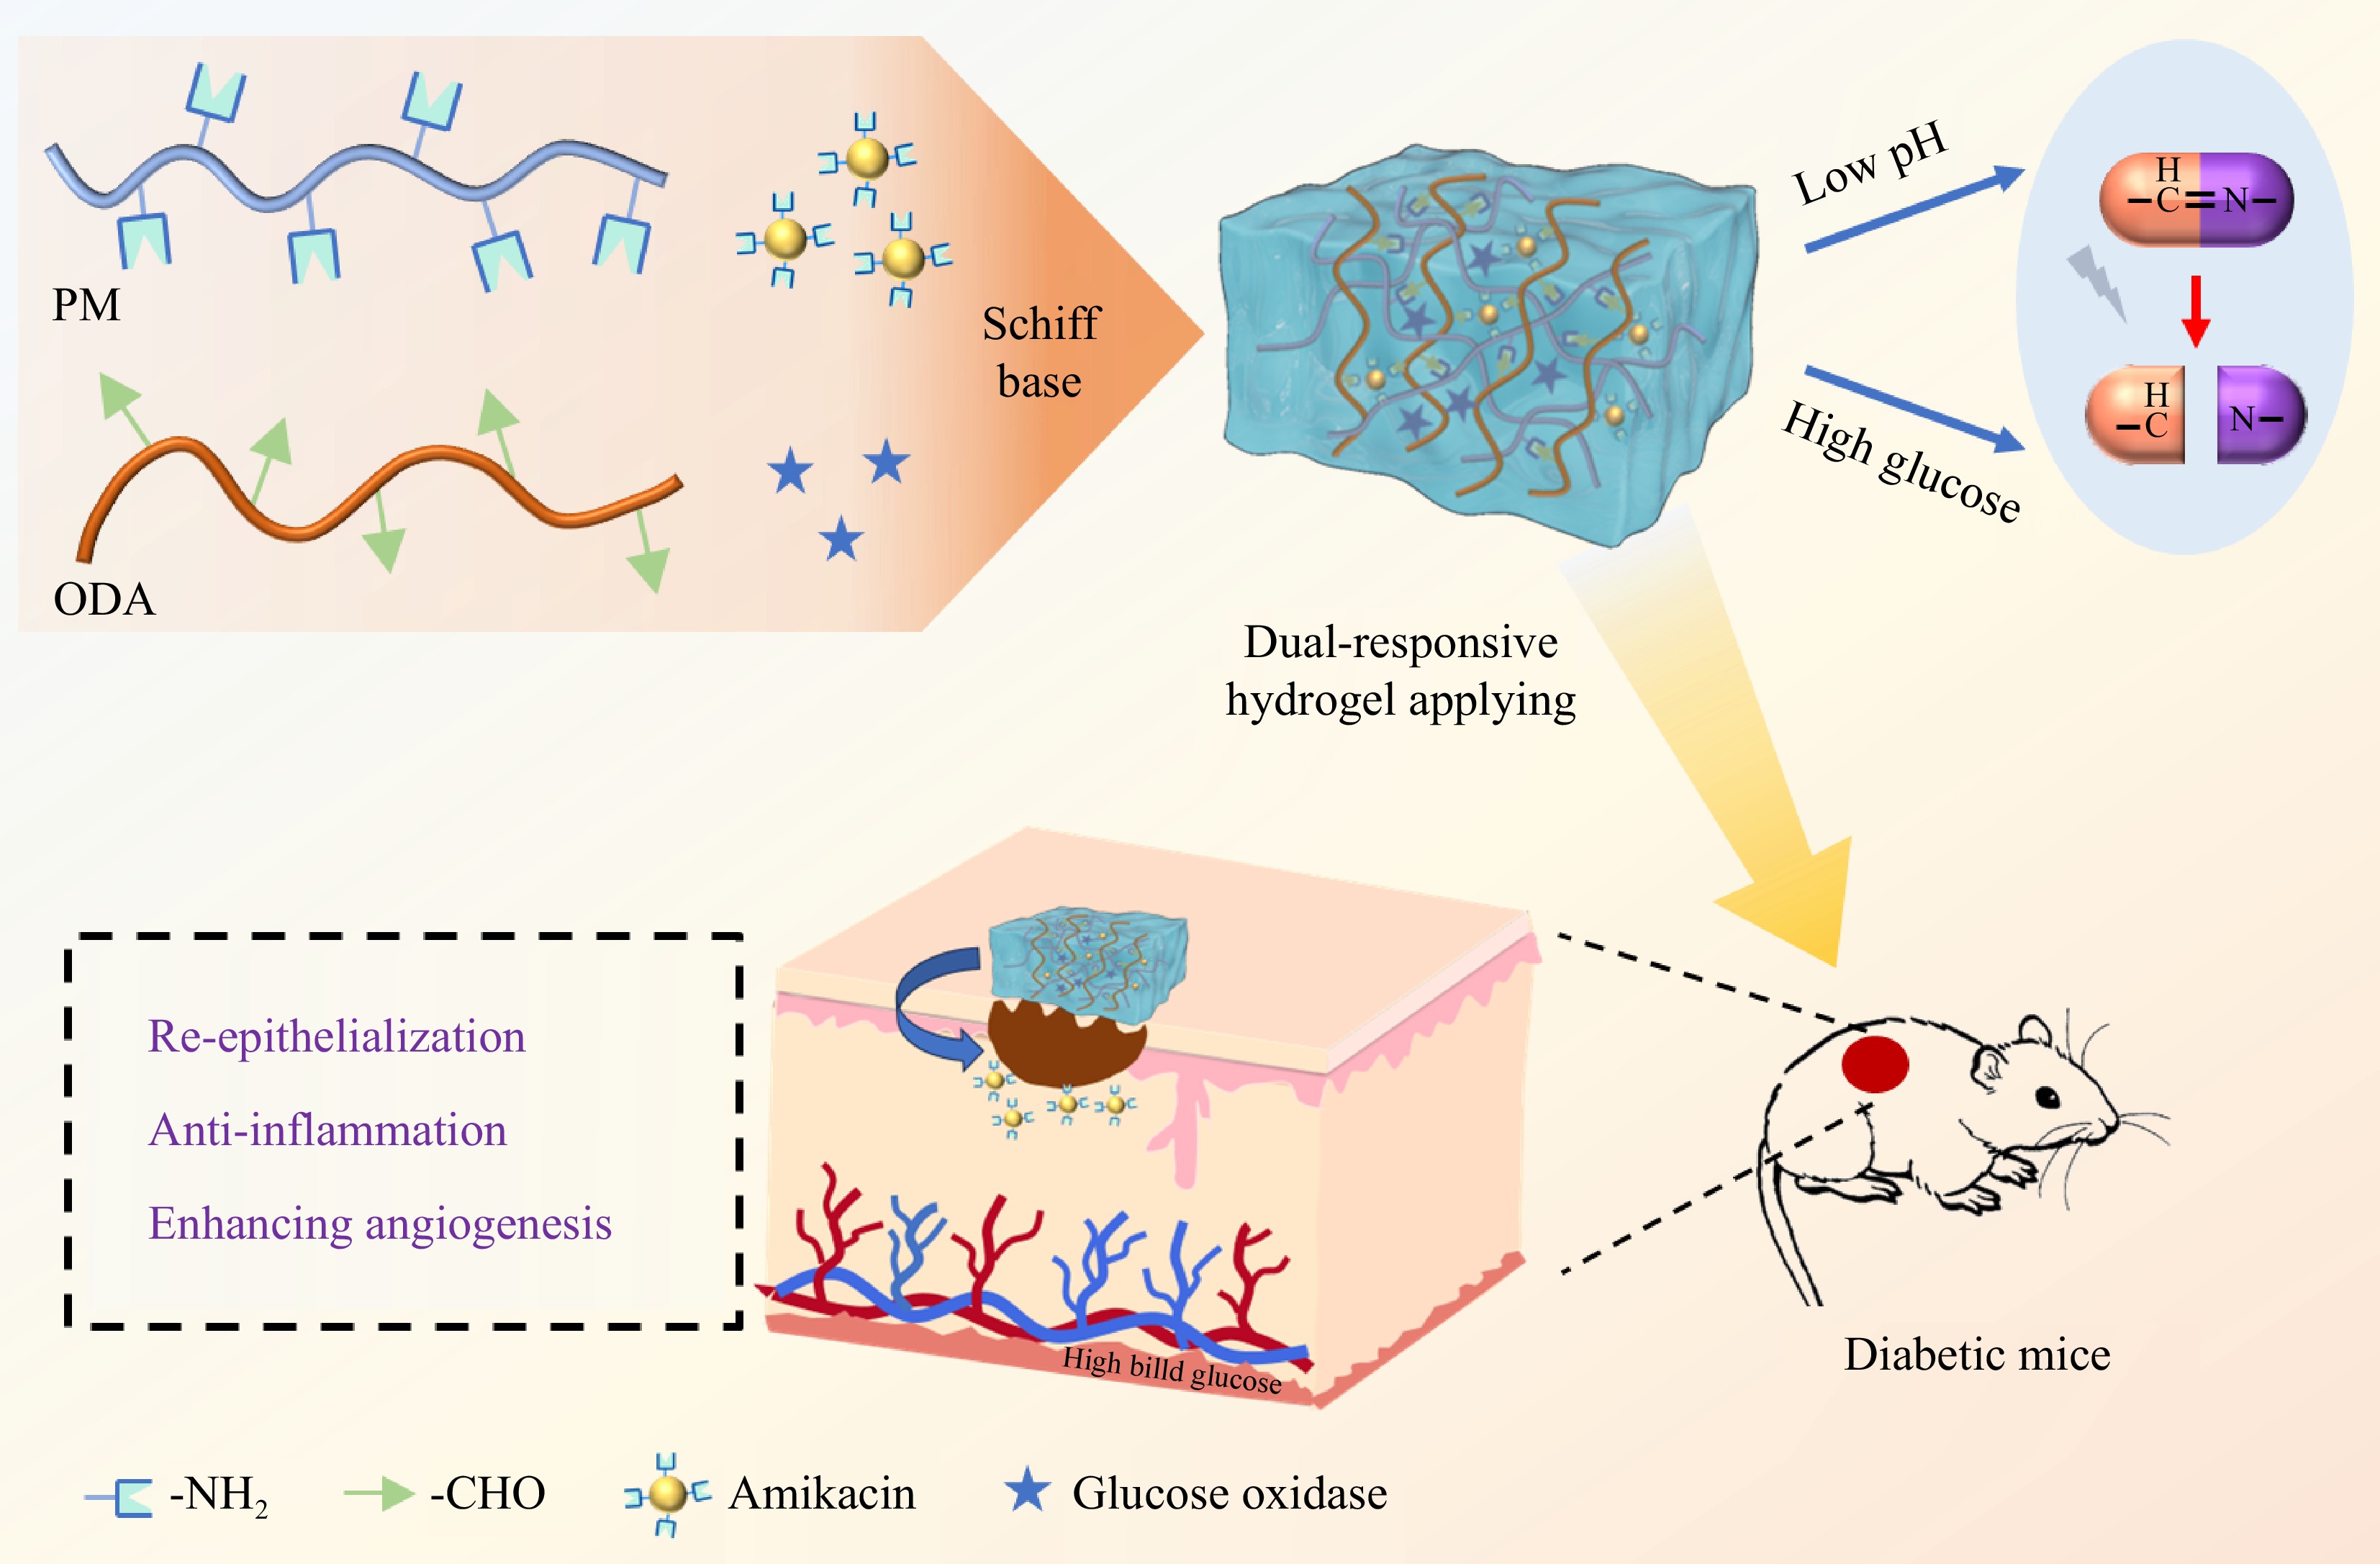
Figure 1.
Schematic illustration of the preparation procedures of the pH/glucose dual-responsive hydrogel dressing for promoting chronic wound healing in the diabetic C57BL/6N mouse model.
-
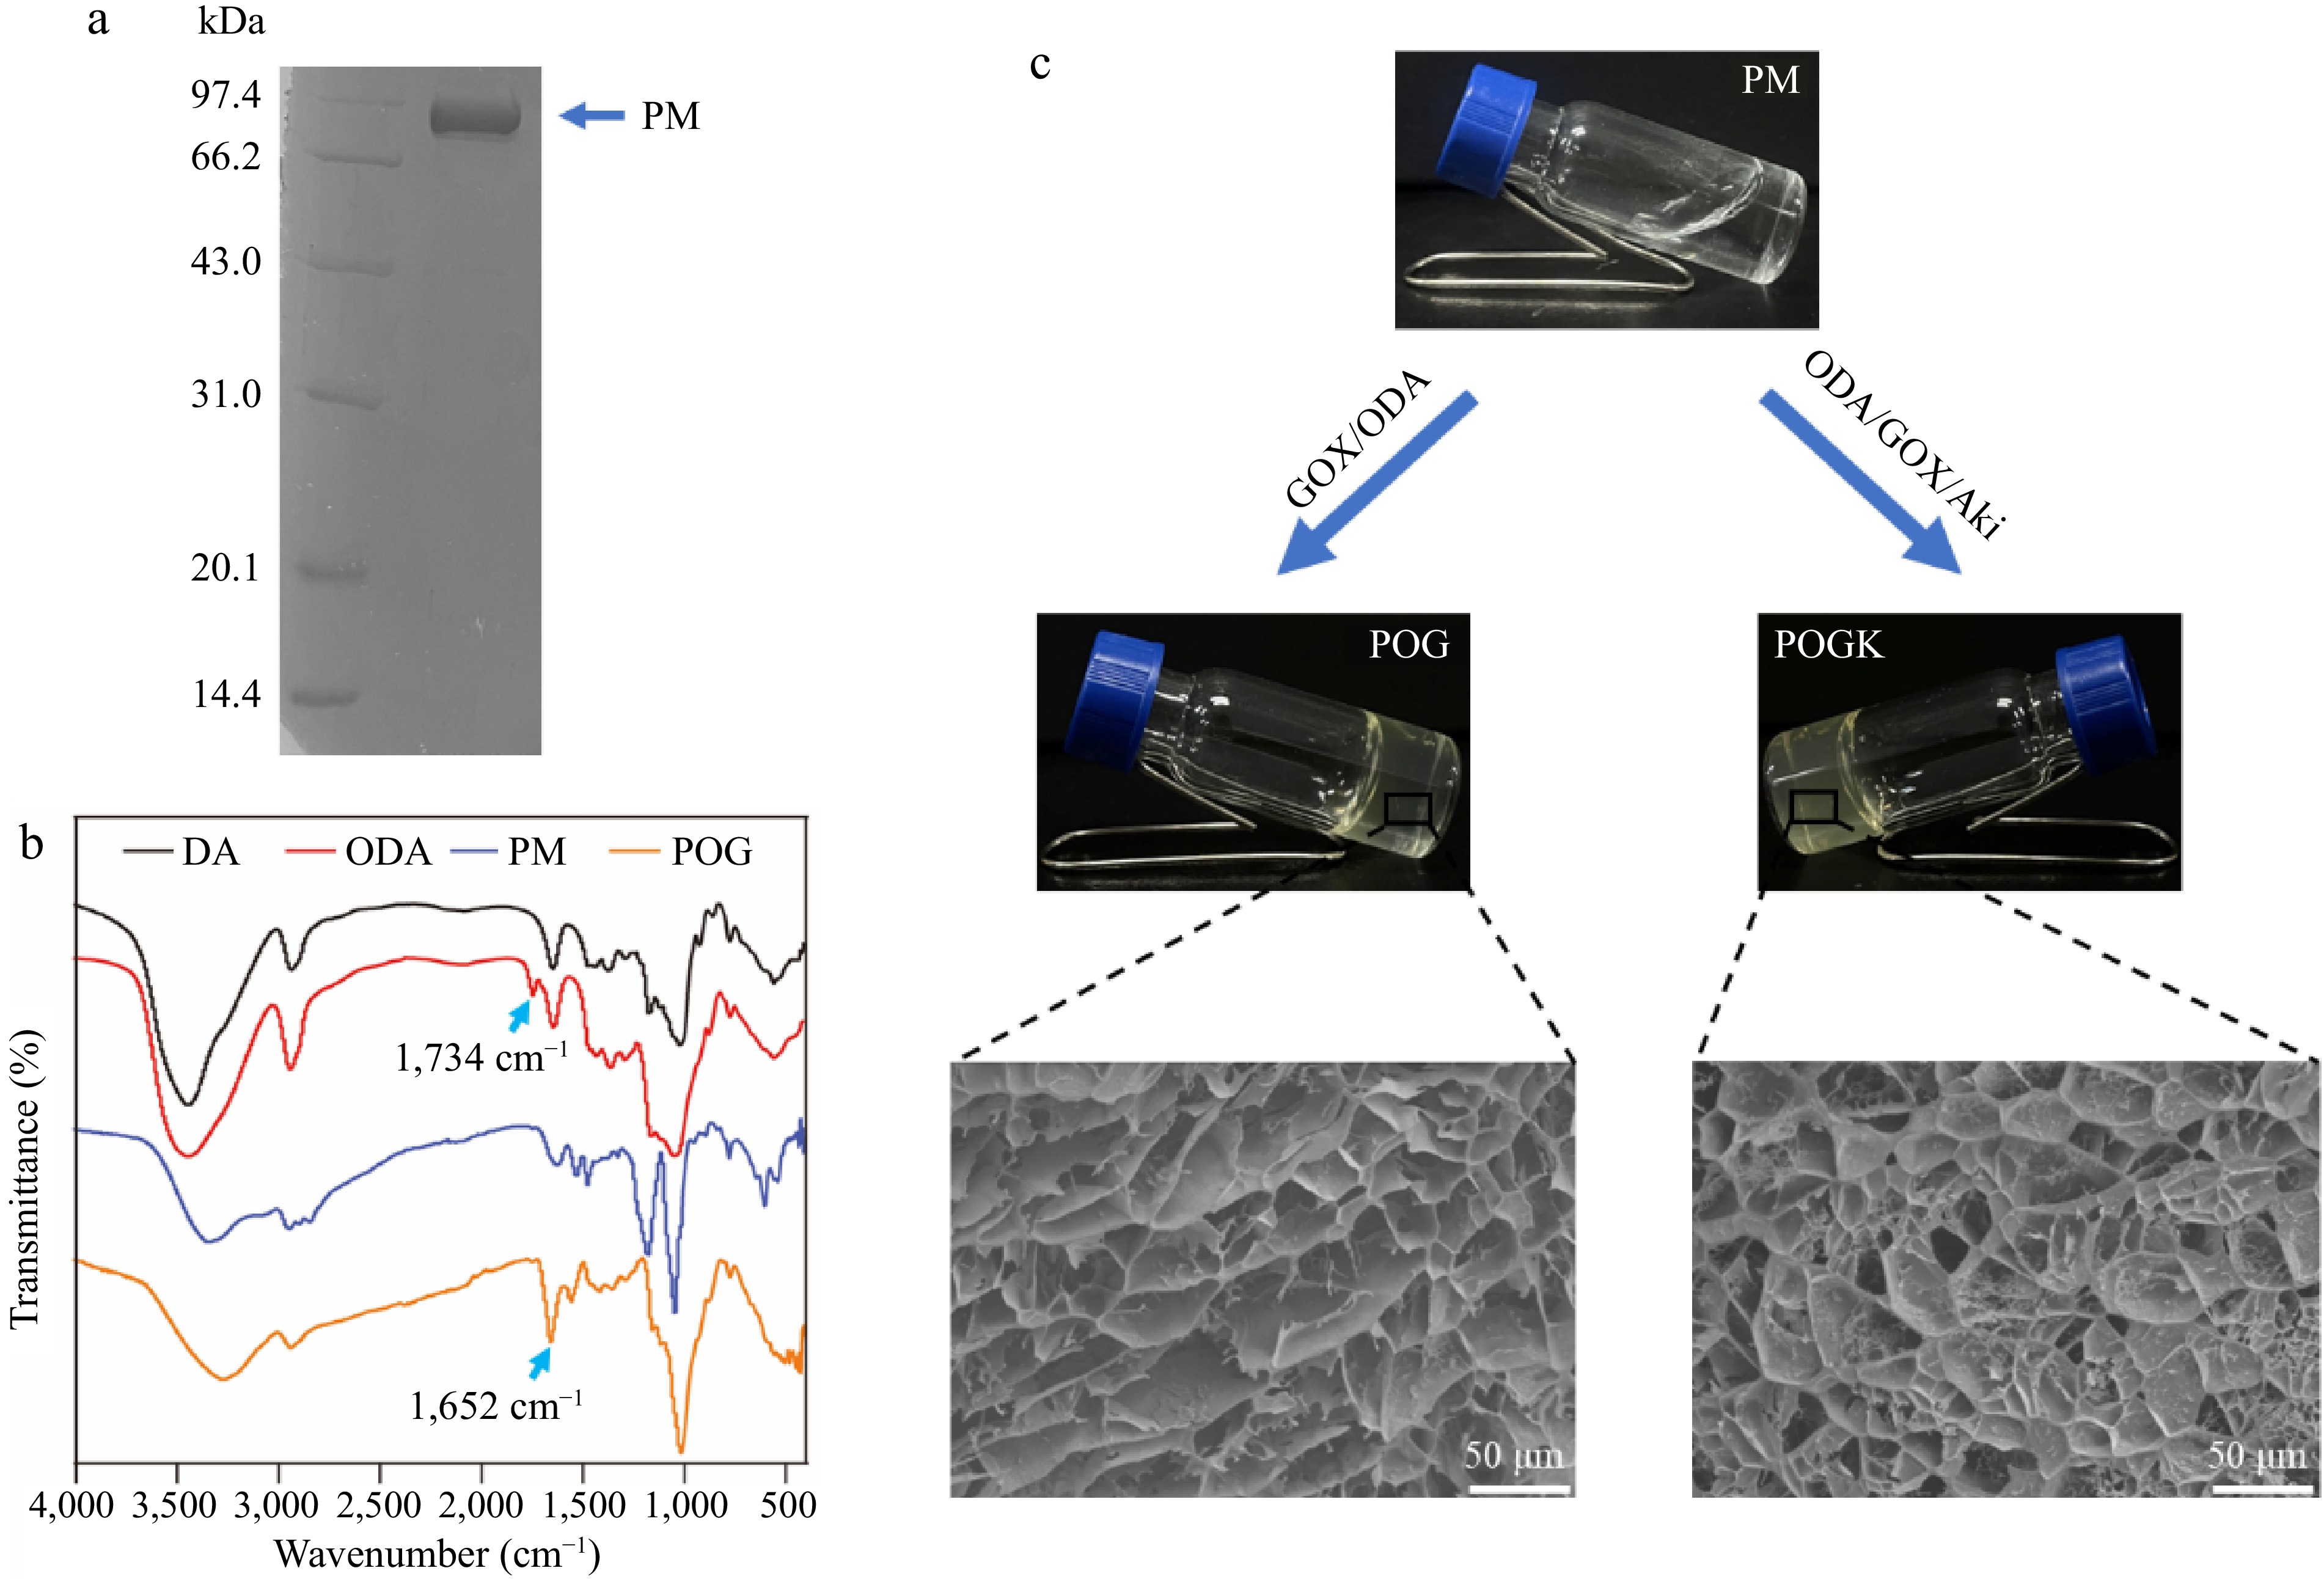
Figure 2.
Characterization of the hydrogels. (a) SDS-PAGE analysis of the purified paramyosin. (b) FTIR spectra of the DA, ODA, POG, and POGK. (c) Optical photos of the formation of POG and POGK hydrogels. The inset images were the SEM observations of POG and POGK hydrogels.
-
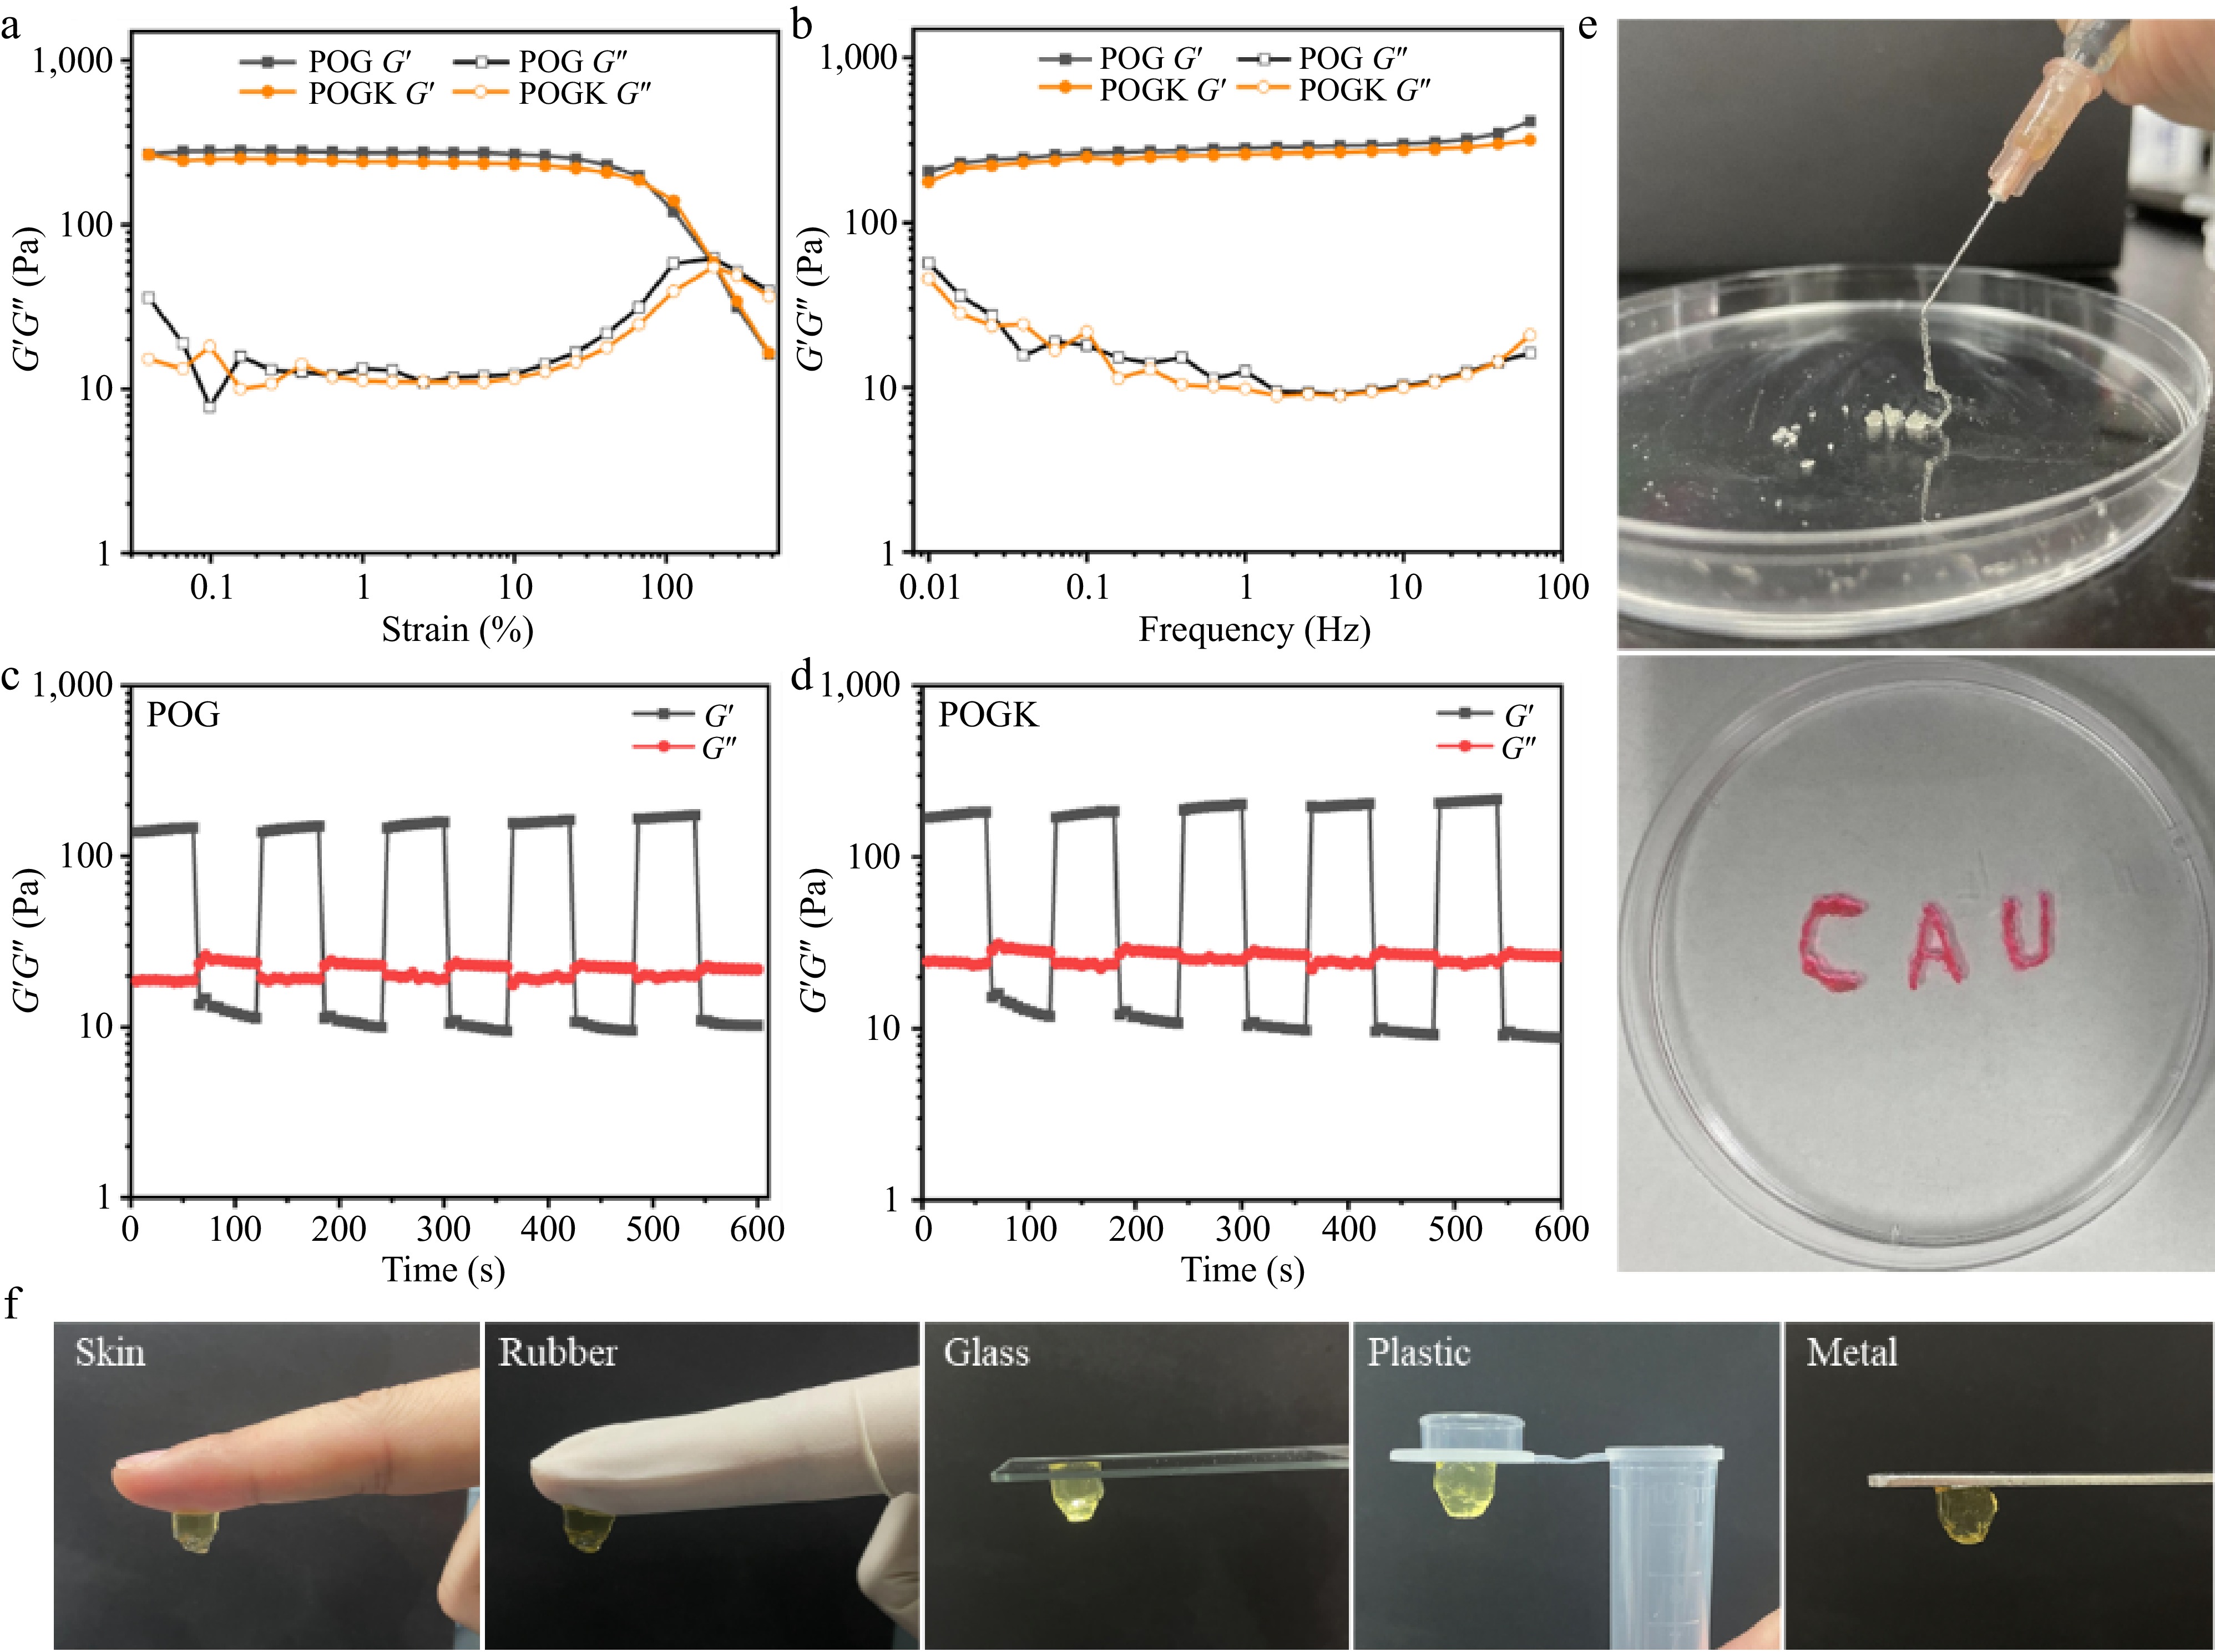
Figure 3.
Characterization of the rheological properties, injection ability, and adhesion behavior of the protein hydrogels. (a) Strain sweep measurement of POG and POGK hydrogels with a set frequency of 1 Hz. (b) Dynamic frequency–sweep measurements of the POG and POGK hydrogels. Step-strain measurements of the (c) POG, and (d) POGK over five cycles at different strain. (e) Photos showing the injection of the POGK hydrogel. The red color of the hydrogel was from the embedded Rhodamine 6G. (f) Photographs of POGK hydrogel adhering to skin, rubber, glass, plastic, and steel.
-
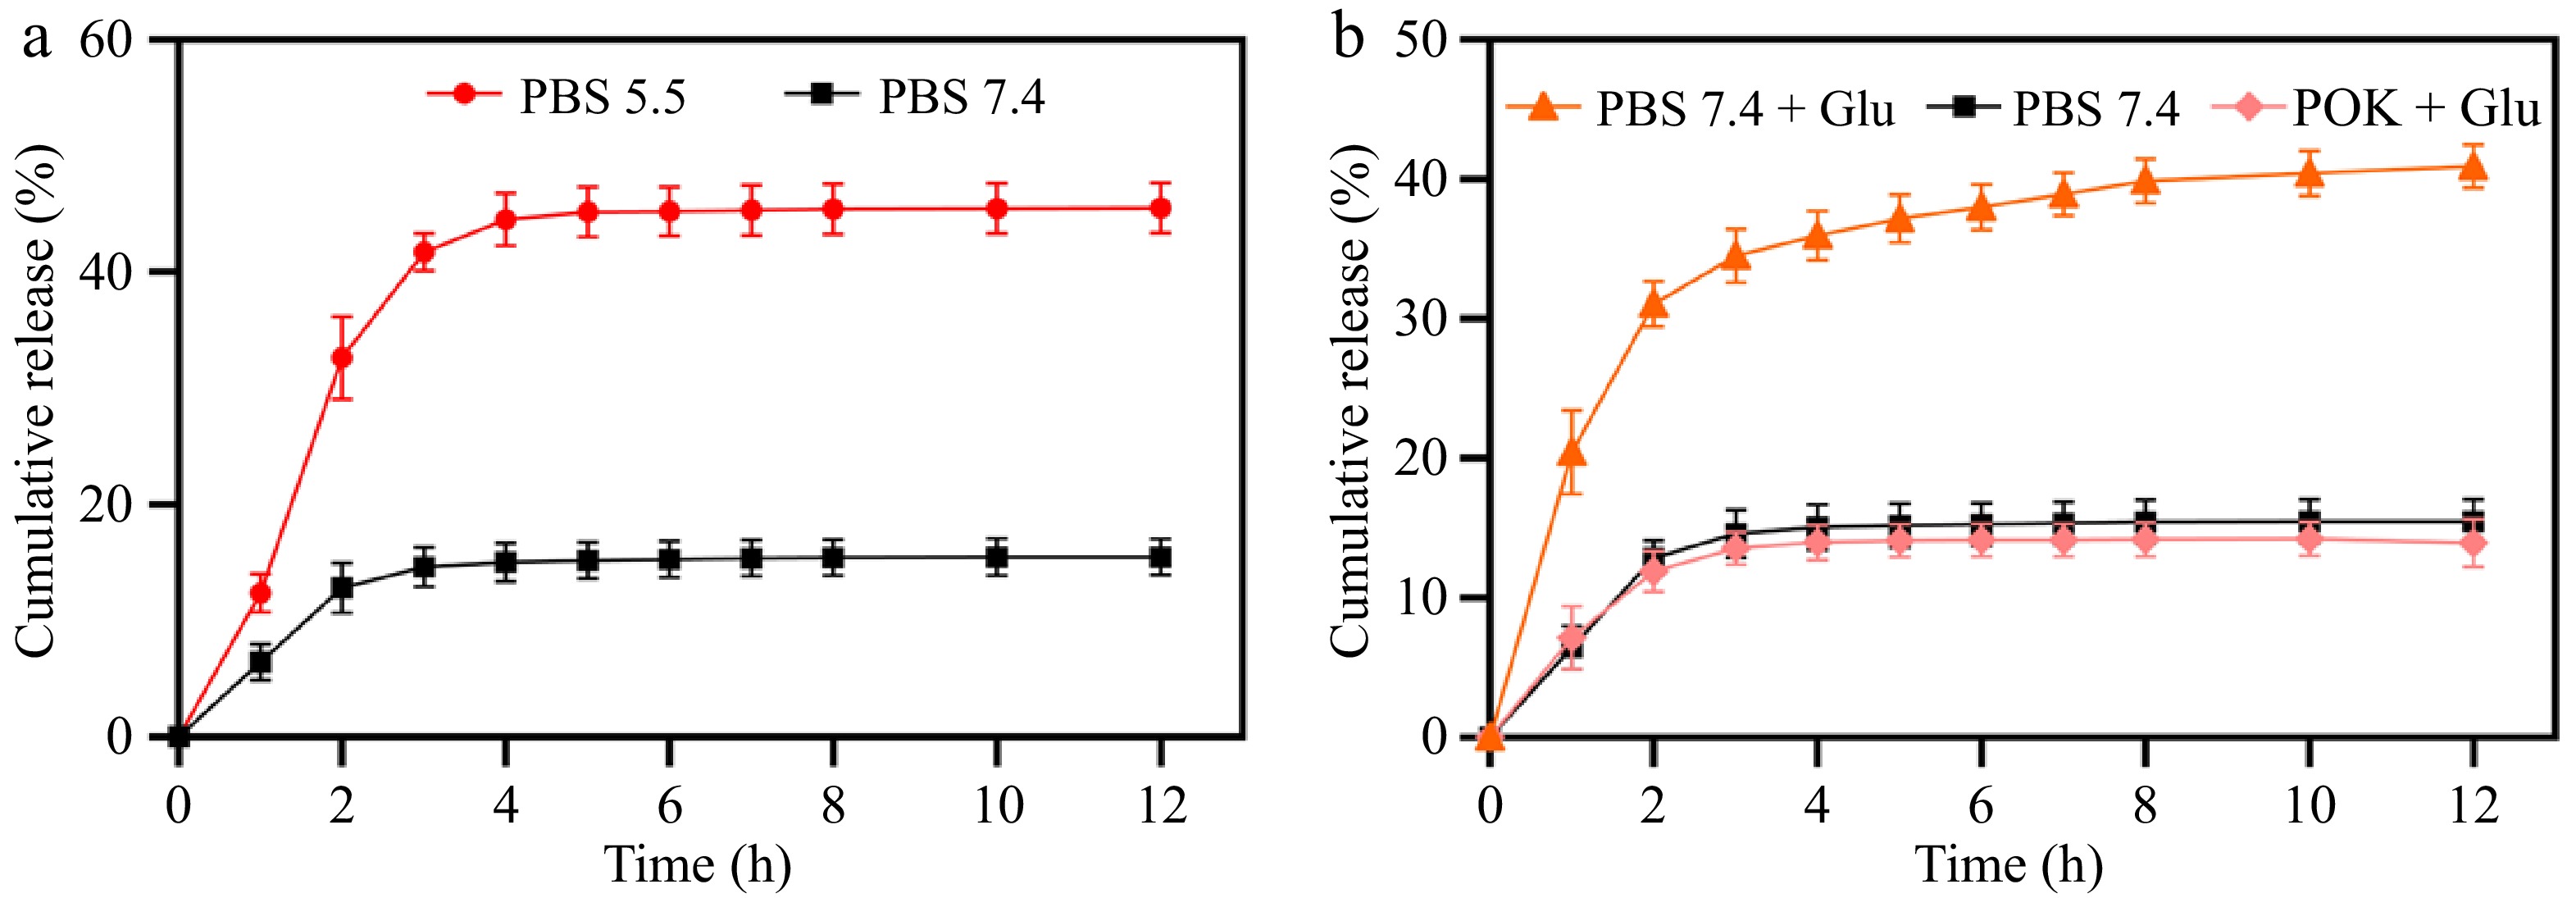
Figure 4.
Responsive release kinetics of amikacin from POGK hydrogels to (a) pH, and (b) glucose stimulation.
-
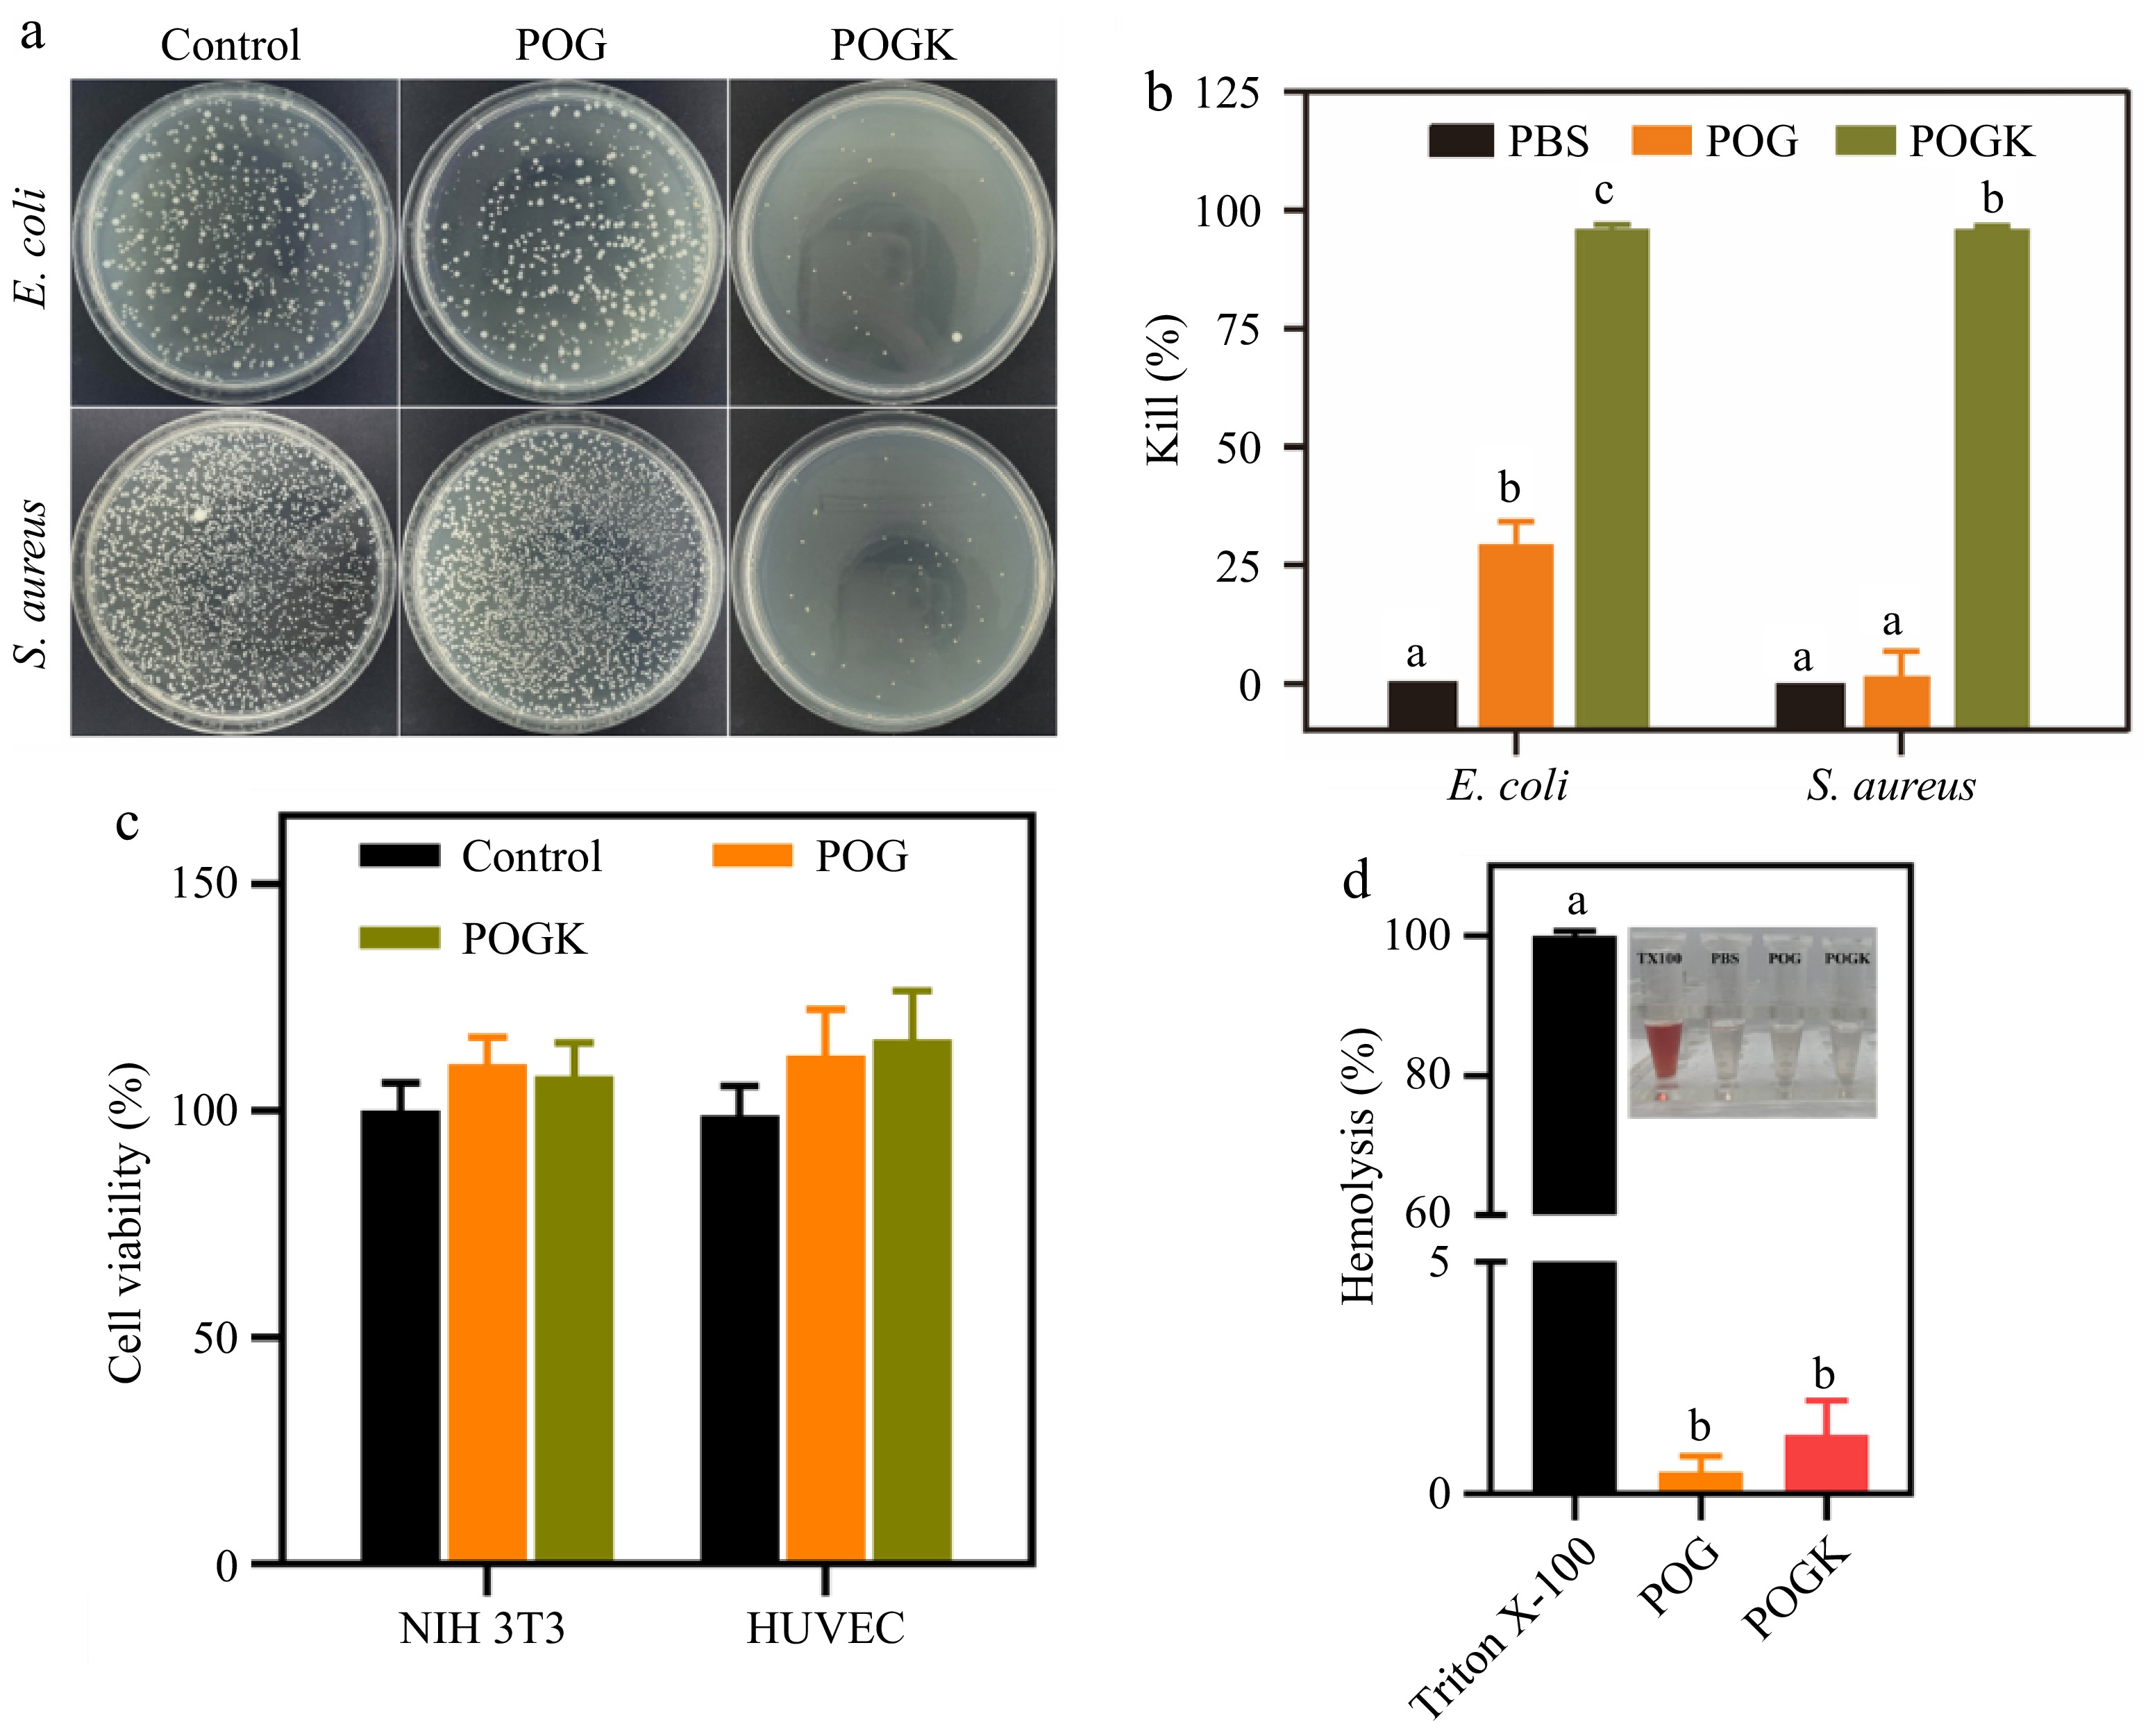
Figure 5.
In vitro bacterial growth inhibition and cytocompatibility of hydrogels. (a) Photos of making it through bacterial clones on LB plates after various treatments. (b) Corresponding bacteria-killing effectiveness against E. coli and S. aureus (n = 3). (c) Cell feasibility of NIH 3T3 and HUVECs after hydrogel treatment for 6 h. (d) Quantitative hemolysis ratio of 0.1% Triton X-100, POG and POGK hydrogels (n = 3). The insert shows the supernatants of RBCs with different treatments. Different letters in the histograms represent significant differences, p < 0.05.
-
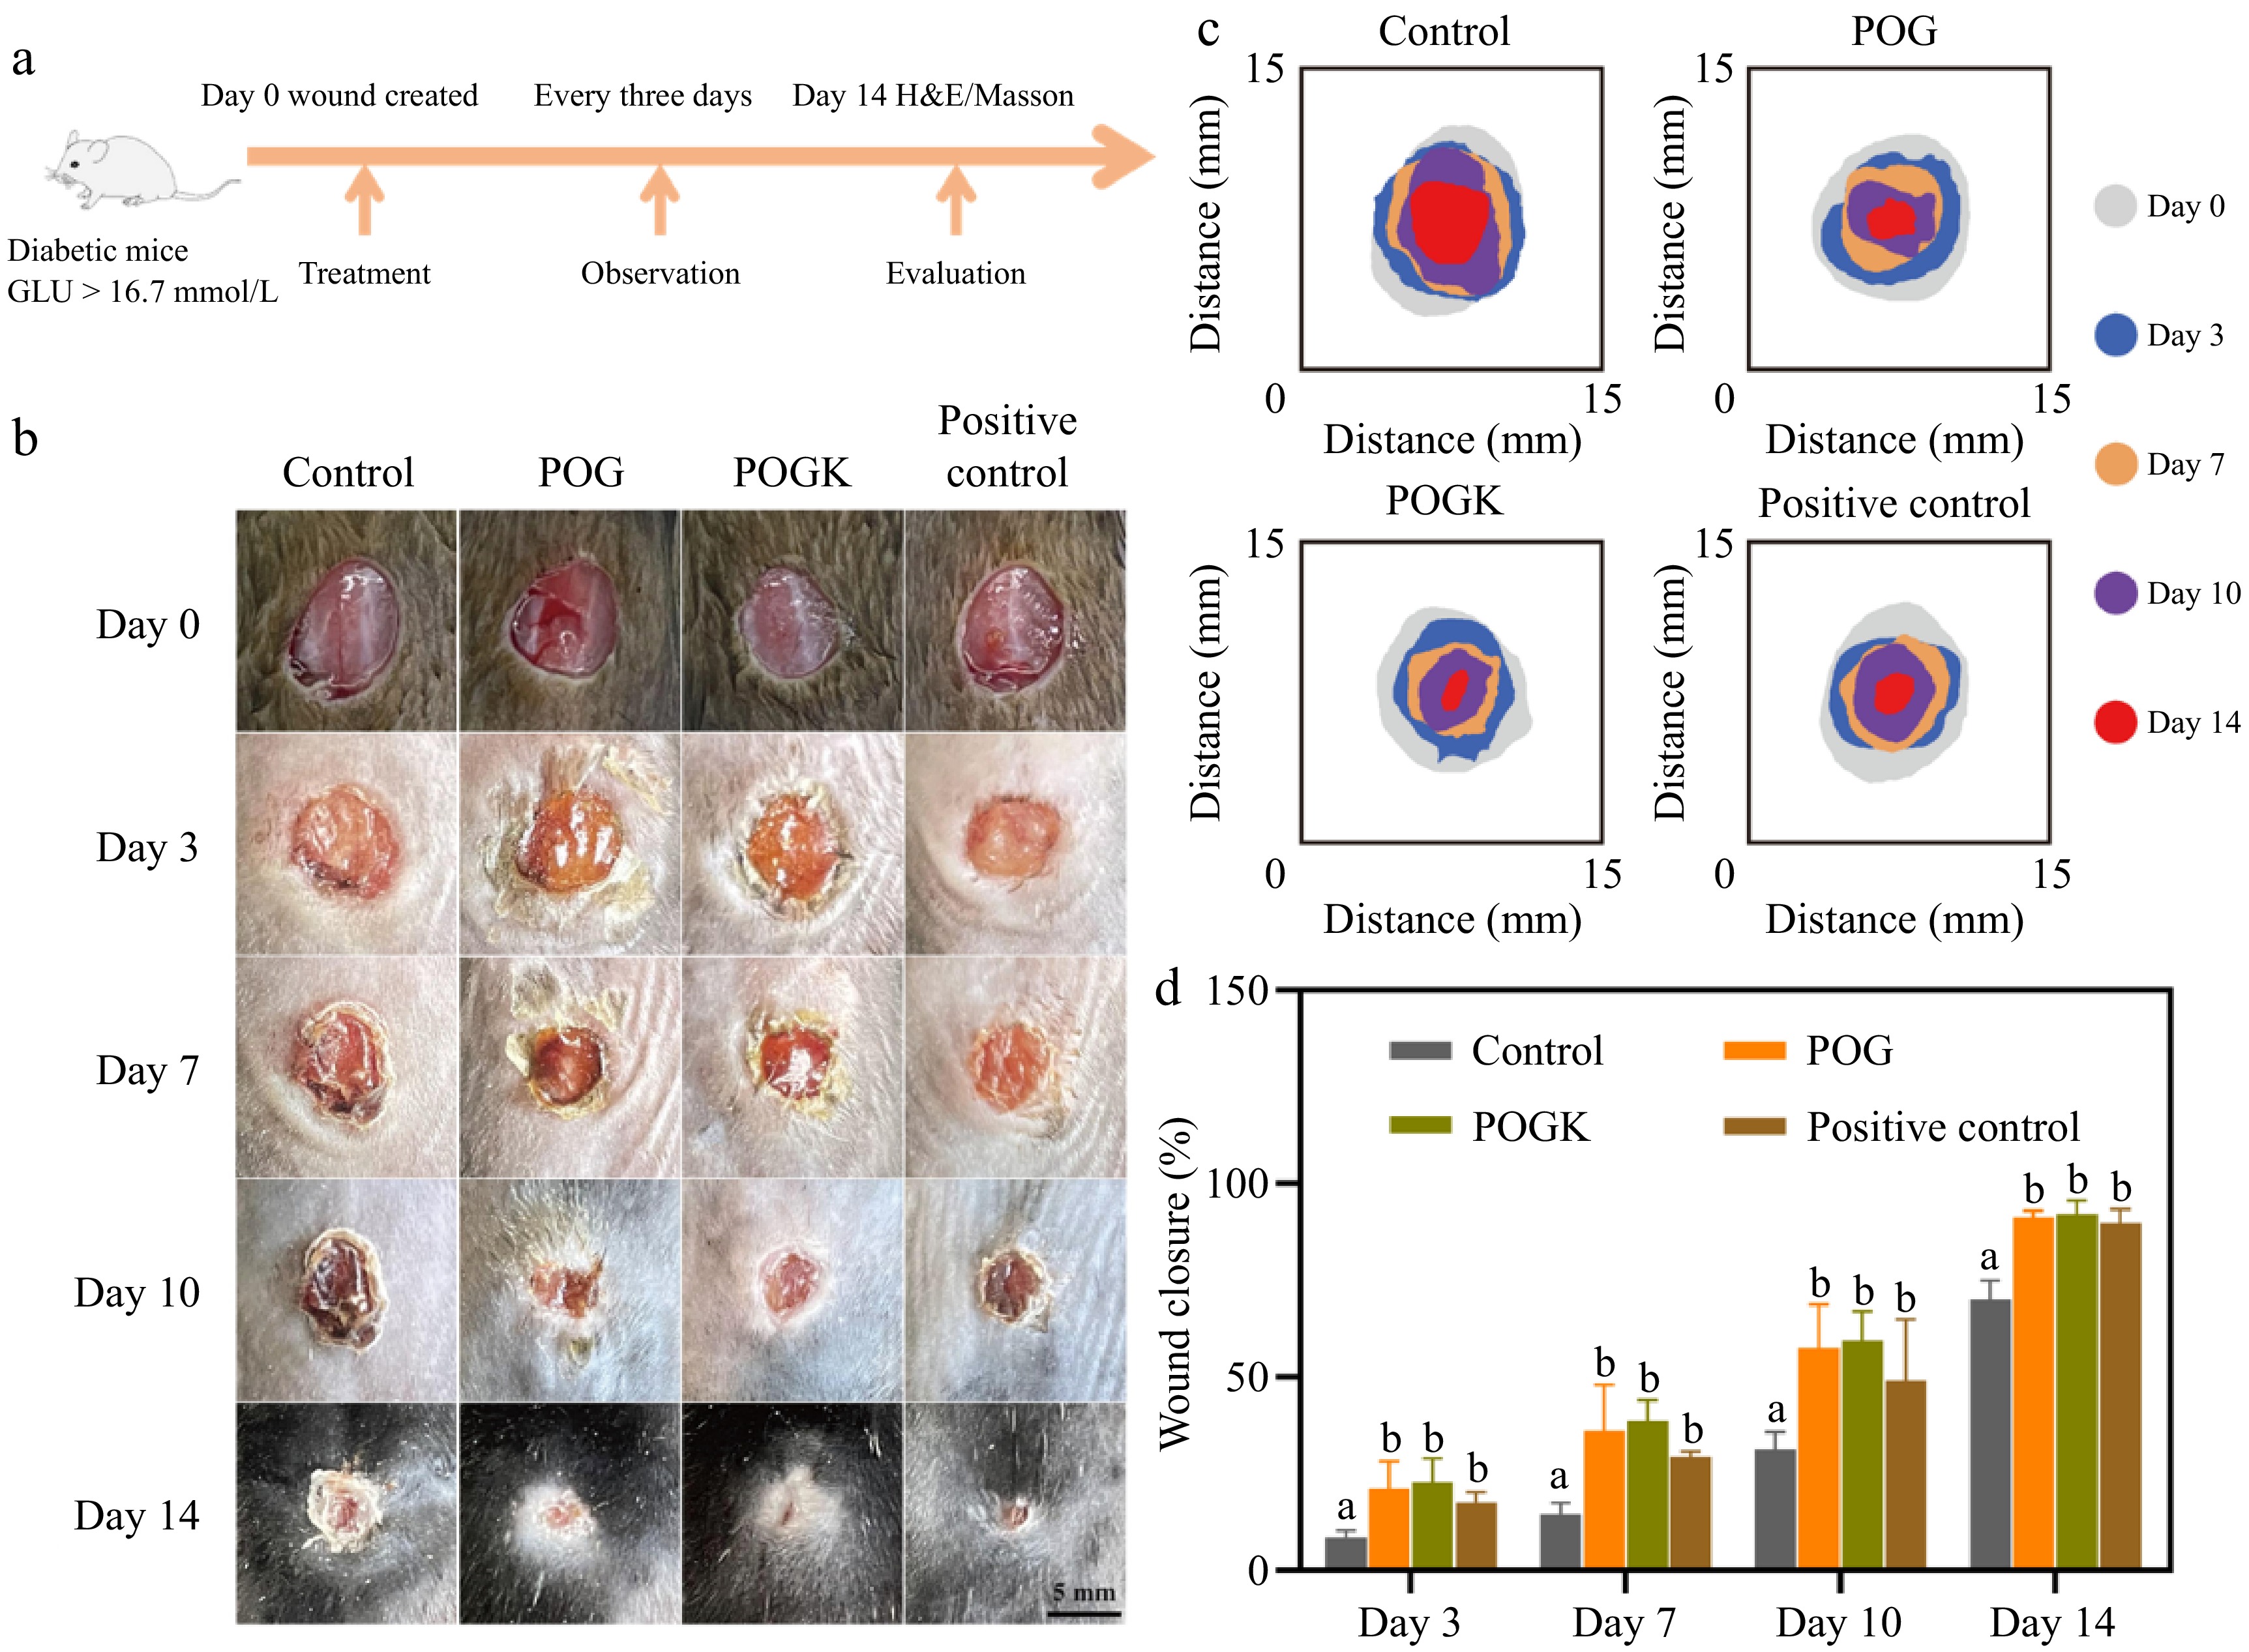
Figure 6.
Treatment efficiency of the diabetic wound by the hydrogels in diabetic C57BL/6N mouse model. (a) Schematic illustration of a diabetic wound establishment and therapy schedule. (b) Depictive pictures of the diabetic wound recovery process. Scale bar: 5 mm. (c) Schematic representation of the wound healing throughout 14 d. (d) Quantification of the wound closure rate. Different letters in the histograms represent significant differences, p < 0.05.
-
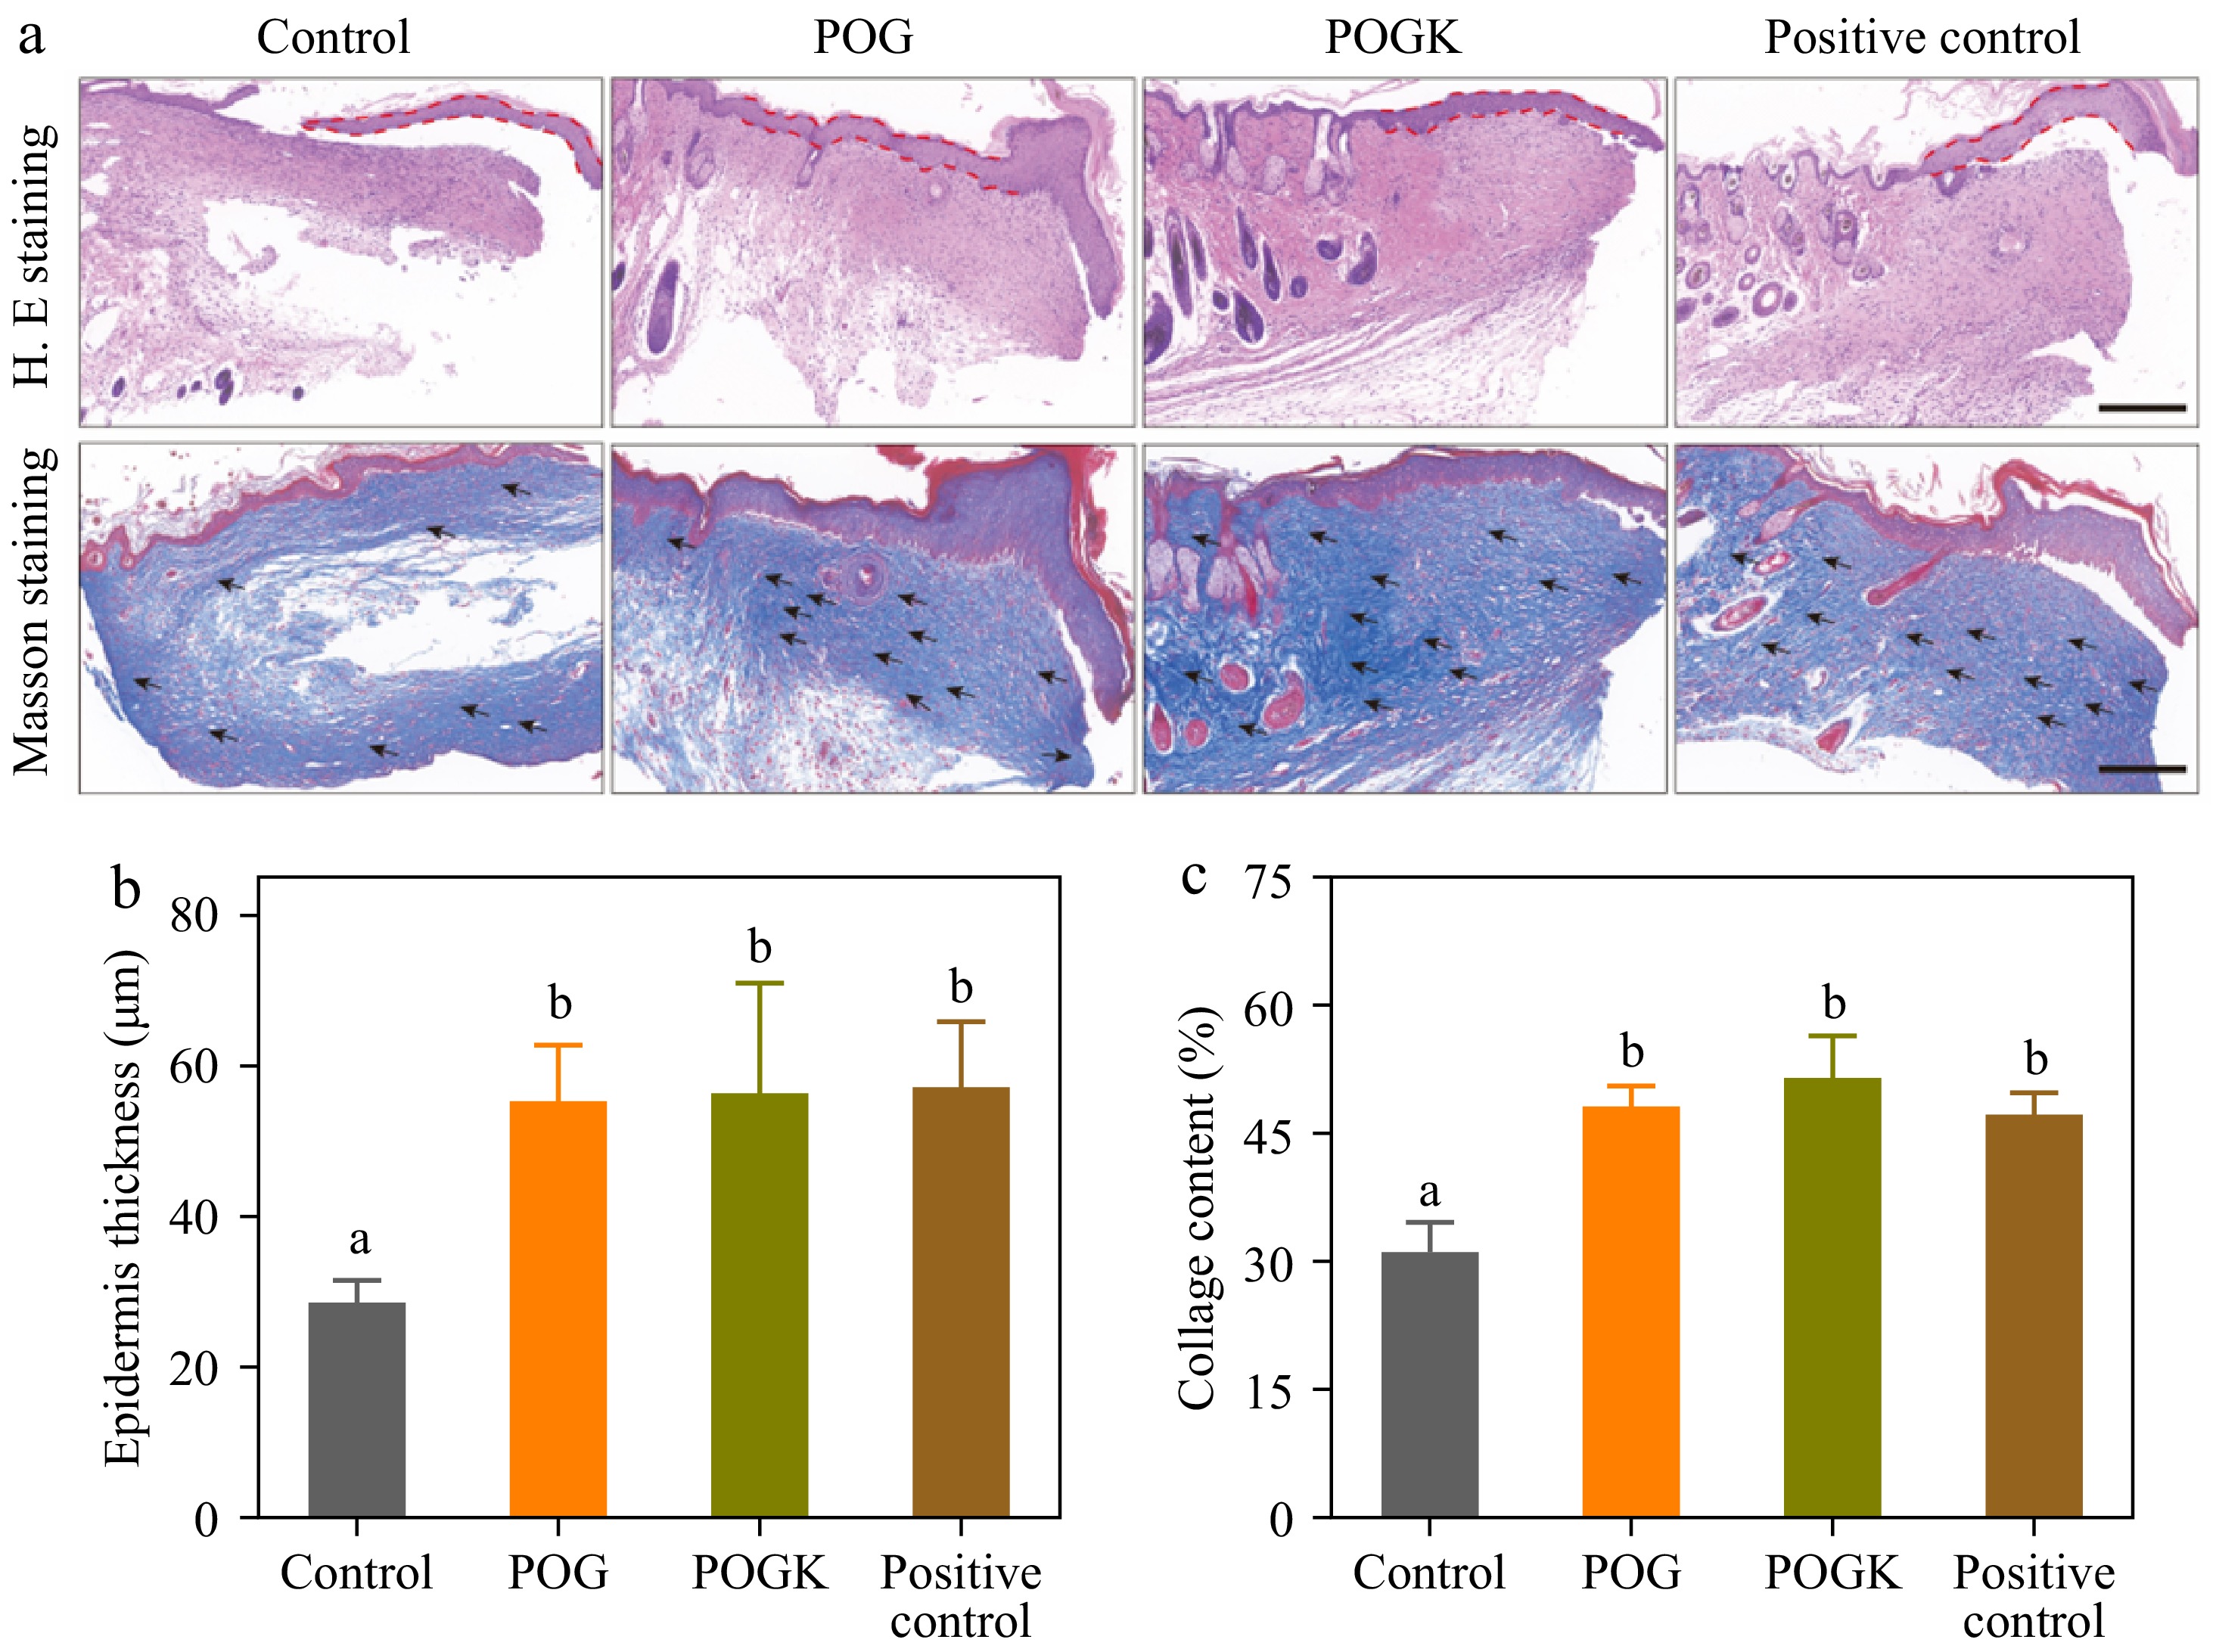
Figure 7.
Histological analysis of wounds in different groups. (a) H&E and Masson's staining of injury tissues with different therapies on day 14. Scale bars = 200 μm. Metrological evaluation of (b) epidermis thickness, and (c) collagen deposition in each group on day 14. Different letters in the histograms indicate significant differences, p < 0.05.
-
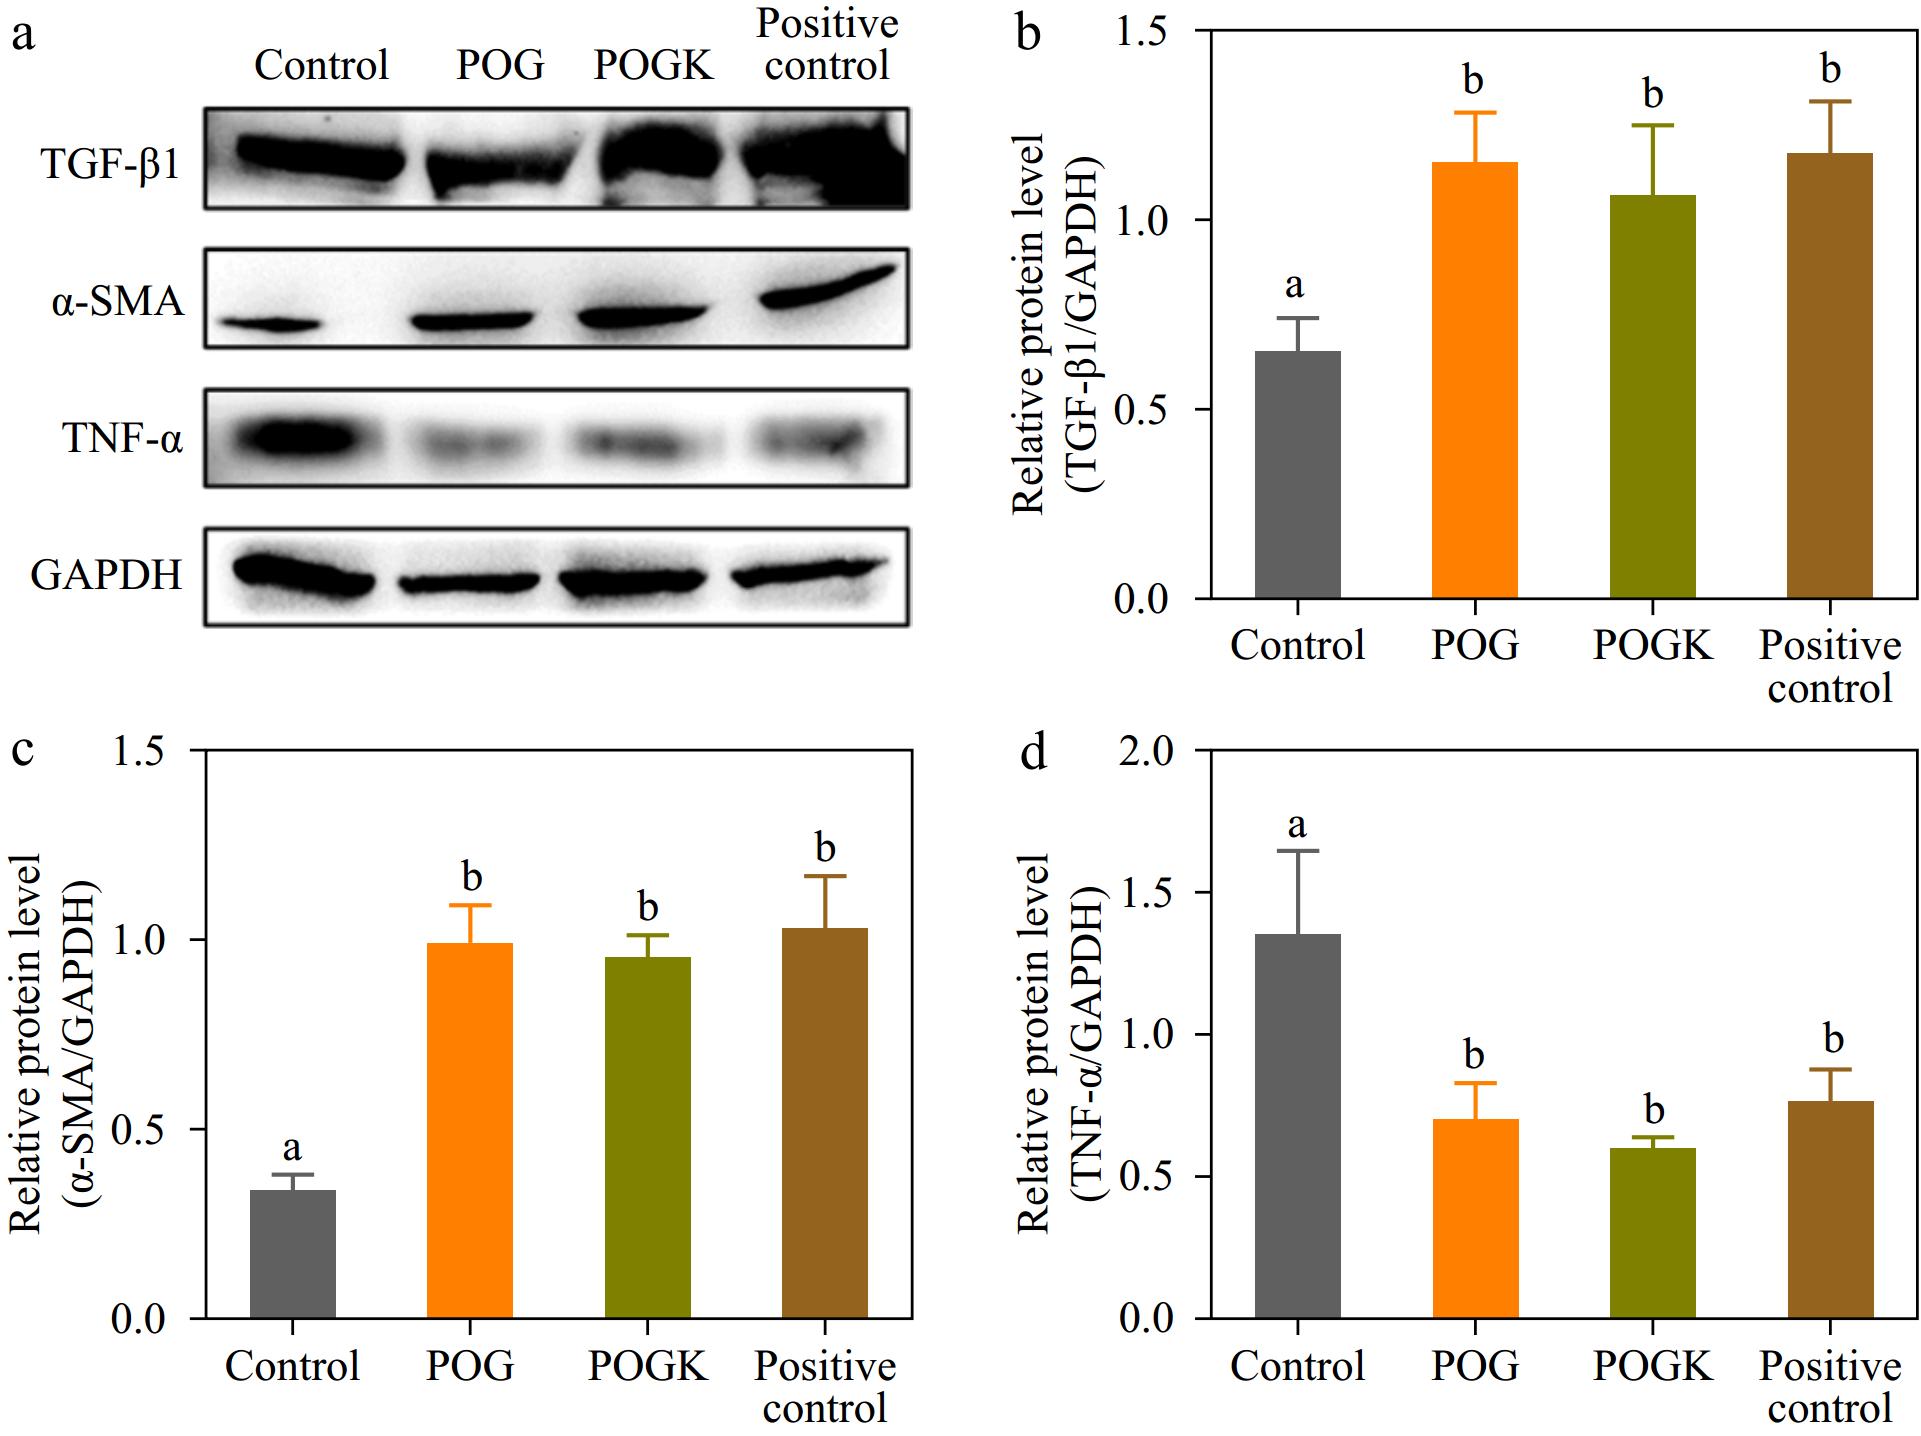
Figure 8.
Result of hydrogels on protein expression in injury tissue. (a) Protein expression level of TGF-β1, α-SMA, TNF-α, and GAPDH detected by western blot in injury tissue with various therapies at day 14. Metrological evaluation of the relative protein expression level of (b) TGF-β1, (c) α-SMA, and (d) TNF-α. Different letters in the histograms indicate significant differences, p < 0.05.
Figures
(8)
Tables
(0)