-
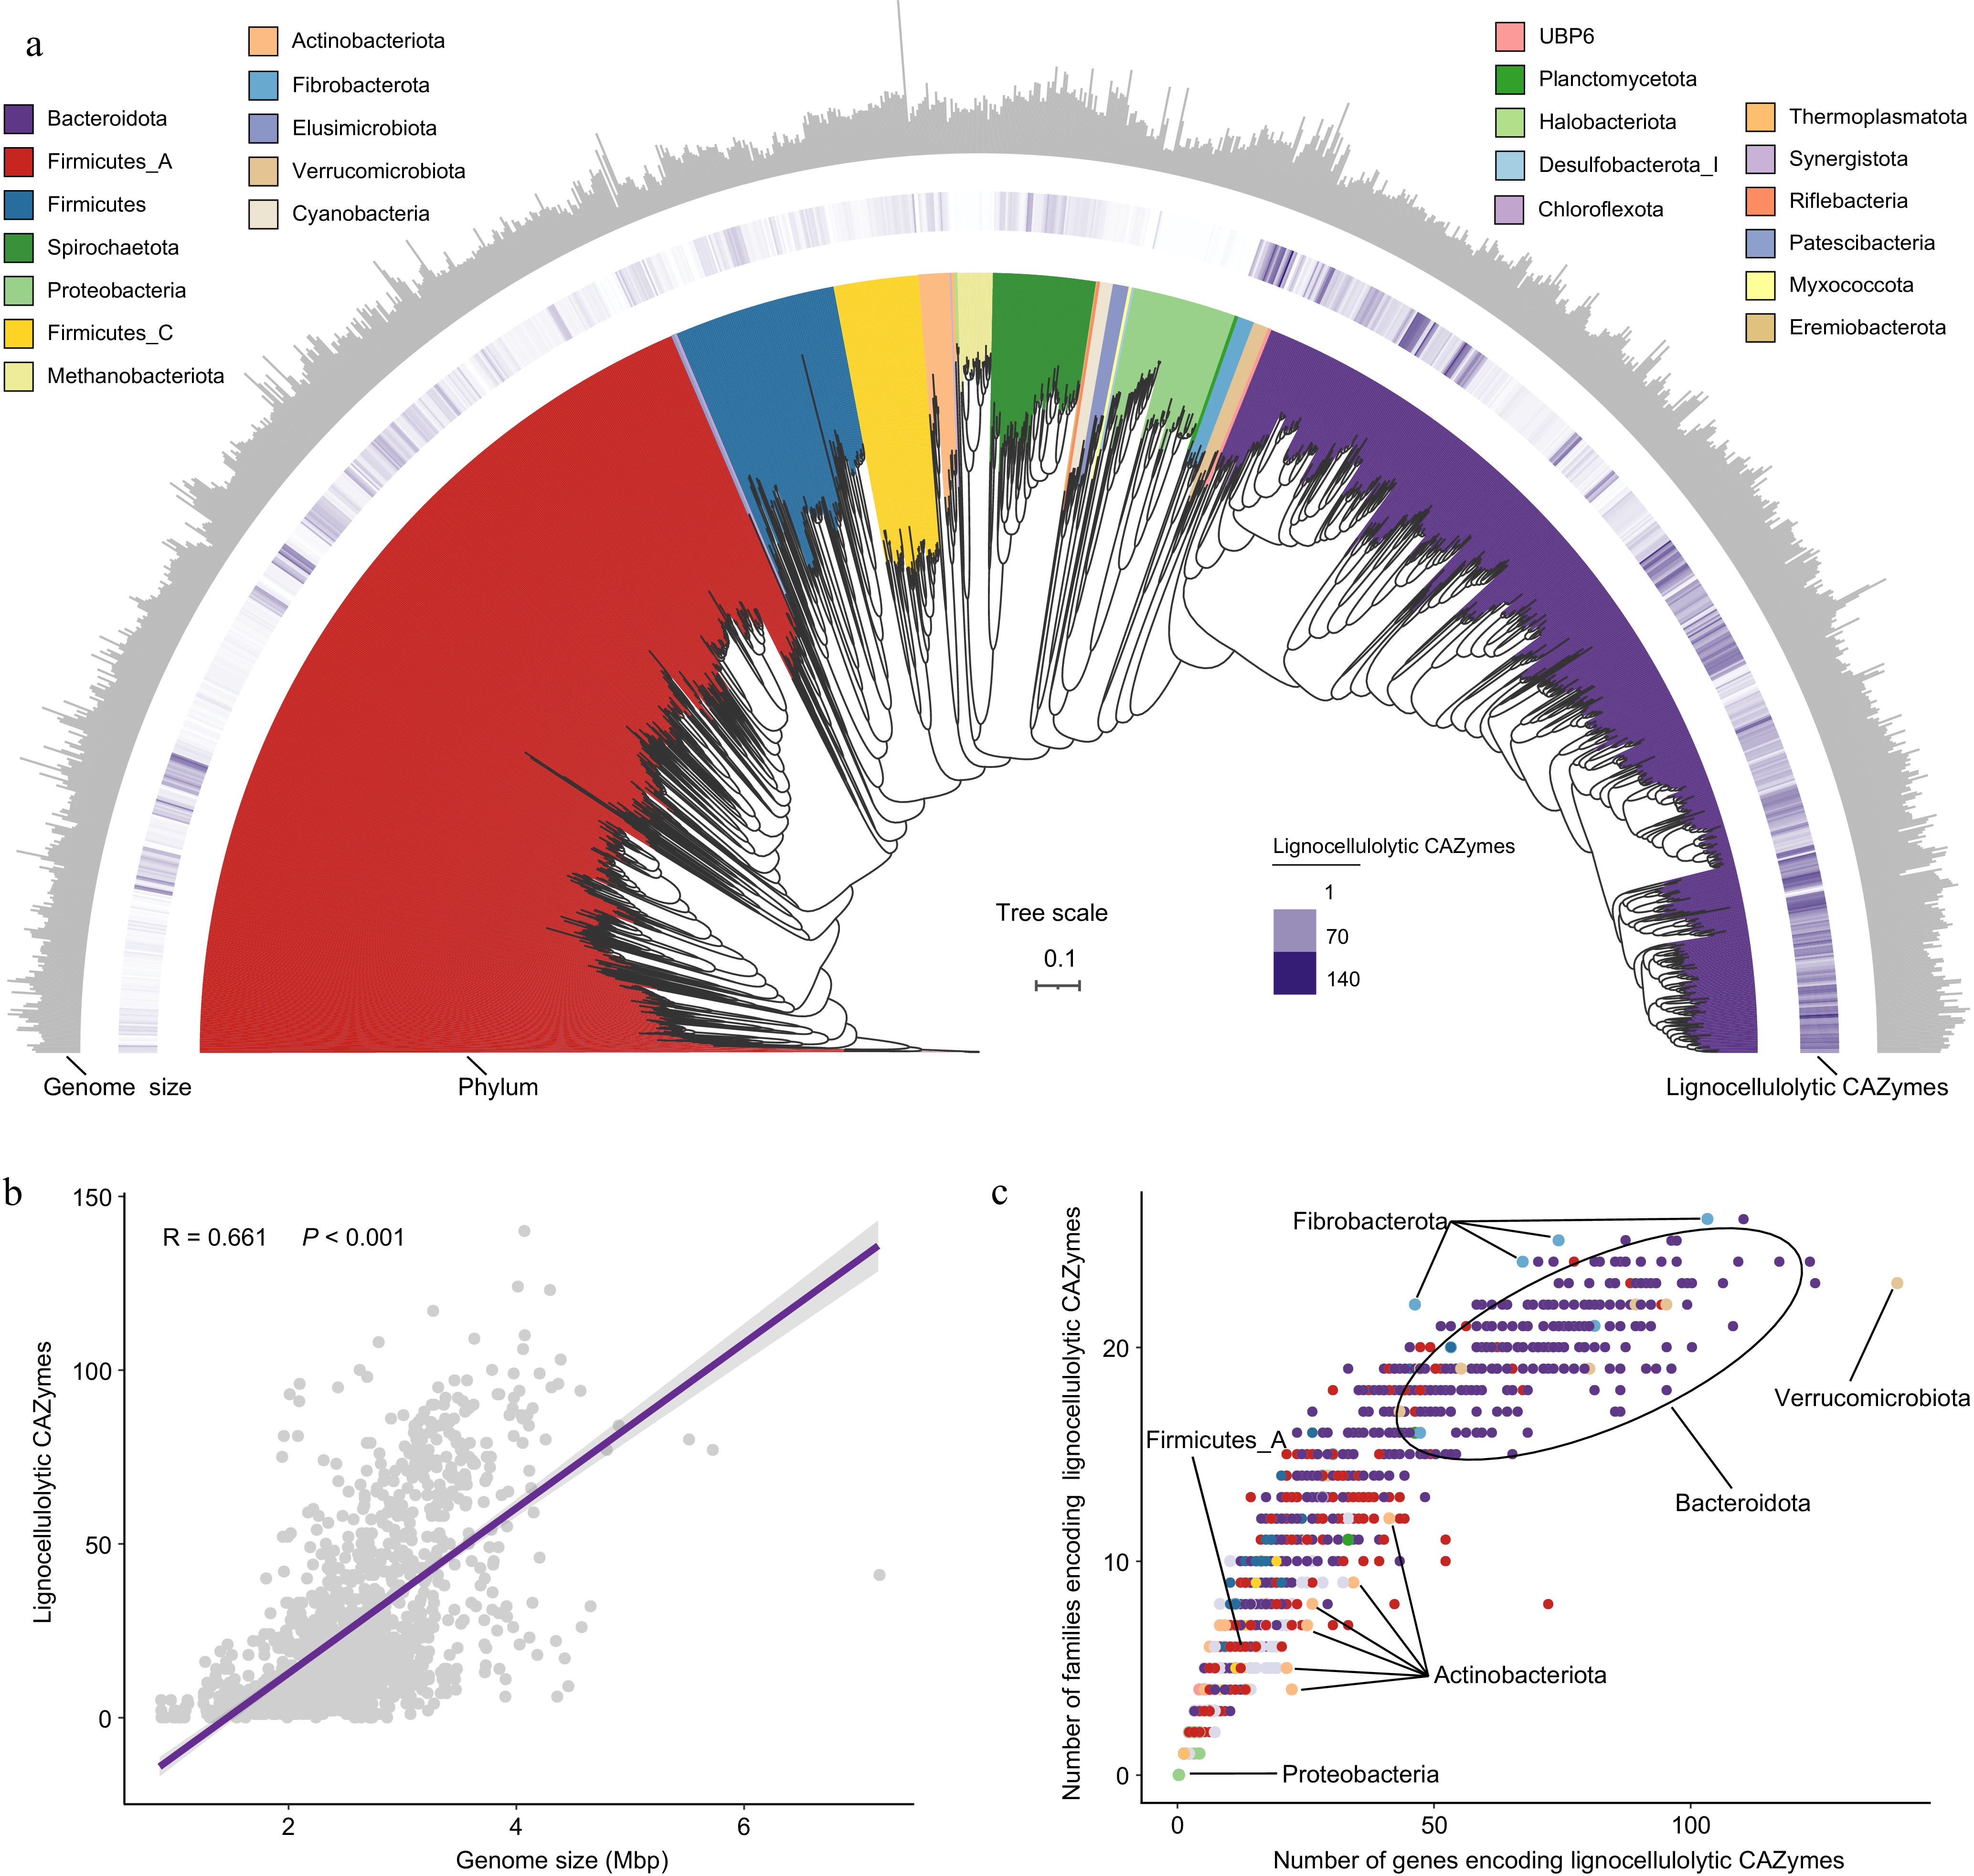
Figure 1.
The CAZyme profiles in lignocellulolytic microbiomes (LMs) from dairy cattle rumen. (a) Phylogenetic tree of 1353 microbial metagenome-assembled genomes (MAGs) coding lignocellulolytic CAZymes. The maximum-likelihood tree is constructed using PhyloPhlAn. Branches are shaded with color to highlight phylum-level affiliations. The inside layer of the heat map represents number of genes encoding lignocellulolytic CAZymes of each LM-MAG. The outside layer of the bar graph represents the genome size of each LM-MAG. (b) The correlation between number of genes encoding lignocellulolytic CAZymes and genome size of LM-MAGs. (c) Number of degradative CAZymes in distinct families in each LM-MAG. Genomes are colored by phylum.
-
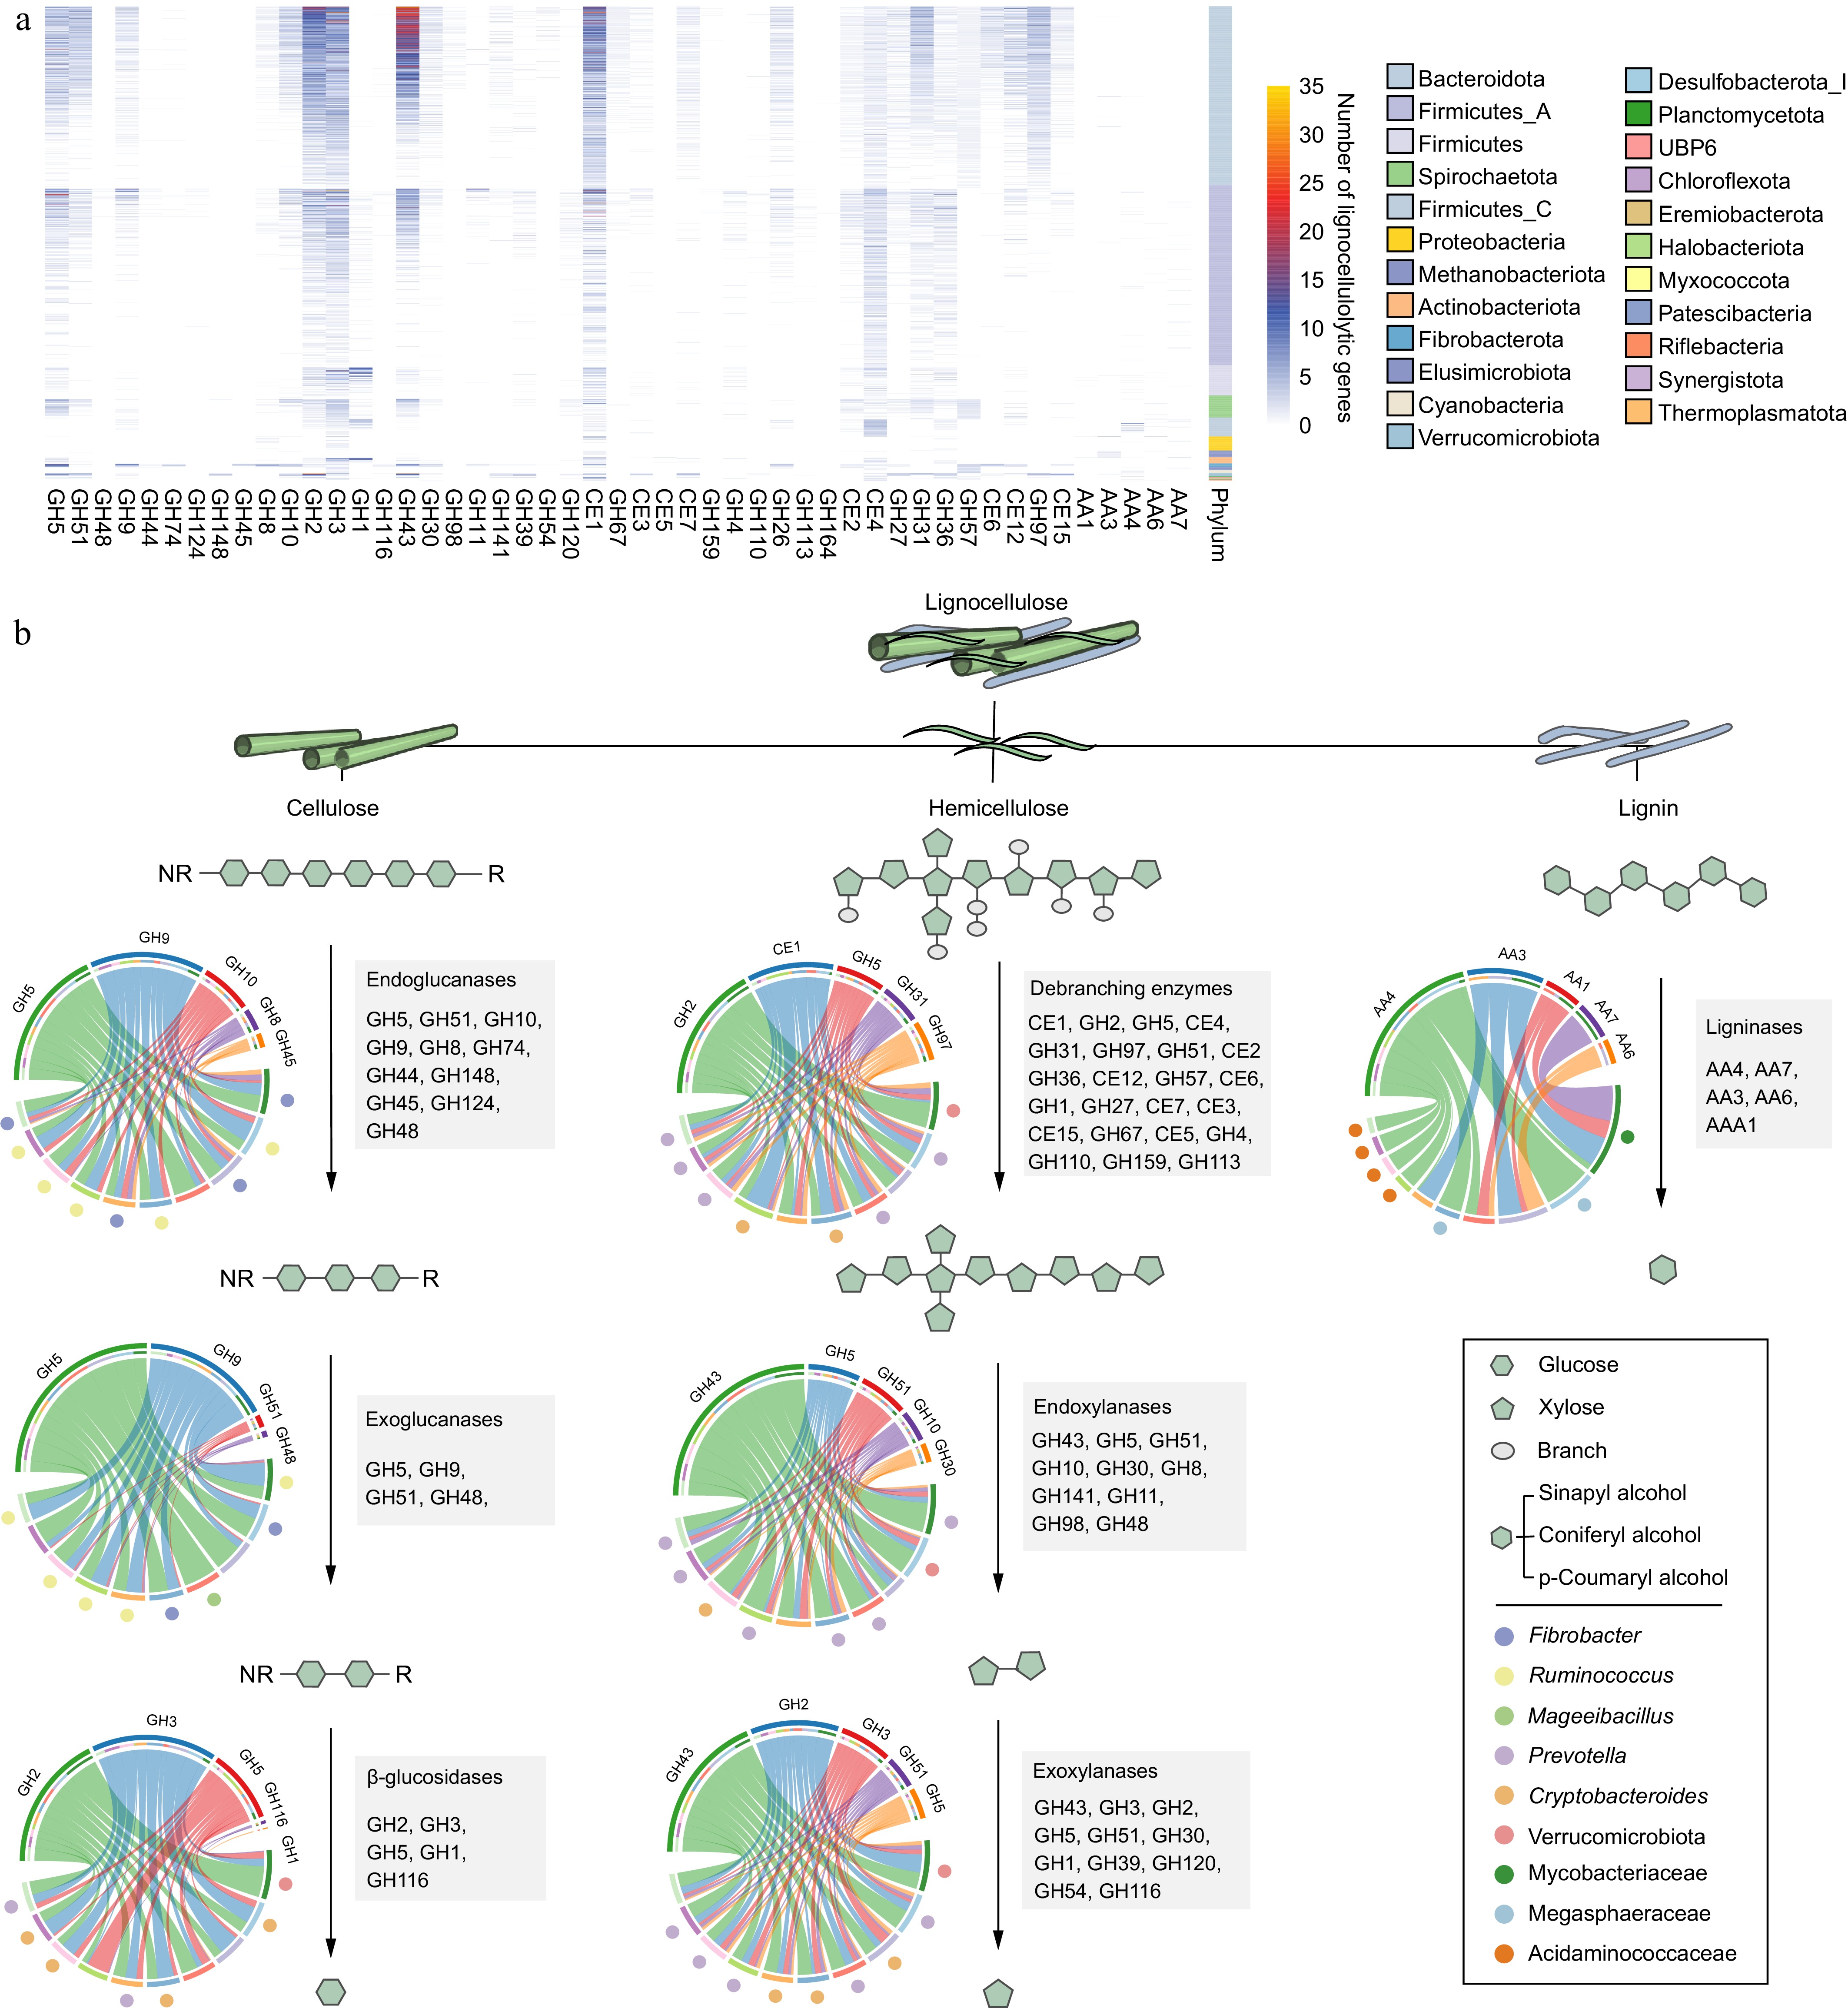
Figure 2.
The distribution and diversity of lignocellulolytic microbiomes (LMs) from dairy cattle rumen. (a) Distribution of lignocellulolytic CAZymes (GH, glycoside hydrolases; CE, carbohydrate esterases; AA, Auxiliary Activities) in LM-MAGs. Genomes are colored by phylum. (b) Cooperative model of cellulases, hemicellulases, and ligninases in lignocellulose degradation in the LM-MAGs. Chord Diagram represent the top families of lignocellulolytic CAZymes contributed by ruminal LM-MAGs. The detailed information regarding LMs involved in the degradation process of lignocellulose, including cellulose, hemicellulose, and lignin, can be found in Table S4.
-
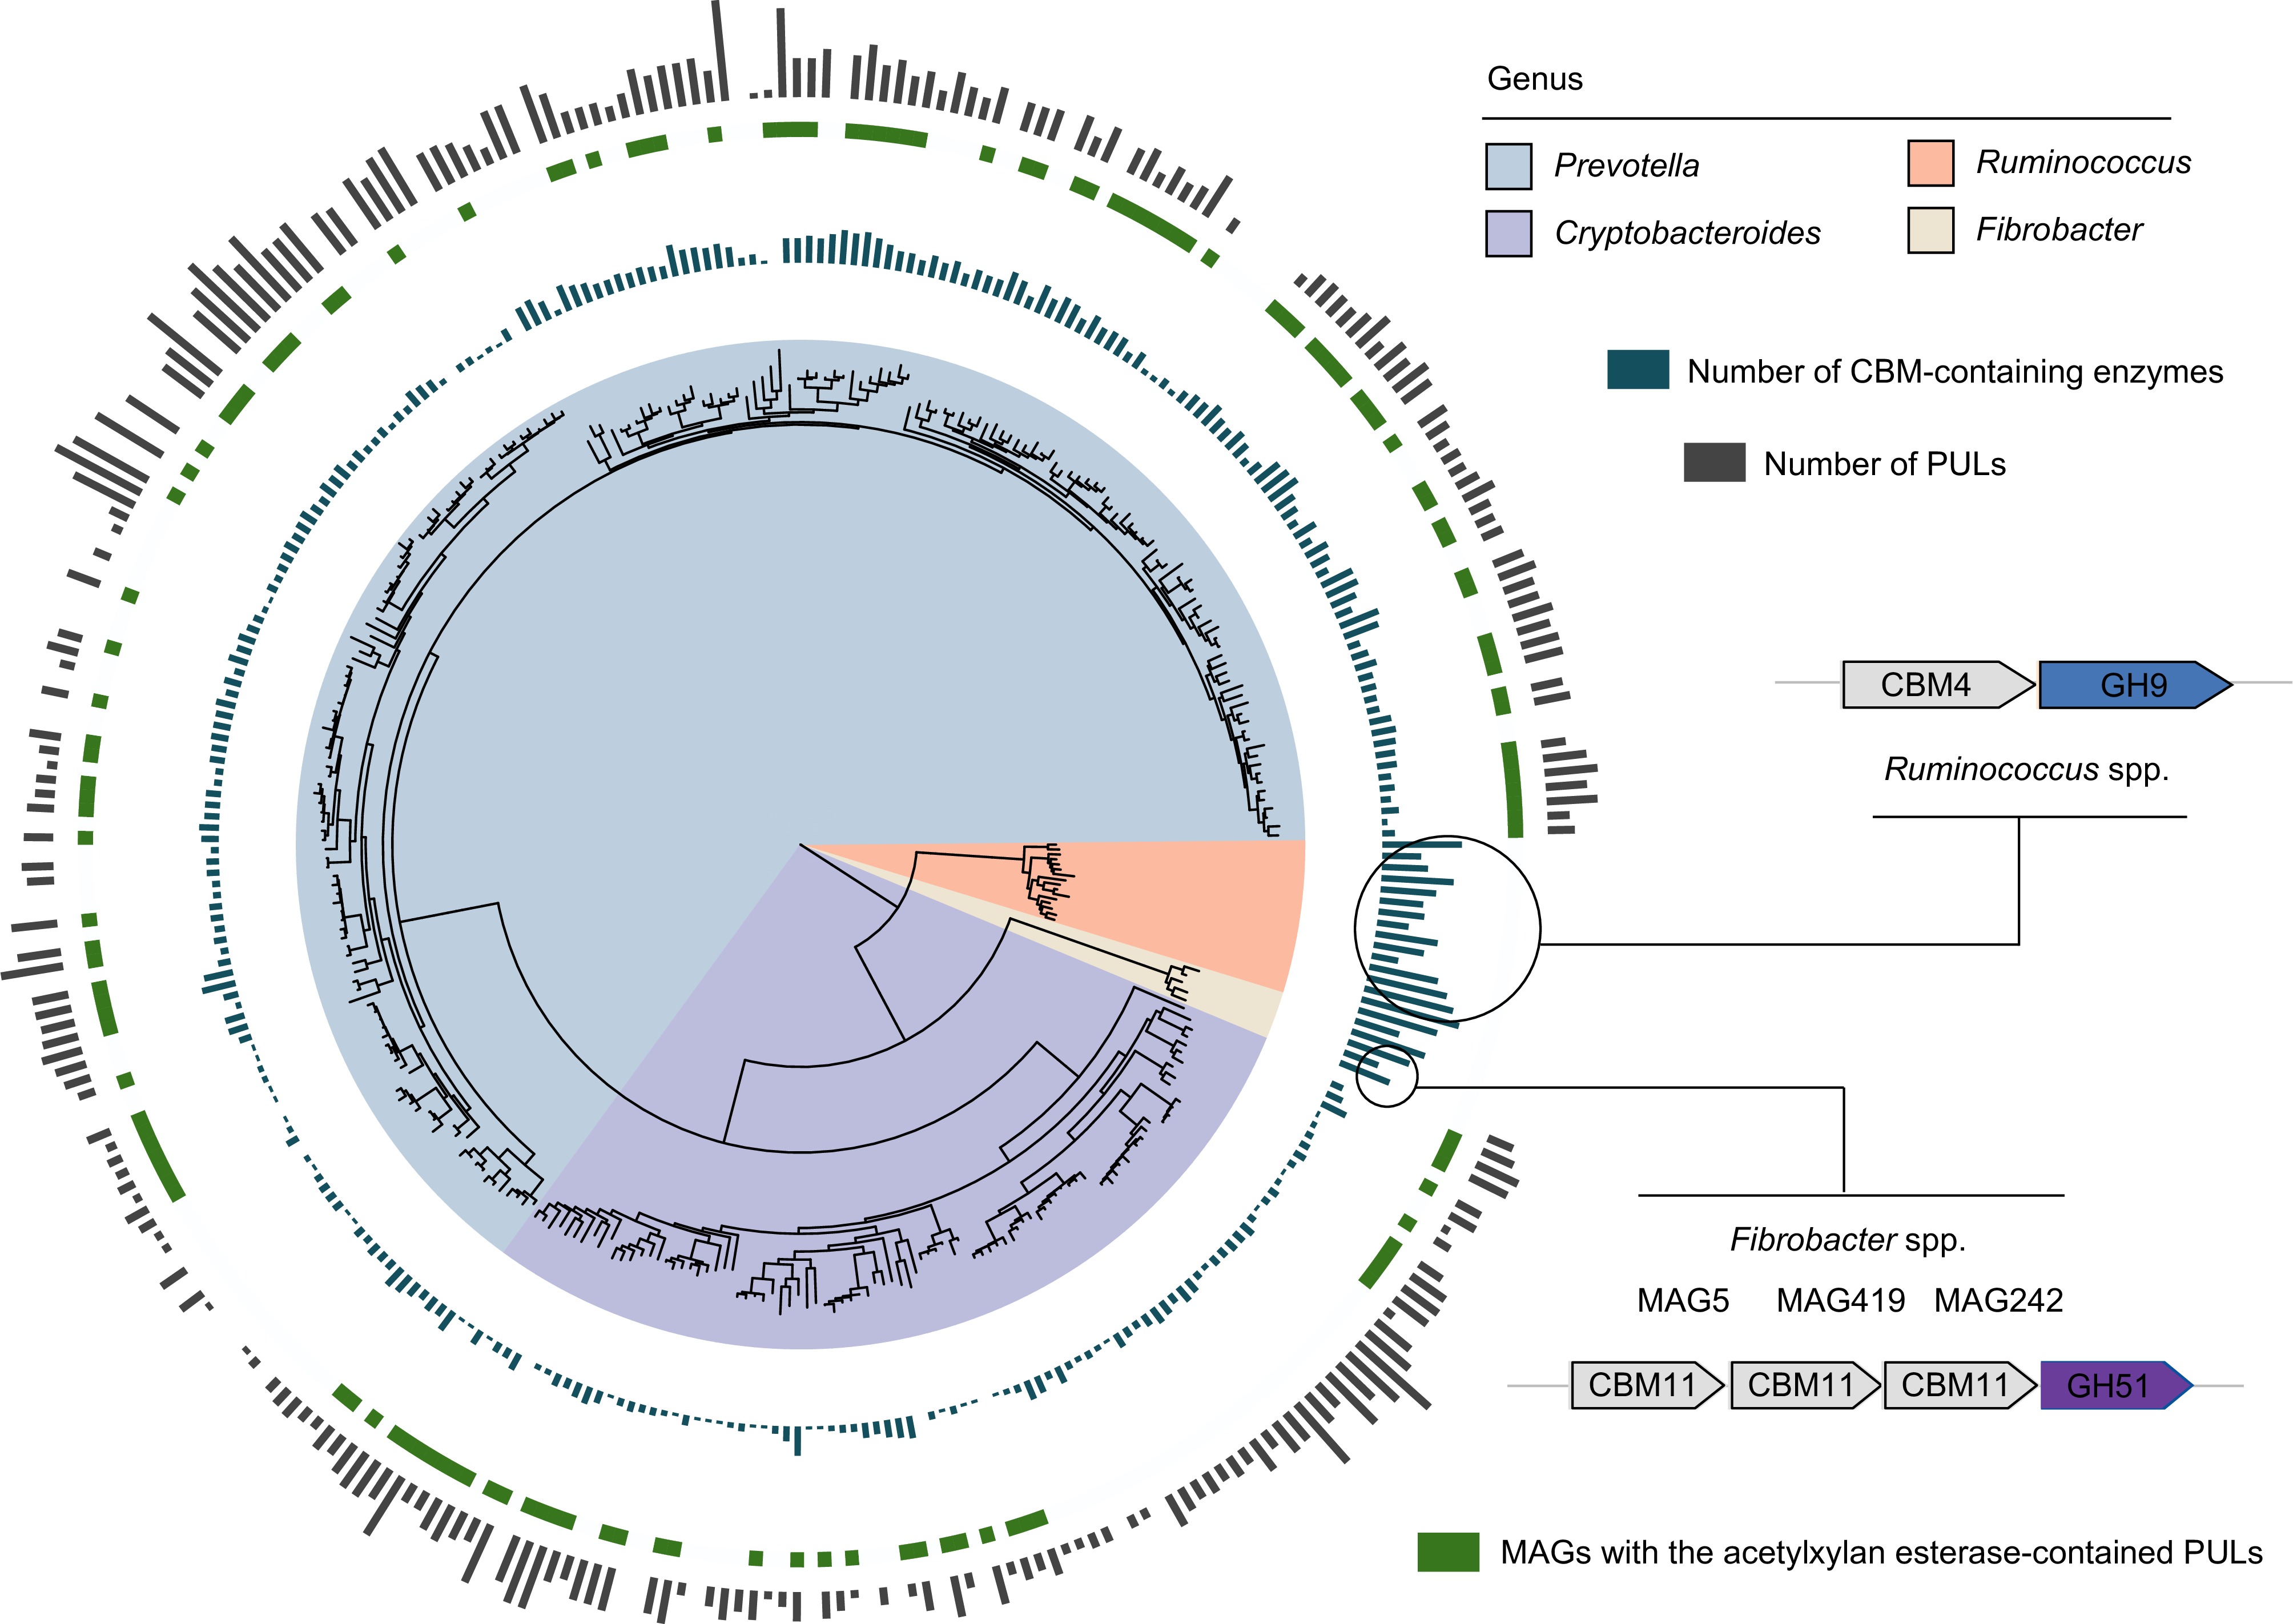
Figure 3.
Different lignocellulose degradation strategies used by taxa present in the dairy cattle rumen. Phylogenetic tree of lignocellulolytic microbiomes (LMs) belonged to genera Prevotella, Cryptobacteroides, Ruminococcus, and Fibrobacter. The maximum-likelihood tree is constructed using PhyloPhlAn. The background of branches is shaded with color to highlight these four taxa. The inside layer of the bar graph represents number of CBM-containing enzymes. The green color represents the specific MAGs with the acetylxylan esterase-contained PULs. The outside layer of the bar graph represents the number of polysaccharide utilization loci (PULs) encoded by the targeted MAGs.
-
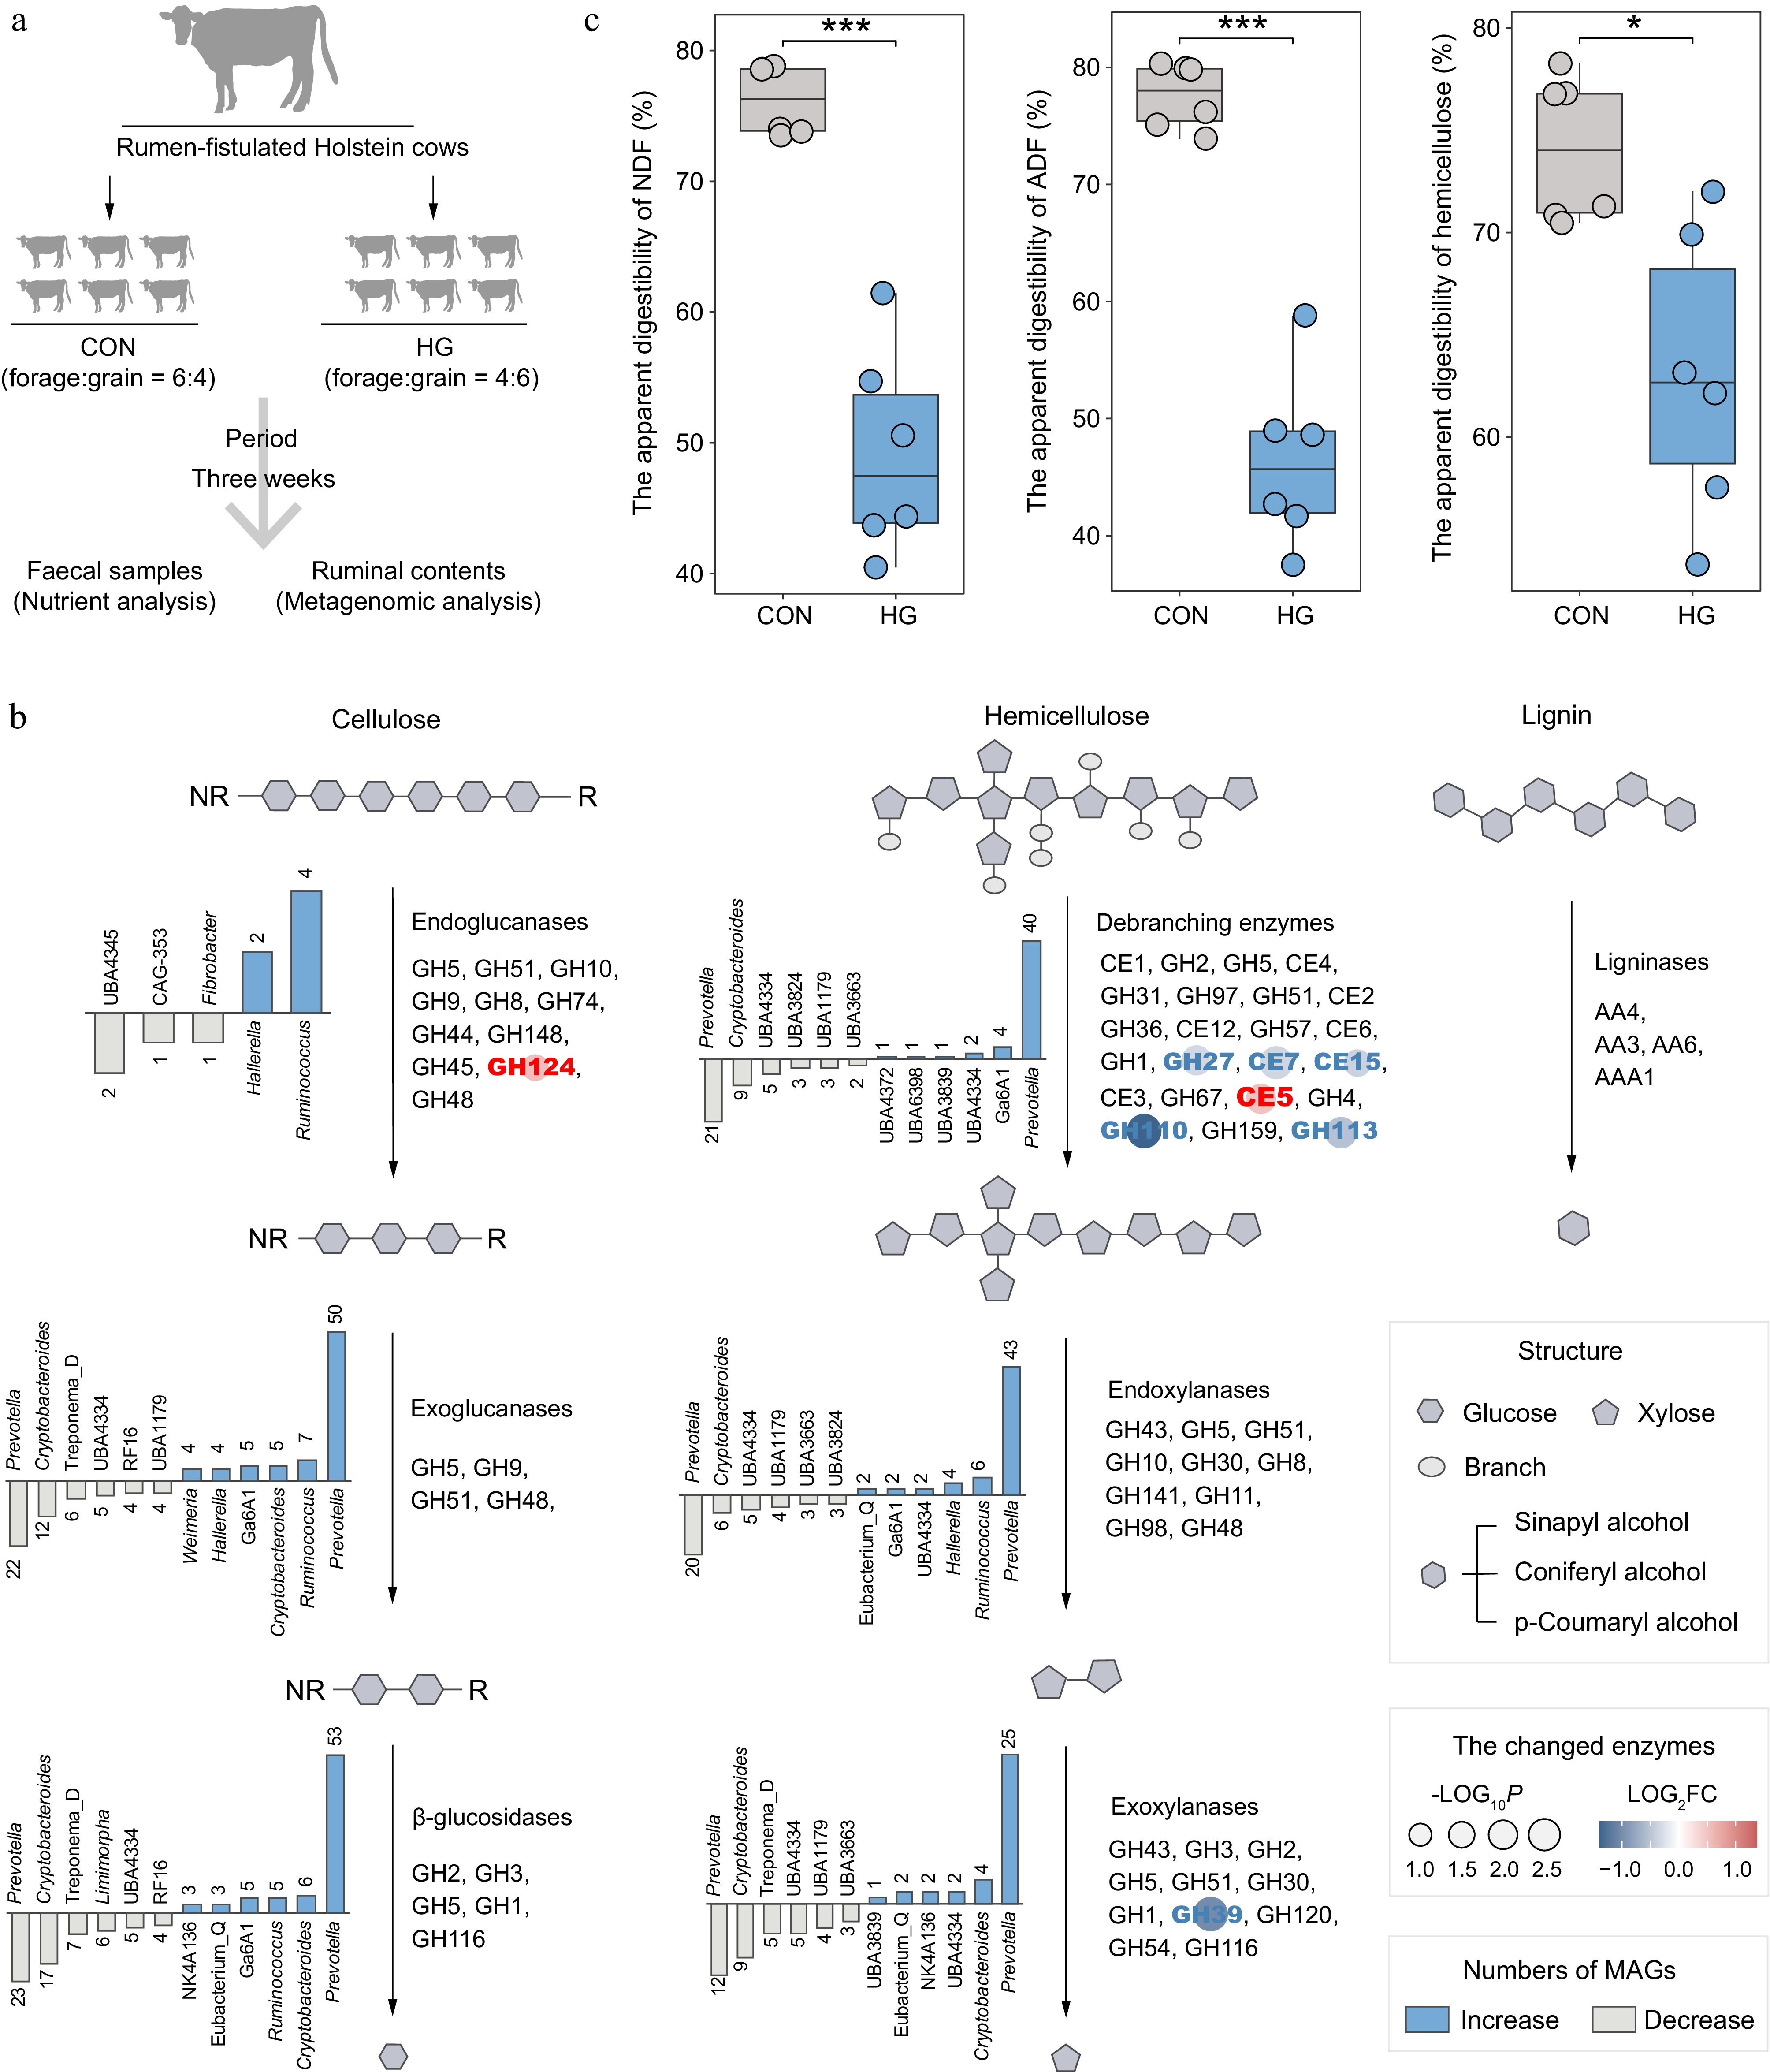
Figure 4.
Alterations in the lignocellulose degradation potential of rumen microbiota between the CON and HG groups in dairy cattle. (a) Experimental scheme of high-grain diet intervention. (b) The number and top taxonomic populations of the significantly increased and decreased abundances of lignocellulolytic microbiome (LM-MAGs) during the degradation of various lignocellulosic components in the rumen in the HG group, compared with the CON group (Wilcoxon rank-sum test, p < 0.05). The bar chart illustrates the number of genomes classified into specific genera with significantly different abundances, containing at least half of the CAZyme families encoding the same type of enzyme. (c) Comparison of the apparent digestibility in neutral detergent fiber (NDF), acid detergent fiber (ADF), and hemicellulose between the CON and HG groups, respectively. Significance is based on the relative index of each cohort according to the t-test. * p < 0.05, ** p < 0.01, *** p < 0.001.
-
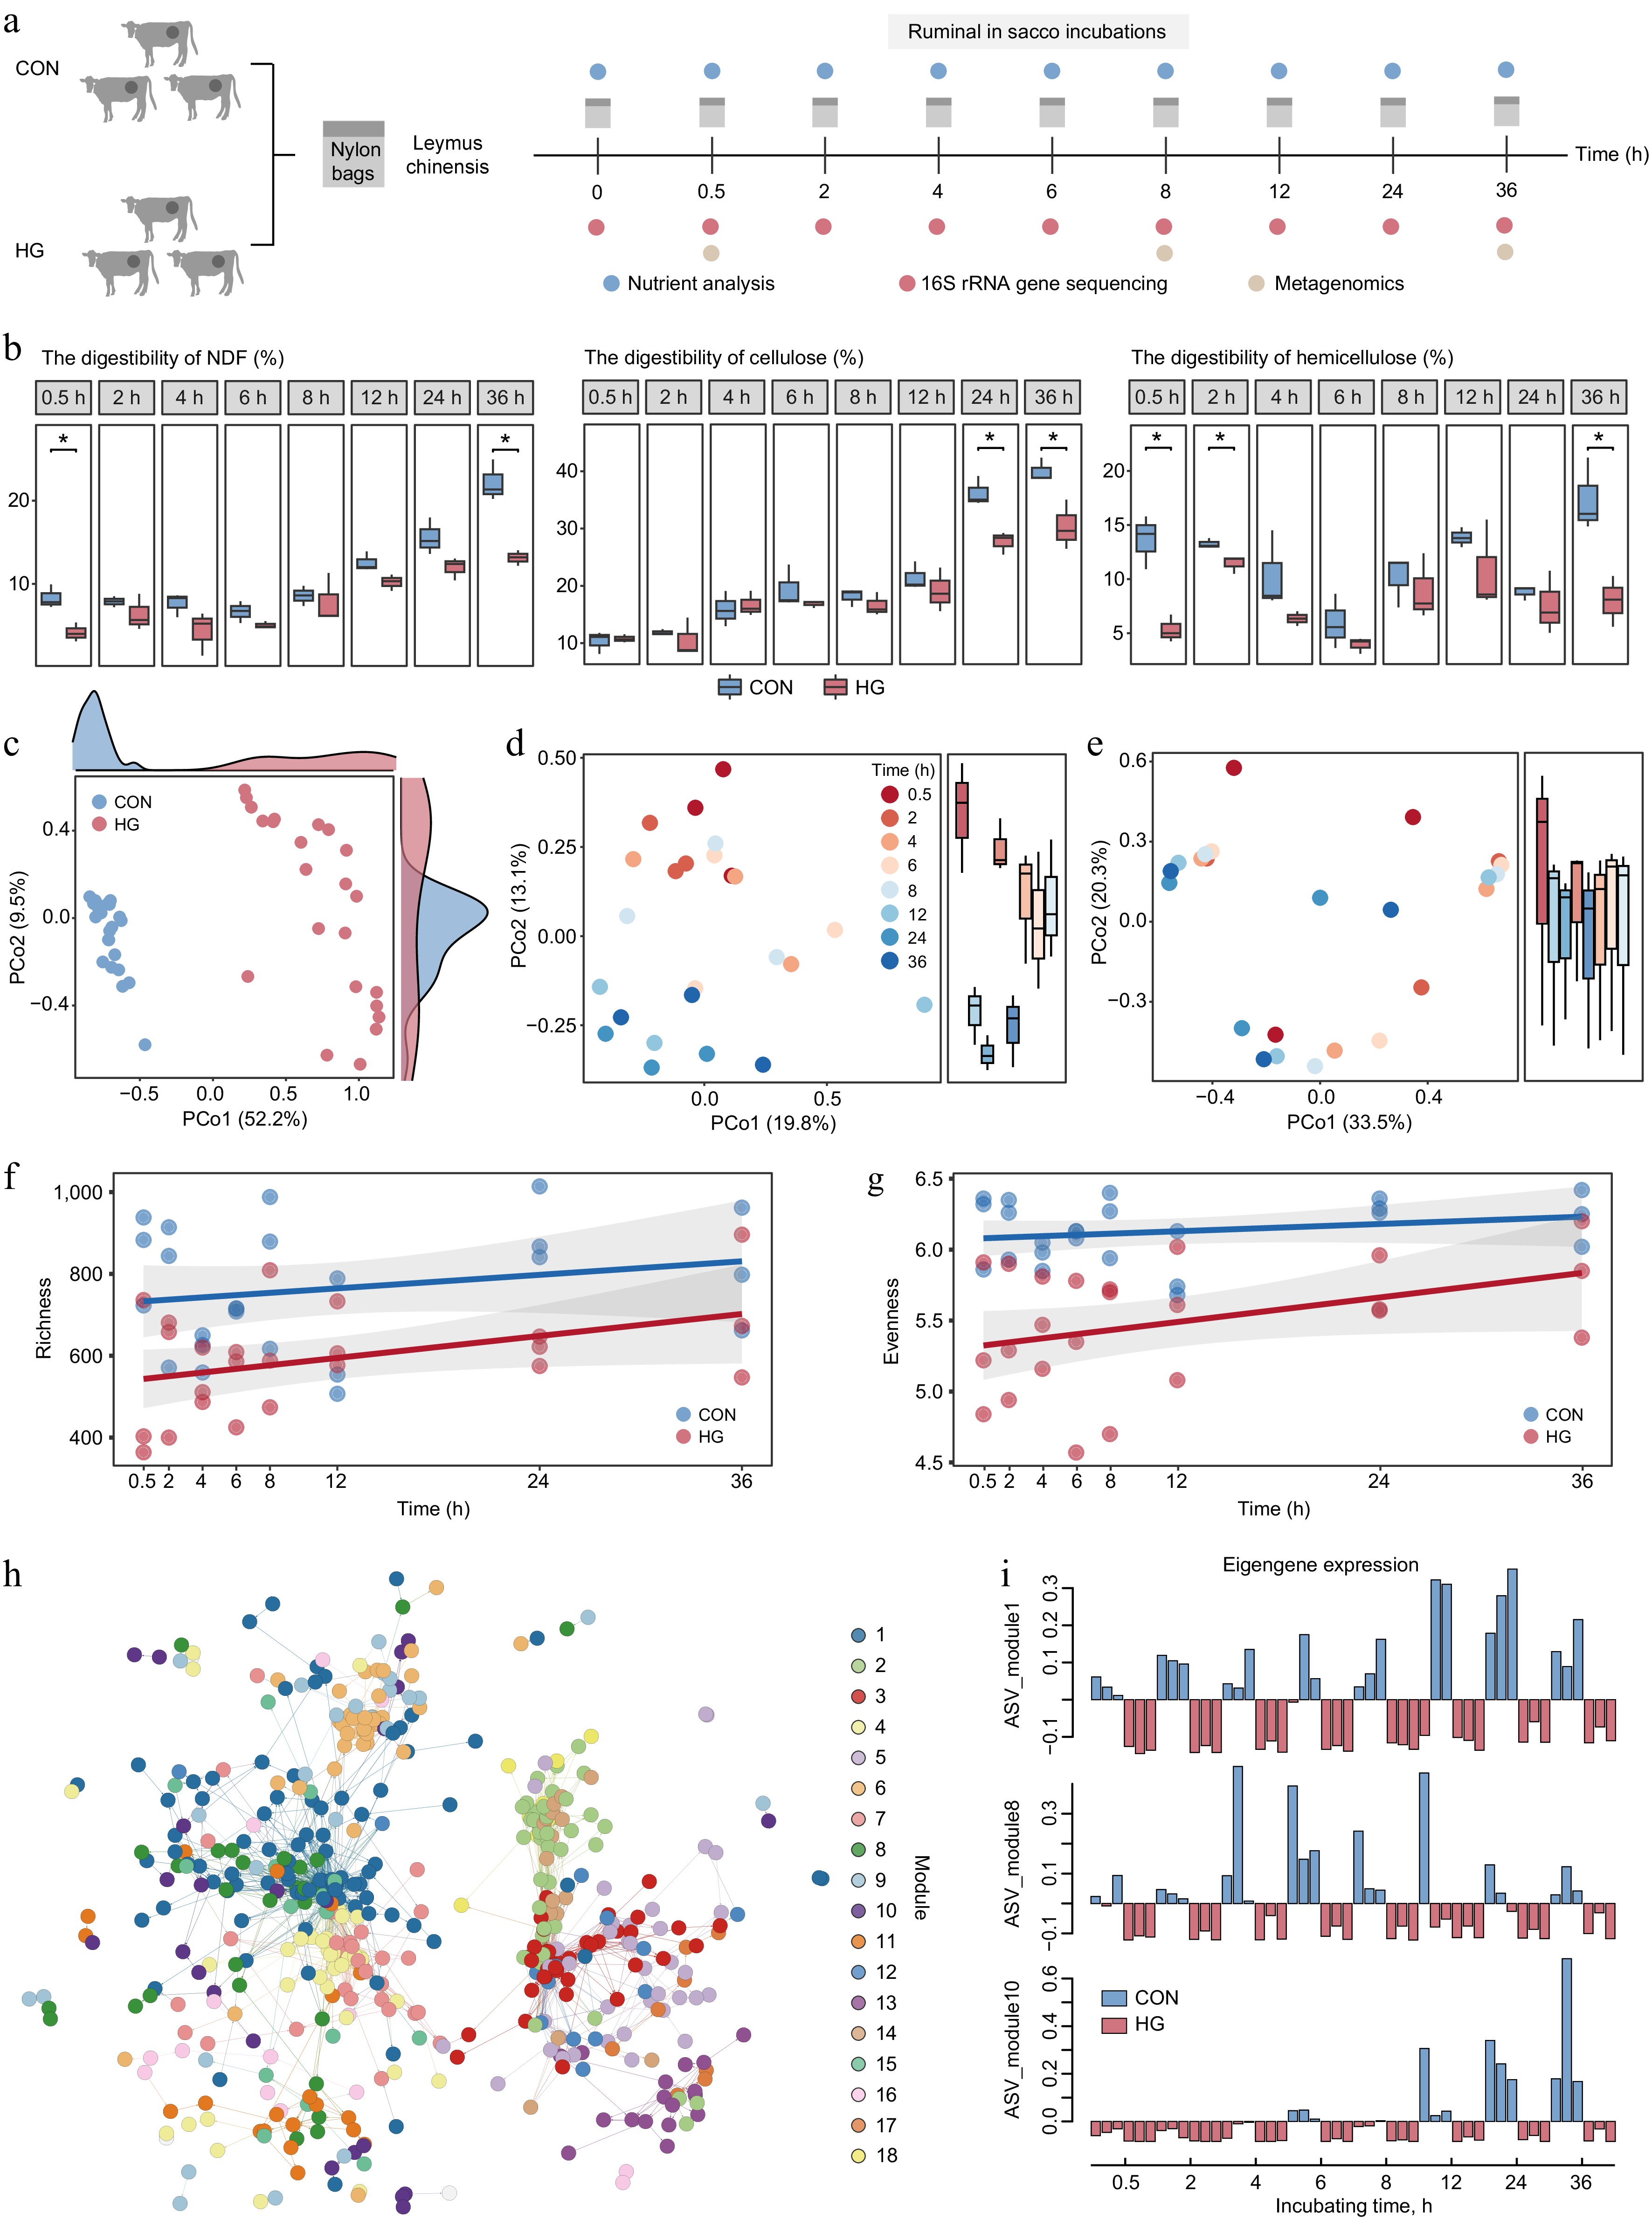
Figure 5.
Key stages of reduction in lignocellulose degradation with high-grain diet intervention. (a) Experimental scheme of rumen in situ incubations. (b) Comparison of digestibility in neutral detergent fiber (NDF), cellulose, and hemicellulose of incubated Leymus chinensis materials at each time point between the CON and HG groups according to the t-test, respectively. * p < 0.05, ** p < 0.01, *** p < 0.001. (c) Principal Coordinate Analysis (PCoA) plot generated from Bray–Curtis dissimilarity matrices using Leymus chinensis-adherent ASV abundances during rumen incubation in both the CON and HG groups. (d) Principal Coordinate Analysis (PCoA) plot generated from Bray–Curtis dissimilarity matrices using Leymus chinensis-adherent ASV abundances at 0.5, 2, 4, 6, 8, 12, 24, and 36 h during rumen incubation in the CON group. (e) Principal Coordinate Analysis (PCoA) plot generated from Bray–Curtis dissimilarity matrices using Leymus chinensis-adherent ASV abundances at 0.5, 2, 4, 6, 8, 12, 24, and 36 h during rumen incubation in the HG group. Temporal shift of richness ((f), Observed number of ASVs) and evenness ((g), Shannon diversity) indexes of ASVs between the CON and HG groups, respectively. (h) The co-occurrence network visualizing significant correlations of diet-sensitive 786 ASVs among eight time points during the rumen incubation (R > 0.7). (i) Eigengene expression of module 1, module 8, and module 10 in the CON and HG groups. CON, high-forage diet; HG, high-grain diet; ASV, amplicon sequence variants.
Figures
(5)
Tables
(0)