-
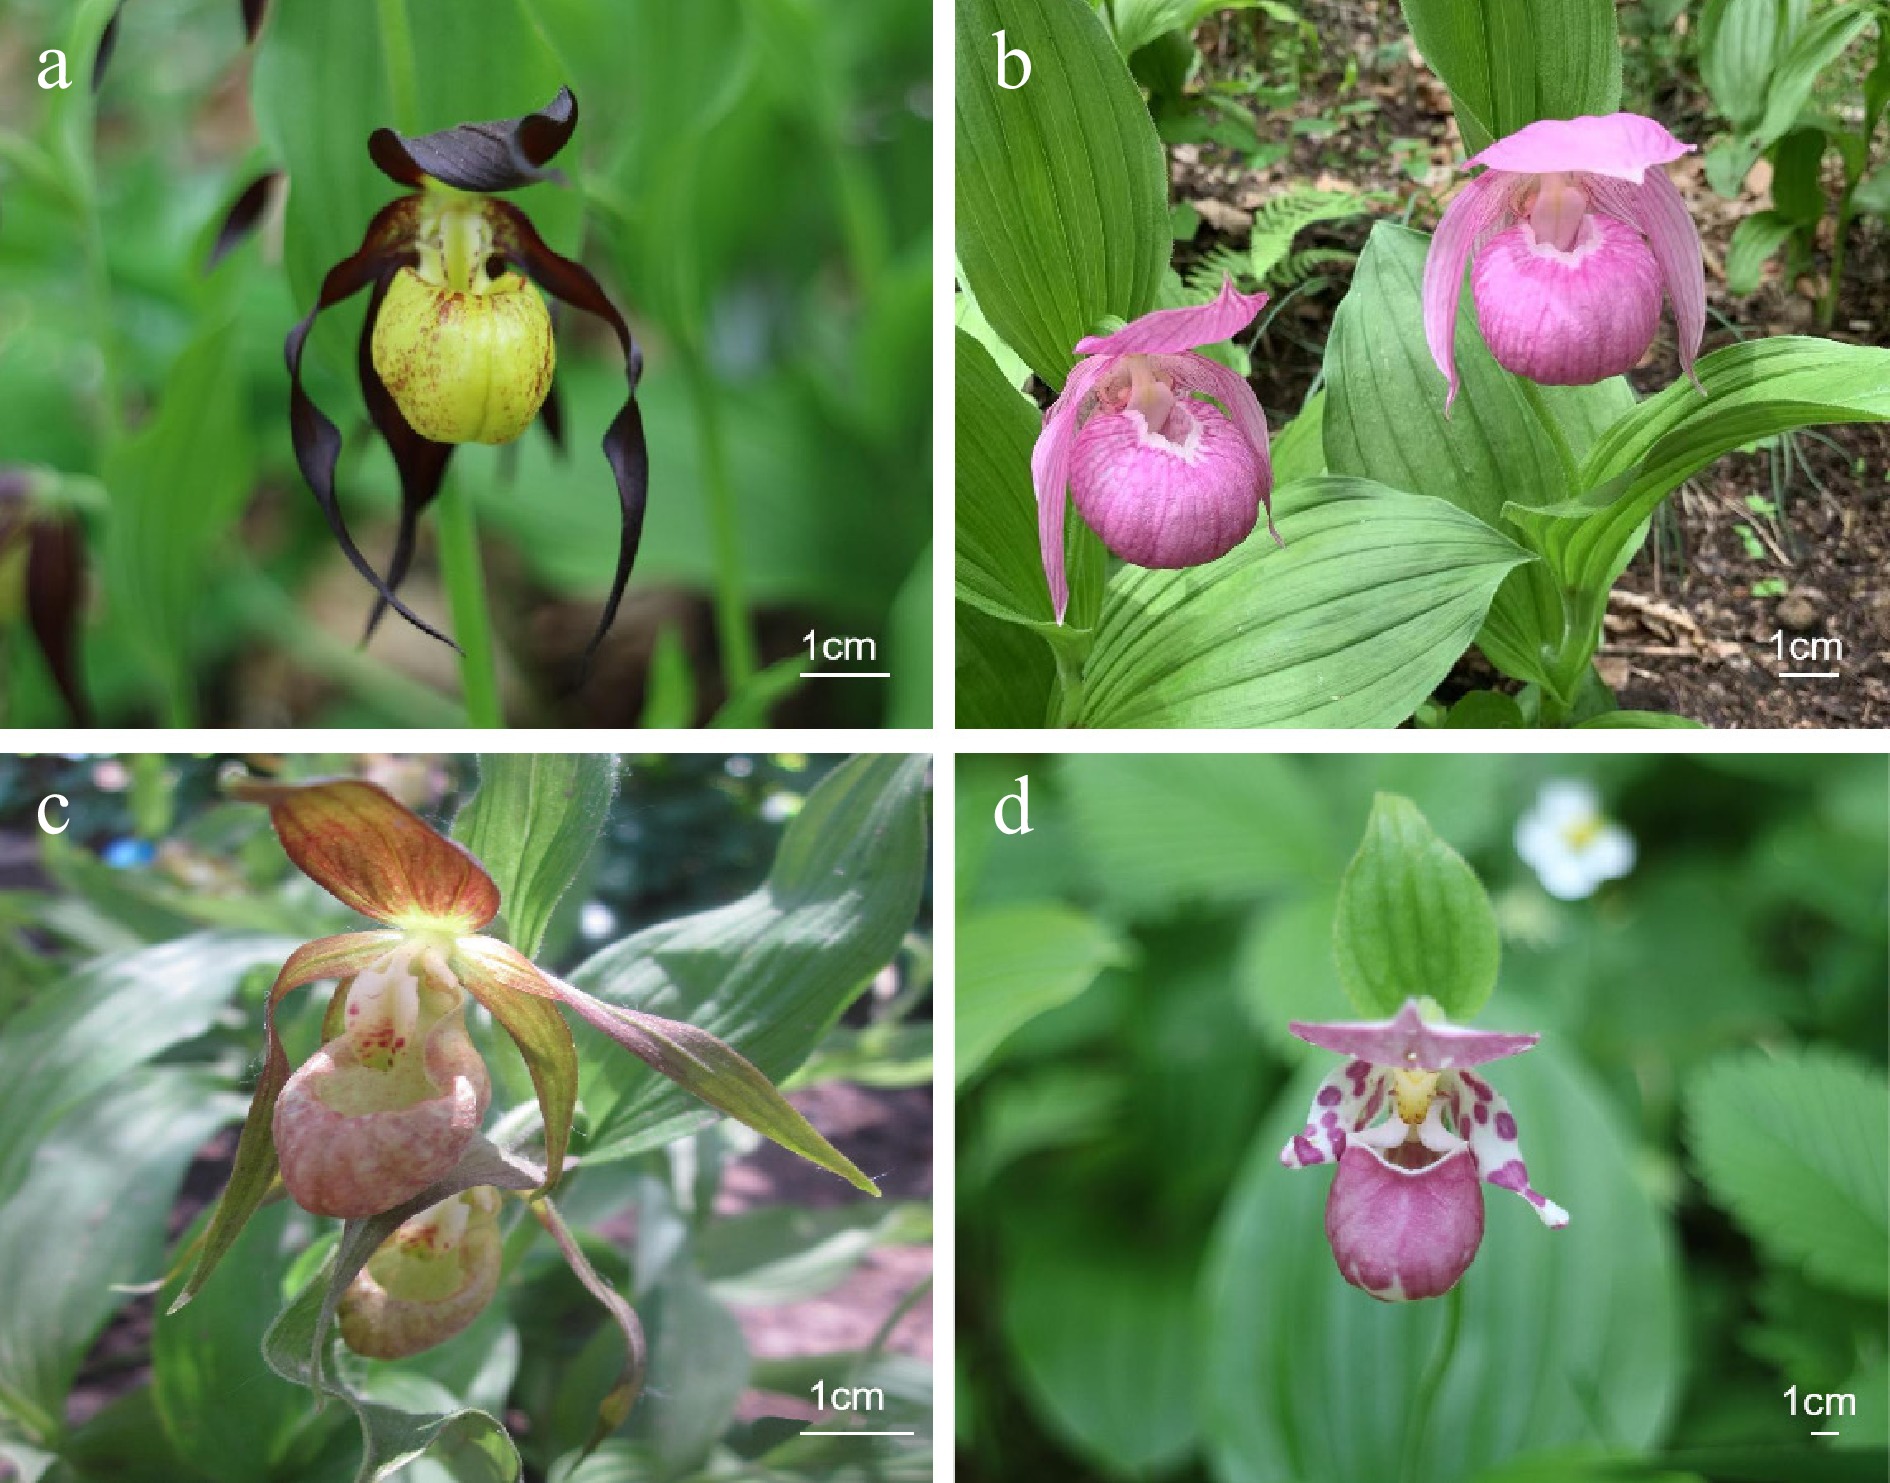
Figure 1.
(a) C. calceolus, (b) C. macranthos, (c) C. shanxiense, and (d) C. guttatum.
-
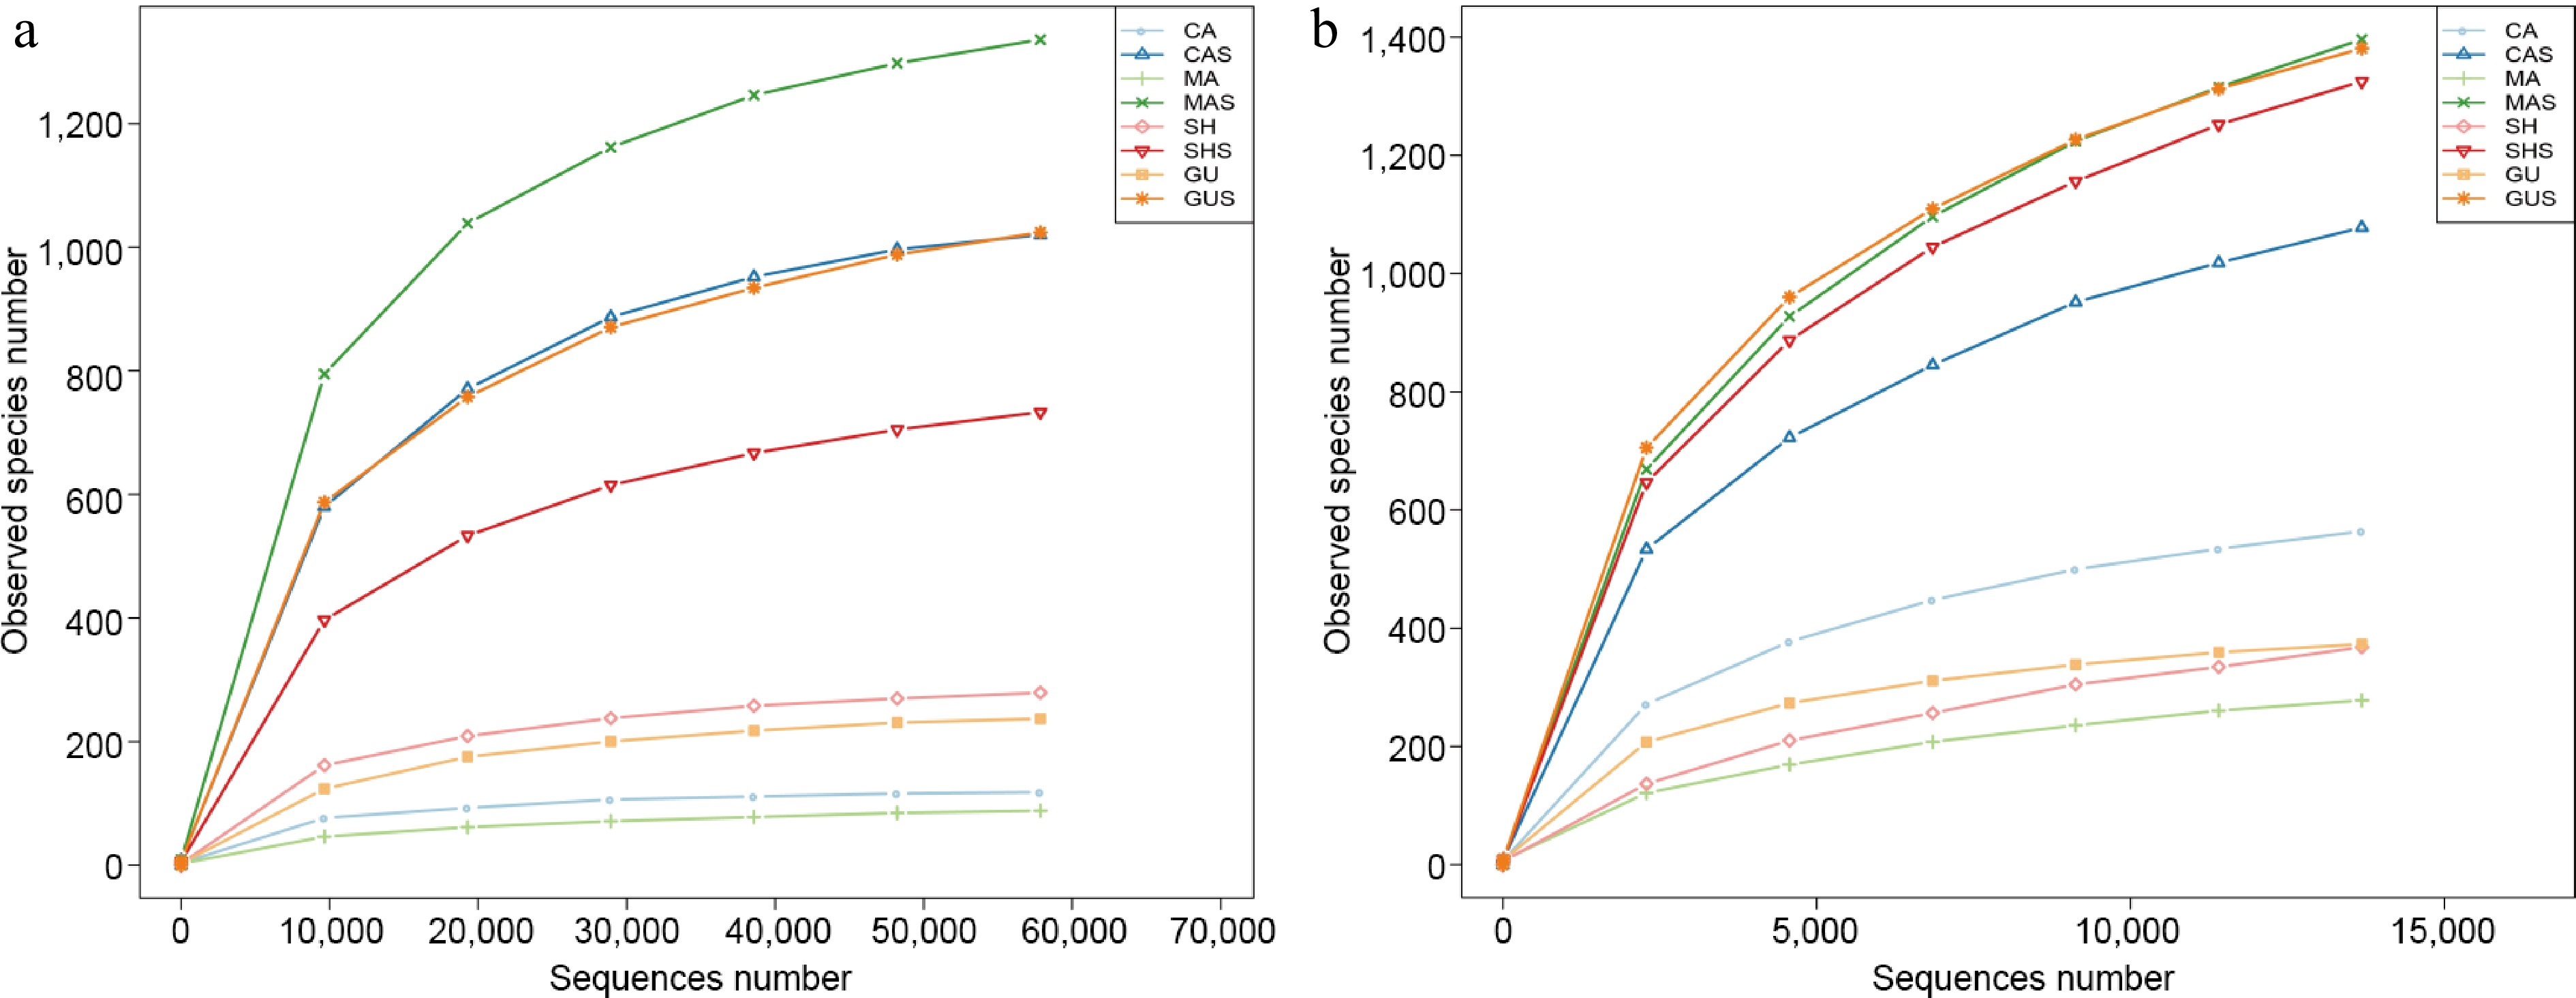
Figure 2.
Rarefaction curves plotted for (a) ITS and, (b) 16S sequencing. The root samples of C. calceolus, C. macranthos, C. shanxiense, and C. guttatum were CA, MA, SH, and GU, respectively. The rhizosphere samples of C. calceolus, C. macranthos, C. shanxiense, and C. guttatum were CAS, MAS, SHS, and GUS, respectively.
-
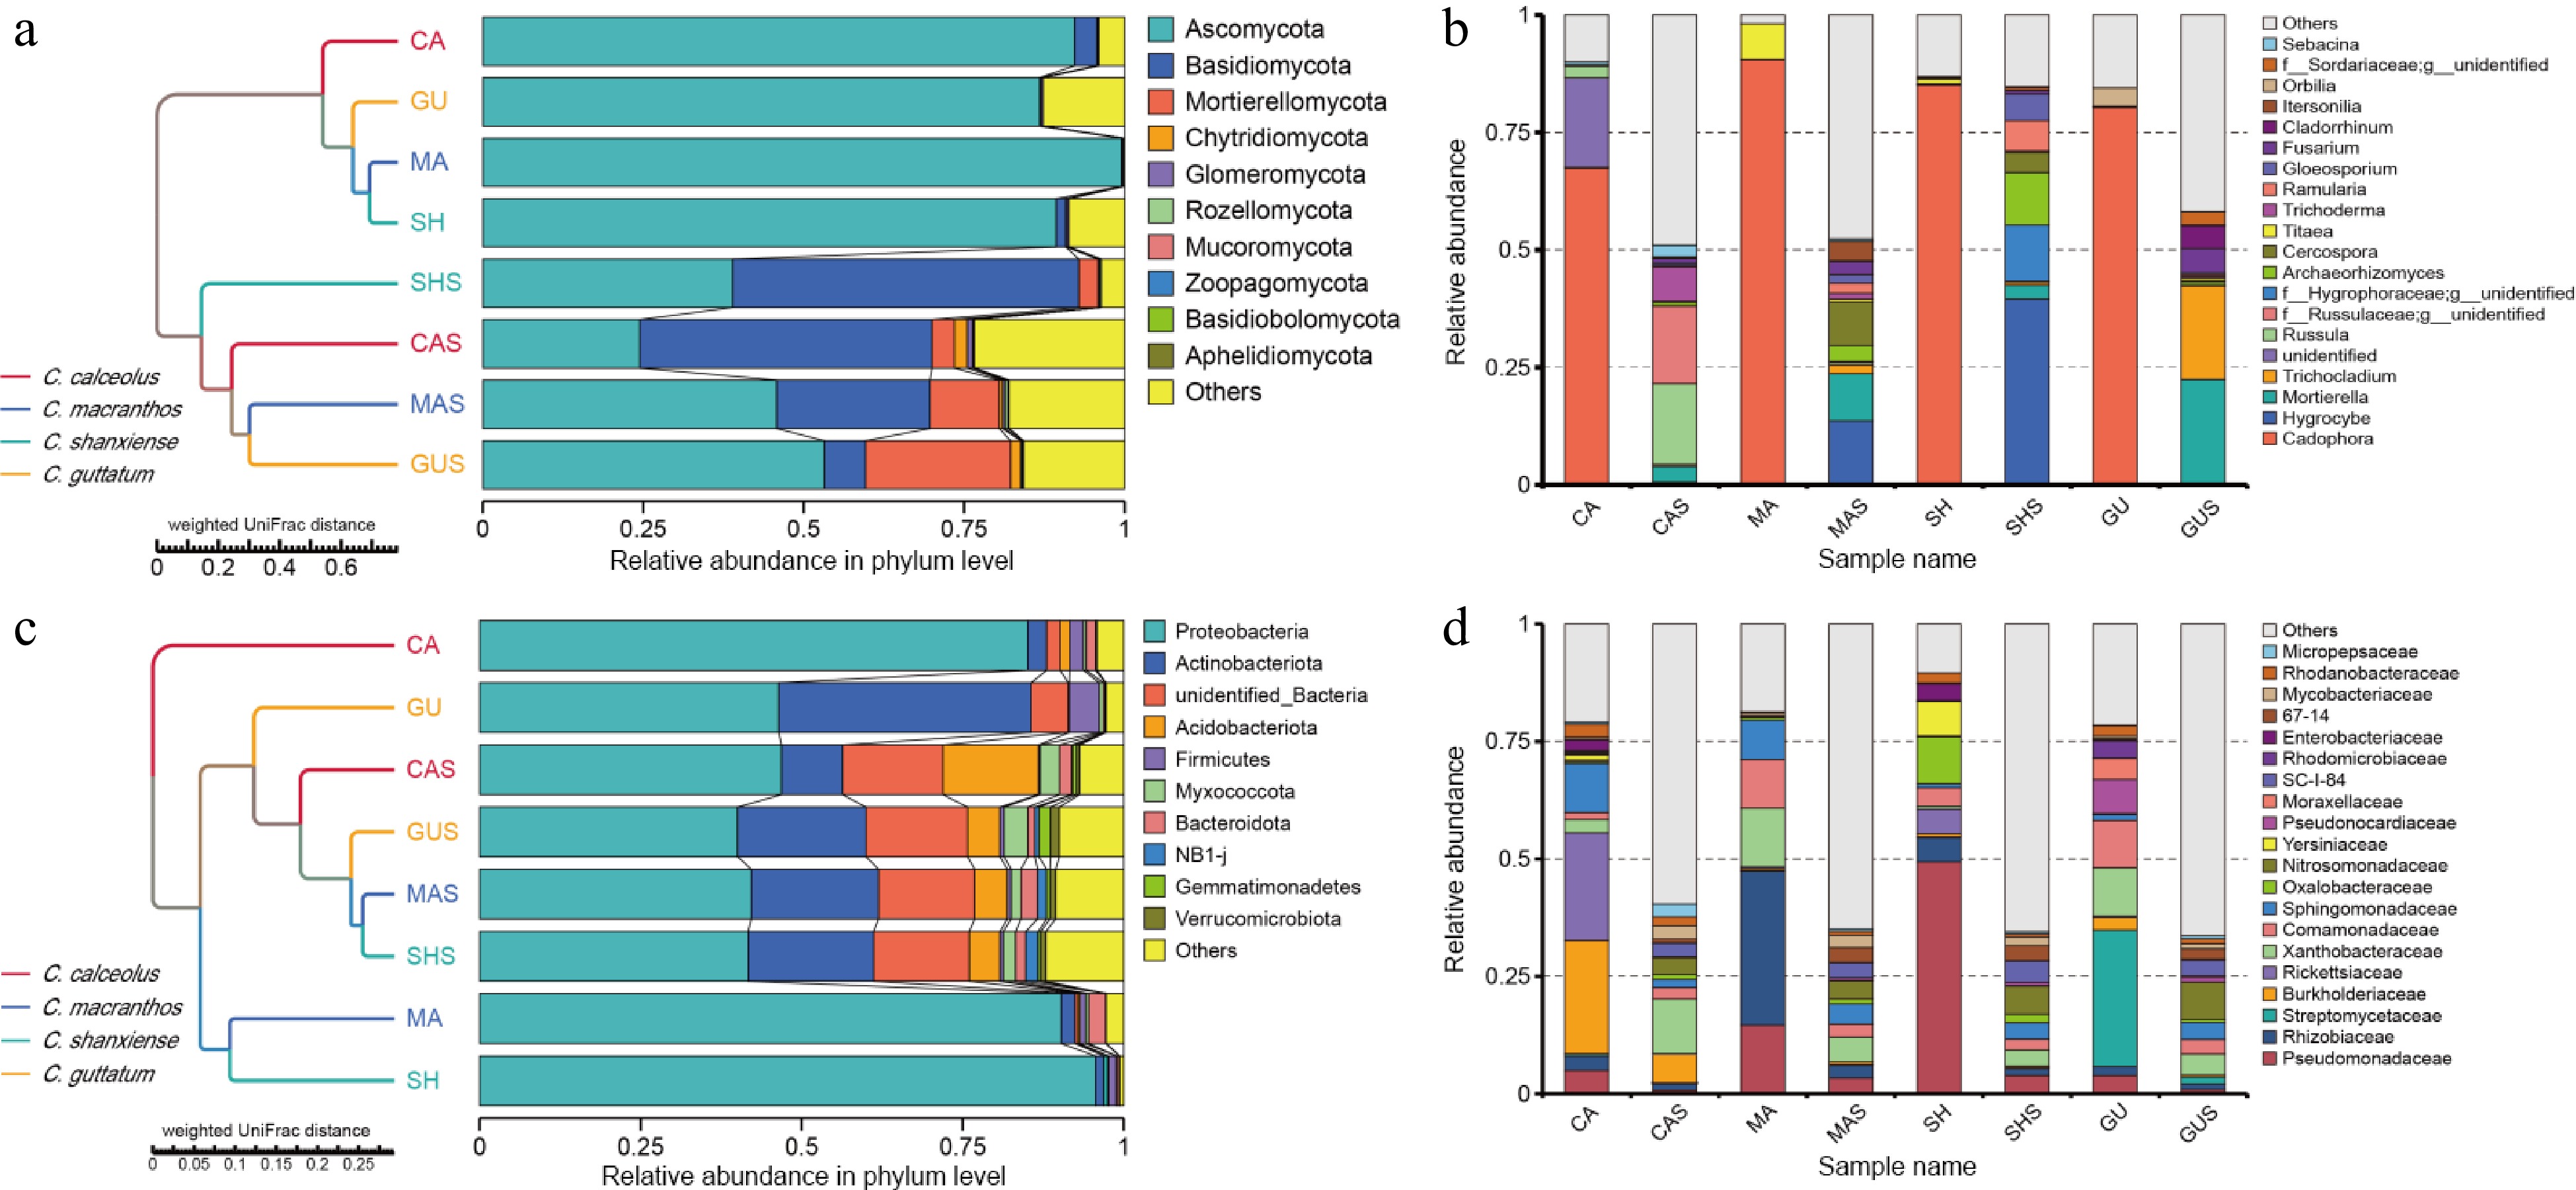
Figure 3.
The relative abundance and composition of microorganisms in each sample. UMPGA clustering of phylum-level species in (a) root, and (c) rhizosphere samples based on weighted UniFrac distances. (b) Relative abundance of genus-level fungal communities. (d) Relative abundance of family-level bacterial communities.
-
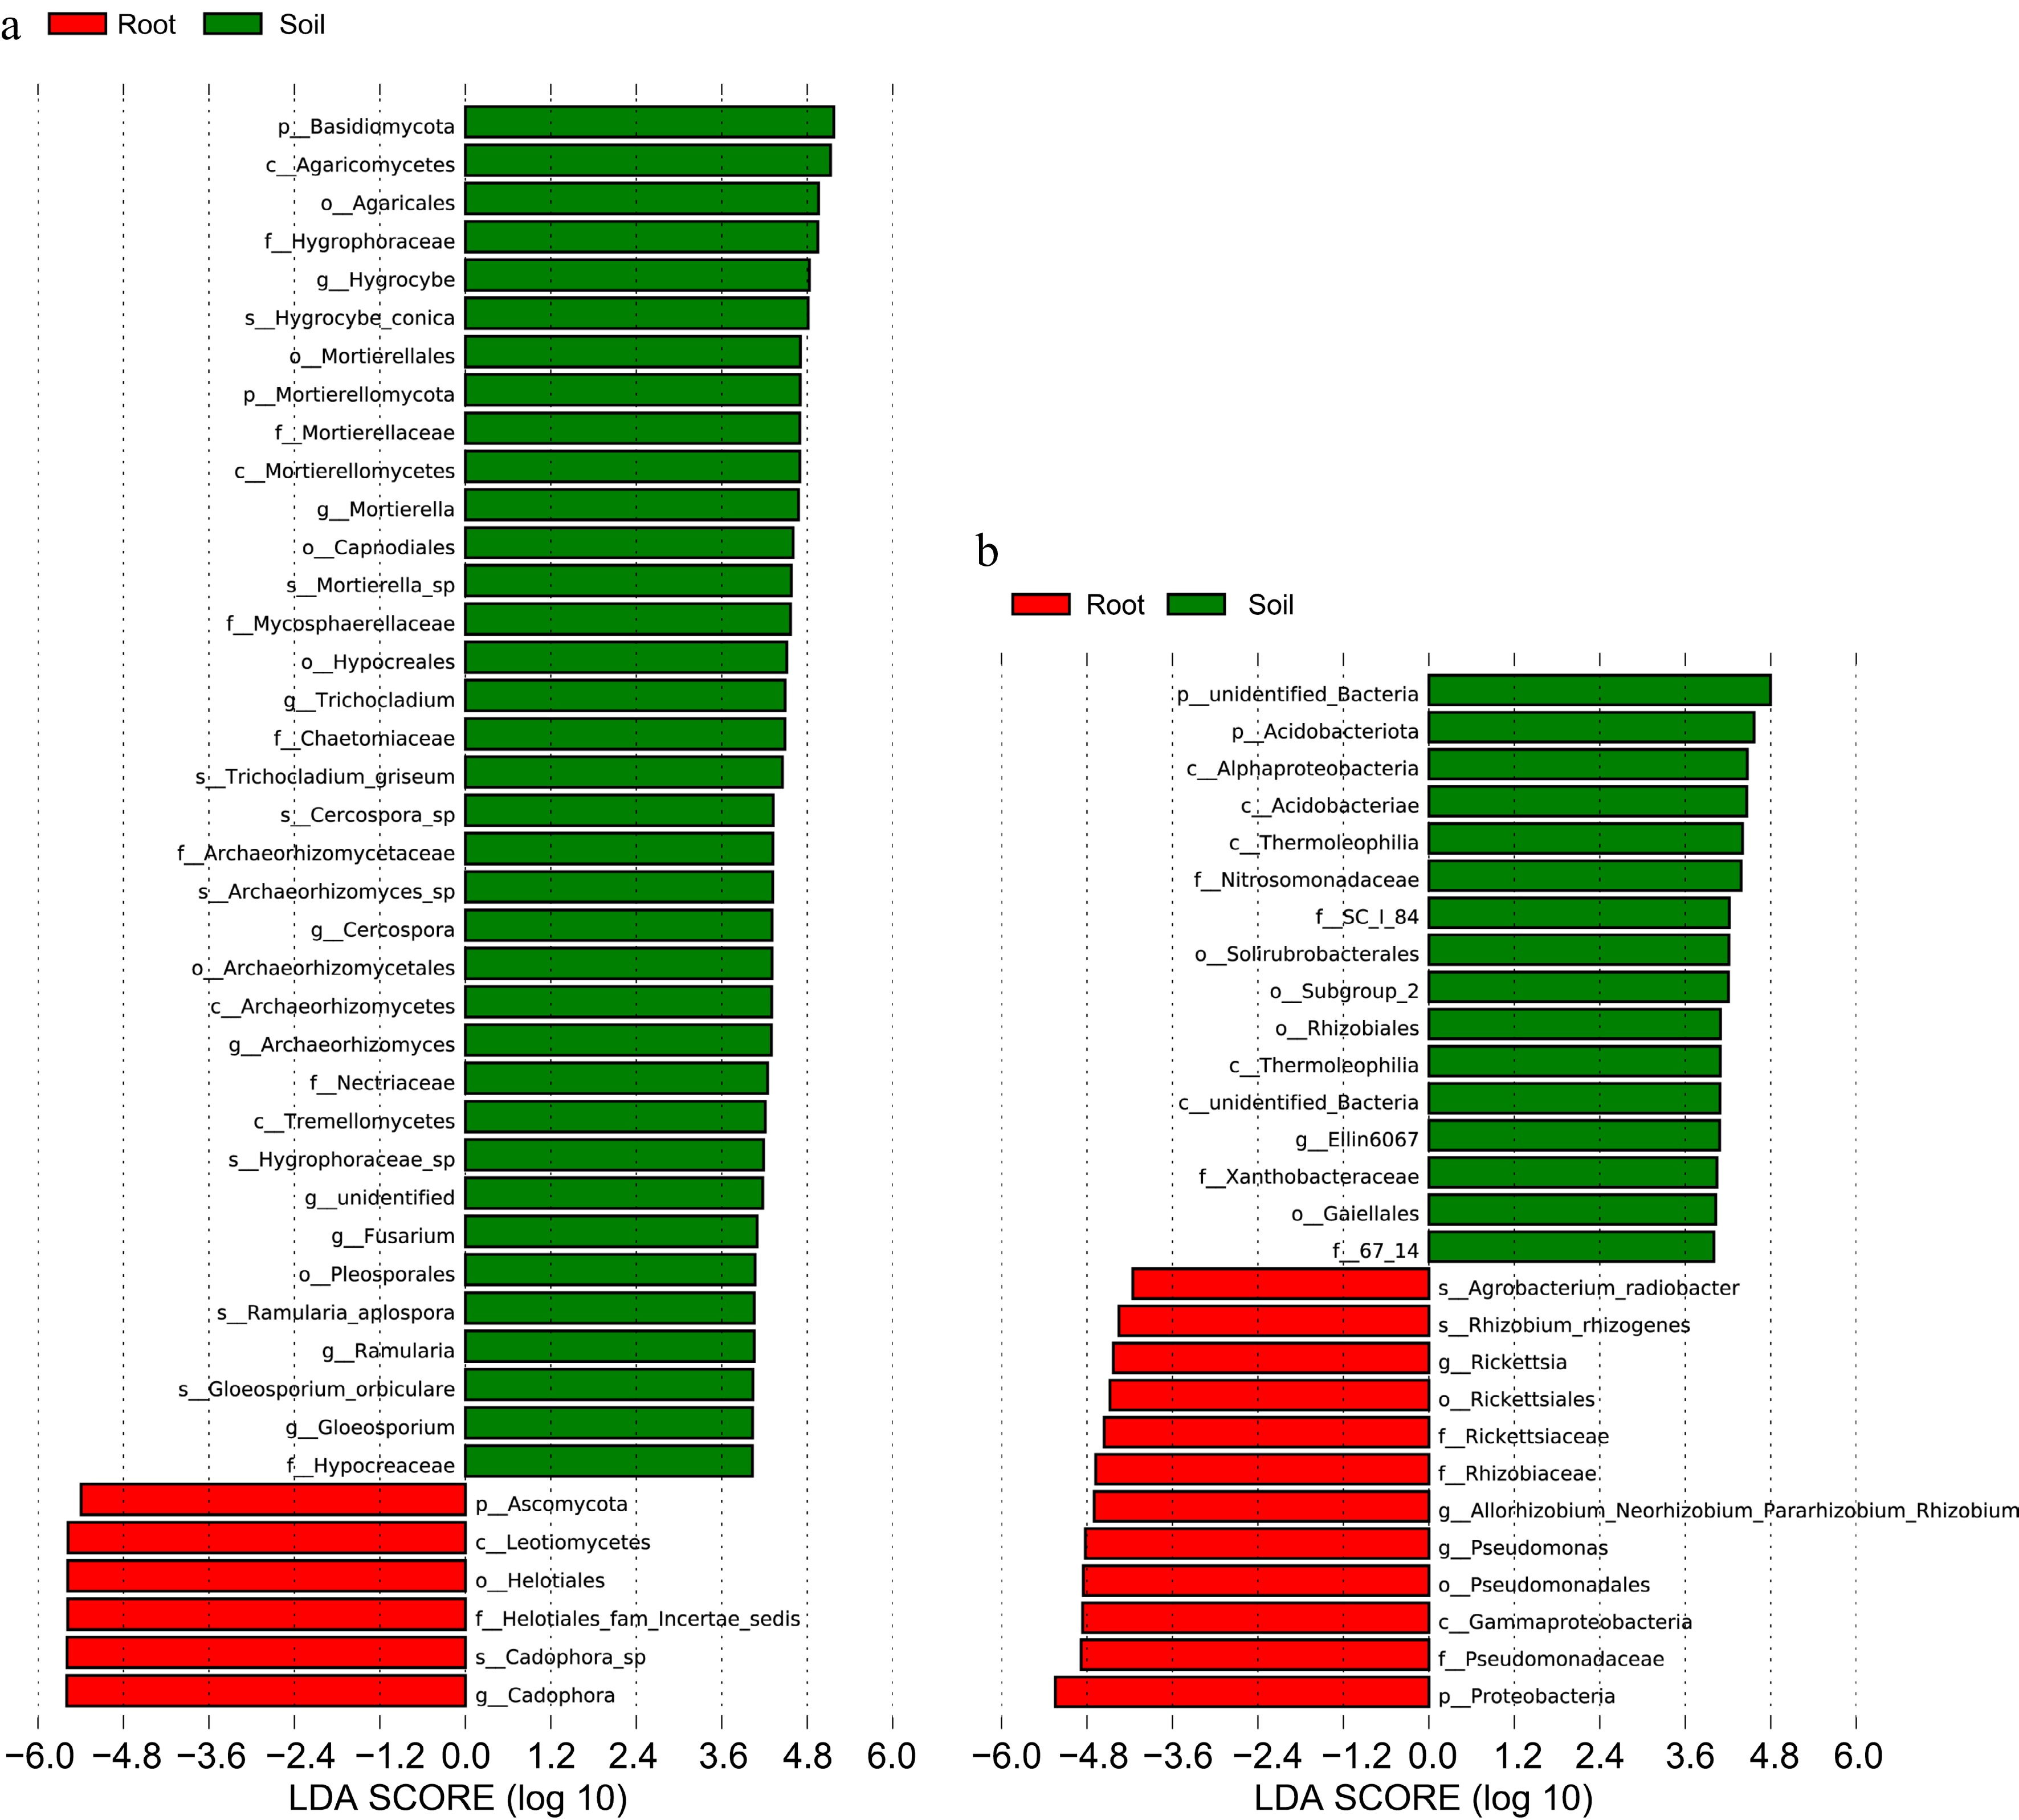
Figure 4.
Use of LDA score to respond to differences in groups of fungi and bacteria in roots and soil and the extent of species influence. (a) LDA score analysis of fungal communities. (b) LDA score analysis of bacterial communities.
-
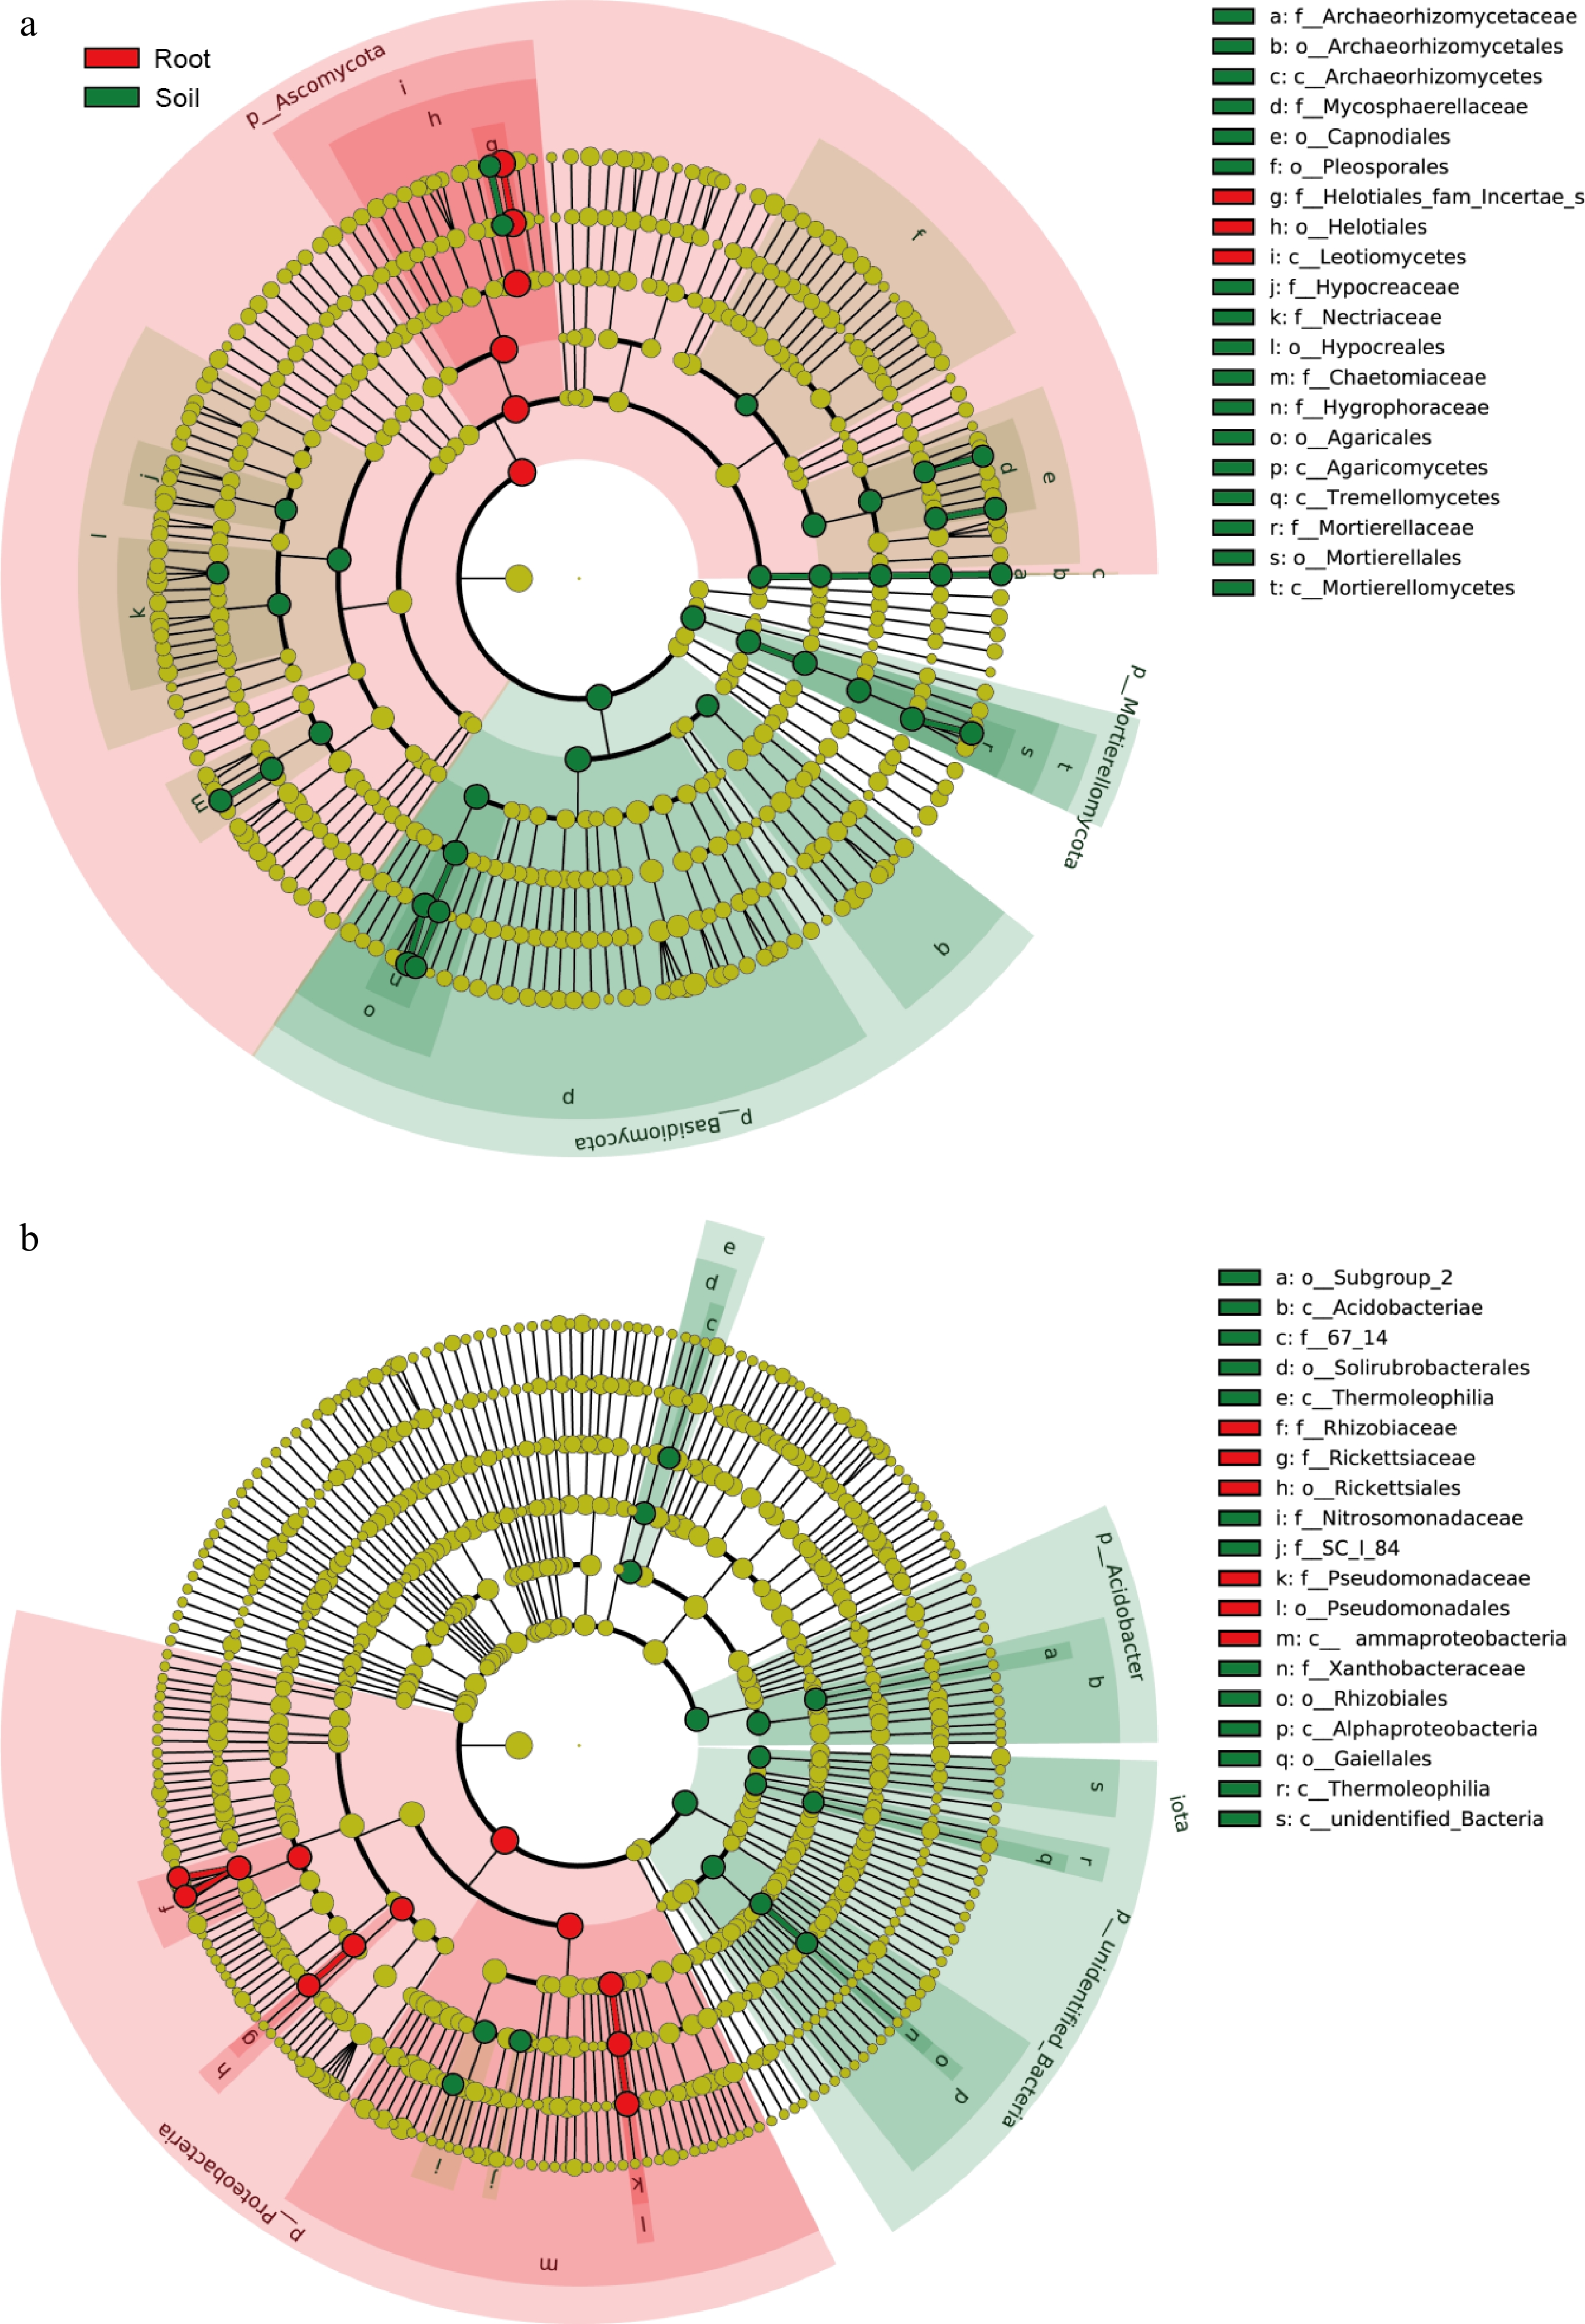
Figure 5.
Used LEfSe analysis of differential microorganisms between roots and rhizosphere. (a) LEfSe analysis of fungal communities. (b) LEfSe analysis of bacterial communities.
-
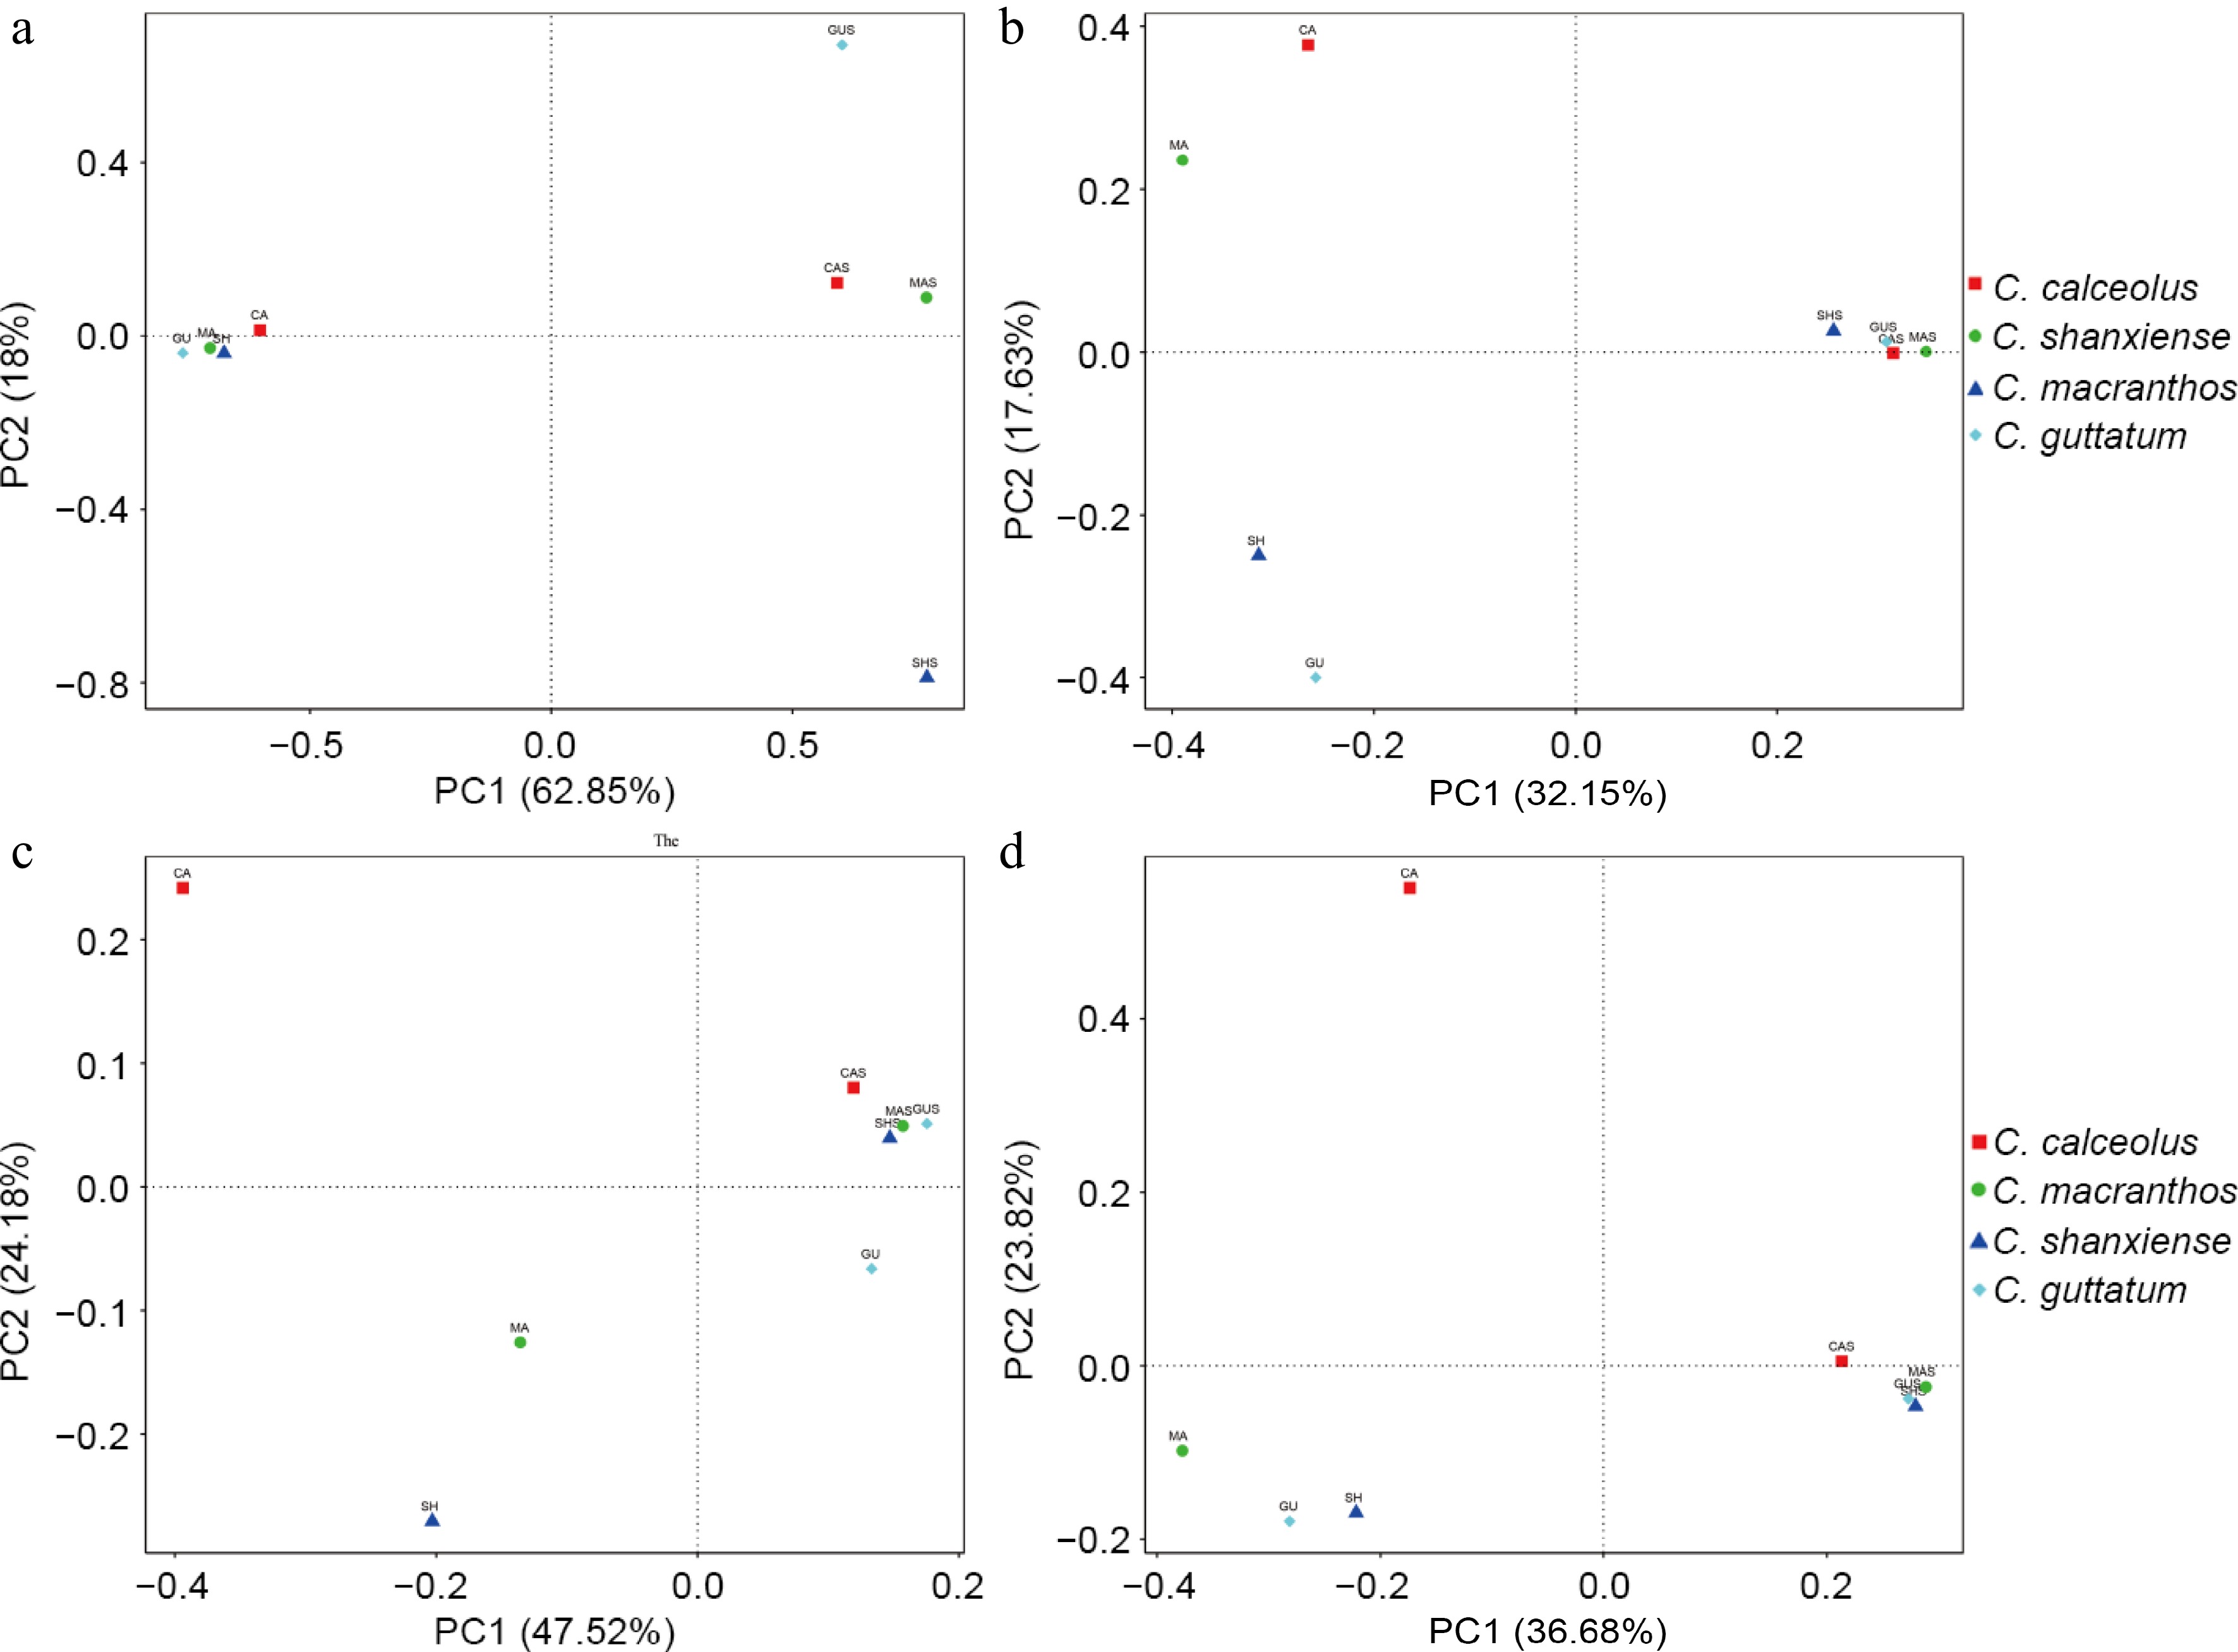
Figure 6.
Reflecting differences in community structure through PCoA analysis based on two distances. (a) PCoA on fungal communities based on weighted UniFrac distance. (b) PCoA on fungal communities based on unweighted UniFrac distance. (c) PCoA on bacterial communities based on weighted UniFrac distance. (d) PCoA on bacterial communities based on unweighted UniFrac distance.
-
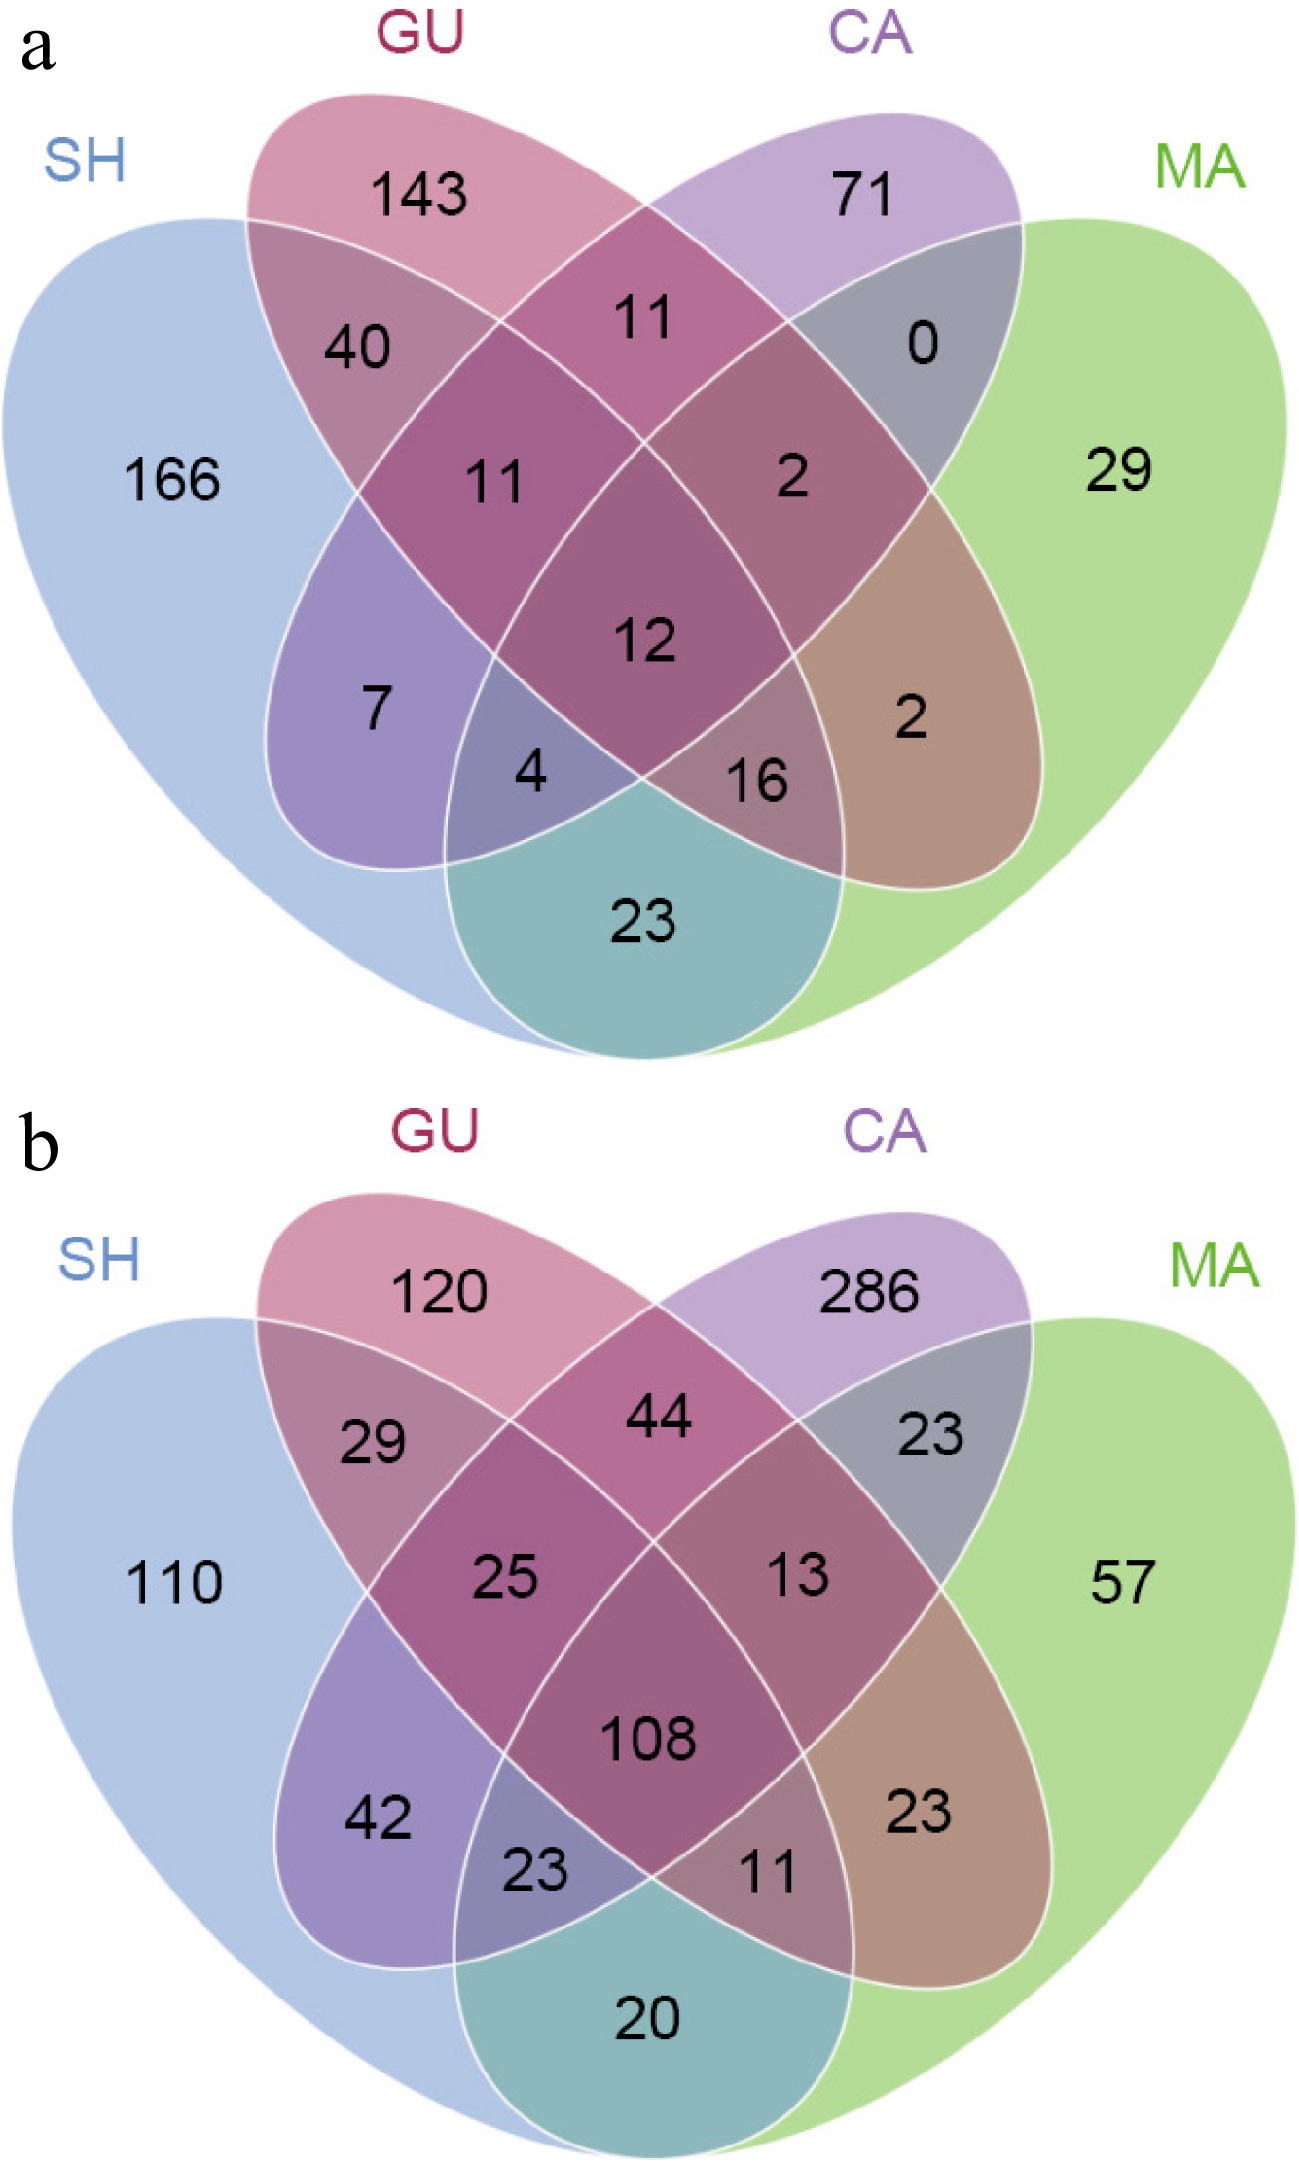
Figure 7.
Venn diagrams showing OTU distribution of (a) fungal, and (b) bacterial communities in each root sample.
-
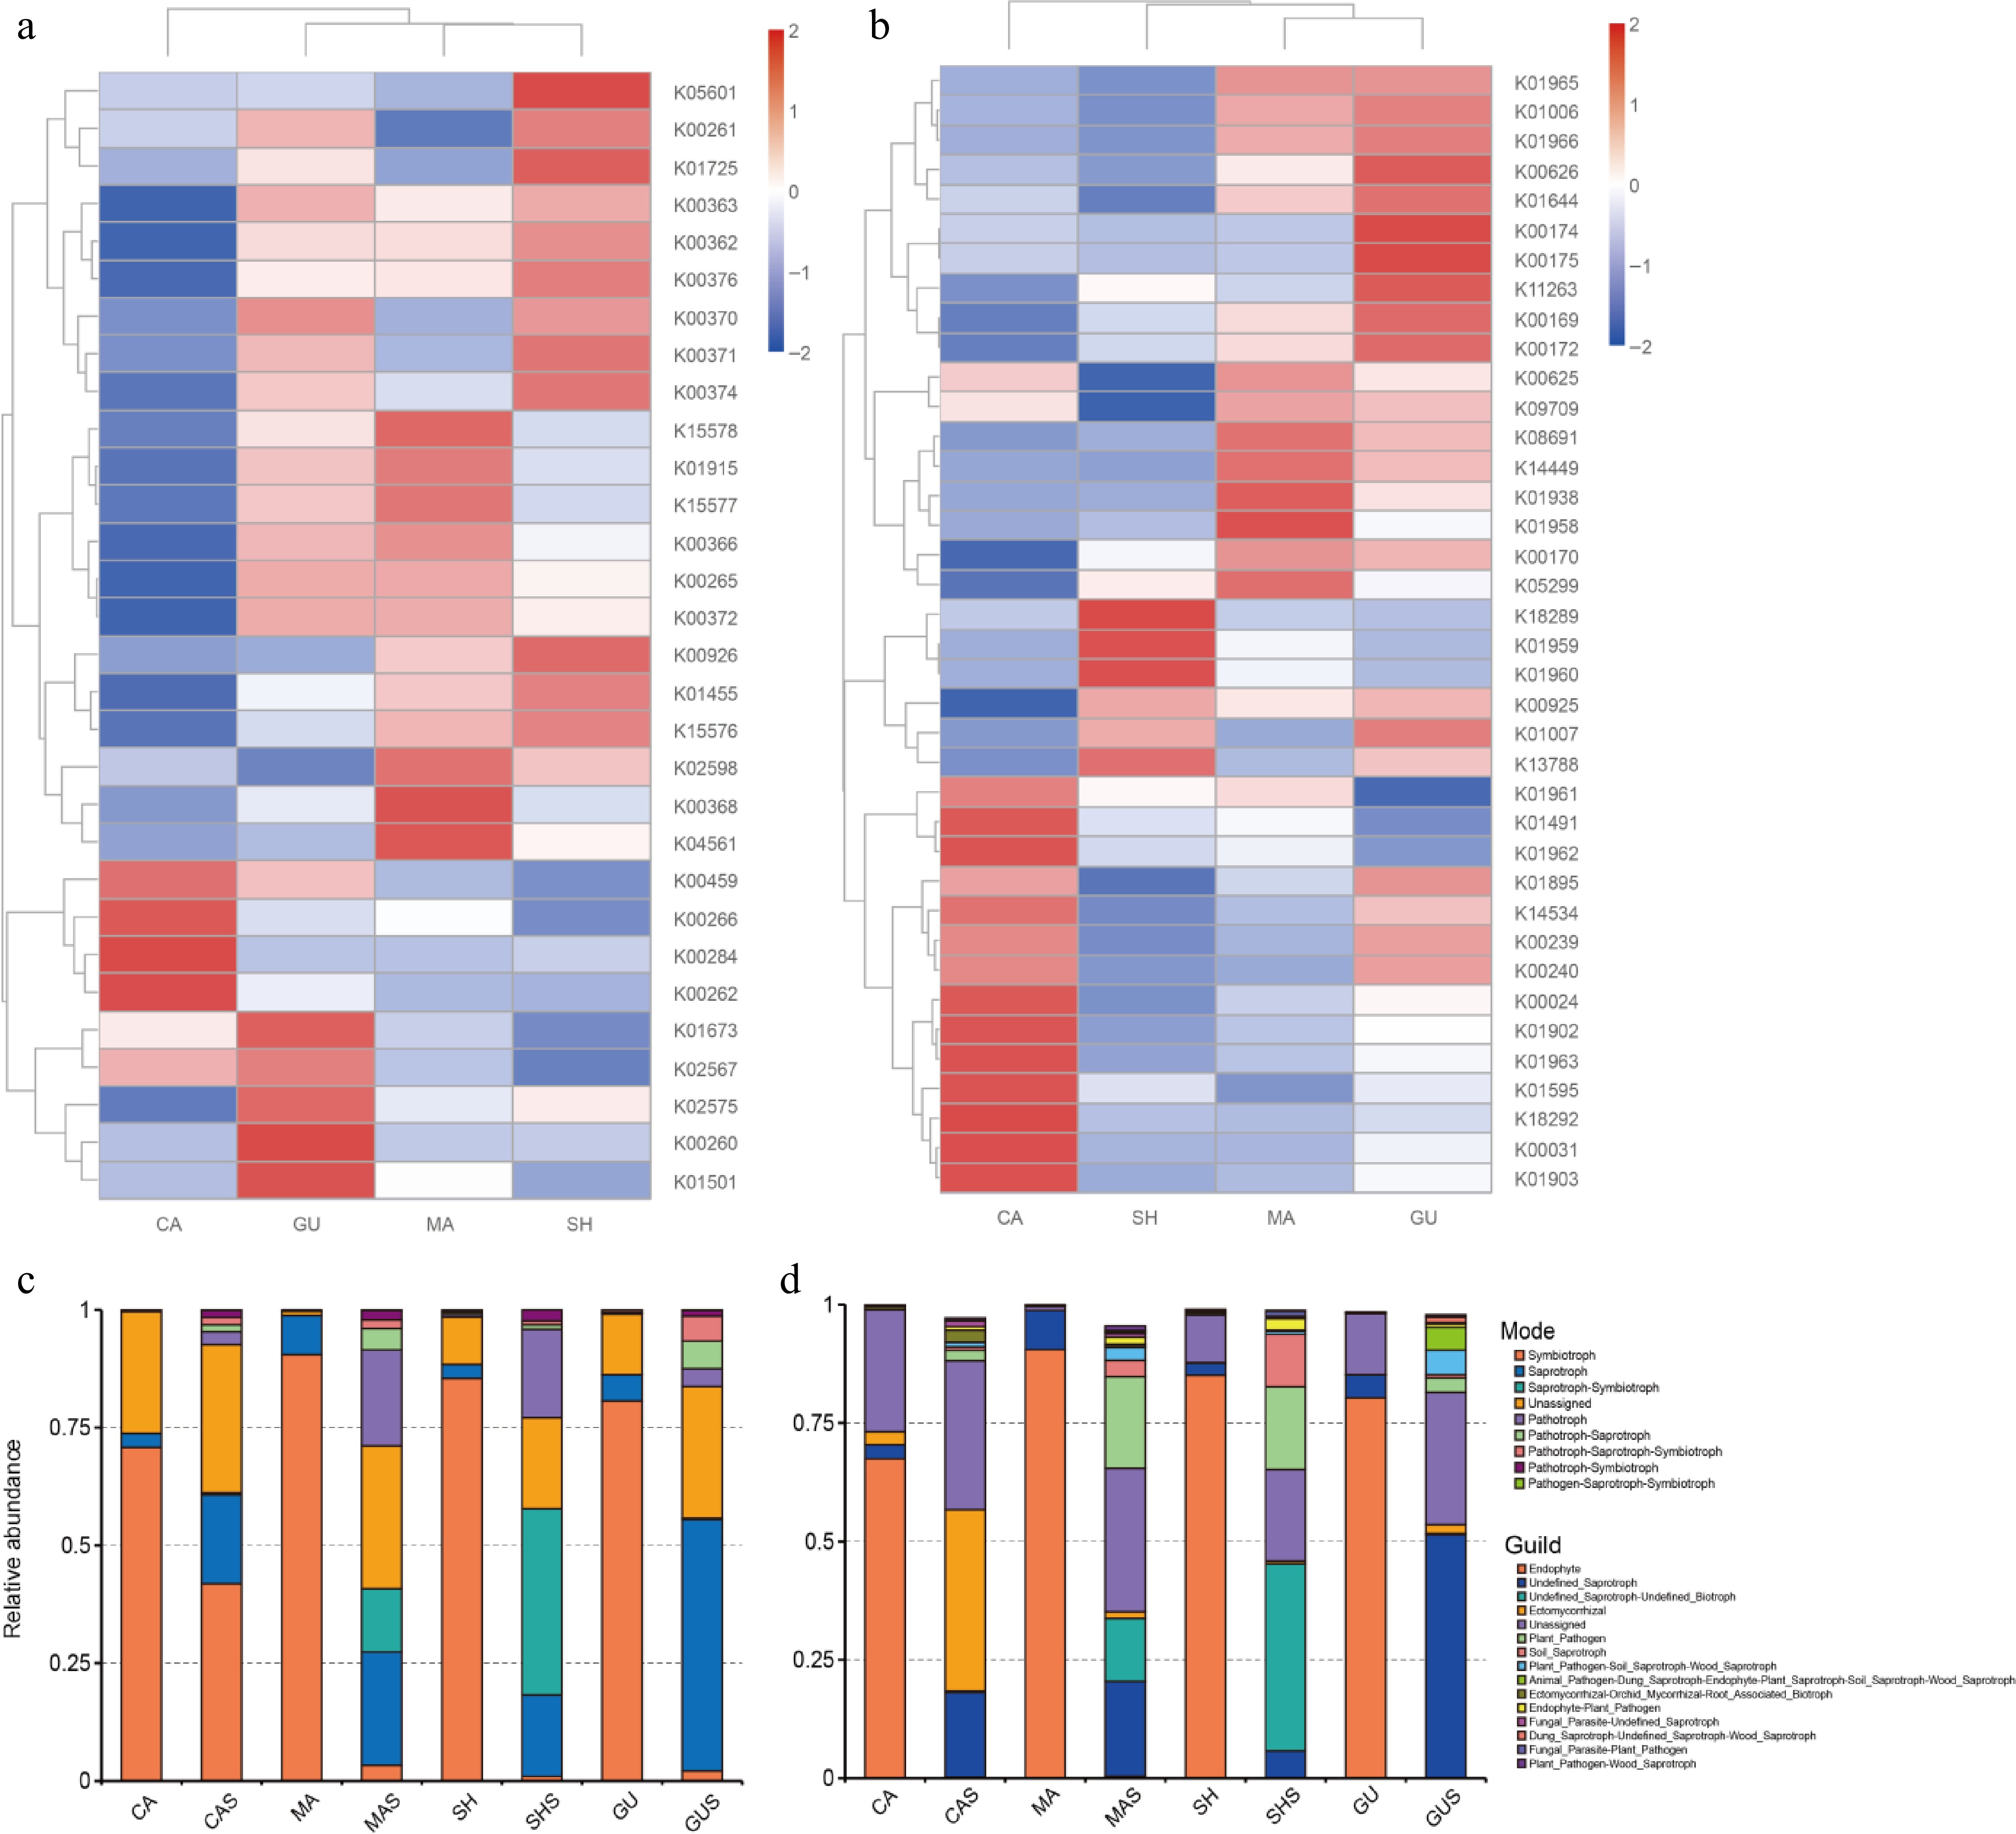
Figure 8.
Functional prediction of microorganisms based on PICRUSt2 with FUNGuild. (a) Nitrogen metabolism KOs are predicted based on 16S sequences. (b) Carbon fixation KOs are expected based on 16S sequences. (c) Mode obtained based on FUNGuild. (d) Guild obtained based on FUNGuild. K0s are classification system for proteins in (a), (b), where proteins with highly similar sequences and similar functions in the same pathway are grouped together. Where the K0s number are the gene identifier in KEGG, and the same gene K0s number are the same between different species.
-
Sequencing type Sample Shannon Simpson Chao1 Ace Good's coverage ITS CA 1.78 0.51 113.53 114.78 1 MA 1.46 0.46 84.39 87.77 1 SH 1.43 0.31 262.94 267.19 1 GU 1.36 0.35 225.47 228.23 1 CAS 5.69 0.93 995.48 1006.9 0.99 MAS 7.06 0.98 1,296.84 1,311.9 0.99 SHS 4.21 0.82 686.92 699.65 0.99 GUS 6.01 0.94 961.21 976.04 0.99 16S CA 5.57 0.93 566.56 579.49 0.99 MA 4.66 0.93 267.52 280.3 1 SH 3.94 0.8 367.05 383.46 0.99 GU 5.13 0.9 362.89 367.69 1 CAS 7.86 0.98 1,049.65 1,073.5 0.99 MAS 8.75 0.99 1,352 1,387.24 0.98 SHS 8.64 0.99 1,295.02 1,314.97 0.98 GUS 8.9 1 1,378.62 1,397.67 0.98 Table 1.
Alpha diversity of the endophytic and rhizosphere communities of four Cypripedium species.
Figures
(8)
Tables
(1)