-
Orchidaceae is the second-largest family of angiosperms, with about 28,000 species in 800 genera[1]. Almost all orchid plants benefit from endophytes, mainly through mycorrhizal fungi forming mycorrhizal symbiosis with host plants to provide nutrients for host plants[2]. Regardless of the nutritional pattern of orchids, endophytic, and mycorrhizal fungal nutrition are required for seed germination[3].
Endophytes are generally defined as microbiota that survive all or part of the life stage within a host plant and are non-pathogenic to the host[4]. Endophytes are found in almost all vascular plants[5]. Microorganisms from the rhizosphere and phyllosphere enter the host plant through natural openings or wounds and become endophytes[6]. Mycorrhizal fungi can enter the endoderm cells by infecting the surface cells of plant roots, and then successfully colonize the mycelium cells with carbon, vitamins, trace elements, and other plant rusts[7], which are ultimately ablated. During this process, the fungus continuously provide requirements to the orchid plant, which improves the resistance of plants to the adverse external environment.
Nowadays, endophytes can be used in the market as plant growth promoters and growth protection agents. By co-evolving with their host plants, endophytes can have several beneficial effects on their host plants directly or indirectly. Firstly, endophytes can help plants overcome adversity and increase nutrient uptake directly, such as to protect the host plants from biotic stresses[8], mitigate abiotic stresses on the host plants, also can increase phosphorus, nitrogen, and other primary and secondary nutrients to support host growth[9]. Secondly, growth hormones can be released indirectly to improve plant growth[10], such as through the release of lytic enzymes[11] or mediate host plant defense responses against various pathogens[12]. In addition to providing nutrients, endophytes also have a role in helping host plants[13] to adapt to different environments by increasing photosynthesis, and relieving plant stress[14,15]. Endophytes and host pathogens occupy the same ecological niche and compete with each other for space and nutrients.
The mycorrhizal fungi of most orchid plants mainly consist of ectomycorrhizal fungi and Rhizoctonia. Rhizoctonia is a polyphyletic group comprising Tulasnellaceae, Ceratobasidiaceae, and Serendipitaceae[16,17]. These fungi are orchid mycorrhizal fungi. In addition to mycorrhizal fungi, endophytes also encompass non-mycorrhizal endophytic fungi. The Waiting Room Hypothesis suggests that these non-mycorrhizal endophytes may transition into mycorrhizal fungi. These non-mycorrhizal endophytic fungi also have the potential to function as mycorrhizal fungi while performing other roles[17]. Most endophytes are difficult to isolate from plant tissues by culture, and an increasing number have discovered the phenomenon in recent years due to the widespread use of high-throughput sequencing.
There are approximately 50 species of Cypripedium, which have been widely distributed in the north temperate and subtropical mountains, with 36 species distributed in China[18]. Changbai Mountain, situated in the southeast of Jilin Province, is a natural treasure trove of plants and one of the secondary distribution centers of Cypripedium in East Asia[19]. There are primarily five species and one variant of Cypripedium distributed in Changbai Mountain, all endangered plants in China[20]. In recent years, the continuous development of forest resources has destroyed the original habitat of Cypripedium plants. Destructive collection practices have caused a sharp decline in the population of wild Cypripedium, leading to their endangered status[21].
Genetic studies on the interaction between endophytes and plant hosts are scarce, but it is important to explore the principles of the interaction between both of them. In this paper, the endogenous and rhizosphere ITS and 16S sequences of four Cypripedium species, C. calceolus, C. macranthos, C. shanxiense, and C. guttatum were analyzed and used to investigate the structural features and potential functions of these microbial communities with Cypripedium in Changbai Mountains. In this paper, the main purpose is to investigate the differences between the roots and soil microbial communities, to study which fungi and bacteria play important roles in the growth process of Cypripedium, and to compare the richness of microbial diversity of four Cypripedium species. Finally, the functions of the endophytes of the four species, Cypripedium were predicted. The expression of genes related to plant endophytes and nutrient cycling can be better understood, and different genes are involved in plant nitrogen fixation or hormone and antibiotic production to promote plant growth or alleviate various stresses and improve agricultural productivity.
In addition, the following hypotheses can be formulated based on the results of this paper:
1. There is a significant difference in microbial community structure between endophytic and root environments.
2. Microorganisms can recruit specific flora and thus favor plant growth.
-
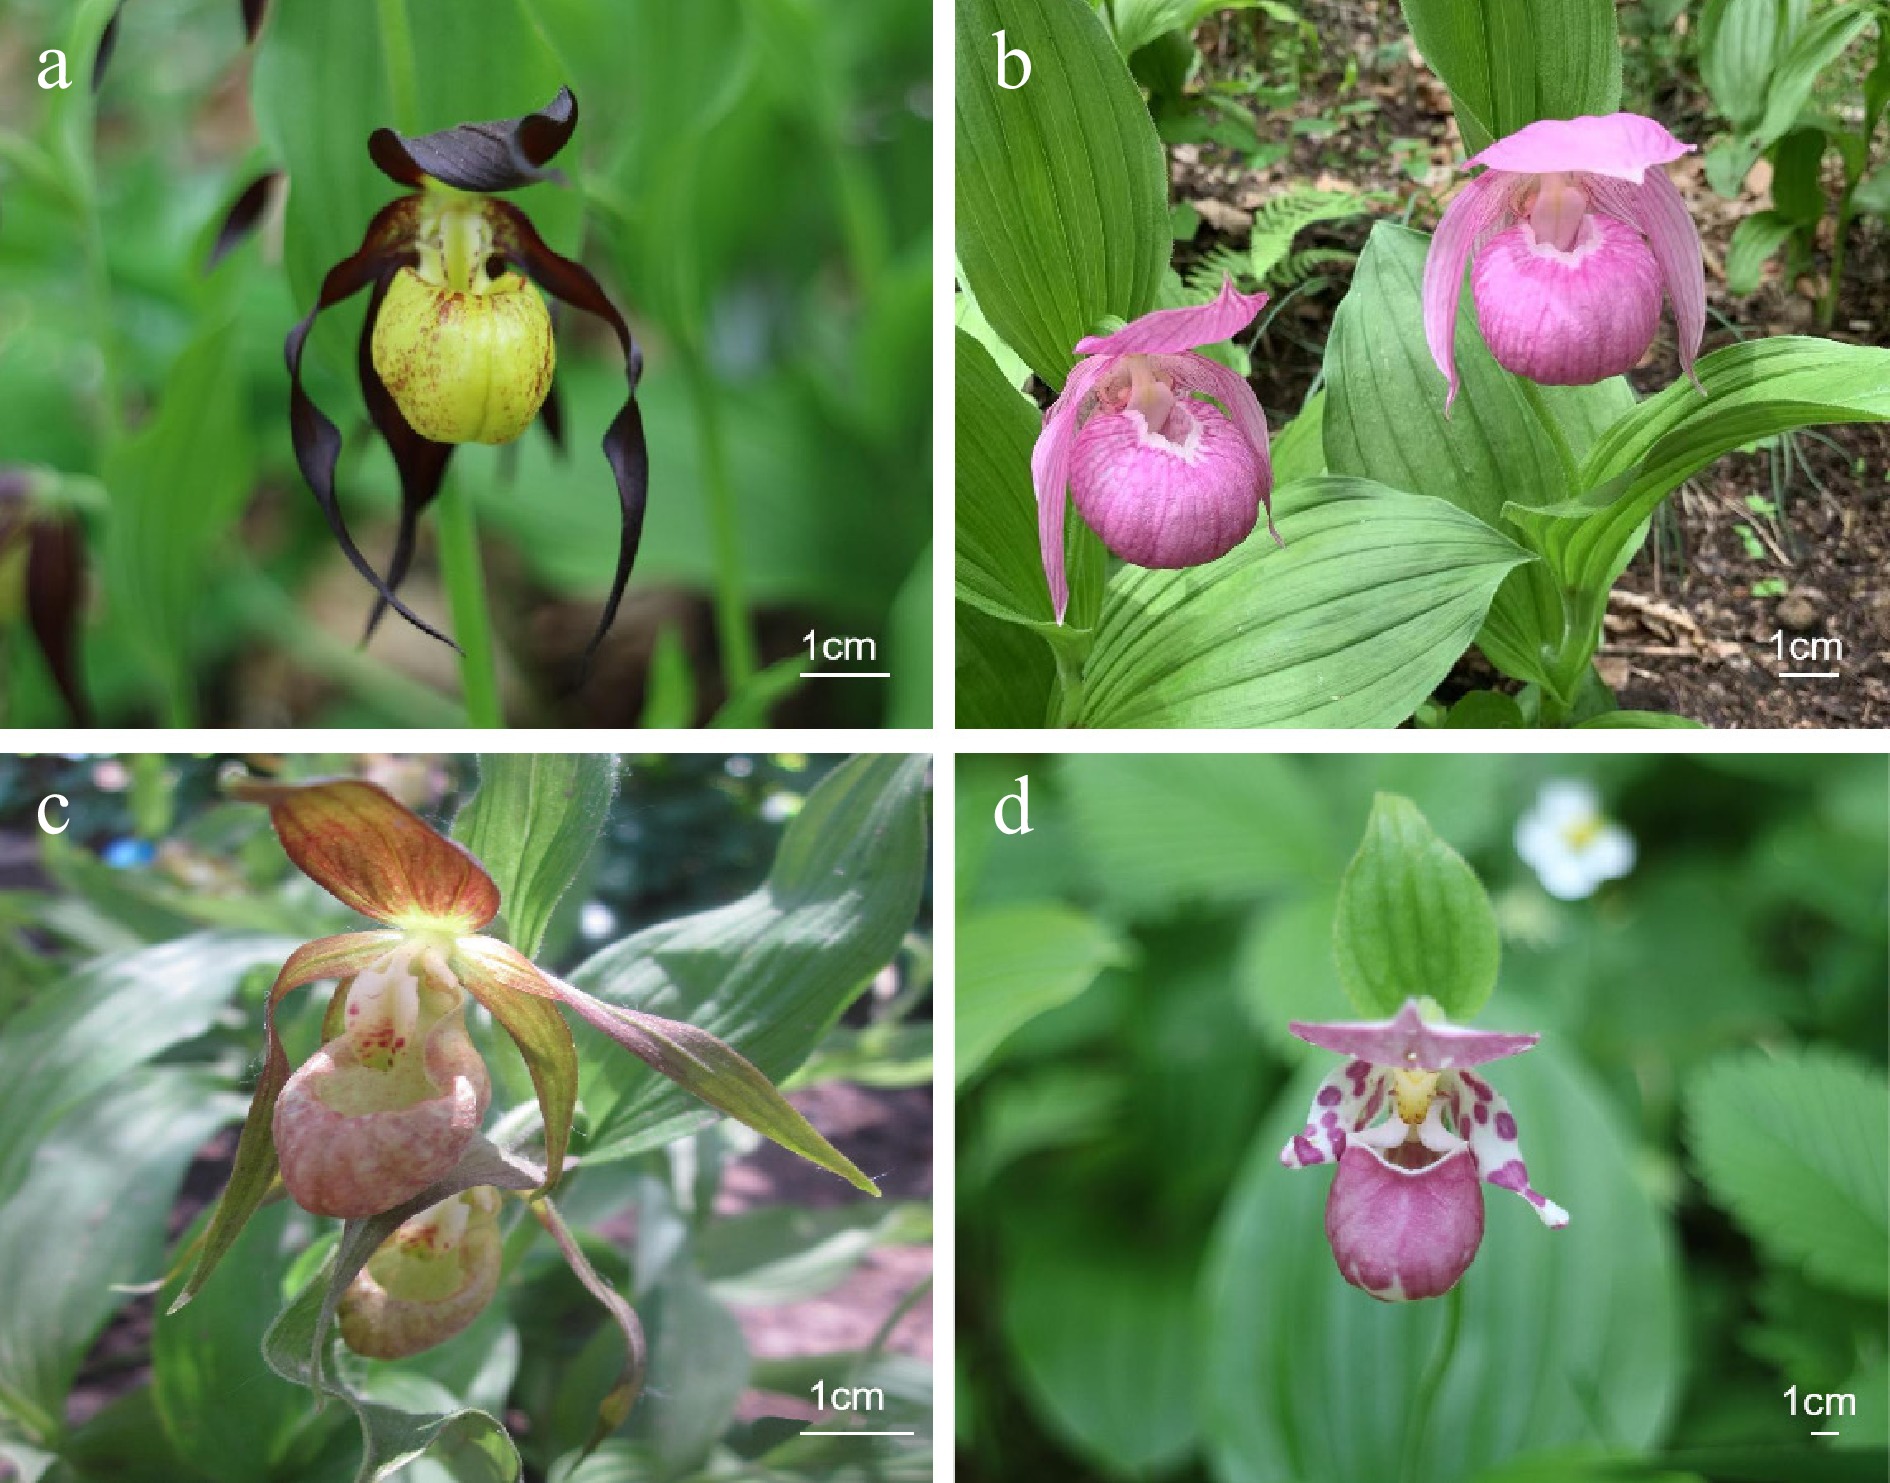
C. calceolus, C. macranthos, C. shanxiense, and C. guttatum (Fig. 1a−d) four species of Cypripedium were treated as objects of this experiment. All originated from Changbai Mountain (altitude 2,500 m, N41°35'−42°25', E127°40'−128°16'), which have a temperate and cold-temperate continental monsoon climate. C. calceolus and C. macranthos were located in Yanbian Korean Autonomous Prefecture, Jilin Province (N42°53'28.28", E129°30'32.76") and Linjiang City, Jilin Province (N41°48'42.95", E126°55'4.73"). C. shanxiense and C. guttatum were located in Baishan City, Jilin Province (N41°56'42.25", E126°25'1.20"). Three healthy plants of each species were selected from their habitats. The nutrient roots were cut from the tip of the root upwards to a length of about 5 cm as root samples, and the soil within 2 cm from the root surface was used as rhizosphere samples. No more than 30% of the total roots of the Cypripedium were collected and therefore their growth was not affected. The collected samples were numbered separately as (CA, MA, SH, GU) for root samples and (CAS, MAS, SHS, GUS) for rhizosphere samples, labeled with complete sampling location time and other information. Root samples need to be preserved in an appropriate amount of fresh soil and brought them back to the laboratory in a low-temperature ice box.
Root samples were soaked in 0.1% Tween-20 (0.1%) for 1 h, followed by rinsing in sterile water to remove surface contaminants once, then treated with 2% sodium hypochlorite for 3 min and 75% alcohol for 3 min. The samples were then rinsed three times with sterile water and dried by wiping them with sterilized filter paper. Collected the rinse water and used the plate culture method to verify if the surface disinfection of the root samples were sufficient. Rhizosphere samples were filtered through a 2 mm sieve and distributed into 50 mL centrifuge tubes. After processing, samples were stored at −80 °C for future use.
DNA extraction and high-throughput sequencing
-
Roots use the CTAB method to extract DNA, while the Magnetic Soil and Stool DNA Kit was used to extract DNA from the rhizosphere soil. The integrity of the DNA samples was evaluated using 2% agarose gel electrophoresis. The concentration and purity of the DNA were determined using the NanoPhotometer® NP80 (Imlen GmbH, Munich, Germany).
Using the diluted genomic DNA as a template, specific primers ITS5-1737F (5'-GGAAGTAAAAGT CGTAACAAGG-3') and ITS1-2043R (5'-GCTGCGTTCT TCATCGATGC-3') were used to amplify the fungal ITS1 region by PCR. Specific primers 515f (5'-GTGCCAGCMGCCGCGGTAA-3') and 806r (5'-GGACTACHVGGGTWTCTAAT-3') were used to PCR amplify the V4 region of 16S rRNA. PCR was performed using efficient and high fidelity enzymes (Phusion® High-Fidelity PCR Master Mix with GC Buffer from New England Biolabs) to accurate amplification.
The 30 μL PCR reaction system used contains 15 μL of 20 mmol/L Phusion Master Mix, 3 μL of 2 μmol/L primer, 10 μL of 1 ng/μL g DNA, and 2 μL of ddH2O. The amplification program is 98 °C pre-denaturation for 1 min; 30 cycles including denaturation at 98 °C for 10 s, annealing at 50 °C for 30 s; extension at 72 °C for 30 s; and a final extension at 72 °C for 5 min.
Novogene (Beijing, China) completed library preparation, homogenization, detection, on machine sequencing, and data quality control. Illumina MiSeq 6000 (Illumina Inc, San Diego, CA, USA) performed 150 bp paired-end sequencing. The obtained raw data was filtered to obtain clean data for bioinformatics analysis. Fastqc initially checks the quality of the raw data, using Trimmomatic Quality Control, comparing databases to remove sequences of plant origin, and Fastqc checks the quality of the sequences after quality control.
Bioinformatics and statistical analysis
-
Operational taxonomic units (OTUs) clustering analysis of the clean data was conducted using UPARSE with a 97% similarity threshold, and homogenization was employed for the subsequent studies[22]. QIIME compared OTUs to the Unite and SILVA databases for species annotation[23]. Based on the OTUs clustering results, the alpha diversity indices, including Chao1, Shannon, Simpson, and ACE, of the microbial community were calculated using the 'vegan' package in R to assess the diversity of the microbial community in all samples, and the dilution curves were plotted to validate the sequencing results[24]. To illustrate the community differences between different species, the VennDiagram of the R package drew Venn diagrams to determine the species composition of different OTUs[25]. Principal coordinate analysis (PCoA) and UPGMA hierarchical clustering based on the UniFrac distance index reveal distinct community patterns among the samples[24,26]. LEfSe analyzed the differential species in samples between groups[27]. PICRUSt2 and FUNGuild were used to predict the functions of microbial communities[28,29]. All heatmaps and histograms were created using 'ggplot2'[30]. Gene sequences were functionally annotated by KEGG[31].
-
In this study, Illumina MiSeq sequencing was conducted on root and rhizosphere samples collected from four species of Cypripedium. The sequencing results were uploaded to NCBI under BioProject ID PRJNA1053683 and PRJNA1053873. Sequencing results obtained 261,179 fungal and 166,075 bacterial sequences from roots and 249,878 fungal and 170,447 bacterial sequences from the rhizosphere. These sequences clustered into 2,575 fungal OTUs and 2,251 bacterial OTUs, with 534 fungal OTUs and 1,043 bacterial OTUs were identified in the root samples. By plotting the rarefaction curves, all samples' ends tend to be parallel (Fig. 2a, b), indicating that the sequencing data from this study were adequate to encompass most of the microbial community structure.
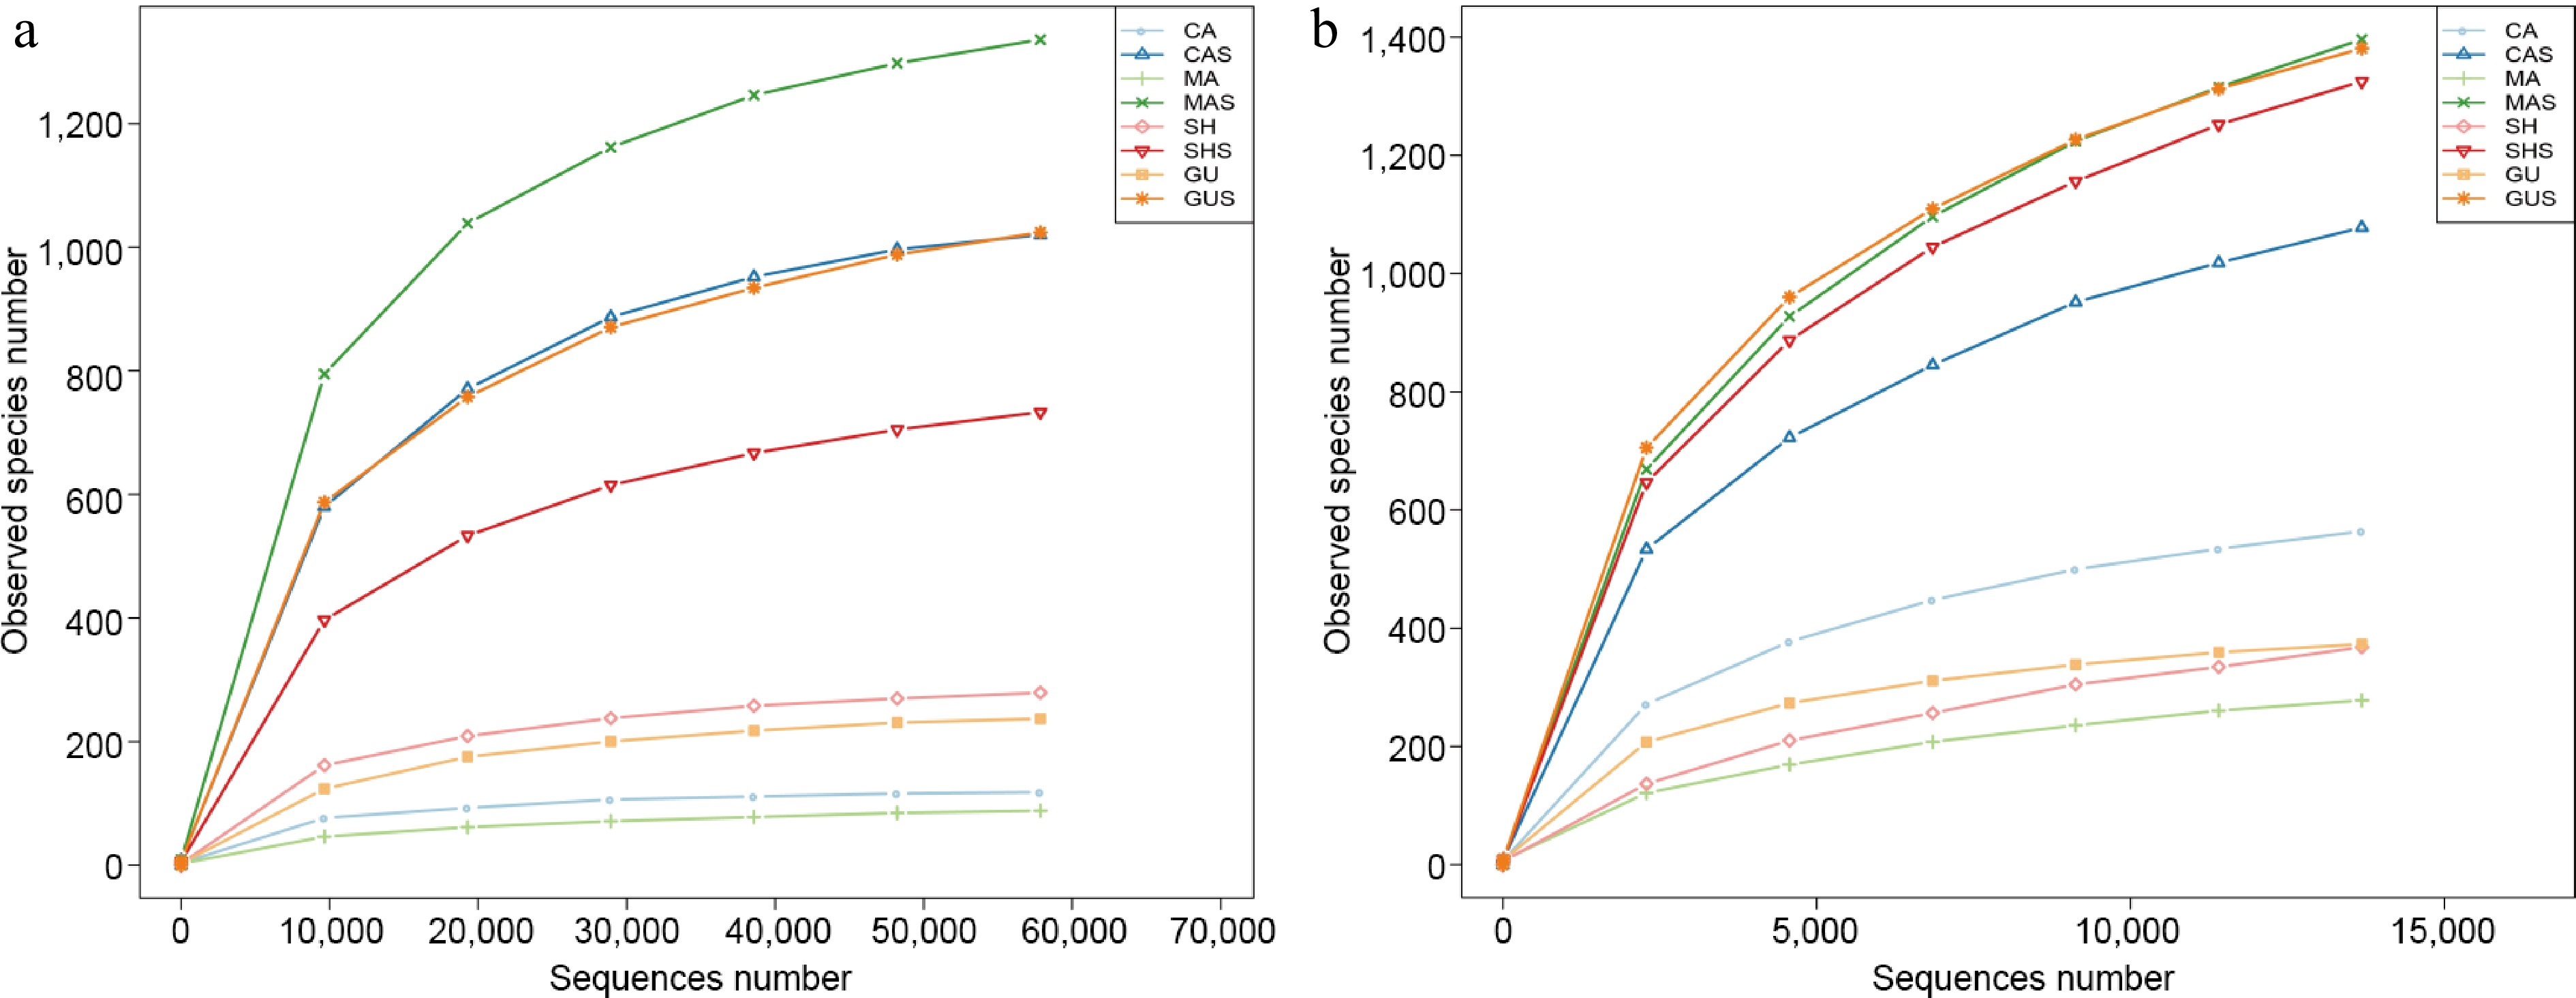
Figure 2.
Rarefaction curves plotted for (a) ITS and, (b) 16S sequencing. The root samples of C. calceolus, C. macranthos, C. shanxiense, and C. guttatum were CA, MA, SH, and GU, respectively. The rhizosphere samples of C. calceolus, C. macranthos, C. shanxiense, and C. guttatum were CAS, MAS, SHS, and GUS, respectively.
In the microbial communities of the roots and rhizosphere samples of four species, 48 species, 127 classes, 308 orders, 487 families and 852 genera have been found. These include 14 fungal phyla and 34 bacterial phyla. Ascomycota, Basidiomycota, Mortierellomycota, and Chytridiomycota were the predominant fungal species at the phylum level. This can be visualized by plotting in Fig. 3, Ascomycota was generally highly enriched in the root samples compared to the rhizosphere samples. In contrast, basidiomycetes increased in all three samples outside MA, but the degree of increase was much lower than in the rhizosphere samples (Fig. 3a). Within the endophytic Ascomycota, the genus Cadophora holds an overwhelmingly dominant position (Fig. 3b). The genus Cadophora was highly enriched in four species of Cypripedium, comprising 80.81% ± 9.84% of all endophytic fungi. Other dominant genera were present in each sample, with Russula and Llyonectria prevalent in CA, Titaea in MA, and Orbilia in GU. Pseudomonadaceae was commonly found in the roots and soil of four Cypripedium, but was less abundant in CAS and GUS, and the Rhizobiaceae was present in both roots and soil within four Cypripedium (Fig. 3d). All rhizosphere samples were clustered under a single branch, and four root samples of fungi were similarly located in a separate branch (Fig. 3a & c).
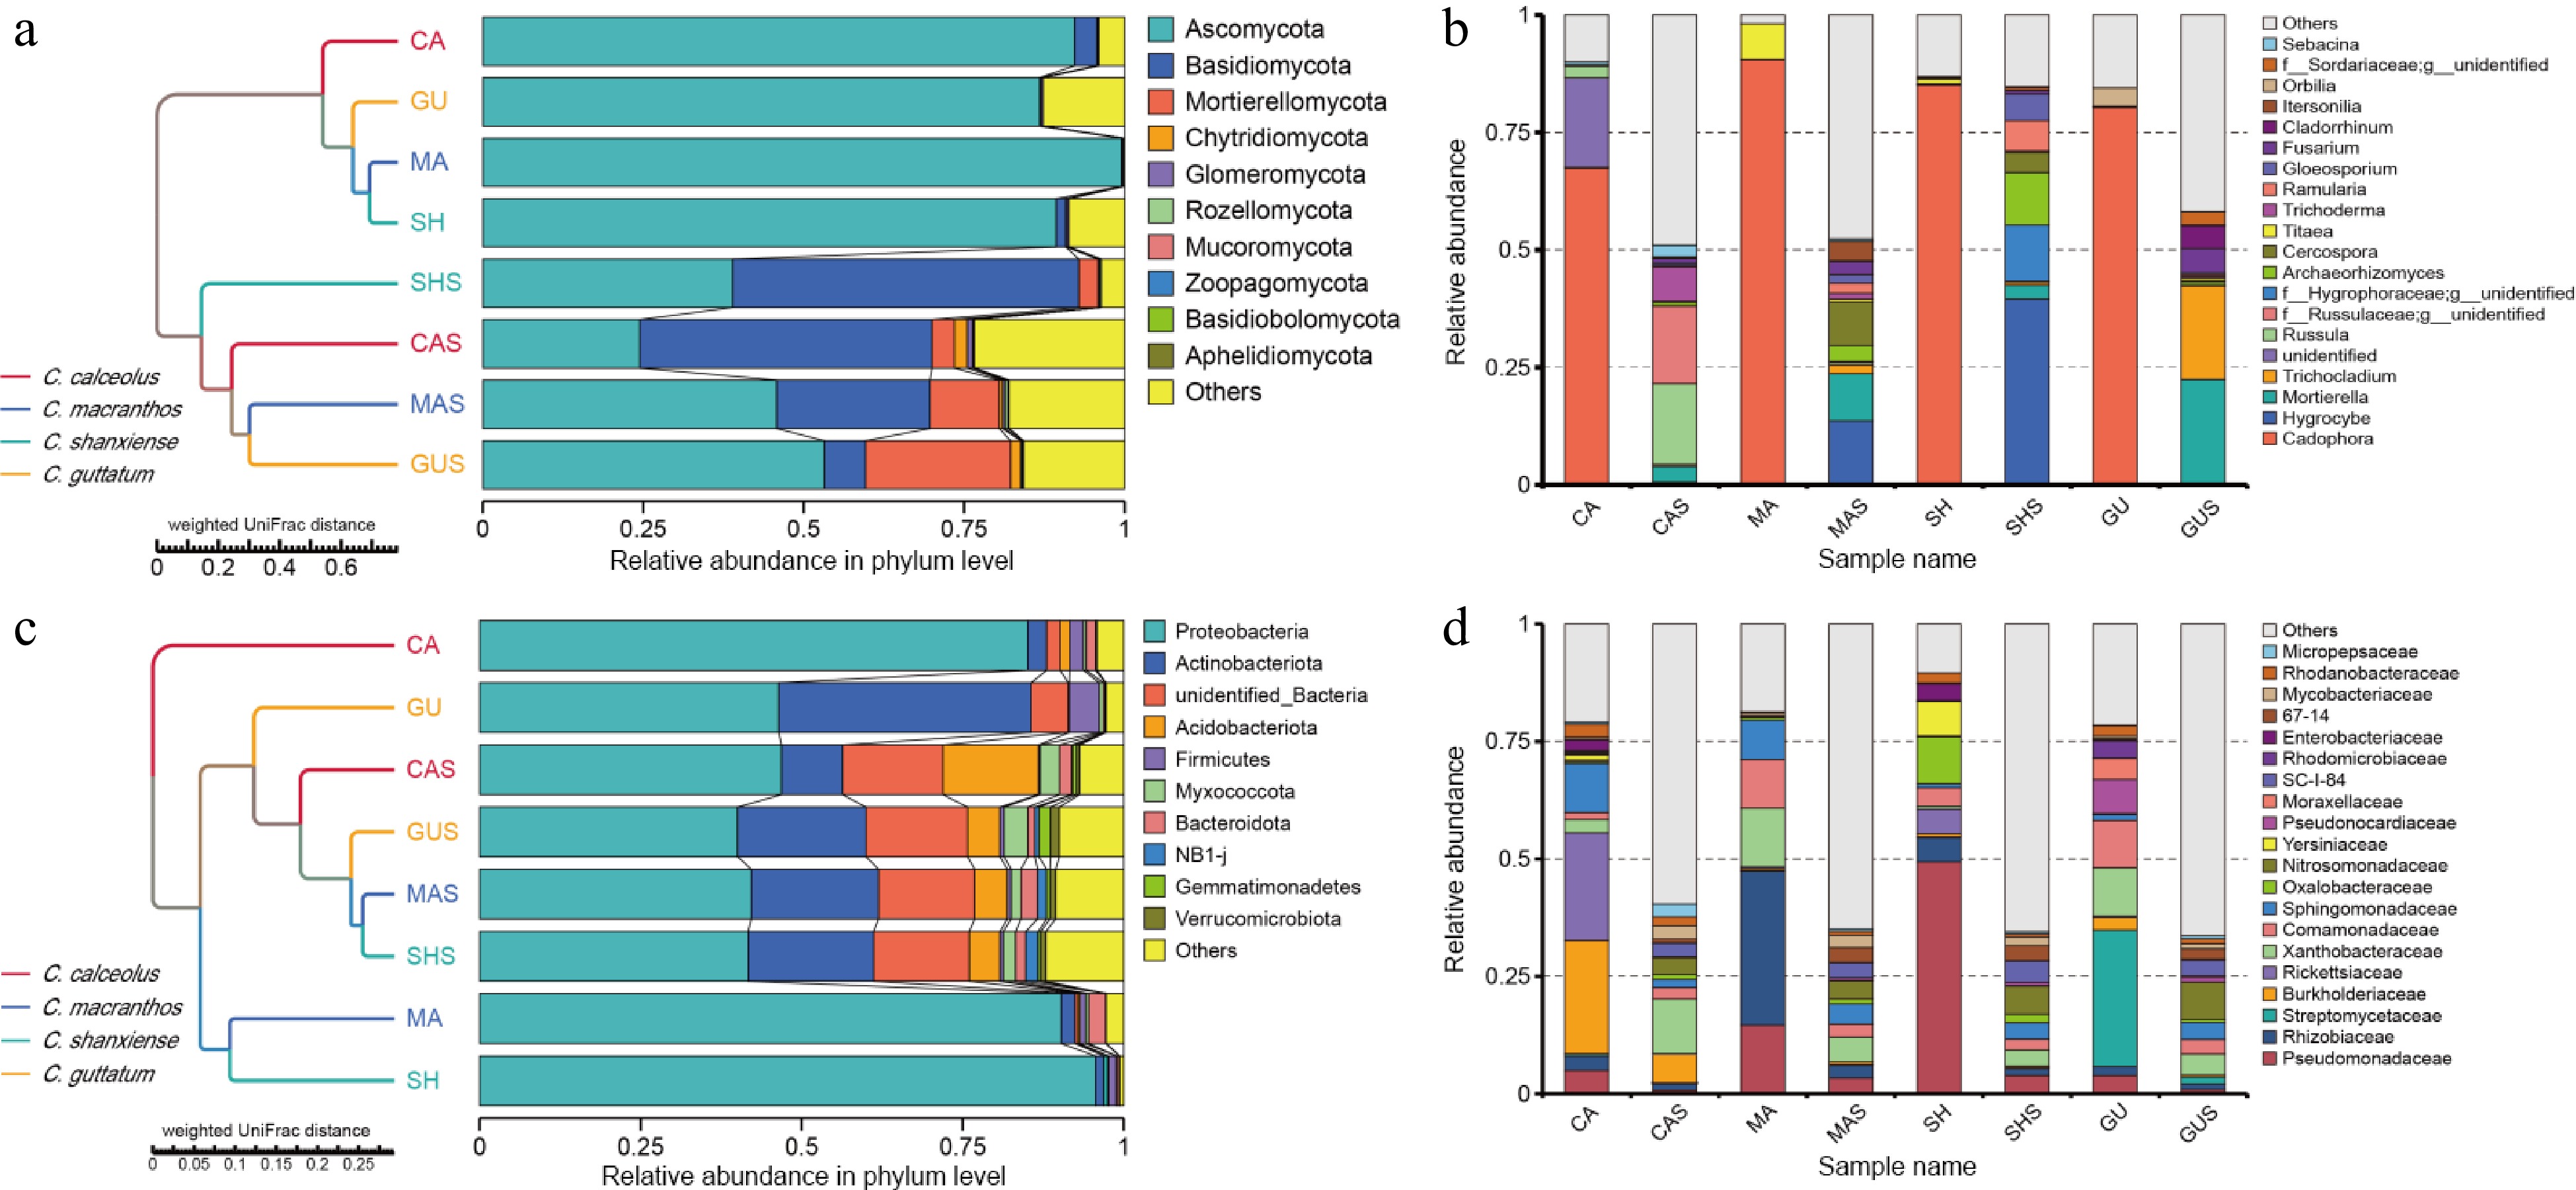
Figure 3.
The relative abundance and composition of microorganisms in each sample. UMPGA clustering of phylum-level species in (a) root, and (c) rhizosphere samples based on weighted UniFrac distances. (b) Relative abundance of genus-level fungal communities. (d) Relative abundance of family-level bacterial communities.
Mapping LEfSe (LDA score > 4) based on endophyte and rhizobial community structure to analyze differences in their respective community. On the fungal level, Basidiamycota was the differential species with the highest level of root impact and Hypocreaceae was the differential species with the lowest level of roots impact; Cadophora was the differential species with the highest level of soil impact and Ascomycota was the differential species with the lowest level of soil impact (Fig. 4a). On the bacterial level, except for unidentified bacteria. Acidobacteriota was the differential species with the highest degree of root influence and 67_14 was the differential species with the lowest degree of roots influence; Proteobacteria was the differential species with the highest degree of soil influence and Agrobacterium was the differential species with the lowest degree of soil influence (Fig. 4b).
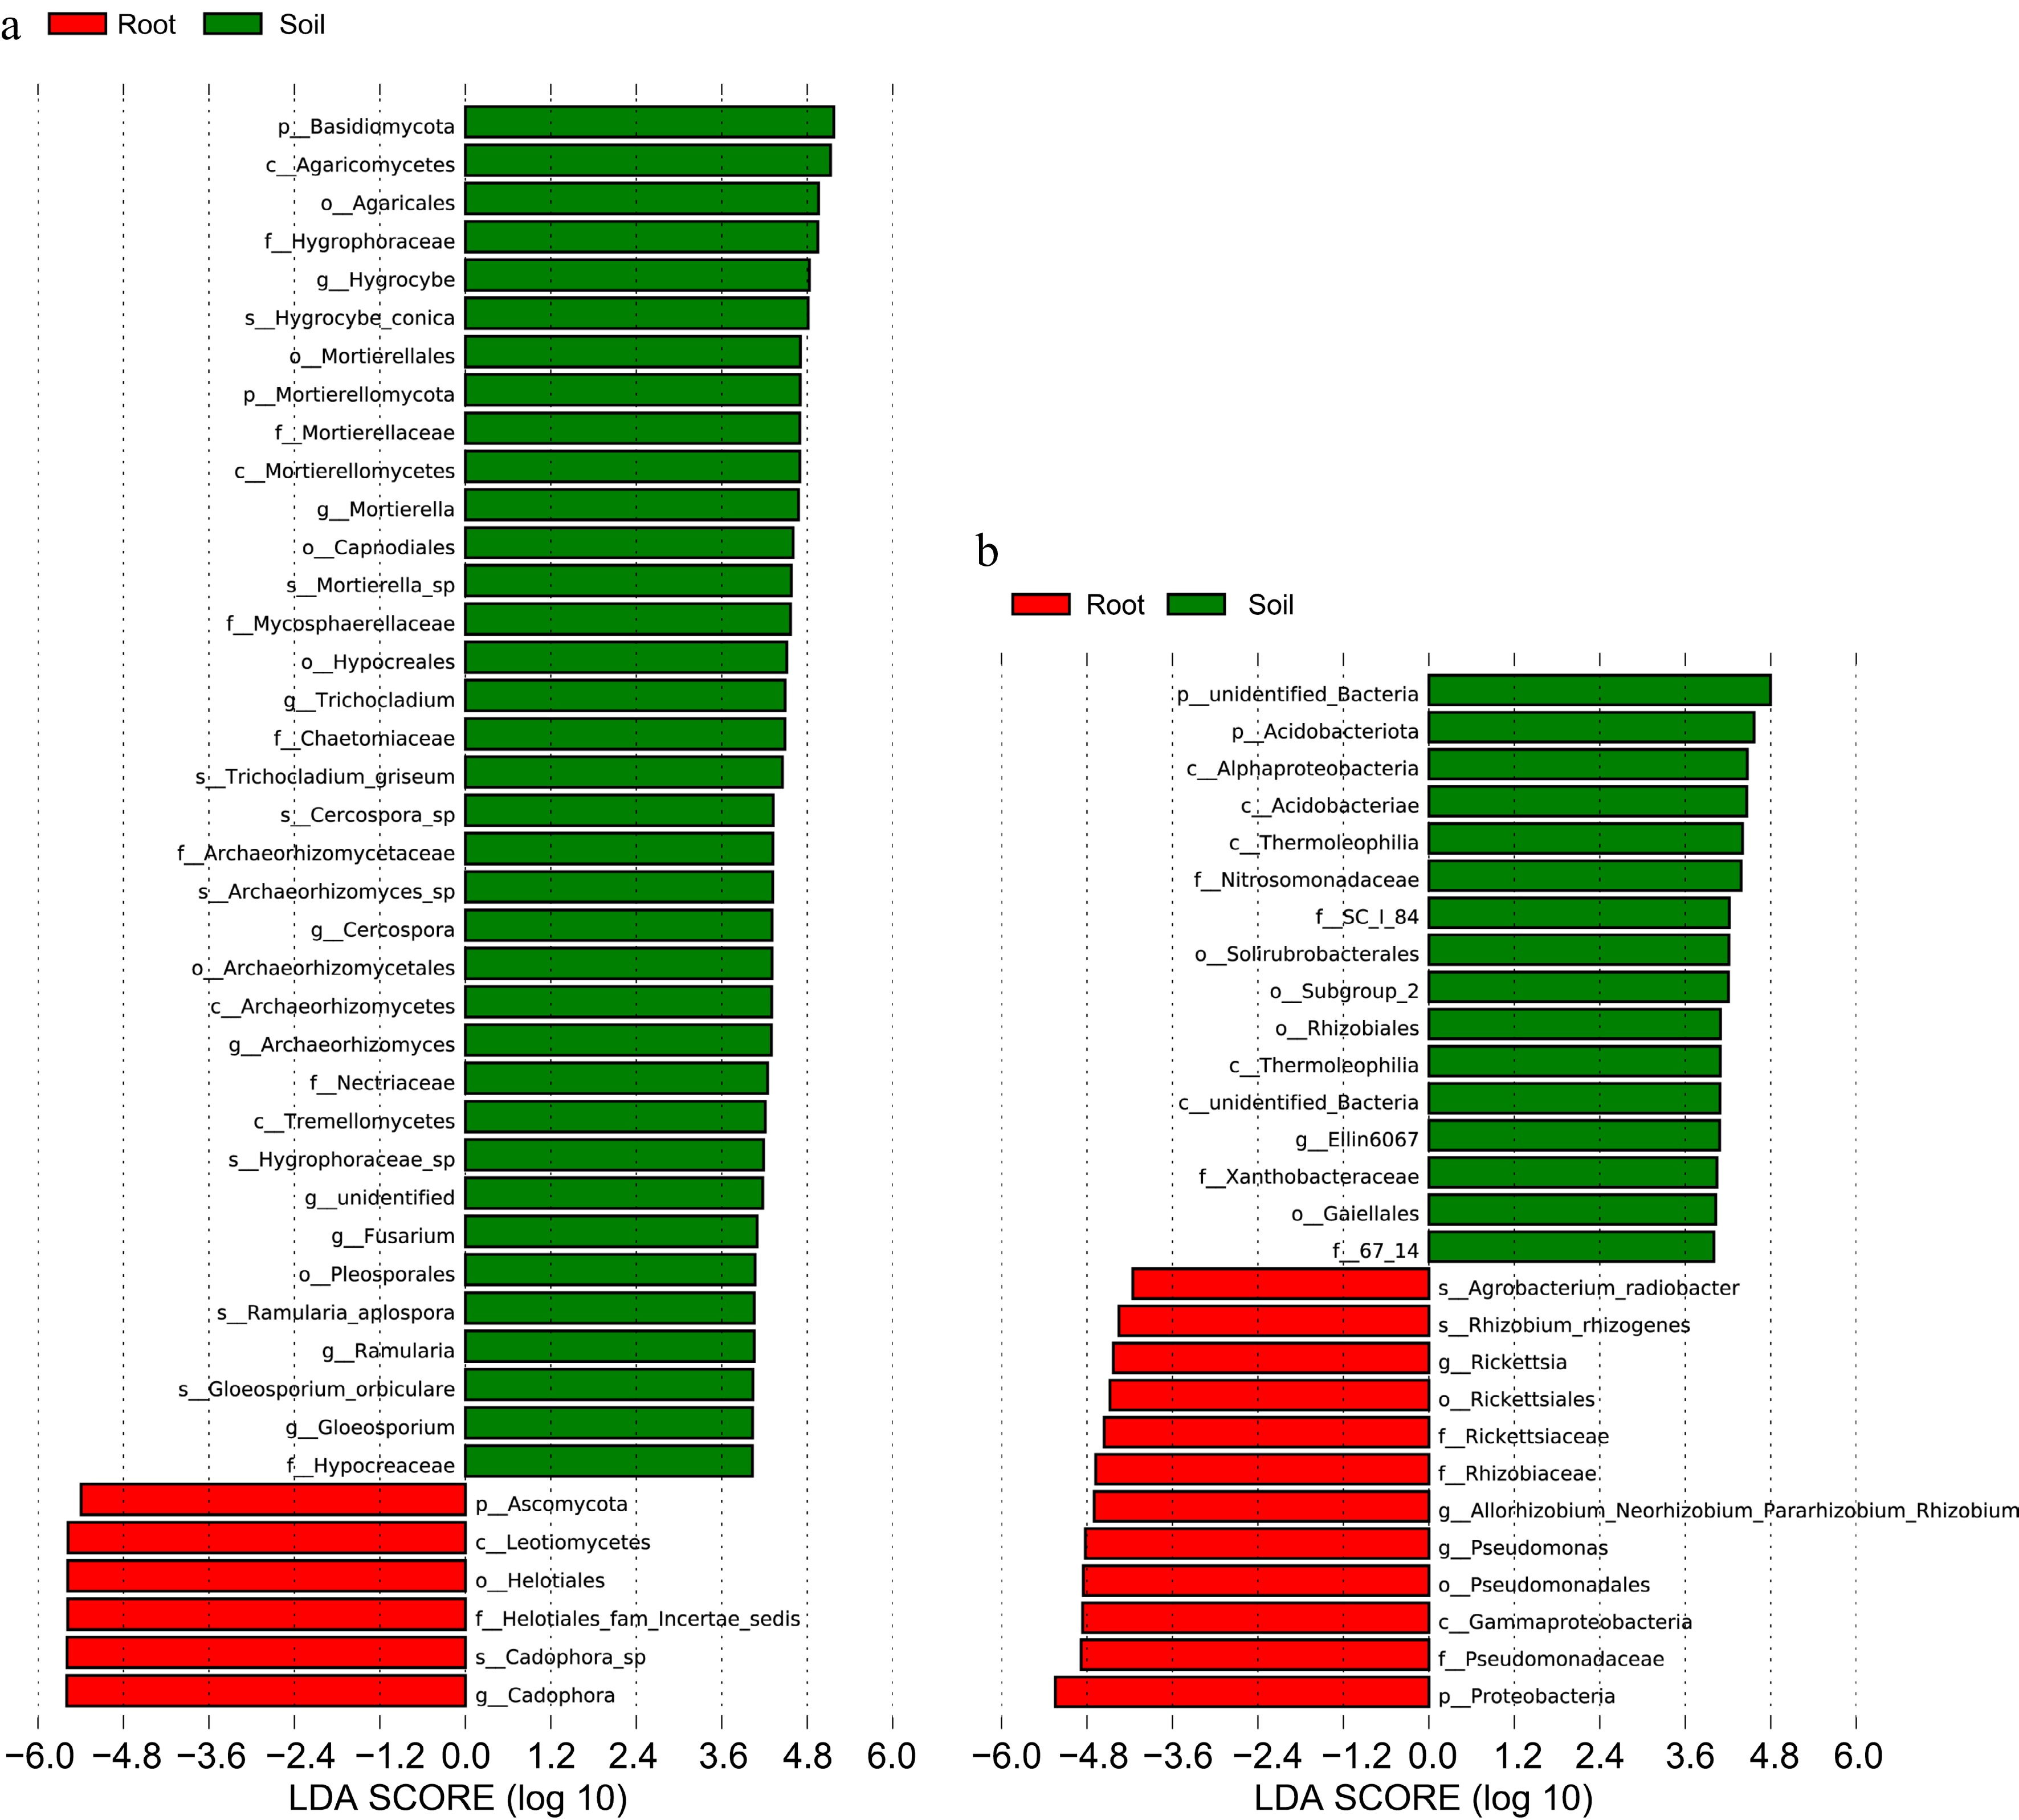
Figure 4.
Use of LDA score to respond to differences in groups of fungi and bacteria in roots and soil and the extent of species influence. (a) LDA score analysis of fungal communities. (b) LDA score analysis of bacterial communities.
The species with significant differences in fungi were Helotiales and Leotiomycetes (Fig. 5a). In contrast, the significantly different species of bacteria were mainly Pseudomonas, Rhizobiaceae, and Rickettsia (Fig. 5b), and all of these diverse taxa could be considered potential biomarkers.
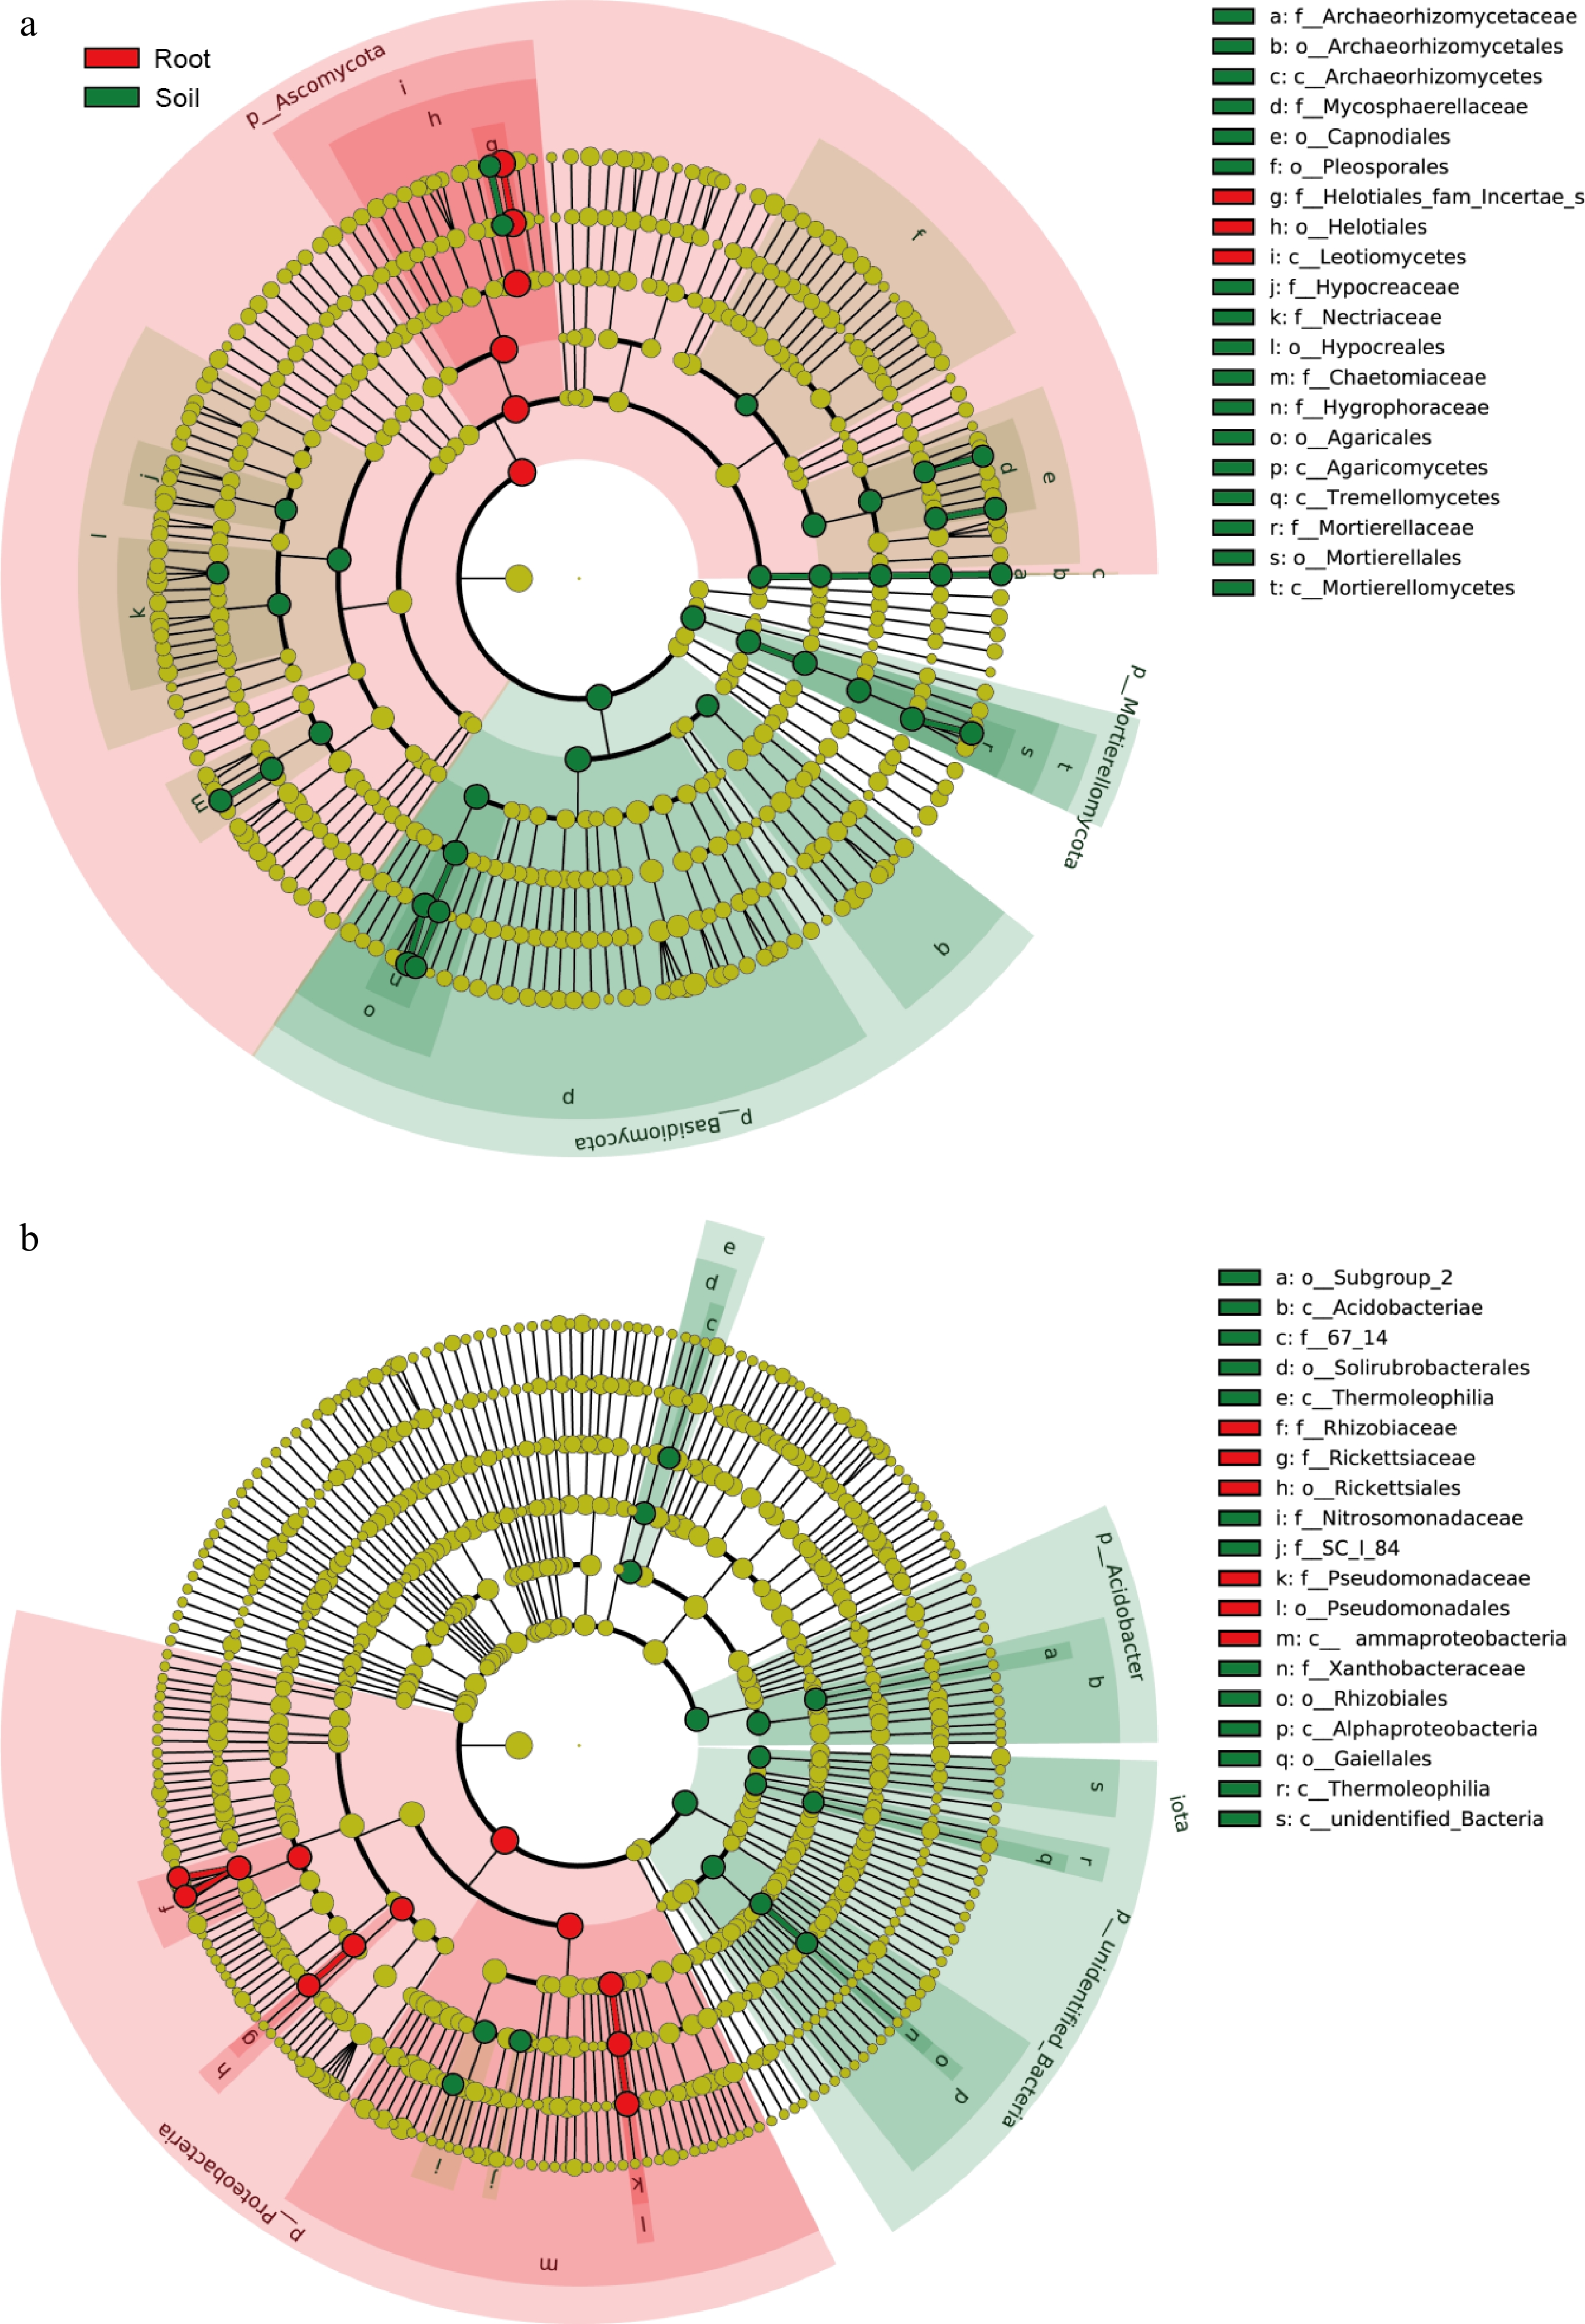
Figure 5.
Used LEfSe analysis of differential microorganisms between roots and rhizosphere. (a) LEfSe analysis of fungal communities. (b) LEfSe analysis of bacterial communities.
Diversity analysis of fungi and bacteria in roots and rhizosphere
-
For fungal communities, SH exhibited the highest endophytic fungal community richness in terms of ACE and Chao1 indices, and SH and GU had higher richness than MA and CA. Regarding Shannon and Simpson diversity indices, CA had the highest diversity of endophytic fungal communities, while SH and GU showed lower diversity than MA and CA. In the bacterial community, the alpha diversity of CA was the highest among four samples. In contrast, its corresponding rhizosphere sample, indicators for MAS, SHS and GUS are close, CAS, had the lowest alpha diversity among four rhizosphere samples. MA, SH, and GU exhibited similar richness indices, with MA having a lower diversity index than the other samples, SH and GU, as indicated by the Shannon and Simpson diversity indices. The calculated alpha diversity of microbial communities suggested that the diversity of fungal communities within the same species was lower than that of bacterial communities. In comparison, the diversity of root samples was lower than that of rhizosphere samples (Table 1).
Table 1. Alpha diversity of the endophytic and rhizosphere communities of four Cypripedium species.
Sequencing type Sample Shannon Simpson Chao1 Ace Good's coverage ITS CA 1.78 0.51 113.53 114.78 1 MA 1.46 0.46 84.39 87.77 1 SH 1.43 0.31 262.94 267.19 1 GU 1.36 0.35 225.47 228.23 1 CAS 5.69 0.93 995.48 1006.9 0.99 MAS 7.06 0.98 1,296.84 1,311.9 0.99 SHS 4.21 0.82 686.92 699.65 0.99 GUS 6.01 0.94 961.21 976.04 0.99 16S CA 5.57 0.93 566.56 579.49 0.99 MA 4.66 0.93 267.52 280.3 1 SH 3.94 0.8 367.05 383.46 0.99 GU 5.13 0.9 362.89 367.69 1 CAS 7.86 0.98 1,049.65 1,073.5 0.99 MAS 8.75 0.99 1,352 1,387.24 0.98 SHS 8.64 0.99 1,295.02 1,314.97 0.98 GUS 8.9 1 1,378.62 1,397.67 0.98 To reflect the differences in microbial community structure between samples, PCoA used two distance algorithms: weighted UniFrac distance and unweighted UniFrac distance (Fig. 6). In the weighted PCoA, the individual root samples were relatively clustered and the rhizosphere samples were discrete (Fig. 6a). On the contrary, in the unweighted PCoA (Fig. 6b), the rhizosphere samples were all relatively clustered, and the root samples were discrete.
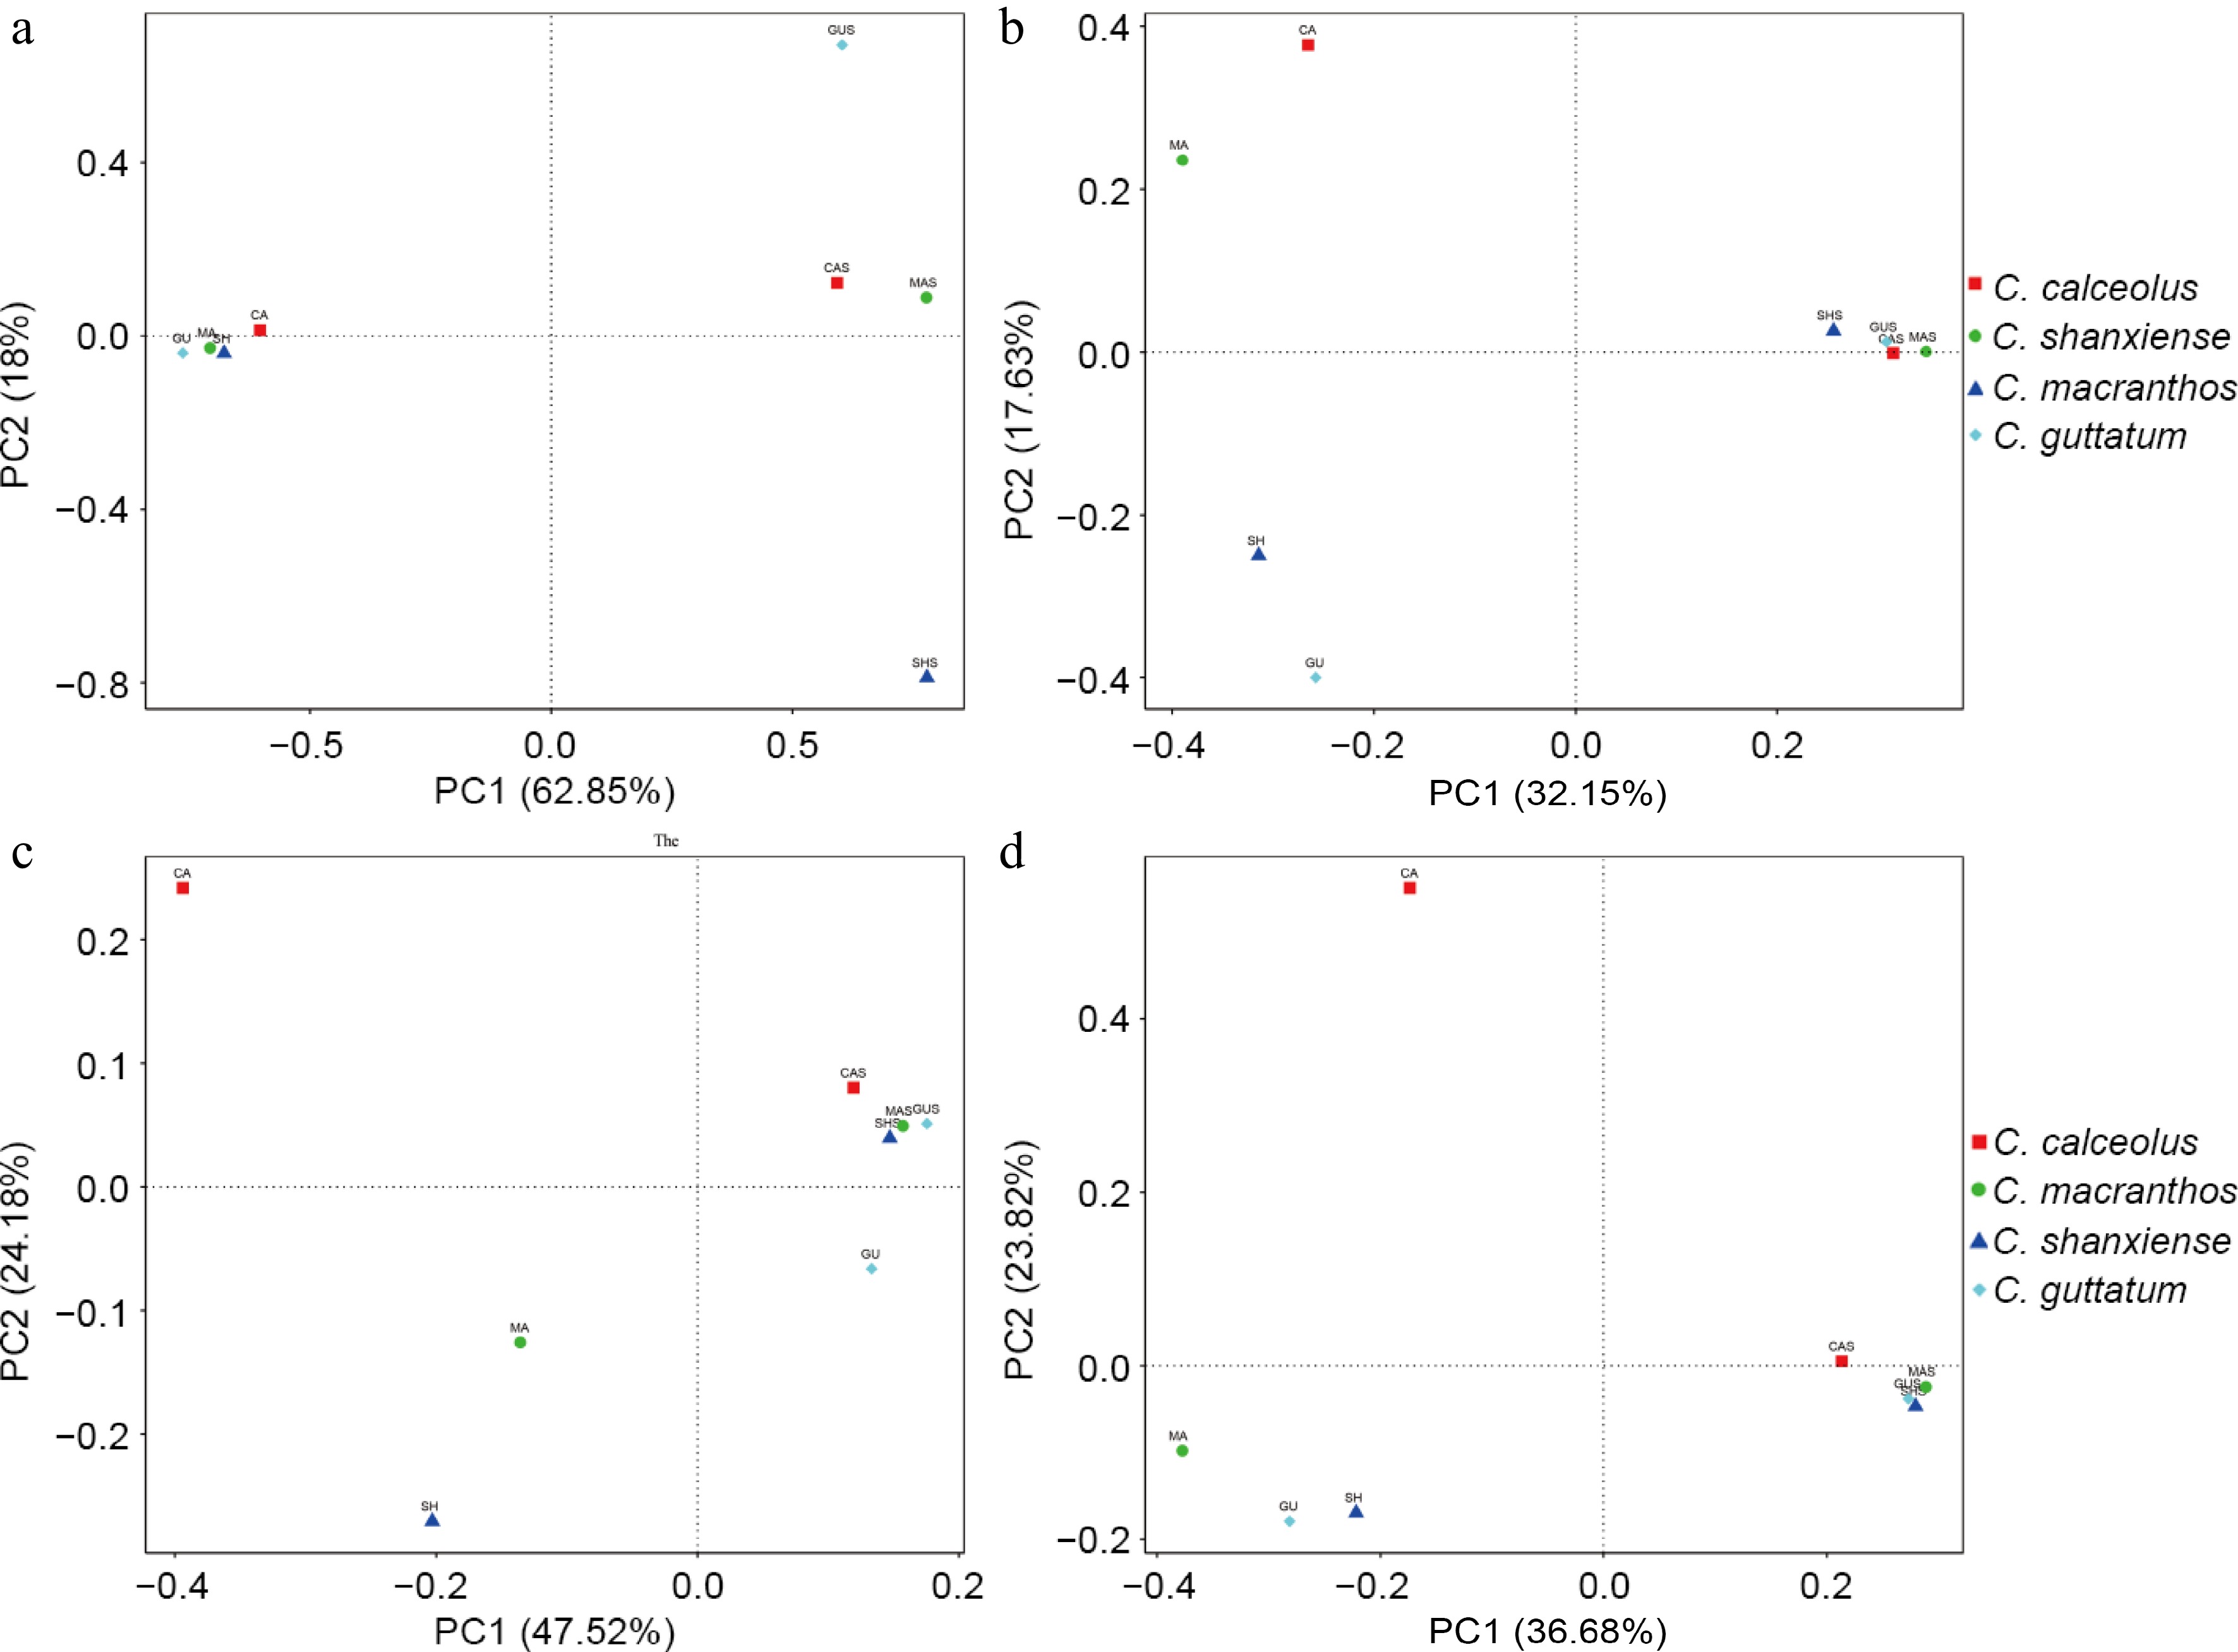
Figure 6.
Reflecting differences in community structure through PCoA analysis based on two distances. (a) PCoA on fungal communities based on weighted UniFrac distance. (b) PCoA on fungal communities based on unweighted UniFrac distance. (c) PCoA on bacterial communities based on weighted UniFrac distance. (d) PCoA on bacterial communities based on unweighted UniFrac distance.
The endophytic fungal communities differed significantly from the rhizosphere fungal communities. In terms of community composition alone, the endophytic fungal communities still exhibited interspecies differences, while the rhizosphere fungal communities were rich in species and displayed a more similar structure. When abundance information was incorporated into the analysis, it was found that the root samples of four Cypripedium species had more similar fungal community structures. In contrast, the dominant fungi differed among the rhizosphere samples. In both PCoA of endophytic bacterial communities (Fig. 6b & d), rhizosphere samples were relatively clustered, while the root sample CA was dispersed separately in both analyses.
Analysis of similarities and differences of microbial communities in roots
-
With Venn diagrams, it is clear that 534 fungal OTUs generated from root samples, 12 (2.23%) have been found in all four species. While 409 (76.16%) OTUs were unique to each sample (Fig. 7a). No unique fungi were detected that were only contained in CA and MA and not present in GU and SH. Of the 1,043 bacterial OTUs, 108 (11.56%) OTUs were familiar to four species, and 573 (61.34%) were unique to each sample (Fig. 7b). Fungal communities exhibited higher specificity compared to bacterial communities.
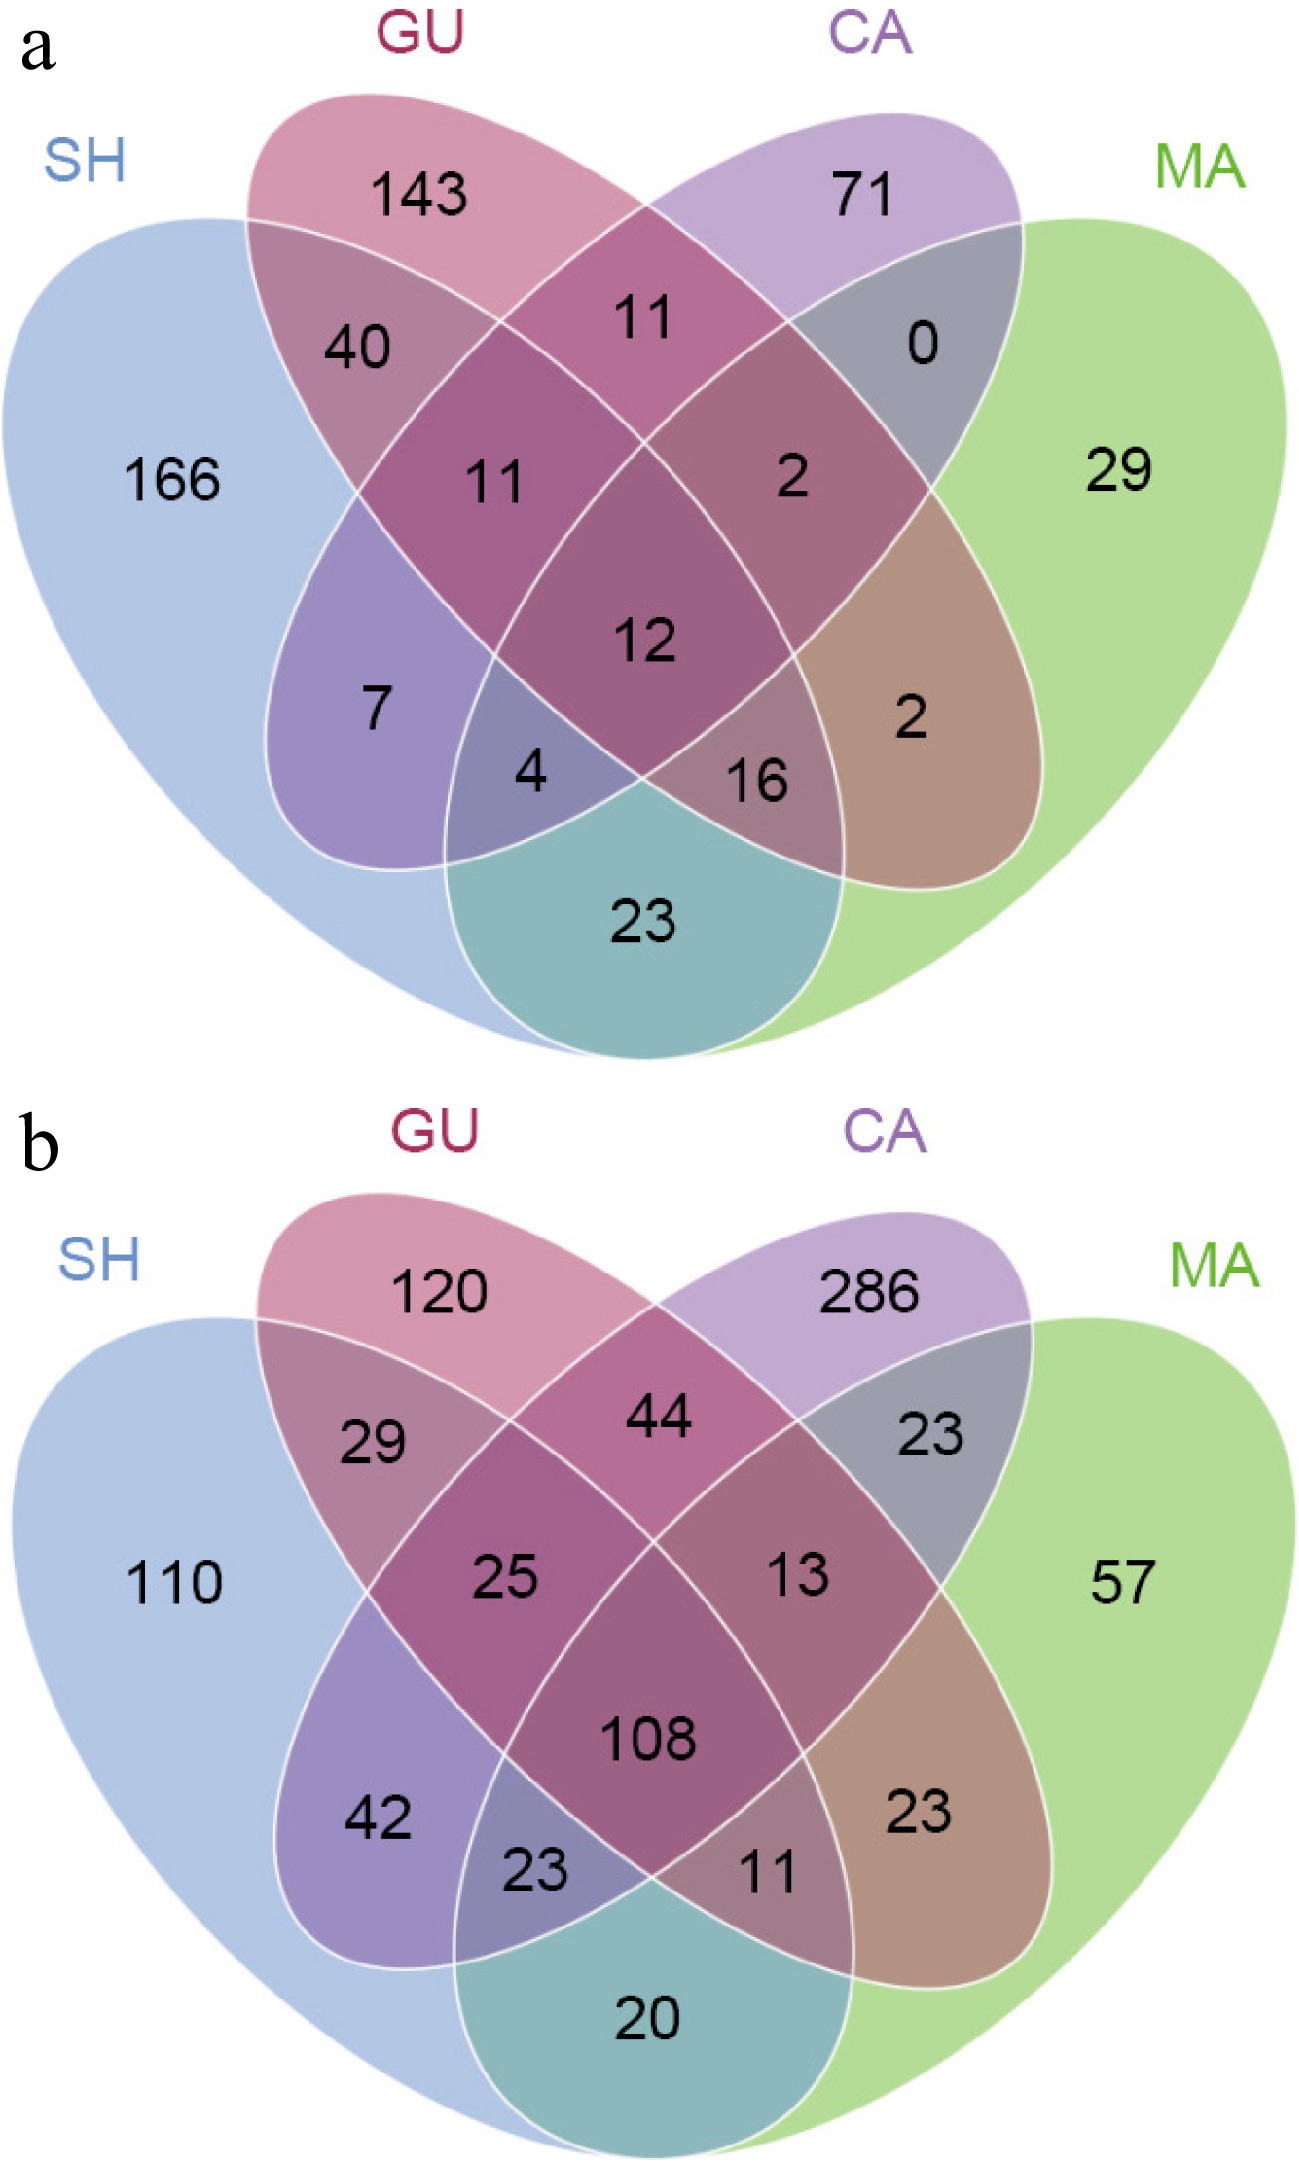
Figure 7.
Venn diagrams showing OTU distribution of (a) fungal, and (b) bacterial communities in each root sample.
Functional prediction of bacterial communities
-
A comparison of the data to predict the function found three main functions of the bacterial community in the results were membrane transport, carbohydrate metabolism, and amino acid metabolism. These functions may be associated with the energy exchange between the bacteria and the host.
A total of 7,533 KOs were identified across all bacterial communities. Among these KOs, 37 KOs related to nitrogen metabolism and 63 KOs related to carbon fixation were screened. The exclusion of low abundance results for these KOs yielded 30 KOs on nitrogen metabolism and 38 KOs on carbon fixation. The concentration of these substances were different from types of Cypripedium according to plotted heat maps. In KOs of nitrogen metabolism (Fig. 8a), the predominant enriched KOs in CA included K00459, which is related to the metabolism of nitroalkane to nitrite, as well as K00266, K00284, and K00262 associated with the metabolism between ammonia and L-glutamate. In MA, KOs on the transport of extracellular nitrate were more abundant, with K15578, K15577, and K15576. SH and GU were enriched in pathways such as assimilatory nitrate reduction (M00531), dissimilatory nitrate reduction (M00530), denitrification (M00529), and complete nitrification (M00804). Among the KOs related to carbon fixation (Fig. 7b), four endophytic samples were mainly concentrated in the reductive citrate cycle (M00173), 3-hydroxypropionate bicycle (M00376), hydroxypropionate-hydroxybutyrate cycle (M00375), dicarboxylate-hydroxybutyrate cycle (M00374), and the incomplete reductive citrate cycle (M00620).
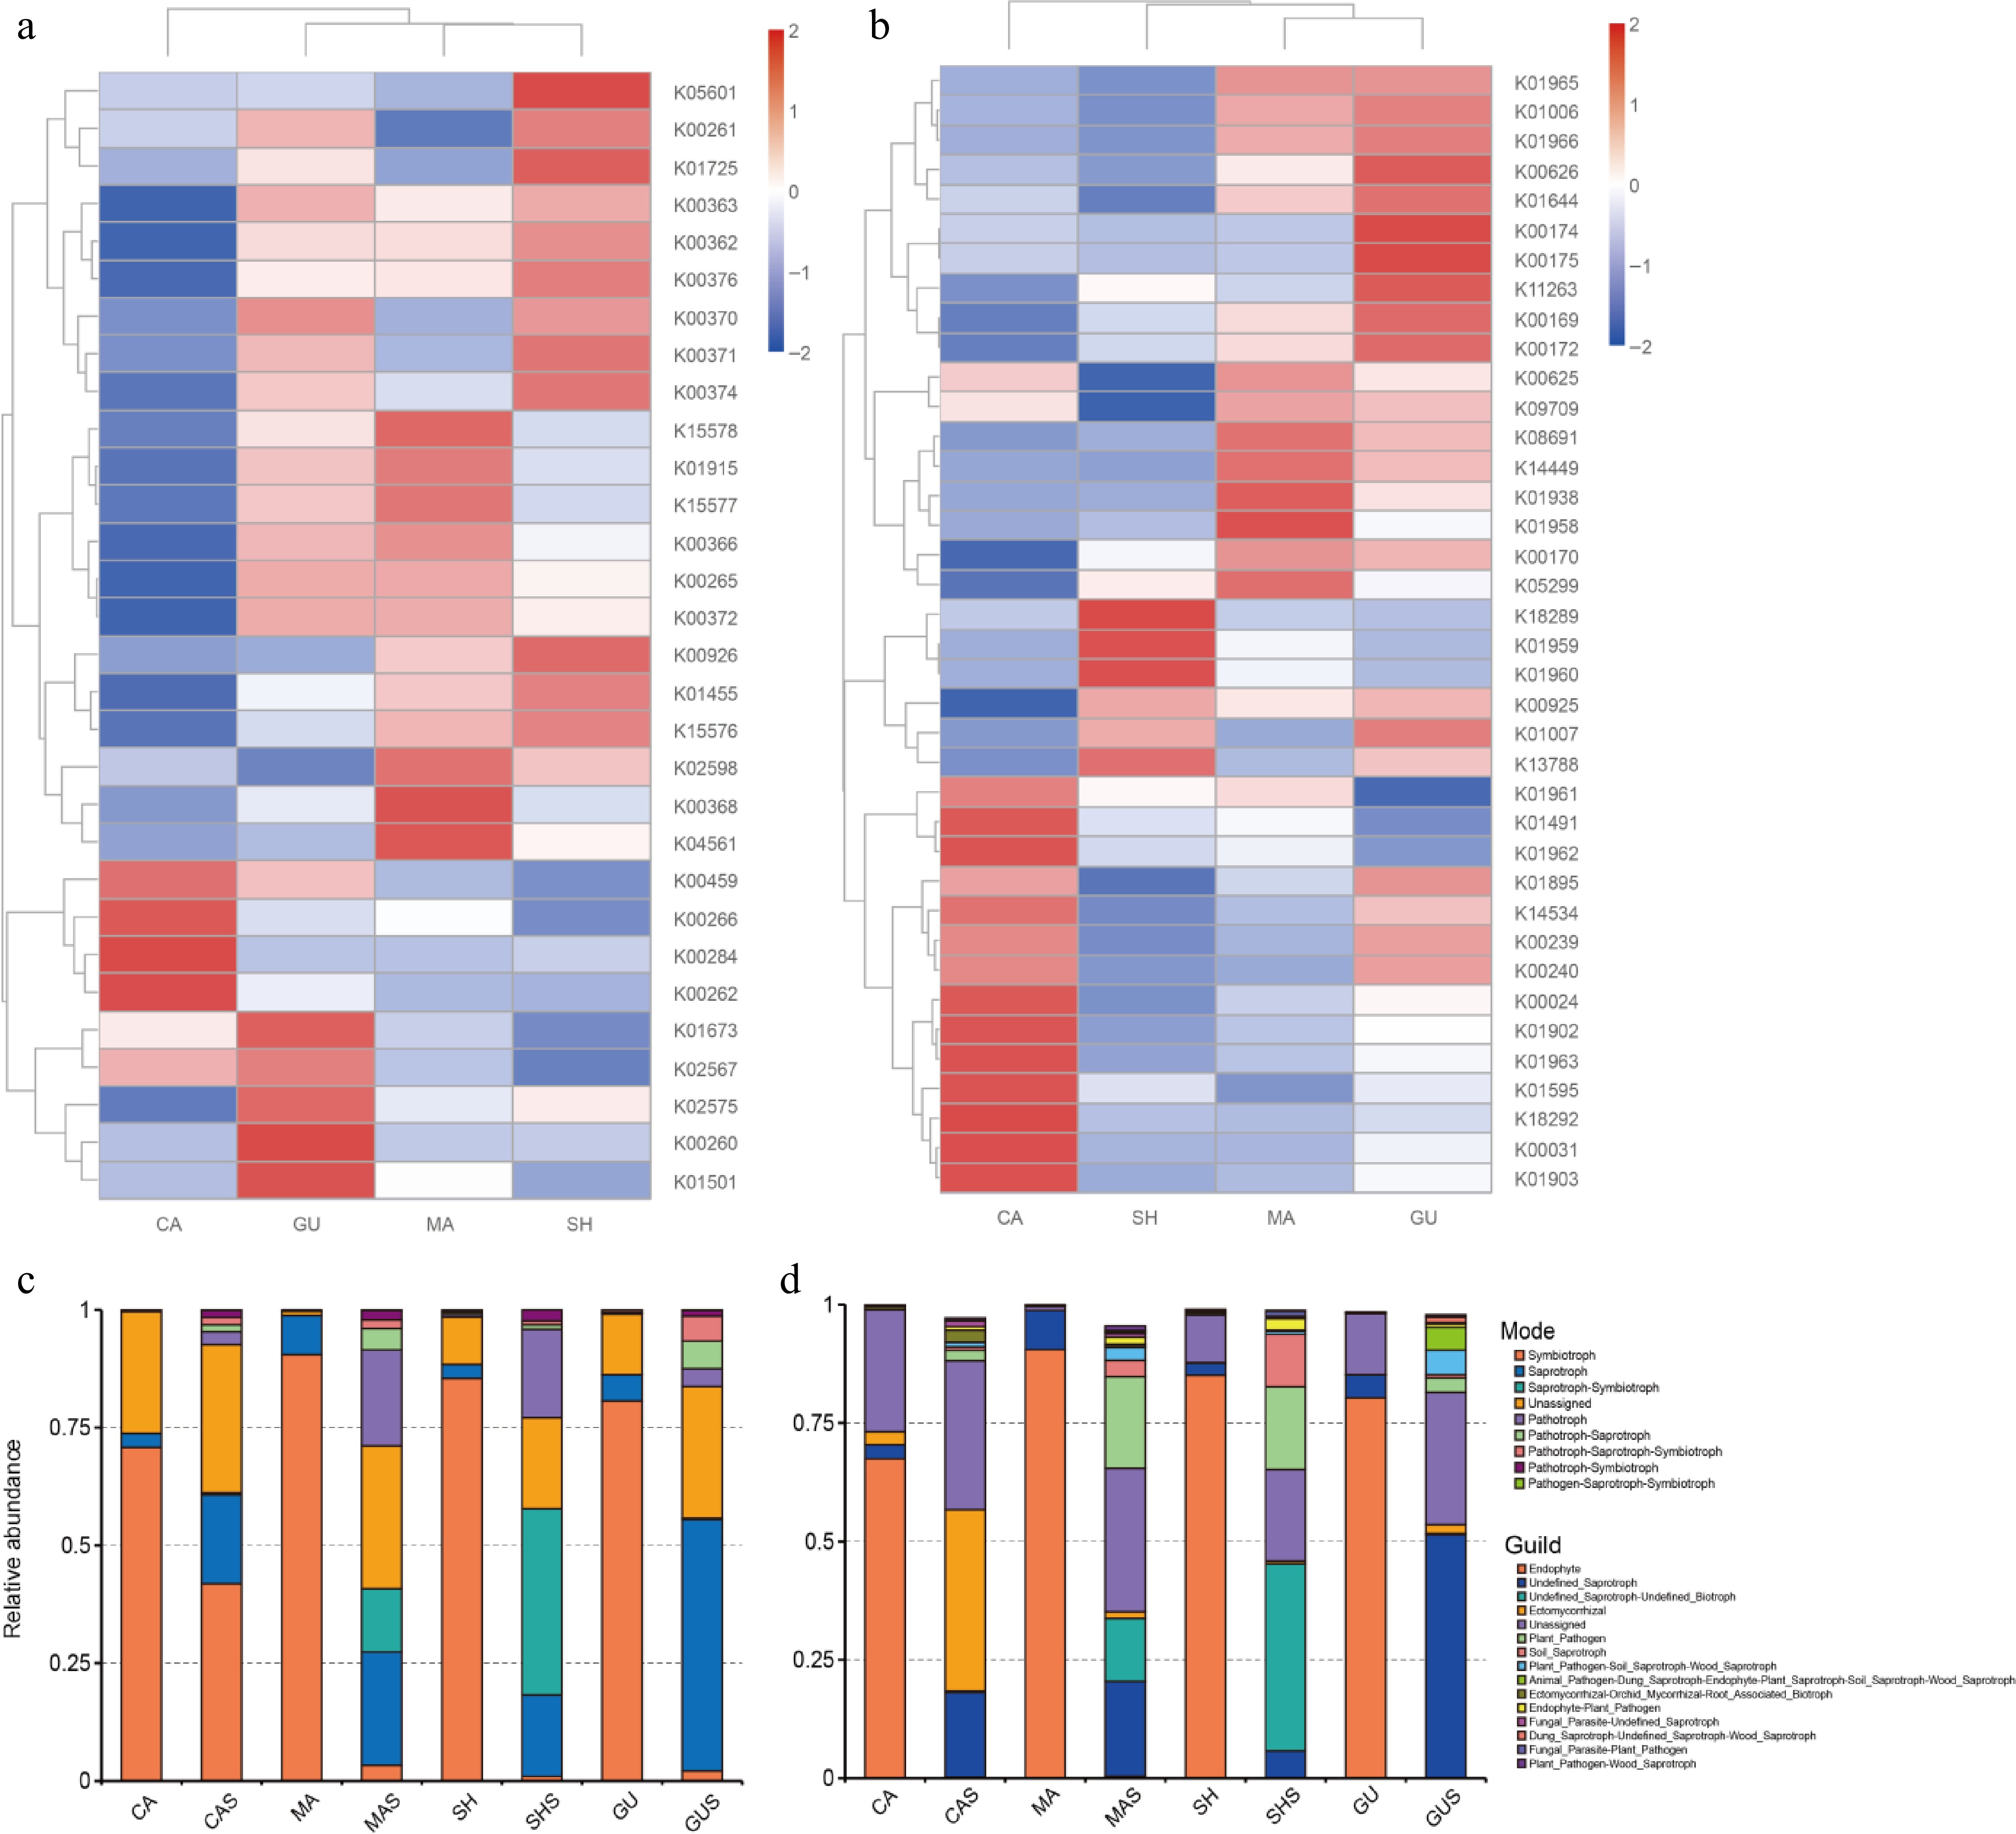
Figure 8.
Functional prediction of microorganisms based on PICRUSt2 with FUNGuild. (a) Nitrogen metabolism KOs are predicted based on 16S sequences. (b) Carbon fixation KOs are expected based on 16S sequences. (c) Mode obtained based on FUNGuild. (d) Guild obtained based on FUNGuild. K0s are classification system for proteins in (a), (b), where proteins with highly similar sequences and similar functions in the same pathway are grouped together. Where the K0s number are the gene identifier in KEGG, and the same gene K0s number are the same between different species.
FUNGuild classified fungi based on their ecological functions and the content of published articles. FUNGuild was used for all samples in annotated mode. In the annotation results of trophic mode, the highest average proportion of symbiotroph enrichment in root samples was 81.86% ± 7.27%, significantly higher than in the corresponding rhizosphere samples. Followed by saprotroph, which accounted for 4.90% ± 2.21%. However, except for symbiotrophs, the abundance proportions of other modes were smaller than those of their rhizosphere samples (Fig. 8c).
Endogenic bacteria were predominant in the root samples (Fig. 8d), corresponding to symbiotroph. Compared to different root samples, CA also showed enrichment with ectomycorrhizal, and the abundance of ectomycorrhizal in its rhizosphere sample was much higher than in other rhizosphere samples, at 38.20%. The predominant type in rhizosphere samples was undefined saprotroph, which was 23.75% ± 16.84%, the proportion of each guild varies greatly between rhizosphere samples. MAS and SHS had similar structures and were significantly enriched compared to other rhizosphere samples, undefined saprotroph-undefined biotroph, plant pathogen, and soil saprotroph. MAS and GUS were enriched in plant pathogen-soil saprotroph-wood saprotroph; undefined saprotroph of GU accounted for the highest proportion of 51.35%; unique animal pathogen-dung saprotroph-endophyte-plant saprotroph-soil saprotroph-wood saprotroph accounted for 4.80%.
-
Orchids live in symbiosis with mycorrhizal fungi throughout their growth stages. Mycorrhizal symbiotic structures are usually influenced by habitat, with differences in endophytic fungal species detected in Cypripedium from different habitats[32]. In this study, the structure of endophytic and rhizosphere total detected 14 fungal phyla, of which Ascomycota, Basidiomycota, Mortierellomycota, and Chytridiomycota are the dominant phyla, and among the most enriched Ascomycota, Cadophora was found to be dominant in C. calceolus, C. macranthos, C. shanxiense, and C. guttatum. Additionally, Russula, Llyonectria, Titaea, and Orbilia are slightly enriched in C. calceolus, C. macranthos, and C. guttatum. These low abundance mycorrhizal fungal species also varied, this indicated that Cypripedium has more symbiotic fungi than other orchids[33].
Previous studies have concluded that Tulasnellaceae may be the ancestor of the orchid fungus mycorrhiza, the three main categories that have been most reported are Sebacinales, Ceratobasidiaceae, and Tulasnellaceae[34−36]. However, the experimental results are different from the above conclusions, these three endophytic fungi were in low abundance in Cypripedium and are not a dominant species. As mentioned above, the dominant fungi detected in the four species of Cypripedium in Changbai Mountain, which do not belong to the same clades as these three types of dominant fungi commonly found in Cypripedium. Shefferson et al.[36] found the great majority of Cypripedium mycorrhizal fungi were poorly associated with Tulasnellaceae, and there are very few Sebacinaceae, Ceratobasidiaceae, and the ascomycetous genus in Cypripedium. Additionally, in a study of the diversity of mycorrhizal fungi in C. guttatum[37], that was also associated with another important mycobiont group, the order Sebacinales. The reason for this difference in test results can be attributed to the fact that different combinations of selected primers can lead to differences in fungal community detection results[38]. Therefore, the absence of Tulasnellaceae cannot be regarded as a characteristic of the endophytic community of Cypripedium in the Changbai Mountains.
Orchids live in symbiosis with mycorrhizae throughout their growth stages, and mycorrhizae are important for the growth of orchids, mycorrhizal infection is essential for the germination of all wild orchid seeds[39]. Orchids and mycorrhizae formed a symbiosis and evolved together, and various orchids have evolved different mycorrhizal fungi to supply their respective growth requirements[40]. Therefore, different species of orchids showed mycorrhizal diversity. Differences in both endophytic and rhizosphere fungi were also found in the detection of endophytic fungi of four species. The diversity of rhizosphere fungi was significantly higher than endophytic fungi and it was found that C. macranthos had the highest fungal diversity in the rhizosphere with the richest rhizosphere fungal community, whereas C. shanxiense had the lowest fungal diversity and it's rhizosphere community of fungi was simple. In addition, the same endophytic fungus was found to be present among all four species of Cypripedium. However, no specific bacteria were detected in C. calceolus, and C. macranthos. This difference may be due to the local environment, this issue needs to be further explored.
Functions of the dominant fungi of Cypripedium
-
Endophytic fungi interact with orchids, and orchid populations are dependent on the distribution of orchid fungal mycorrhizae. Similarly, the presence of certain mycorrhizal fungi alters the structure of the entire orchid endophytic fungal community. In this paper, Cadopharo was highly enriched in four Cypripedium, containing up to 80.81% ± 9.84%. In the study by Cho et al.[41] it was indicated that Cypripedium japonicum may also contain Cadophora. Therefore, Cadopharo may have caused four endophyte community structures to exhibit similarities. Consequently, it is also essential to explore the function of Cadopharo for follow-up exploration.
Cadophora is commonly found in cold, high latitudes and is associated with wood degradation[42]. From FUNGuild analysis, Cadophora was classified as an endophyte. Cadophora is a dark septate endophyte and can alleviate the impact of abiotic stress on plants, to promote plant nutrient absorption, and exhibit inhibitory effects on some pathogenic bacteria[43−45]. Based on the abundance detected by the Cadopharo, it can be concluded that the endophytic fungus Cadopharo contribute to Cypripedium to adapt to the climate of Changbai Mountain.
Characteristics of endophytic and rhizosphere bacterial of Cypripedium
-
Bacteria exist in different tissues of a variety of orchids and have important biological functions for the growth and development of orchids, such as promoting the germination of orchid seeds, accelerating plant growth and enhancing resistance. This study detected a total of 34 bacterial phyla. Proteobacteria, Actinobacteria, Acidobacteriota, Firmicute, Myxоcoccota, Bacteroidota, Gemmatimonadetes, and Verrucomicrobiota were dominant species in the bacterial community. Actinobacteria, are further propagated by spores and have antiparasitic, antiherd-sensing, antiviral and integrative activities[42]. Four species of Cypripedium root endophytes were detected. Protebacteria and Actinobacteria were prevalent, CA, MA, and SH, showed enrichment of Protebacteria, but the species of Protebacteria were different, only GU was mainly enriched with Actinobacteria. The dominant bacterium in GU was Streptomyces, which enhances crop resistance to drought and other abiotic stresses by secreting a secondary metabolite called predic aids[46].
Research has shown that both C. macranthos and C. shanxiense showed significant enrichment of Rhizobiaceae and Pseudomonas, and their bacterial community structures were relatively similar. The results show that most of the dominant bacteria among four Cypripedium species are shared, and the differences in the endophytic communities are mainly affected by abundance. Among the predominant bacteria in all samples, Pseudomonas, Rhizobiaceae, and Burkholderiaceae have the potential to form Rhizoctonia[47−49].
The predictive function of 16S regarding nitrogen metabolism and carbon fixation also reflected some differences between samples. In analyzing the endophytic bacterial function of Cypripedium, it was found that there are also differences in the functions of the endophytic bacteria of four Cypripedium. The endophytic bacterial function of C. calceolus were mainly related to the metabolism of nitroalkane to nitrite. Whereas the functions of the endophytic fungi of C. macranthos were mainly focused on the transport of extracellular nitrate. The endophytic fungal functions of C. shanxiense and C. guttatum were mainly focused on assimilating nitrate reduction, reducing nitrate solubility, denitrification, and nitrification completely. However, these differences were insufficient to fully illustrate the variations in specific pathways among different Cypripedium bacterial communities. On the one hand, it was limited by the inability to truly reflect the expression at the DNA level, on the other hand, it suffered from the insufficient coverage length of 16S rRNA, this issue still needs further research.
Bidirectional selection of Cypripedium and endophytic microorganisms
-
Roots endophytic microbial communities were usually influenced by environmental factors, especially the rhizosphere environment, which can directly affect the structure of endophytic communities[50]. However, this effect is still regulated by plant selection[51,52]. In this study, the composition and abundance structure of rhizosphere bacterial communities were relatively similar, while the fungal communities showed significant differentiation between the rhizospheres of each species. Ectomycorrhiza often forms mycorrhizal structures with trees, therefore, it is widespread in forest ecosystems[51]. The growth of Russula within the rhizosphere of C. calceolus was facilitated by an ectomycorrhizal fungus that was also abundant in C. calceolus roots. Differences mainly influenced this abundance in the rhizosphere community. Titaea was present in all samples except C. calceolus. Russula and Titaea were recruited from the soil into endophytic communities and acted as dominant genera.
These results indicate that the rhizosphere community effectively influences the endophytic community of Cypripedium and recruits different fungi. Plant exudates influence the rhizophere to form different microbial communities. Orchids can select symbiotic fungi from the rhizosphere, and this bidirectional selection contributes to the specificity of endophytic and rhizosphere communities[52]. However, Cadophora was not dominant in the rhizosphere community, while Mortierella, which exists in the rhizosphere, was similarly not dominant in the endophytic community. The rhizosphere community does not accurately represent the endophytic community in real time. Orchids continuously recruit endophytic fungi that are beneficial to them as they grow, and the rhizosphere fungal community is constantly changing with plant growth and environmental changes. In contrast, fungi surviving in endophytic environments remain homeostatic compared to the rhizosphere community, although they are equally affected by plant selection[52,53]. This interaction between different root exudates and rhizosphere microbial communities has also been demonstrated in poplars[54]. Therefore, further research on the effects of plant rhizosphere exudates on plant-specific endophytic communities is also crucial, which can provide a theoretical basis for promoting plant growth.
-
This study conducted a high-throughput sequencing investigation of endophytic and rhizosphere microbial communities in C. calceolus, C. macranthos, C. shanxiense, and C. guttatum in Changbai Mountains. There were 14 fungal phyla detected in the endophytic fungal community of four Cypripedium species, of which the predominant fungal species included Ascomycota, Basidiomycota, Mortierellomycota, and Chytridiomycota. Within the endophytic Ascomycota, the genus Cadophora was highly enriched within four Cypripedium, containing up to 80.81% ± 9.84%. Cadophora affected the endophyte communities of four Cypripedium species and contributed to the adaptation of four Cypripedium species to the climate of Changbai Mountains during their growth. The endophytic fungal community structure of roots and rhizosphere also varied considerably. The diversity of the rhizosphere fungi community was more abundant than that of the endogenous fungi community. The fungal community richness of four Cypripedium, in descending order, was C. shanxiense, C. guttatum, C. calceolus, and C. macranthos. The bacterial community composition formed a diverse core flora in different Cypripedium species. A total of 34 bacterial phyla, mainly composed of Pseudomonadaceae, Rhizobiaceae, Streptomycetaceae, Burkholderiaceae, and Rickettsiaceae. Similarities in endophyte communities of bacteria were over similarities in the endophytic communities of fungi. The functions of endophytic bacteria are mainly concentrated on the reductive citrate cycle, 3-hydroxypropionate bicycle, hydroxypropionate-hydroxybutyrate cycle, dicarboxylate-hydroxybutyrate cycle, and the incomplete reductive citrate cycle. In this study, Cypripedium may have a unique microbial community structure in the Changbai Mountains, follow-up studies on the effects of environmental differences in the structural composition of endophytic bacteria in Cypripedium need to be intensified and the role of these dominant endophytes in the growth and development of Cypripedium.
-
The authors confirm contribution to the paper as follows: study conception and design: Chen L, Lu X, Zhou Y; data collection: Cong H, Shan Y; analysis and interpretation of results: Shan Y, Wang S, Yu J, Wang Q; draft manuscript preparation: Shan Y, Xiao Y, Jiang N. All authors reviewed the results and approved the final version of the manuscript.
-
The complete data sets generated in the present study have been deposited in the NCBI Sequence Read Archive database under BioProject IDs PRJNA1053683 and PRJNA1053873.
The authors are thankful for the funding assistance from the following: the National Natural Science Foundation of China (Grant No. 32171866); The Natural Science Foundation of Jilin Provincial Science and Technology Department (Grant No. 20240101197JC).
-
The authors declare that they have no conflict of interest.
-
# Authors contributed equally: Yuze Shan, Xi Lu
- Copyright: © 2024 by the author(s). Published by Maximum Academic Press, Fayetteville, GA. This article is an open access article distributed under Creative Commons Attribution License (CC BY 4.0), visit https://creativecommons.org/licenses/by/4.0/.
-
About this article
Cite this article
Shan Y, Lu X, Wang S, Cong H, Wang Q, et al. 2024. Microbial community structure and diversity of endophytic and rhizosphere of Cypripedium species in Changbai Mountains. Ornamental Plant Research 4: e028 doi: 10.48130/opr-0024-0027
Microbial community structure and diversity of endophytic and rhizosphere of Cypripedium species in Changbai Mountains
- Received: 01 June 2024
- Revised: 18 August 2024
- Accepted: 02 September 2024
- Published online: 23 October 2024
Abstract: Cypripedium is an important ornamental plant. However, it is facing increasing endangerment due to habitat destruction and illegal collection. Therefore, the conservation of Cypripedium is becoming increasingly important. Fungi are involved in the entire life cycle of Cypripedium plants. A growing number of experiments have shown that the mycorrhizal communities of Cypripedium have also diversified under different growth environments, and most of such studies have explored the relationship between endophytic fungi in the root and the environment. Fourteen fungal and 34 bacterial phyla were detected in roots and rhizosphere samples. Ascomycota, Basidiomycota, Mortierellomycota, and Chytridiomycota content were higher in endophytic fungi. Cadophora was detected in four species of Cypripedium and was dominant among the endophytic fungi, the content was up to 80.81% ± 9.84%. Cadophora had the function of altering the structure of endophytic fungi of Cypripedium. Endophytic bacteria were mainly detected with high abundance of Pseudomonadaceae, Rhizobiaceae, Streptomycetaceae, Burkholderiaceae, and Rickettsiacea, which were endophytic in different Cypripedium plants. The diversity of rhizosphere fungi was higher than the diversity of endophytic fungi, C. shanxiense had the highest fungal community richness within four Cypripedium species and predicted that endophytic bacteria had reductive citrate cycle, 3-hydroxypropionate bicycle, and other functions. These endophytes comprise unique Cypripedium plants' microbial community structure in Changbai Mountain (China), providing a direction for further protecting wild Cypripedium resources. Understanding the structural characteristics of the endophytic fungal community of Cypripedium under the environment of Changbai Mountain provides a direction for further conservation of Cypripedium in Changbai Mountain, and exploring the functions of different types of fungi during the growth process of Cypripedium provides a theoretical basis for the subsequent exploration of the species of Cypripedium endophytes in different habitats as well as the effects on the root and soil endophytes of Cypripedium plants.
-
Key words:
- Cypripedium /
- Endophytes /
- Microbial community function /
- High-throughput sequencing /
- Changbai Mountain


