-

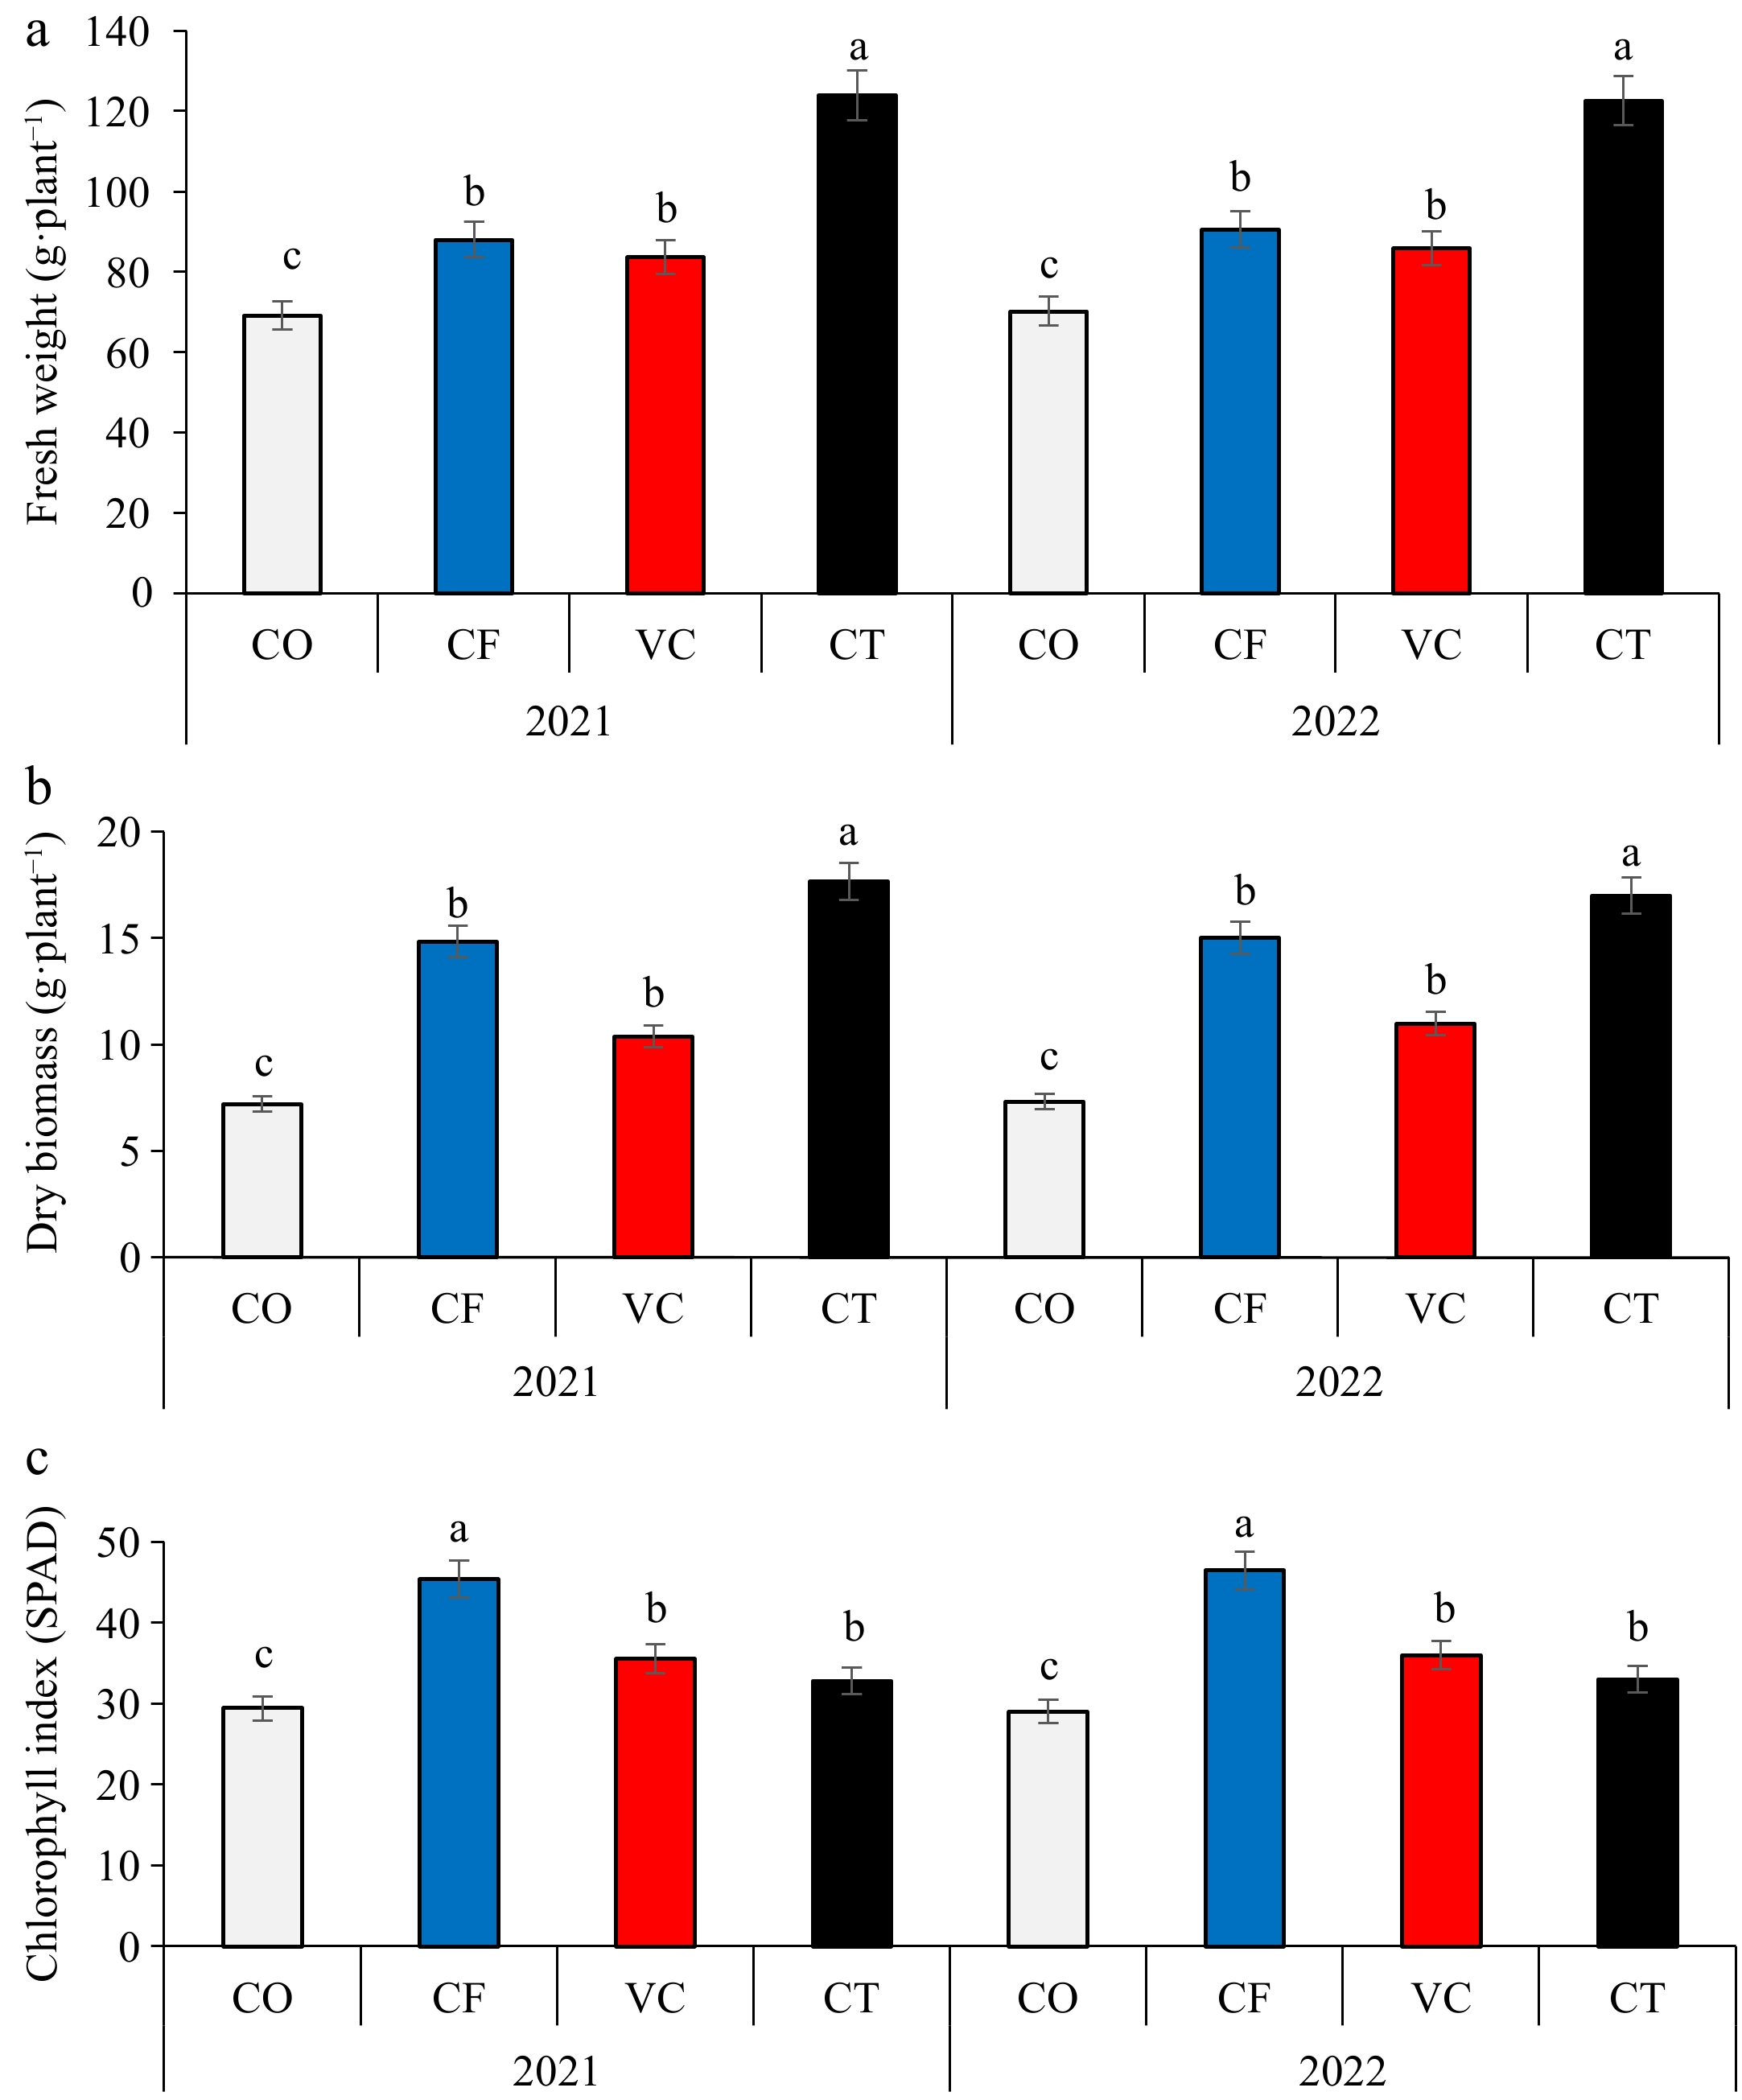
Figure 1.
Effect of compost and vermicompost application on (a) fruit fresh biomass, (b) fruit dry biomass, and (c) chlorophyll index of zucchini plants.
-

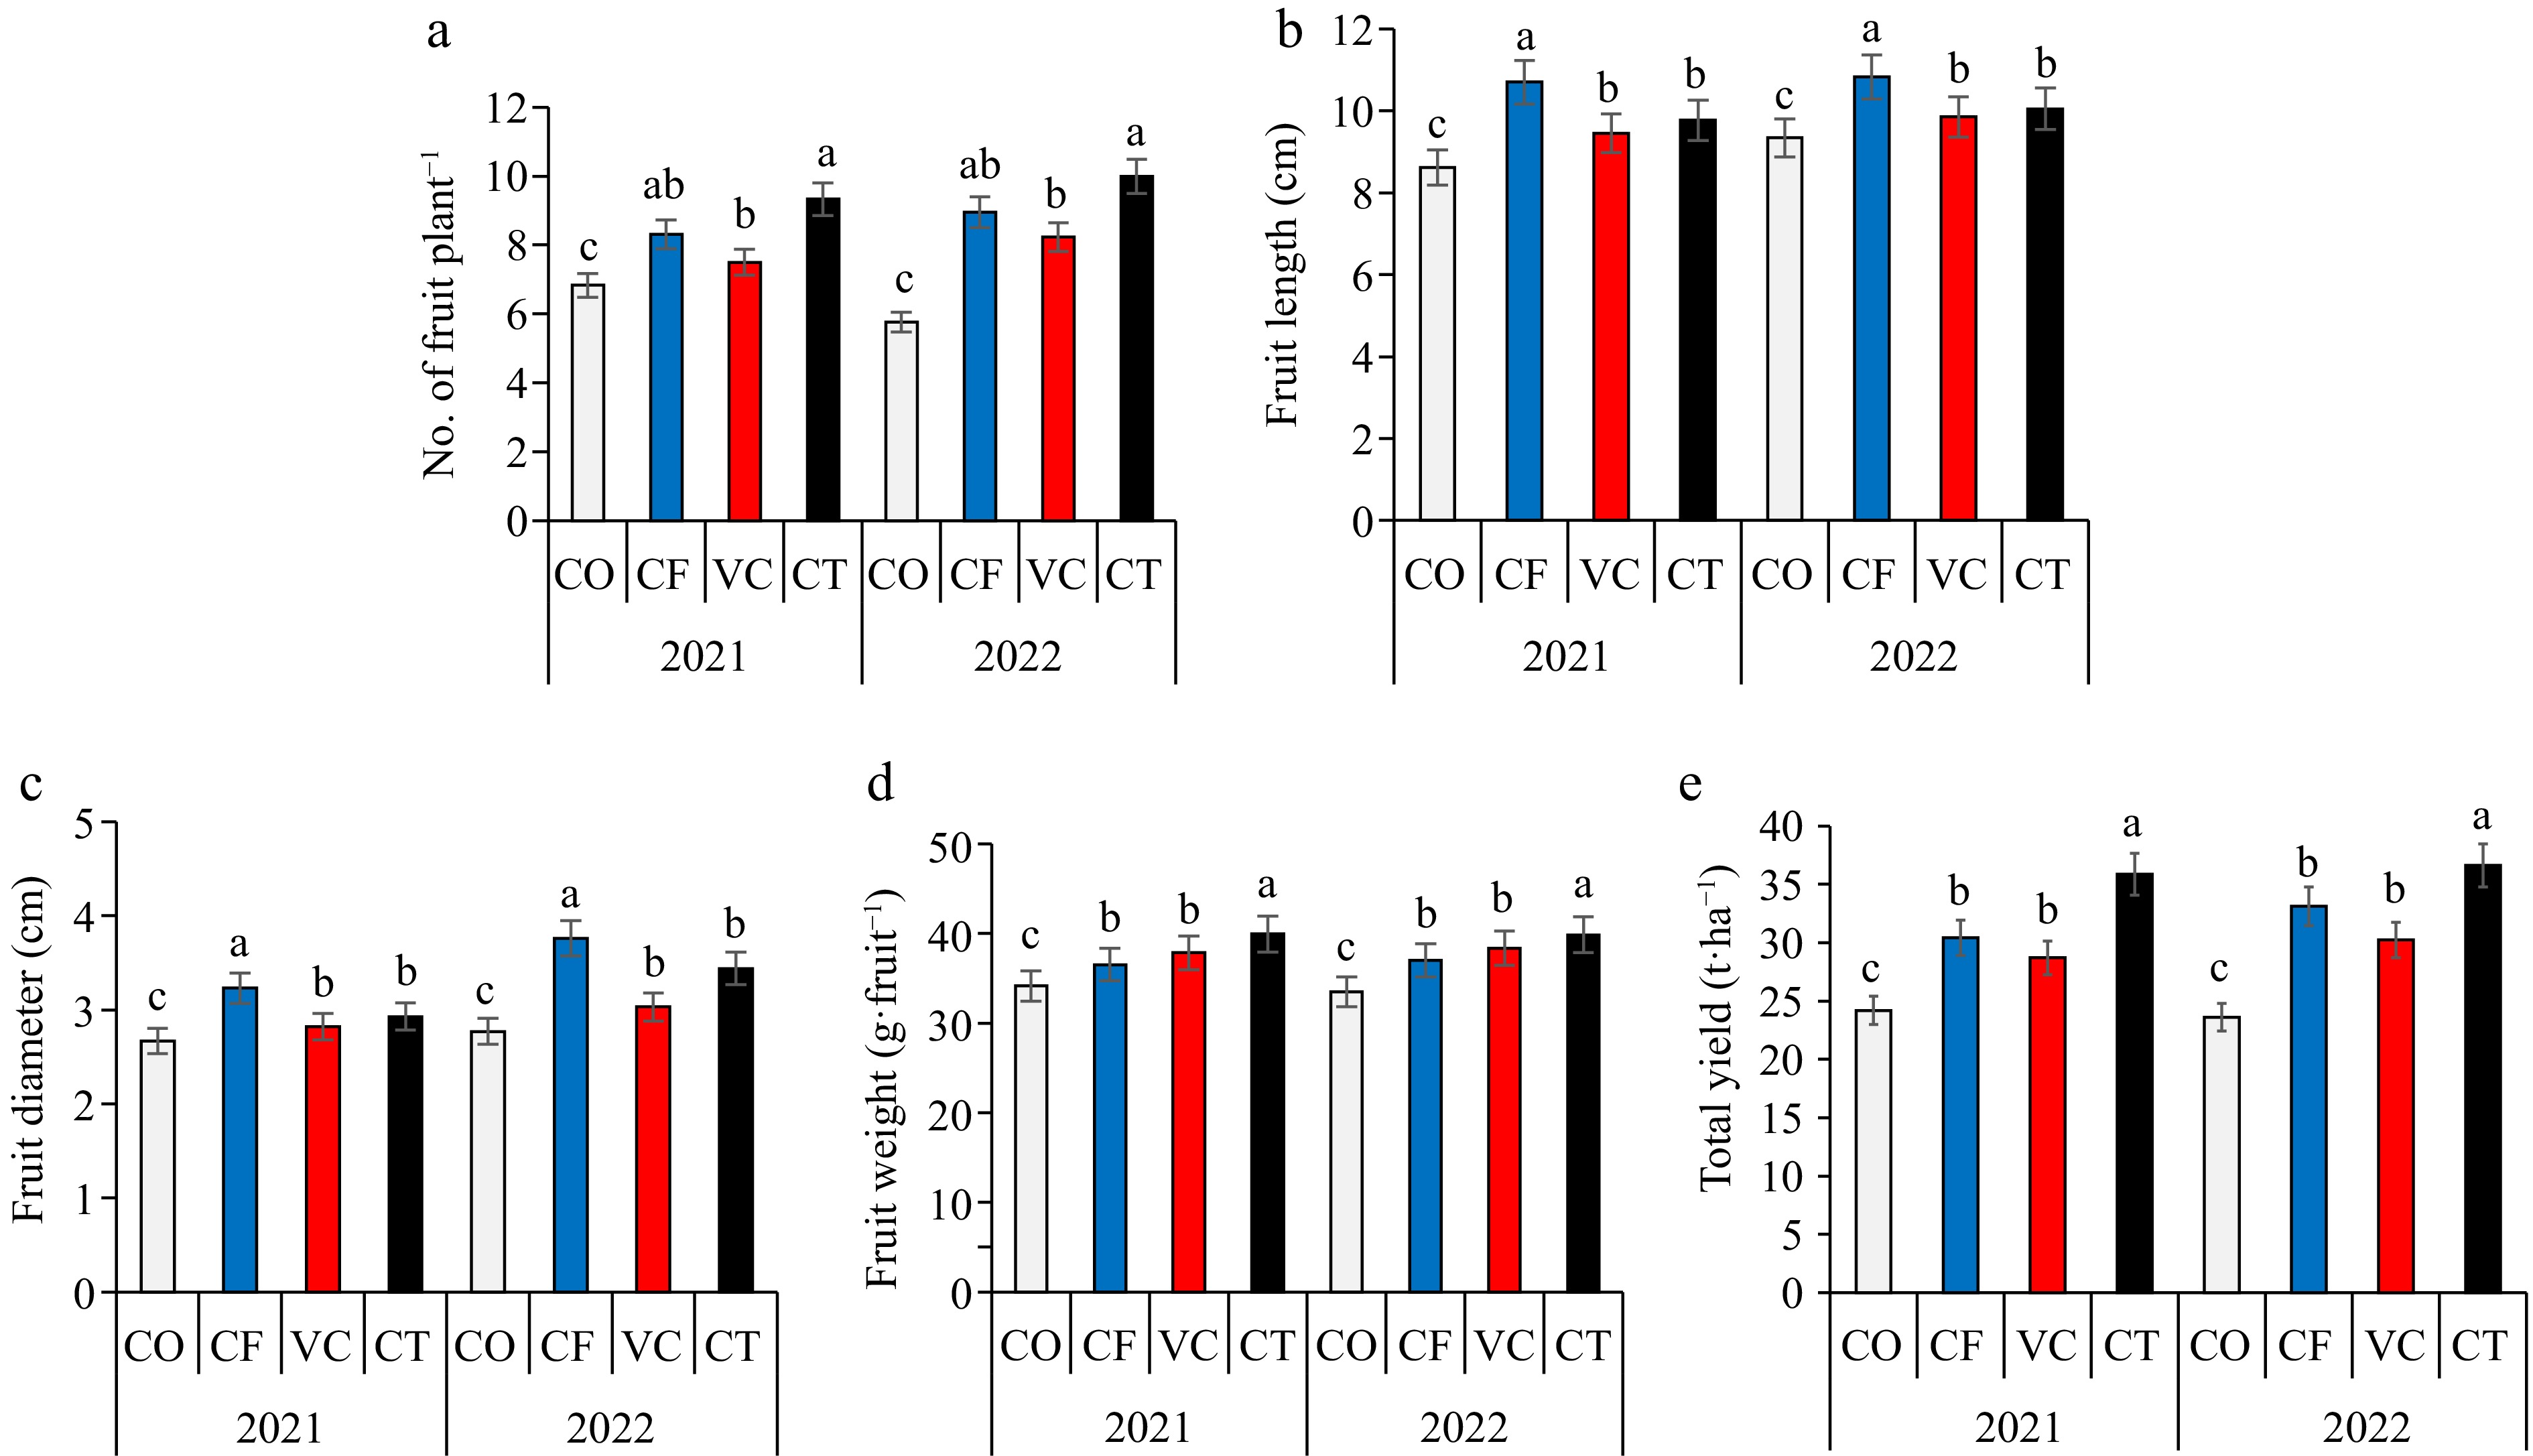
Figure 2.
Impact of different fertilizers treatment on (a) fruit number, (b) fruit length, (c) fruit diameter, (d) fruit weight, and (e) yield.
-

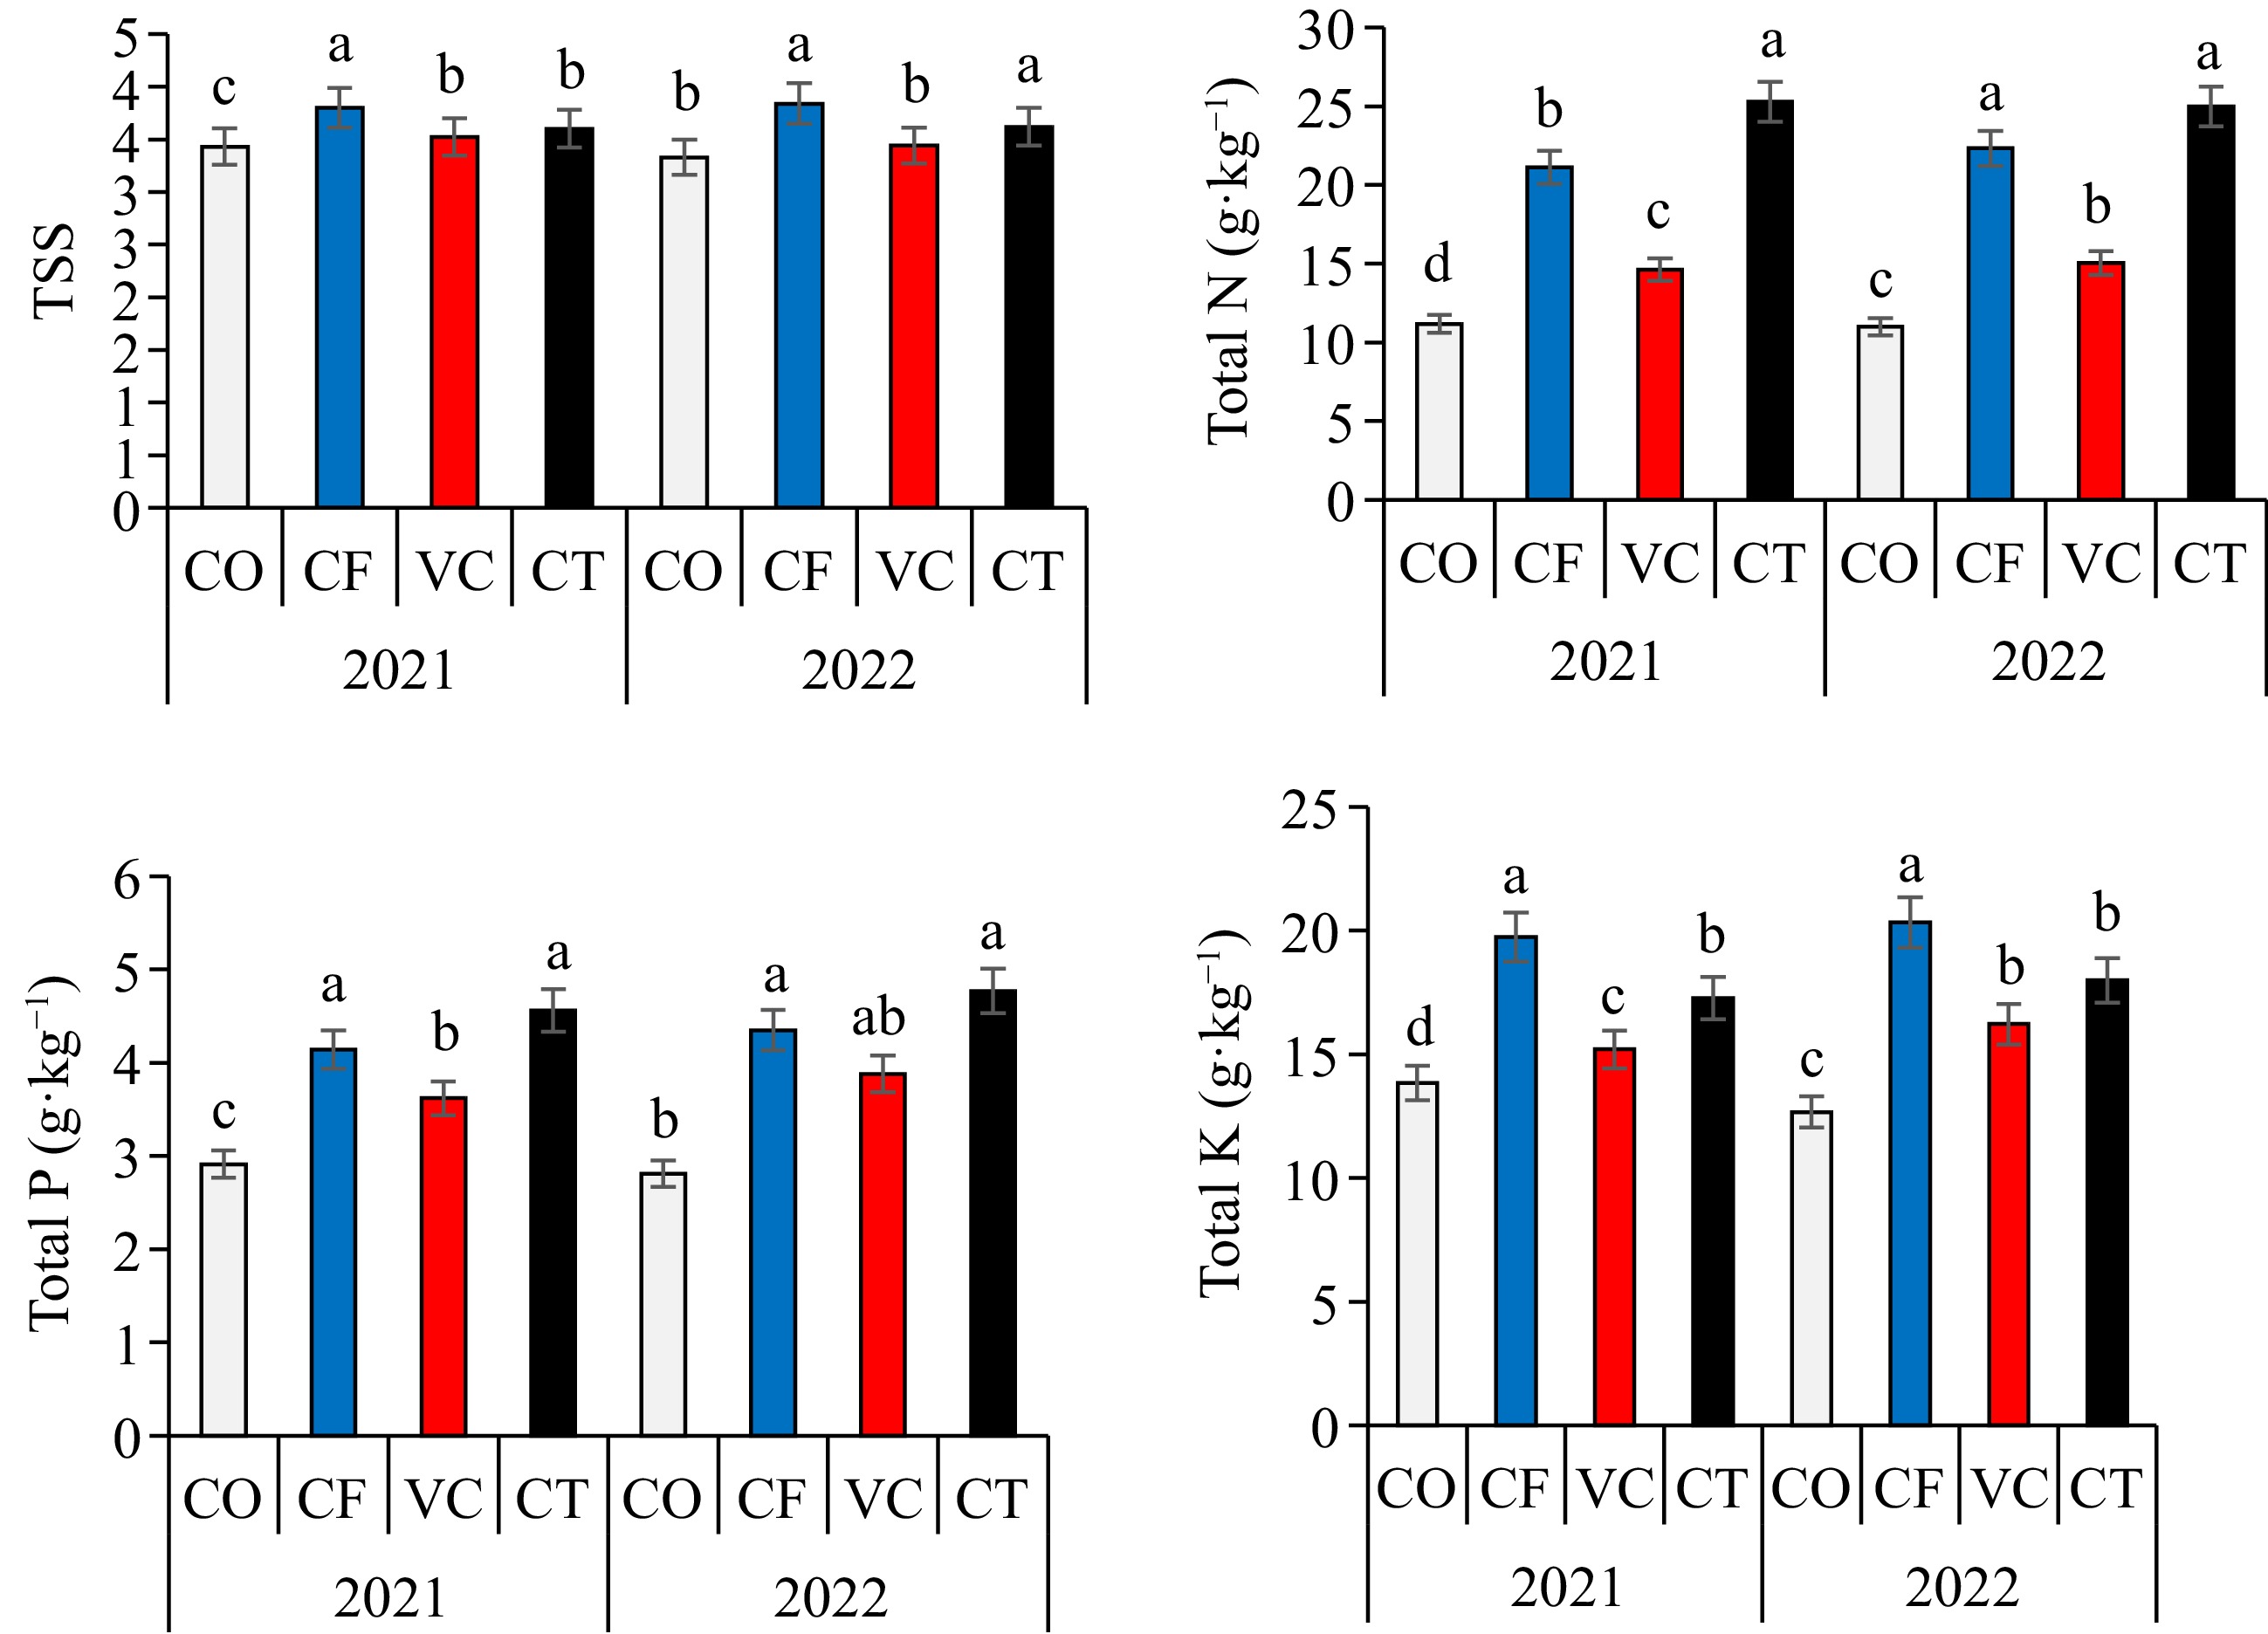
Figure 3.
Impact of organic fertilizers on total soluble solids, total N, total P, and total K.
-
Property Unit Value Sand g·kg−1 457 ± 10.5 Silt g·kg−1 327 ± 6.90 Clay g·kg−1 216 ± 5.40 Texture − Silty loam CaCO3 g·kg−1 32.7 ± 2.57 EC (1:2.5) dS·m−1 0.63 ± 0.10 pH (1:2.5) − 7.90 ± 0.05 OM g·kg−1 11.3 ± 1.39 Available N mg·kg−1 60.4 ± 5.40 Available P mg·kg−1 14.7 ± 1.30 Available K mg·kg−1 397 ± 5.30 Table 1.
Some physical and chemical properties of the soil before experiment.
-
Property Unit Compost Vermicompost EC (1:5) dS·m−1 4.39 ± 0.07 3.89 ± 0.82 pH (1:5) − 7.77 ± 0.07 7.88 ± 0.05 (OC) g·kg−1 203 ± 3.12 237.6 ± 2.89 Total N g·kg−1 16.4 ± 2.31 16.9 ± 6.76 Total P g·kg−1 6.80 ± 1.43 12.9 ± 0.84 Total K g·kg−1 18.7 ± 0.80 10.9 ± 0.90 C/N ratio − 12.4 ± 0.70 14.1 ± 1.20 Each value represents a mean ± standard error (SE) of five replicates. Table 2.
Characteristics of the compost and vermicompost.
-
Year Treatments N uptake (kg·ha−1) P uptake (kg·ha−1) K uptake (kg·ha−1) NUE (kg·kg−1) PUE (kg·kg−1) KUE (kg·kg−1) 2021 CO 27.83 ± 0.36d 7.25 ± 0.75d 34.46 ± 1.32c − − − CF 108.25 ± 1.23b 21.22 ± 1.21b 101.24 ± 3.12a 34.9 ± 0.87b 87.2 ± 2.12b 52.3 ± 1.45b VC 52.46 ± 1.02c 12.98 ± 1.54c 54.55 ± 2.54b 25.2 ± 0.56c 63.1 ± 1.88c 37.8 ± 0.98c CT 154.24 ± 2.33a 27.85 ± 0.97a 105.43 ± 2.64a 65.3 ± 1.34a 163.3 ± 3.21a 98.0 ± 1.98a 2022 CO 27.89 ± 0.54d 5.93 ± 0.54d 32.10 ± 0.43c − − − CF 115.99 ± 2.43b 22.60 ± 1.03b 105.60 ± 1.55a 53.2 ± 0.88b 133.0 ± 3.65b 79.8 ± 1.56b VC 57.16 ± 1.54c 14.74 ± 0.87c 61.61 ± 0.98b 37.2 ± 0.98c 92.9 ± 0.78c 55.8 ± 0.78c CT 146.99 ± 2.32a 28.06 ± 1.32a 105.82 ± 1.01a 72.8 ± 1.23a 182.1 ± 3.11a 109.2 ± 0.54a Means within a column followed by the same letter do not differ significantly (p < 0.05) according to DMRT. Table 3.
Effect of different fertilizer treatments on total NPK uptake and nutrients use efficiency.
-
Year Treatments pH EC (dS·m−1) OM (g·Kg−1) Available N (mg·kg−1) Available P (mg·kg−1) Available K (mg·kg−1) 2021 CO 7.80 ± 0.02a 0.38 ± 0.01c 10.9 ± 0.21c 50.4 ± 1.12c 8.71 ± 1.43c 221.7 ± 1.76c CF 7.83 ± 0.01a 0.53 ± 0.01a 10.7 ± 0.02c 60.2 ± 1.23b 16.4 ± 0.92a 466.4 ± 4.12b VC 7.76 ± 0.02b 0.45 ± 0.02b 13.5 ± 0.10b 67.8 ± 1.23a 12.7 ± 1.32b 452.7 ± 4.98b CT 7.71 ± 0.01c 0.58 ± 0.02a 16.1 ± 0.12a 71.9 ± 1.04a 18.8 ± 0.23a 689.2 ± 3.23a 2022 CO 7.77 ± 0.05b 0.36 ± 0.02c 10.6 ± 0.88c 54.8 ± 2.02b 9.20 ± 1.34c 201.9 ± 2.54c CF 7.85 ± 0.03a 0.58 ± 0.02a 10.6 ± 0.76c 58.0 ± 1.98b 17.7 ± 1.43a 426.5 ± 1.76b VC 7.74 ± 0.01b 0.53 ± 0.01b 14.5 ± 0.78b 64.9 ± 2.32a 11.4 ± 0.98b 462.9 ± 1.34b CT 7.68 ± 0.03c 0.62 ± 0.03a 17.2 ± 0.98a 68.7 ± 1.32a 17.6 ± 1.23a 609.3 ± 4.44a Means within a column followed by the same letter do not differ significantly (p < 0.05) according to DMRT. Table 4.
Effects of different fertilizer treatments on some selected soil properties.
-
Variables pH EC OM AN AP AK AFN FW FL FD DM TCh Fb Db TSS NUp Pup KUp TY pH 1.0 EC −0.46 1.0 OM −0.98 0.59 1.0 AN −0.88 0.68 0.95 1.0 AP −0.58 0.99 0.70 0.74 1.0 AK −0.69 0.94 0.81 0.88 0.97 1.0 AFN −0.56 0.99 0.67 0.71 1.00 0.95 1.0 FW −0.93 0.67 0.98 0.99 0.75 0.88 0.73 1.0 FL 0.19 0.75 −0.01 0.21 0.64 0.57 0.65 0.14 1.0 FD 0.29 0.71 −0.12 0.08 0.59 0.48 0.60 0.02 0.99 1.0 DM 0.30 0.49 −0.11 0.19 0.36 0.39 0.35 0.07 0.89 0.84 1.0 TCh 0.53 0.44 −0.36 −0.10 0.29 0.23 0.30 −0.19 0.92 0.93 0.93 1.0 Fb −0.78 0.91 0.85 0.83 0.96 0.96 0.96 0.87 0.41 0.35 0.14 0.03 1.0 Db −0.45 1.00 0.58 0.65 0.99 0.93 0.99 0.65 0.75 0.71 0.46 0.43 0.91 1.0 TSS 0.31 0.69 −0.15 0.05 0.58 0.46 0.59 −0.01 0.98 1.00 0.82 0.93 0.33 0.70 1.0 NUp −0.45 0.99 0.57 0.63 0.99 0.92 0.99 0.64 0.72 0.69 0.42 0.40 0.91 1.00 0.68 1.0 Pup −0.47 1.00 0.61 0.71 0.98 0.96 0.98 0.70 0.76 0.70 0.53 0.45 0.90 0.99 0.69 0.98 1.0 KUp 0.18 0.79 −0.02 0.16 0.69 0.57 0.70 0.11 0.98 0.99 0.78 0.87 0.46 0.79 0.99 0.78 0.78 1.0 TY −0.35 0.63 0.51 0.75 0.59 0.73 0.56 0.65 0.63 0.50 0.77 0.50 0.52 0.59 0.47 0.54 0.69 0.50 1.0 Electrical conductivity (EC), organic matter, (OM), available N (AN), available P (AP), available K (AK), fruit number (AFN), fruit weight (FW), fresh biomass (Fb), dry biomass (Db), N uptake (NUp), P uptake (Pup), fruit length (FL), fruit diameter (FD), fruit dry matter (DM), total chlorophyll (TCh), total soluble solids (TSS), P uptake (KUp) and yield (TY). Table 5.
Correlations coefficient among soil properties and zucchini traits.
Figures
(3)
Tables
(5)