-
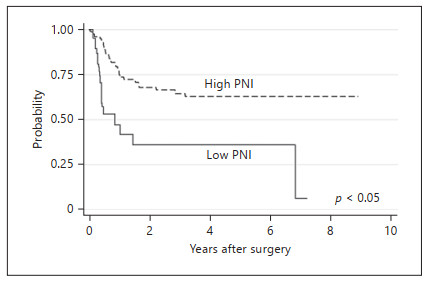
Figure 1.
Kaplan-Meier curves for RFS significantly differed between the high and low PNI groups (p < 0.05). RFS, recurrence-free survival; PNI, prognostic nutritional index.
-
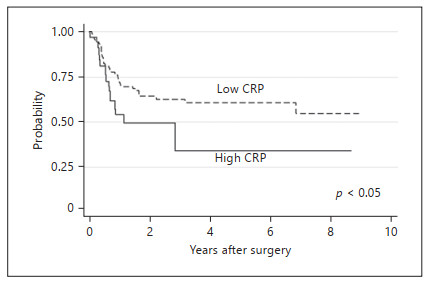
Figure 2.
Kaplan-Meier curves for RFS significantly differed between the high and low CRP groups (p < 0.05). RFS, recurrence-free survival; CRP, C-reactive protein.
-
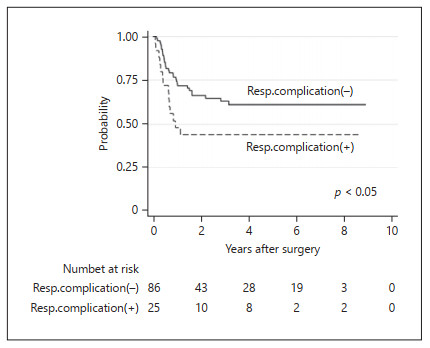
Figure 3.
Kaplan-Meier curves for RFS were significantly worse in patients with postoperative respiratory complications than in patients without postoperative respiratory complications (p < 0.05). RFS, recurrence-free survival.
-
PNI (cutoff = 44.2, n = 104) p value CRP (cutoff = 21.7) p value PNI >44.2 PNI <44.2 CRP <21.7 CRP >21.7 Patients, n 111 83 21 0.111 85 26 0.84 Age, years 66.3±7.77 65.64±7.91 68.67±7.64 66.5±6.37 66.24±8.18 Gender Male 93 73 14 0.041 70 23 0.557 Female 18 10 7 15 3 Location Upper 23 15 6 0.146 13 10 0.019 Middle 62 51 8 53 9 Lower 26 17 7 19 7 TNM classification T factors T1b 55 43 7 0.44 44 11 0.646 T2 13 9 3 9 4 T3 34 24 9 26 8 T4 9 7 2 6 3 N factors N0 45 34 6 0.831 34 11 0.543 N1 29 22 6 20 9 N2 22 17 5 19 3 N3 15 10 4 12 3 M factors M0 104 77 20 1.00 78 26 0.196 M1 7 6 1 7 0 pStage* Ⅰ 39 30 5 0.288 32 7 0.087 Ⅱ 16 13 1 8 8 Ⅲ 36 26 10 29 7 Ⅳ 20 14 5 16 4 Procedures Thoracoscopic 83 11 7 0.124 15 4 0.735 Ivor Lewis 17 61 12 58 20 THE 11 11 2 12 2 PNI, prognostic nutritional index; CRP, C-reactive protein; THE, transhiatal esophagectomy. * UICC TNM 8th edition. Table 1.
Clinical characteristics in this study
-
Covariants Cutoff value (FP, TP) HR RFS HR OS 95% CI p value 95% CI p value Age 1.068 0.819–1.394 0.627 1.117 0.855–1.461 0.417 Gender 0.969 0.432–2.176 0.94 0.859 0.362–2.036 0.729 pT 1.622 1.247–2.109 0.001* 1.521 1.159–1.995 0.003* pN 1.658 1.270–2.165 0.001* 1.674 1.265–2.214 0.001* pM 1.477 0.528–4.133 0.457 1.333 0.475–3.741 0.585 pTNM 1.829 1.378–2.428 0.001* 1.726 1.296–2.300 0.001* Tumor location 0.467 0.292–0.747 0.002* 0.394 0.243–0.637 0.001* Operative procedures 0.685 0.392–1.197 0.184 0.837 0.491–1.429 0.515 Preoperative PNI 44.2 (0.891, 0.333) 0.292 0.155–0.552 0.001* 0.315 0.164–0.606 0.001* Preoperative albumin, g/dL 3.5 (0.897, 0.279) 0.459 0.251–0.839 0.011* 0.471 0.254–0.876 0.017* NLR 2.272 (0.484, 0.600) 0.84 0.459–1.536 0.571 0.716 0.382–1.342 0.297 BMI, kg/m2 21.4 (0.441, 0.698) 0.669 0.354–1.263 0.216 0.686 0.364–1.295 0.246 Blood loss, g 159 (0.515, 0.767) 2.549 1.313–4.946 0.006* 2.467 1.242–4.897 0.01* CRPmax 21.7 (0.809, 0.326) 1.944 1.047–3.608 0.0321* 1.735 0.9023–3.337 0.0942 CRP/albumin ratio 8.512 (0.735, 0.395) 1.702 0.939–3.084 0.076 1.726 0.933–3.193 0.081 Operation time 360 min (median) 1.369 0.735–2.550 0.322 1.26 0.690–2.304 4.522 Hospital stay 42 days (median) 1.161 0.629–2.144 0.663 1.32 0.724–2.409 0.365 Postoperative complications 1.129 0.625–2.041 0.625 1.056 0.583–1.941 0.855 OS, overall survival; RFS, recurrence-free survival; FP, false positive TP, true positive; PNI, prognostic nutritional index; CRP, Creactive protein; NLR, neutrophil-to-lymphocyte ratio. * Statistically significant. Table 2.
Univariate analysis for OS and RFS in the present study
-
Covariants HR OS after IPTW 95% CI p value HR RFS after IPTW 95% CI p value PNI 0.391 0.177–0.863 0.02* 0.36 0.178–0.729 0.005* CRPmax 1.507 0.760–2.988 0.24 1.841 1.014–3.342 0.045* NLR 0.878 0.460–1.674 0.694 0.913 0.496–1.679 0.771 Blood loss 1.528 0.757–3.085 0.236 1.479 0.769–2.842 0.24 BMI 0.767 0.393–1.496 0.437 0.698 0.361–1.347 0.284 Albumin (preoperative) 0.502 0.253–0.995 0.048* 0.496 0.263–0.935 0.03* CRP/albumin ratio 1.35 0.713–2.558 0.356 1.326 0.713–2.465 0.372 OS, overall survival; RFS, recurrence-free survival; EC, esophageal cancer; IPTW, inverse probability of treatment weighting; PNI, prognostic nutritional index; CRP, C-reactive protein; NLR, neutrophil-to-lymphocyte ratio. * Statistically significant. Table 3.
Univariate analysis for RFS and OS of advanced EC patients after IPTW
-
Covariants For OS For RFS HR 95% CI p value HR 95% CI p value pStage Ⅰ High versus low PNI 0.41 0.326–51.66 0.274 2.939 0.281–30.74 0.368 pStage Ⅱ–Ⅳ High versus low PNI 0.233 0.125–0.432 0.001* 0.24 0.130–0.440 0.001* OS, overall survival; RFS, recurrence-free survival; IPTW, inverse probability of treatment weighting; PNI, prognostic nutritional index. * Statistically significant. Table 4.
Univariate analysis for OS and RFS between low and high PNI groups after IPTW in different stages
-
For RFS p value For OS p value HR 95% CI HR 95% CI Age 0.9123 0.498–1.670 0.766 0.924 0.489–1.743 0.807 pTNM 1.745 1.305–2.334 0.001* 1.757 1.281–2.410 0.001* PNI 0.258 0.133–0.498 0.001* 0.292 0.145–0.588 0.001* CRPmax 2.432 1.226–4.823 0.01* 2.079 1.010–4.282 0.047* Blood loss 1.92 1.001–3.683 0.049* 2.264 1.116–4.589 0.023* OS, overall survival; RFS, recurrence-free survival; EC, esophageal cancer; PNI, prognostic nutritional index; CRP, C-reactive protein. * Statistically significant. Table 5.
Multivariate Cox analysis for RFS and OS in EC patients
-
Complications Incidence, n/N (%) Anastomotic leakages 9/111 (8.1) Recurrent nerve palsy 11/111 (9.9) Pneumonia 17/111 (19.9) Pleural effusion 8/111 (7.2) SSI 12/111 (10.71) Others 5/111 (4.5) Others: chylothorax, ileus, peritonitis (2 patients), and abdominal abscess. Duplicate cases were included. SSI, surgical site infection. Table 6.
Postoperative complications in this study, Clavien-Dindo ≥2
Figures
(3)
Tables
(6)