-
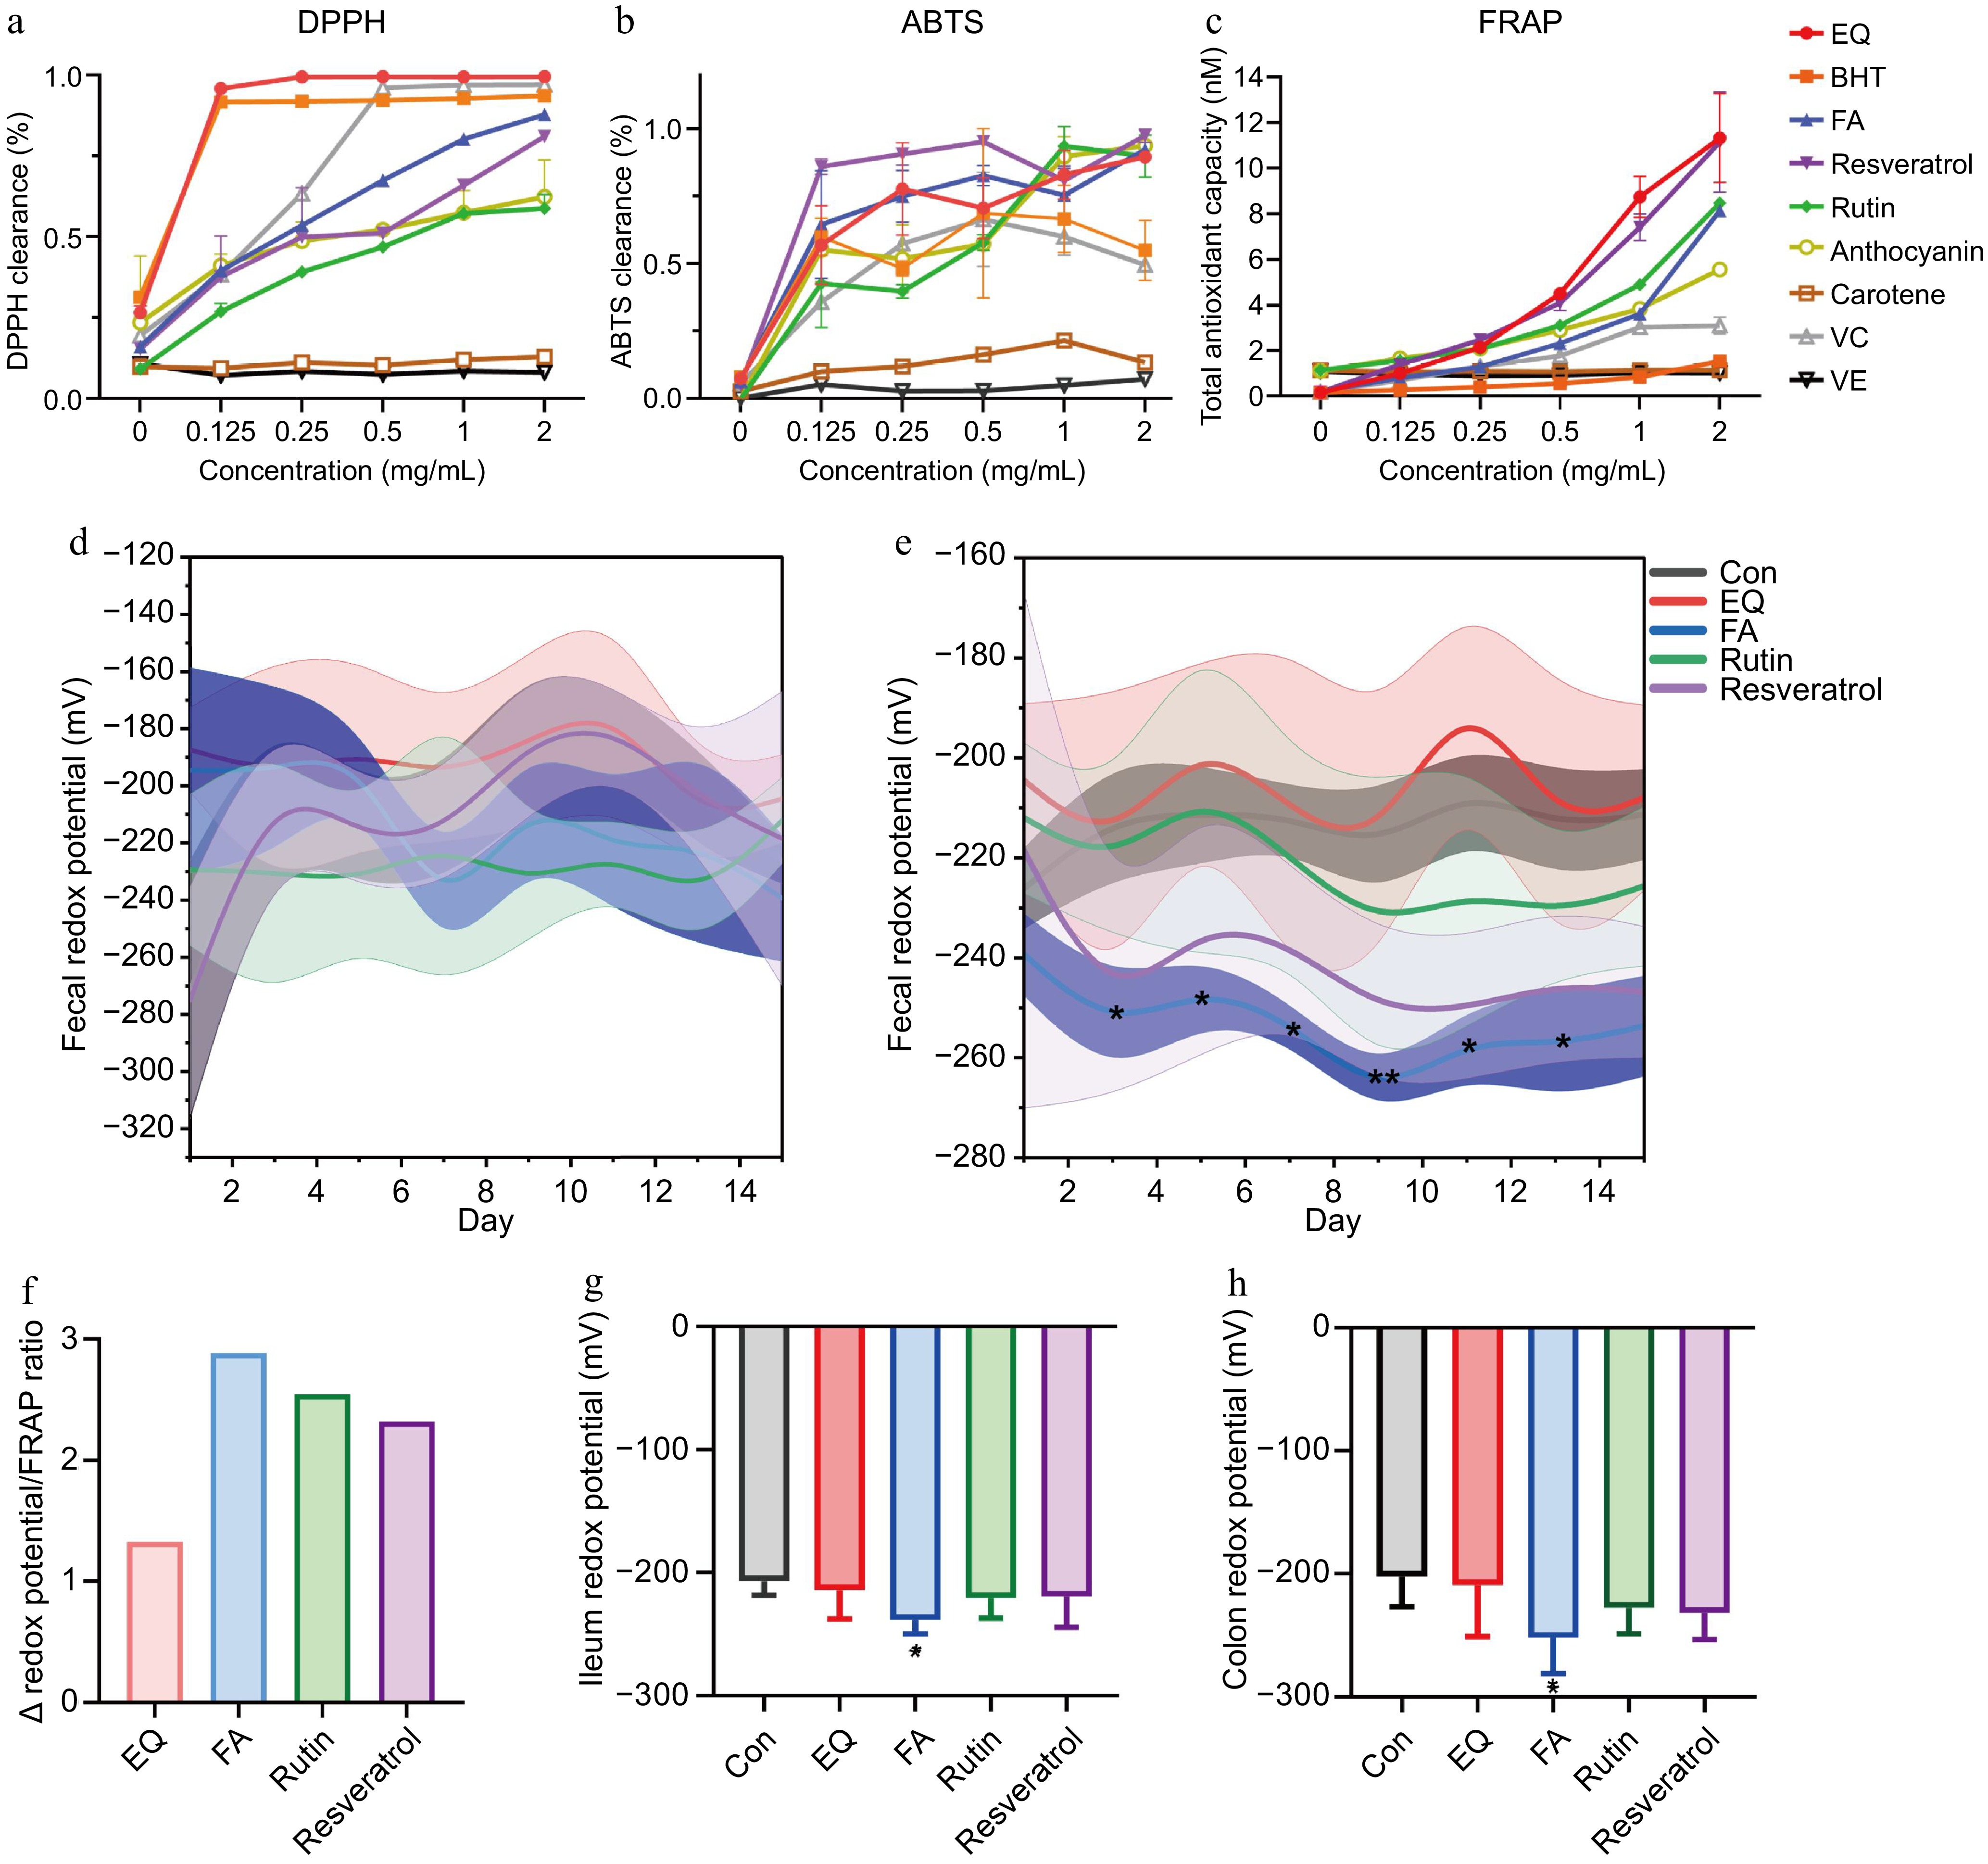
Figure 1.
Comparison of regulating redox potential ability of different antioxidants. (a), (b) The DPPH and ABTS clearance of different kinds of antioxidants in vitro. (c) Determination of the FRAP activity of different kinds of antioxidants in vitro. (d), (e) Dynamic changes of redox potential at diverse antioxidant intervention in vivo. (f) Ratio of Δ redox potential to FRAP. (g), (h) Effects of EQ, FA, rutin and resveratrol on regulating redox potential of ileal and colonic digesta.
-
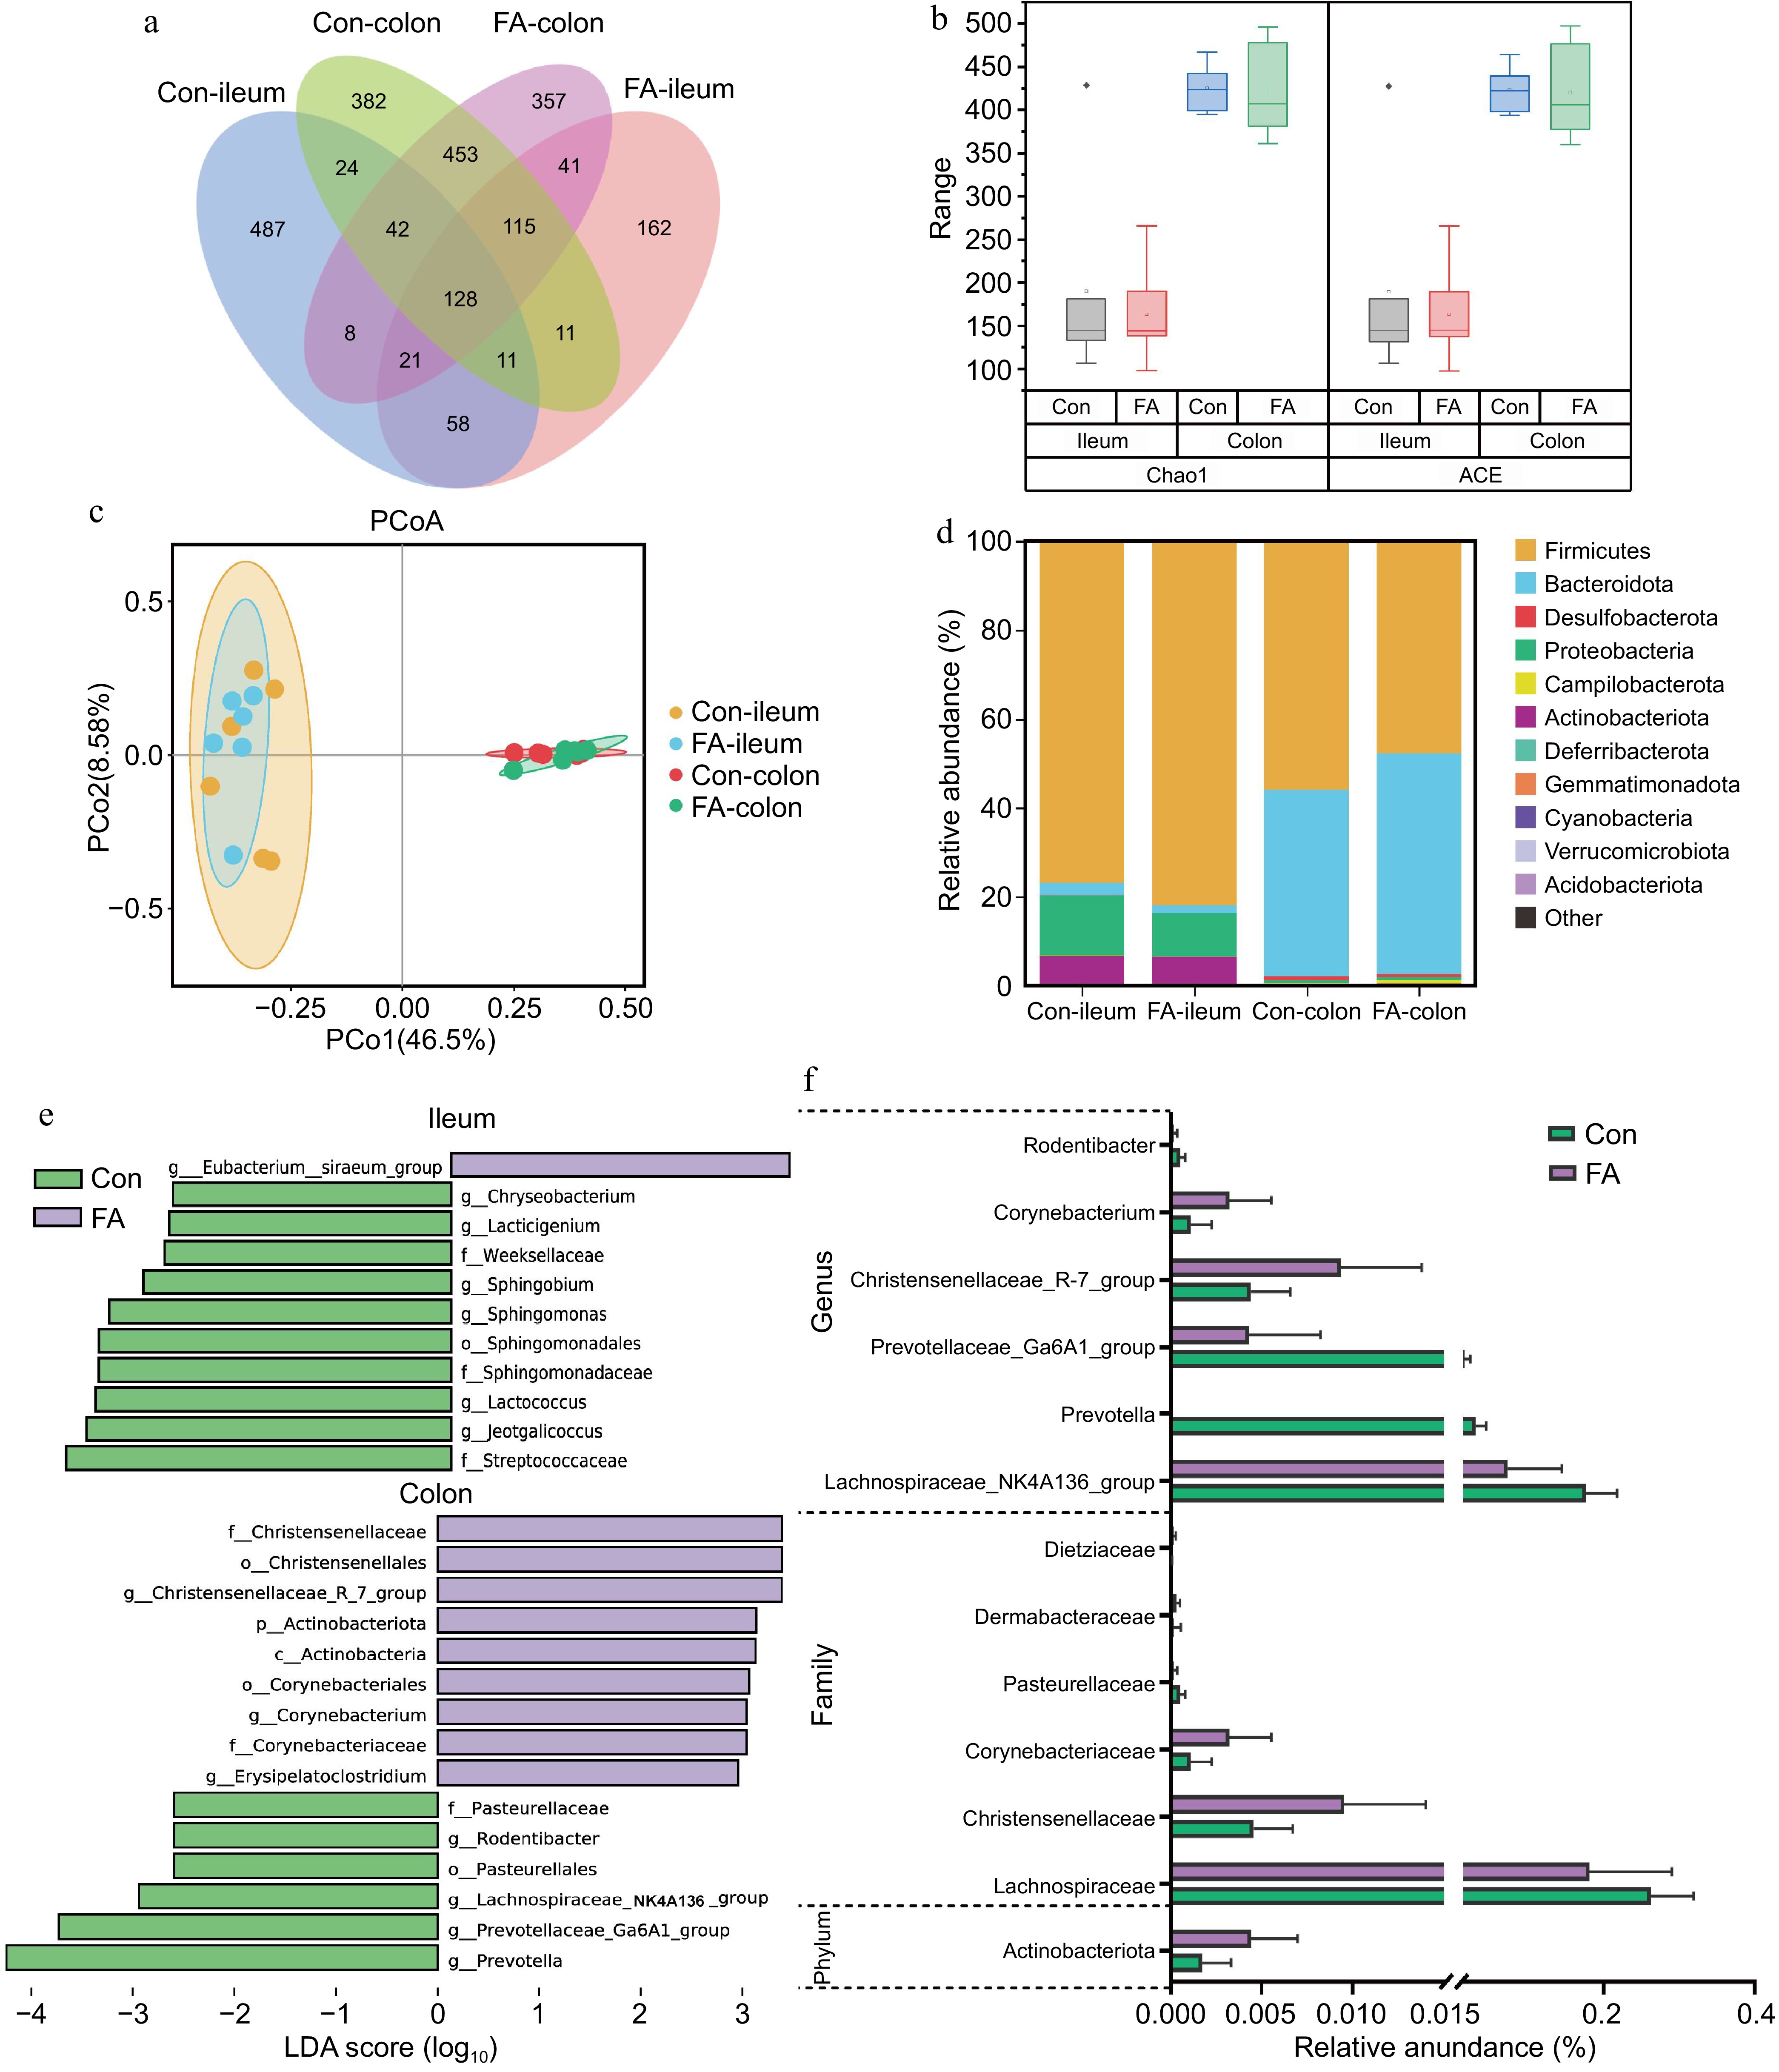
Figure 2.
Effects of FA supplementation on intestinal microbes at different taxonomic levels of rats. (a) Venn diagrams show the numbers of unique and shared ASVs between the four groups. (b) The alpha diversity of ileal and colonic microbiota. (c) Unweighted principal coordinate analysis of ileal and colonic microbiota. (d) Composition of ileal and colonic microbiota at the phylum level. (e) LDA score plot generated from LEfSe analysis used to evaluate the differentially abundant. Taxa from phylum to genus of ileal and colonic microbiota (LDA Score > 2, p < 0.05). Con = Control group; FA = FA supplementation group; ASV = Amplicon sequence variant; LDA = Linear discriminant analysis; LEfSe = Linear discriminant analysis effect size. (f) The relative abundance of colonic microbes with significant differences.
-
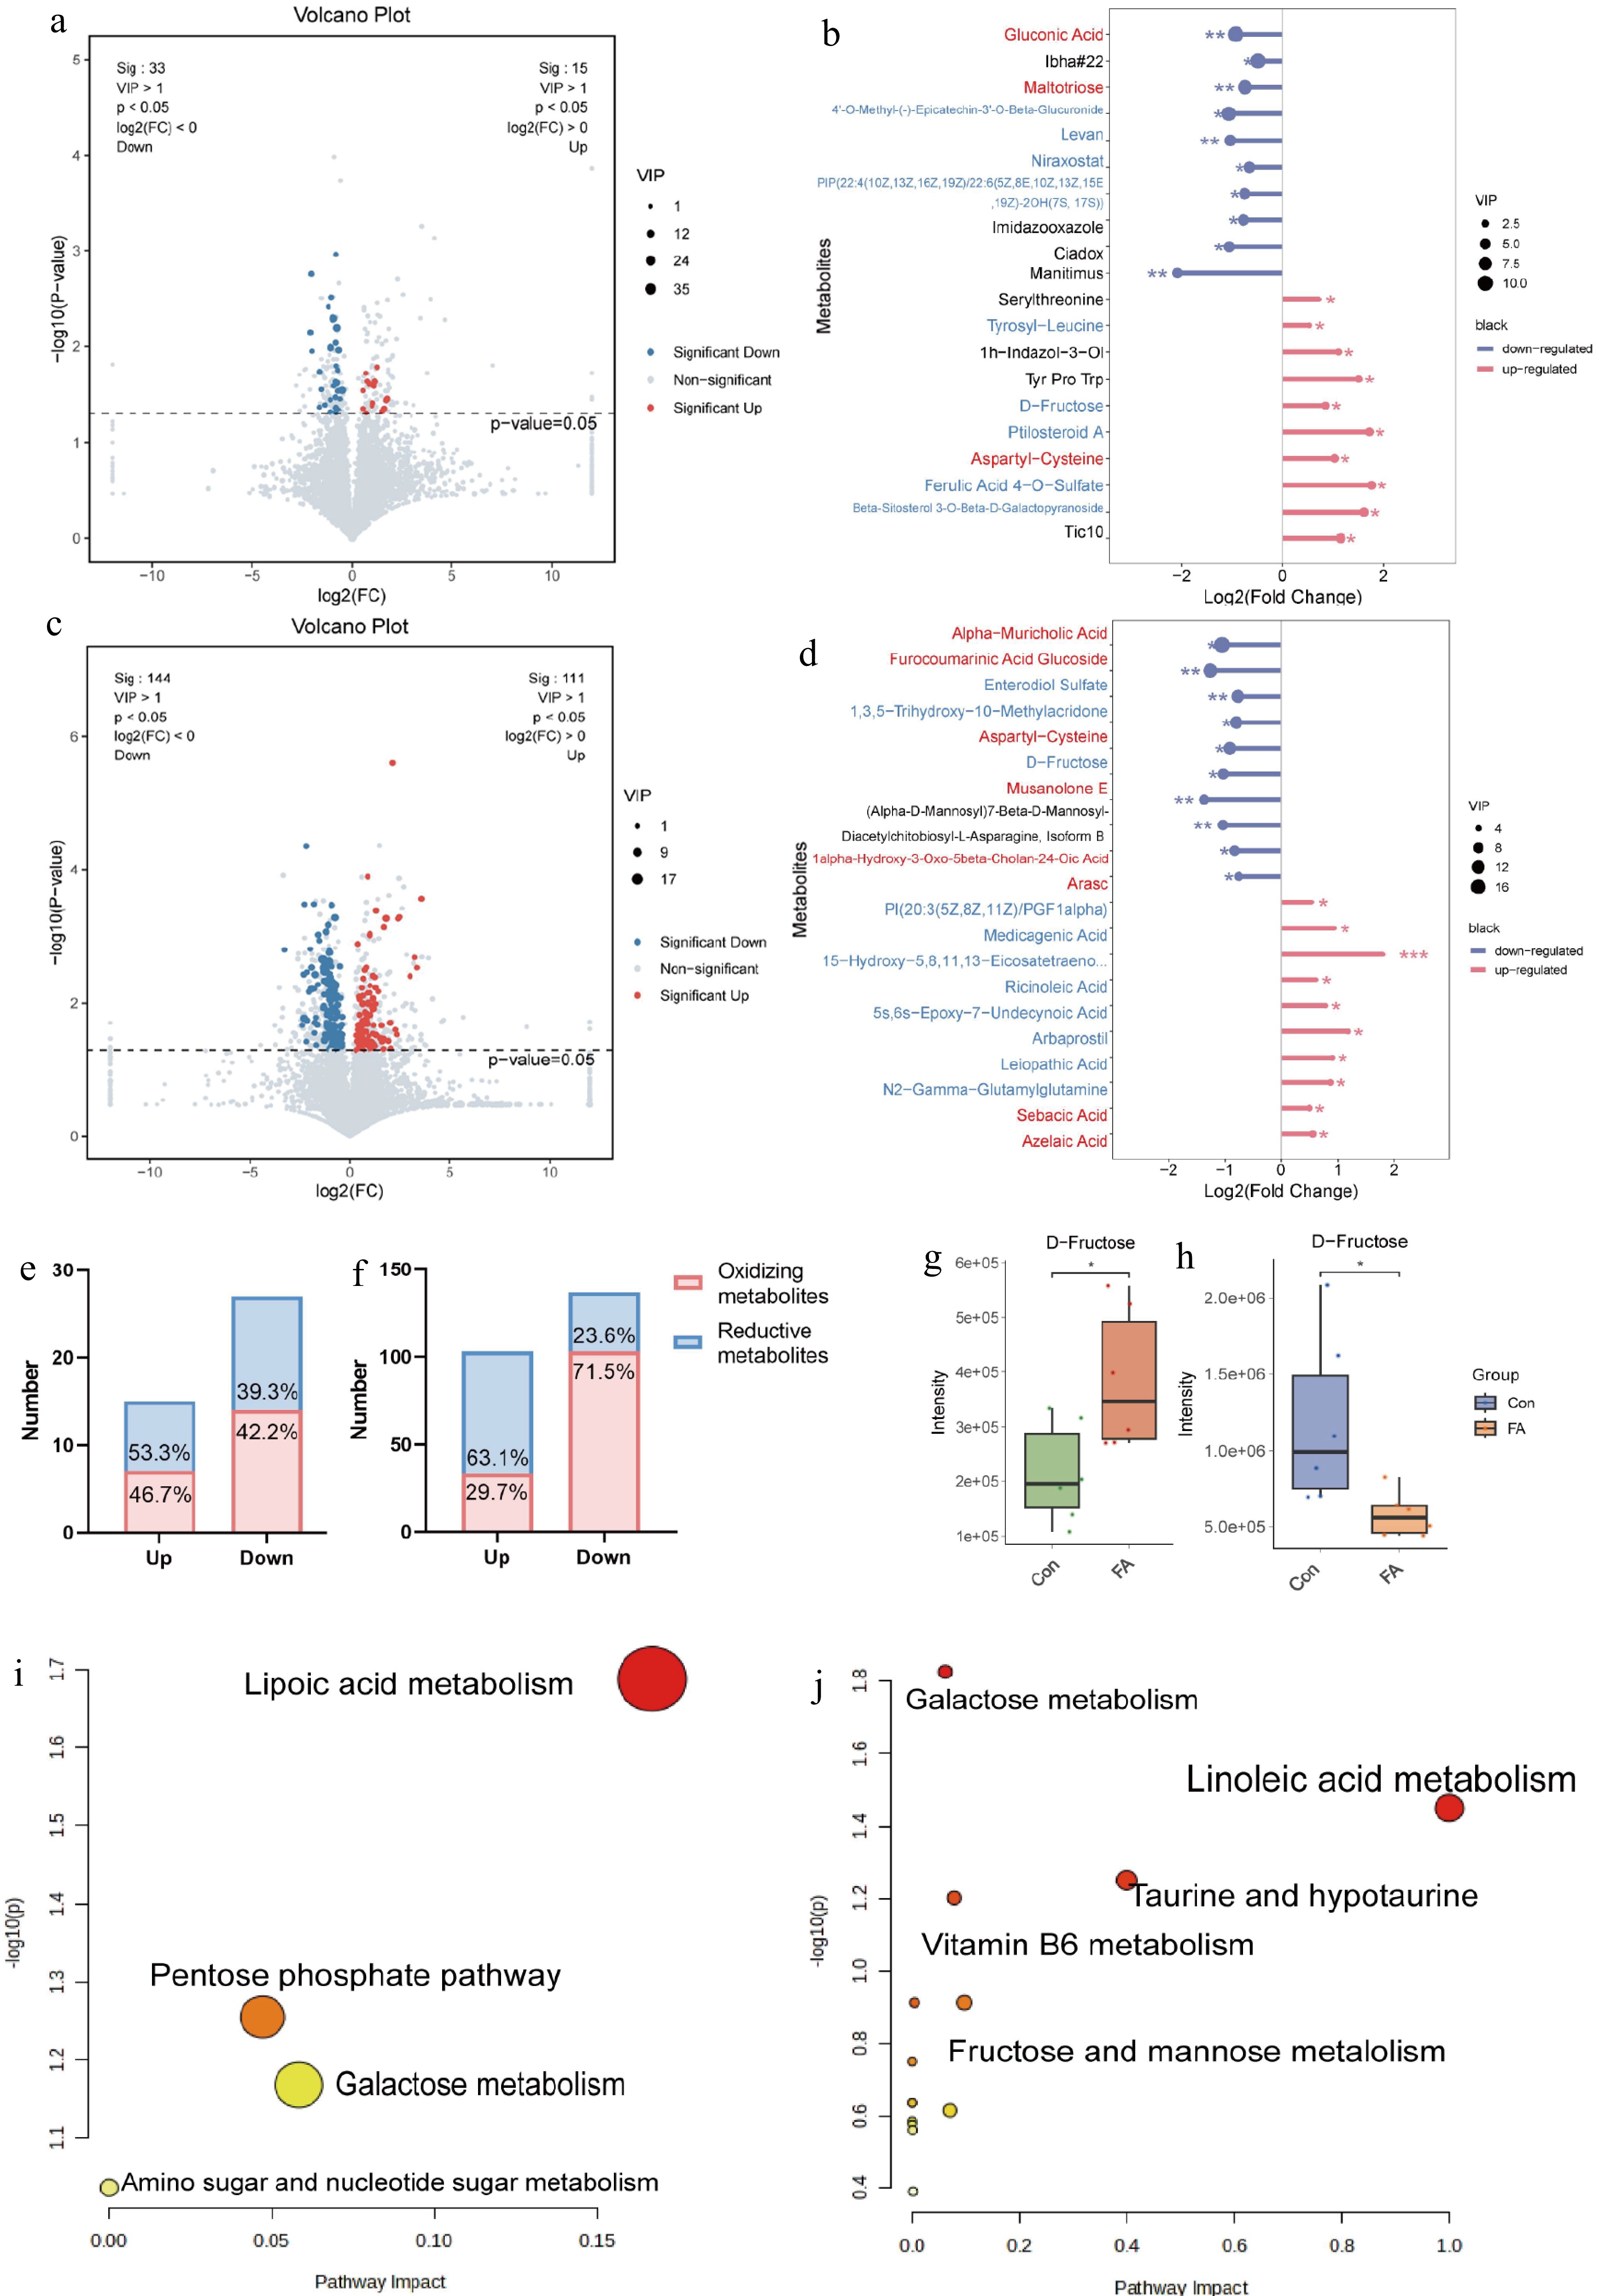
Figure 3.
Effects of FA supplementation on intestinal metabolism of rats. (a), (c) The volcano plot displays the distribution of differentially expressed metabolites of ileal and colonic digesta. Fold change (FC) was calculated by comparing with the Con group. Metabolites over the dashed line have a significant difference (p < 0.05, VIP > 1 and FC < 1). The red dots represent significantly up-regulated differential metabolites (p < 0.05, VIP > 1 and FC > 1), while the blue dots indicate significantly down-regulated differential metabolites (p < 0.05, VIP > 1 and FC < 1). (b), (d) Lolipopmaps of ileal and colonic digesta showing metabolites and their log2 (FoldChange) values. Red font indicates antioxidant; blue font indicates oxidant. An asterisk indicates the significance of differential metabolism (* indicates significance < 0.05, > 0.01; ** indicates significance < 0.01, > 0.001; *** indicates significance < 0.001, > 0.0001; **** means significance < 0.0001), and the dot size is determined by the VIP value. (e), (f) Statistical analysises of redox metabolites in ileal and colonic digesta. (g), (h) Differential expression analysises of D-Fructose in ileal and colonic digesta. (i), (j) KEGG pathway enrichment analysis on the differential metabolites identified in the ileum and colon.
-
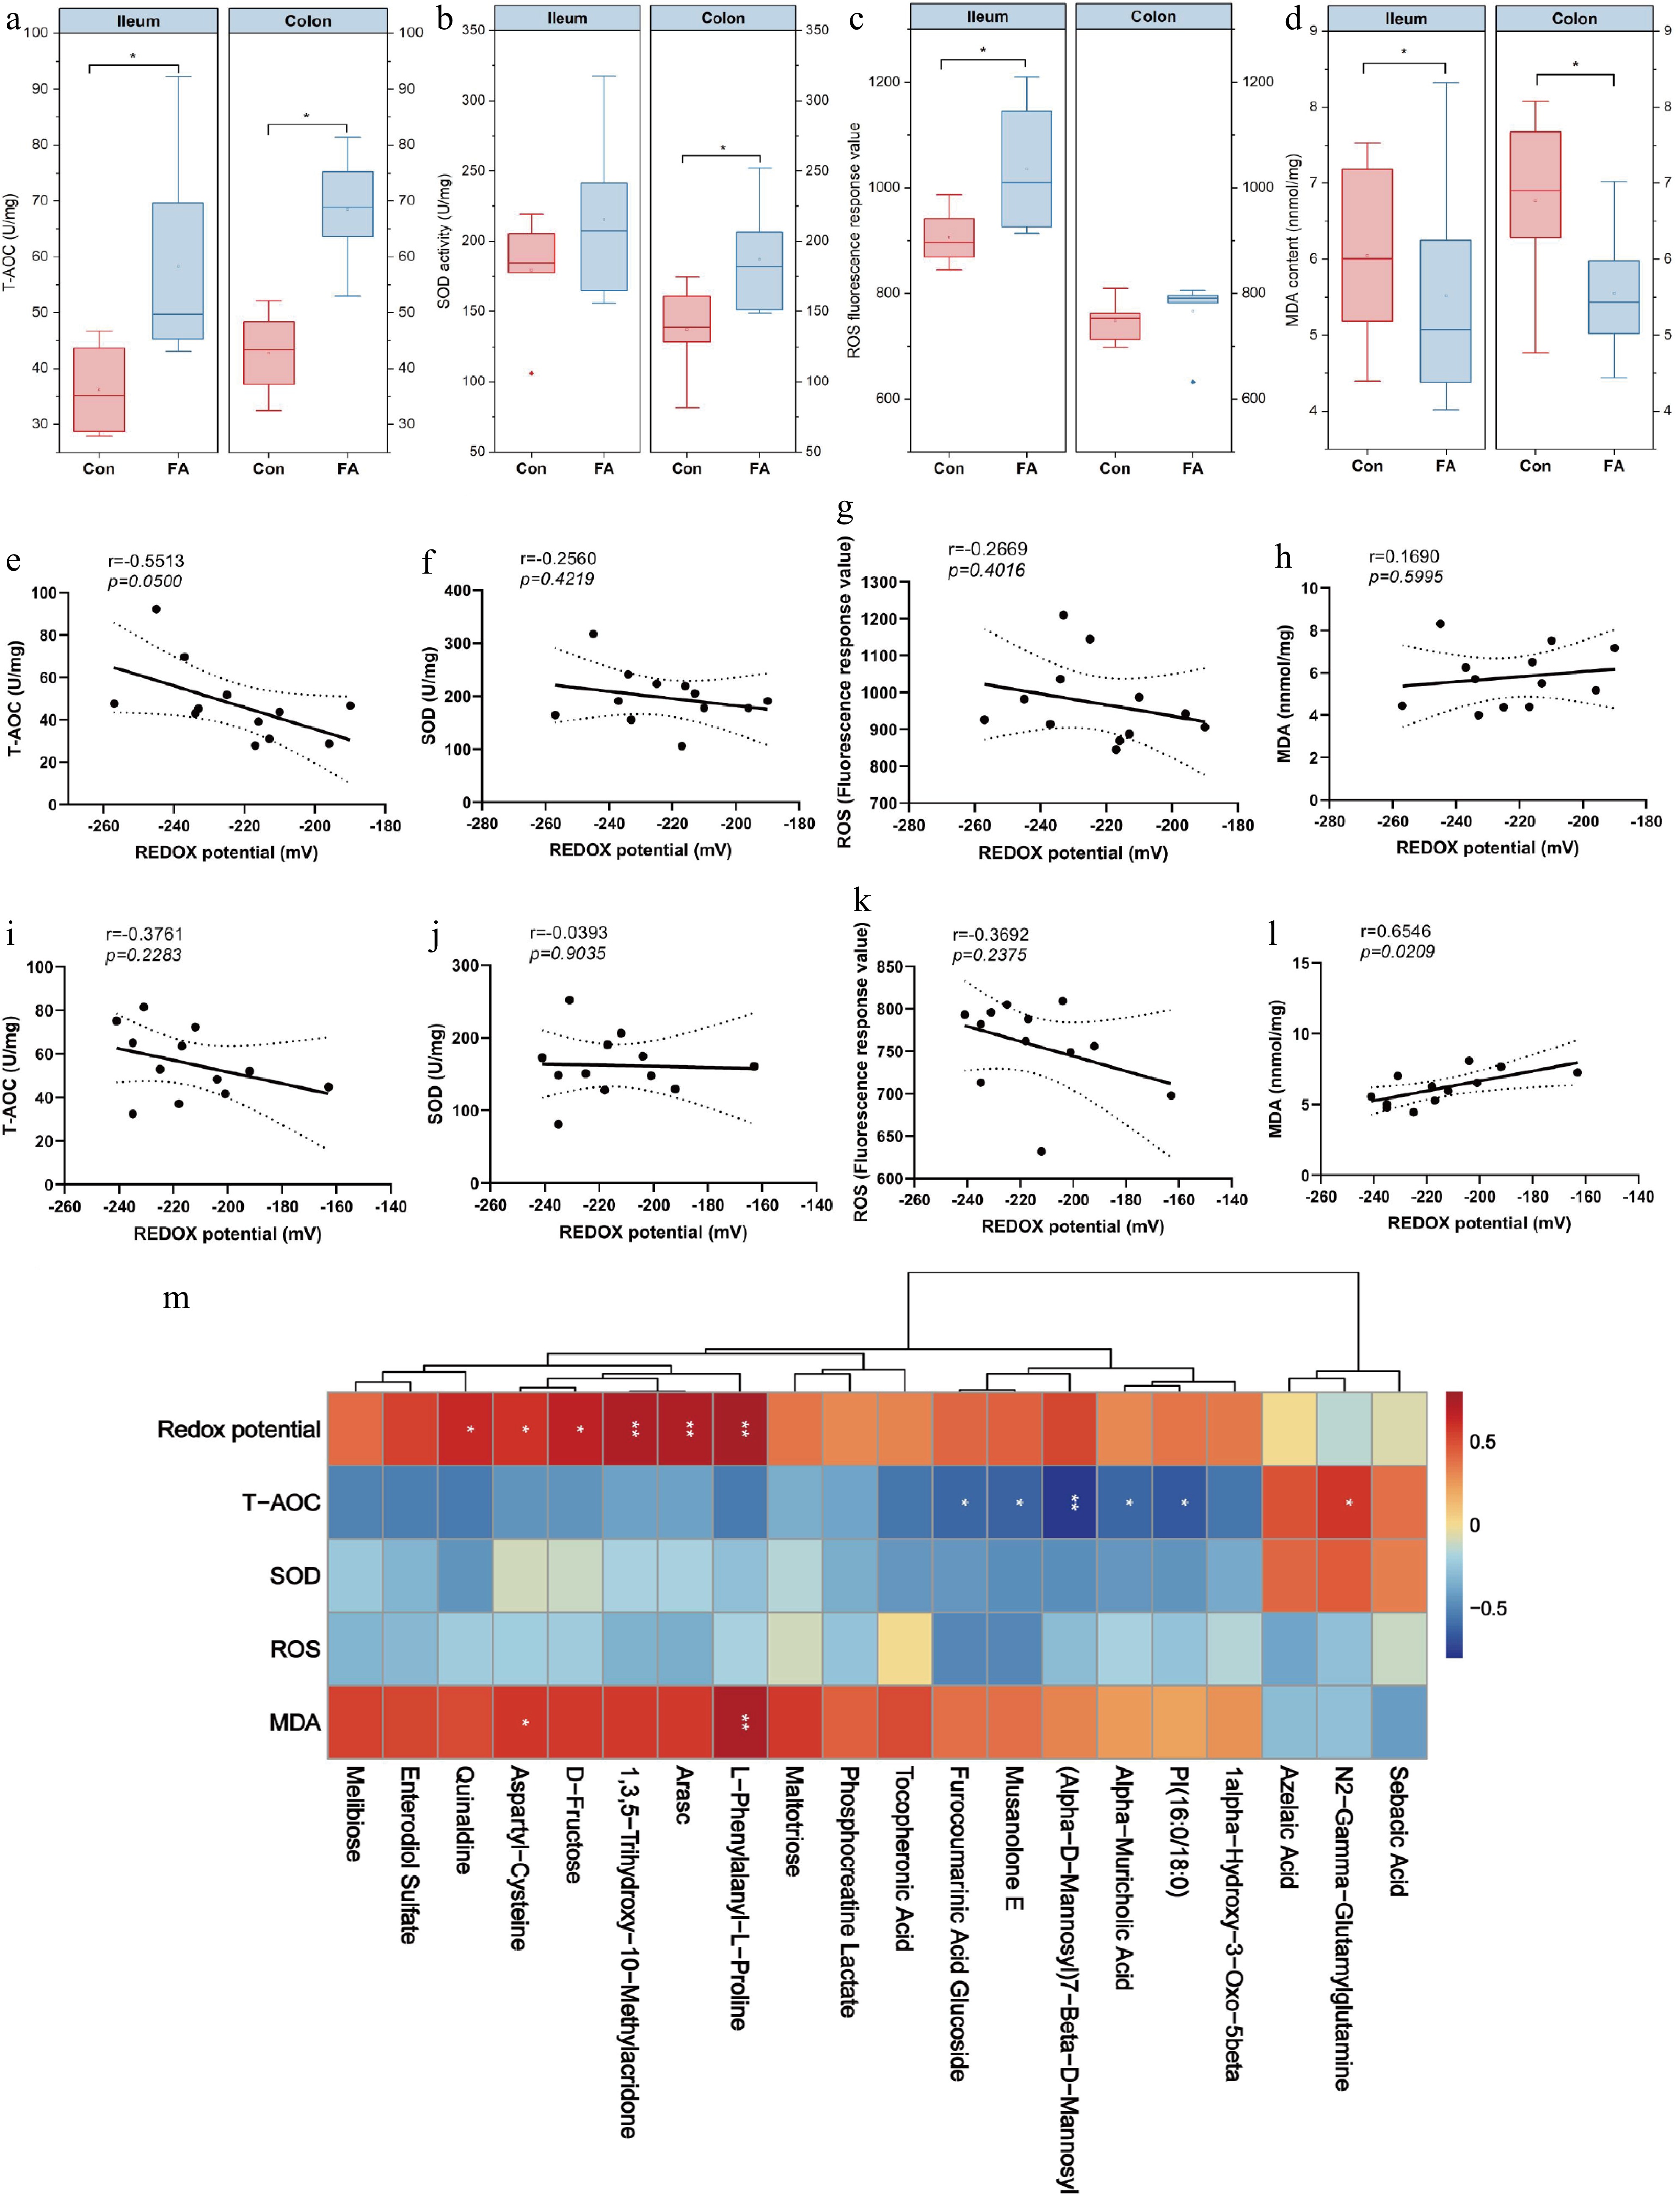
Figure 4.
Improvement of FA supplementation on intestinal antioxidant activity. (a)−(d) The levels of T-AOC, SOD, ROS, and MDA activities. (e)−(l) Correlation analysis of redox potential of ileal and colonic digesta with different antioxidant indexes. (m) Correlations between the colonic microbiota and redox potential, T-AOC, SOD, ROS, and MDA activities. The analysis is based on Pearson's correlation coefficient. T-AOC = Total antioxidant capacity; SOD = Superoxide dismutase; ROS = Reactive oxygen species; MDA = Malondialdehyde. * = p < 0.05; ** = p < 0.01.
-
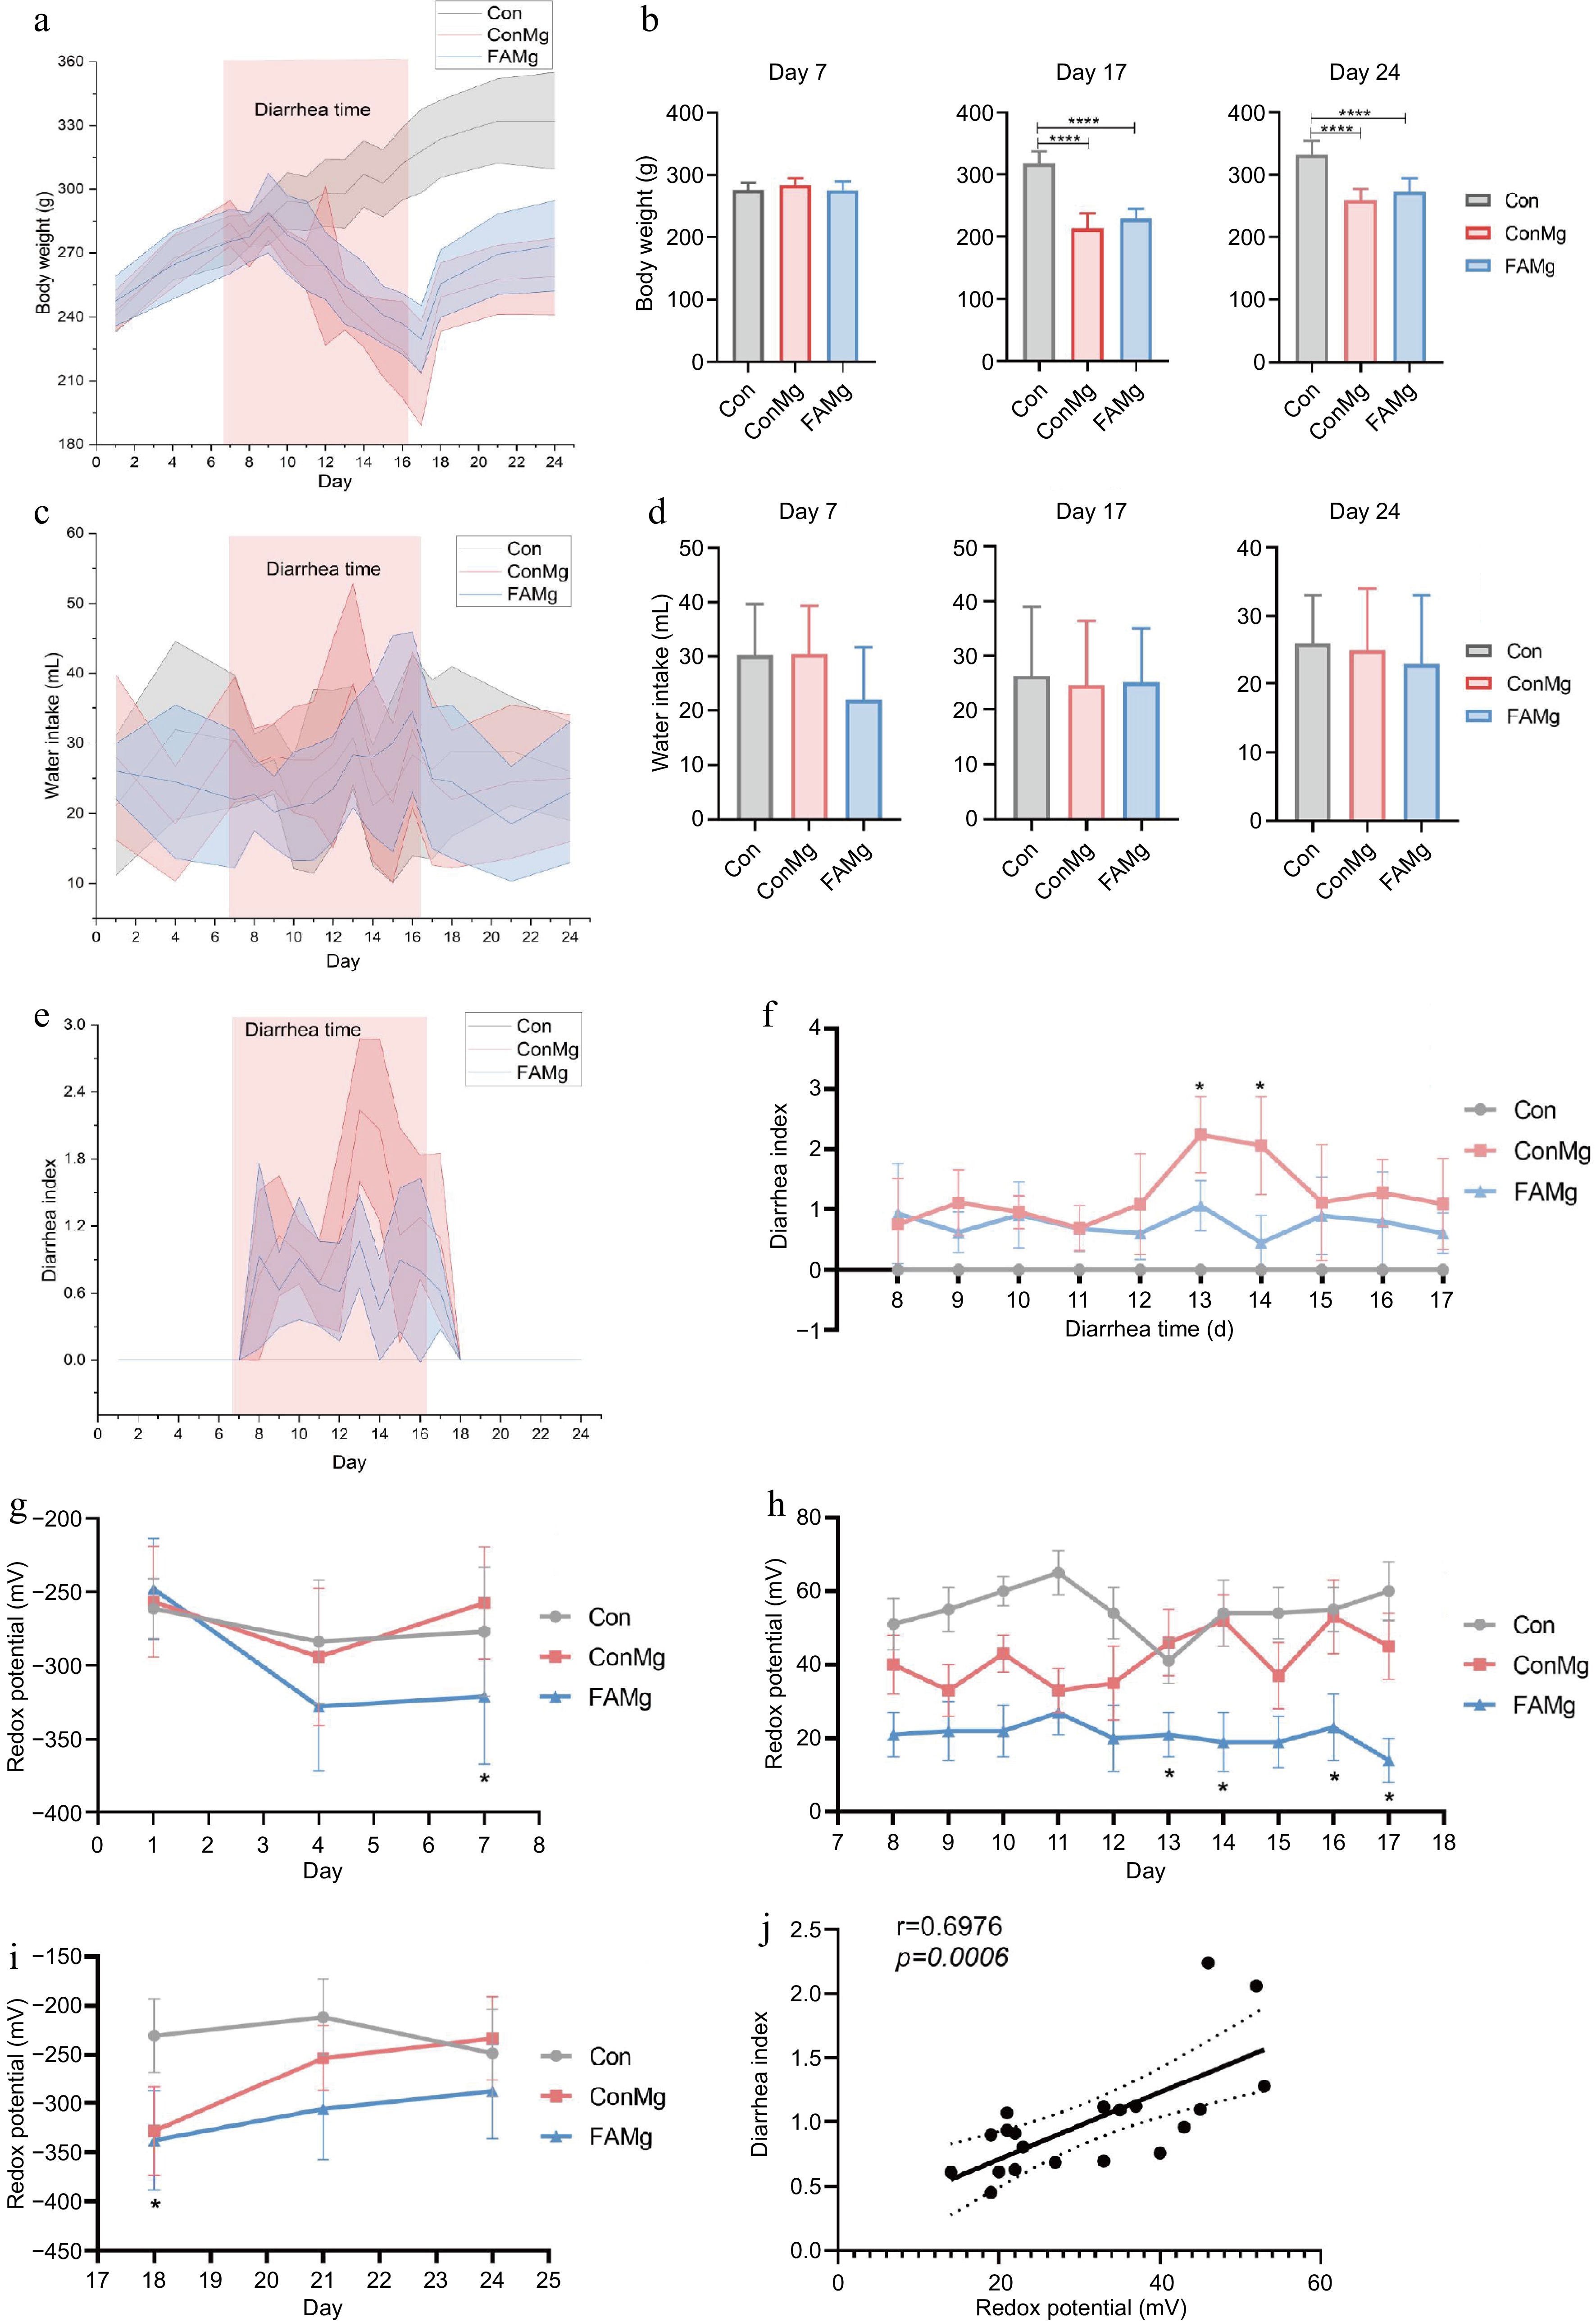
Figure 5.
Alleviation of FA supplementation on diarrhea in diarrhea model. (a) Dynamic changes in body weight. (b) Comparison of body weight changes in different days. (c) Dynamic changes in water intake. (d) Comparison of water intake change in different days. (e) Dynamic changes in diarrhea index. (f) Statistical analysis of diarrhea index. (g) Dynamic changes in redox potential in the balance period. (h) Statistical analysis of redox potential in diarrhea period. (i) Dynamic changes in redox potential in the recovery period. (j) Correlation analysis of redox potential and diarrhea index. The analysis is based on Pearson's correlation coefficient. * = p < 0.05.
-
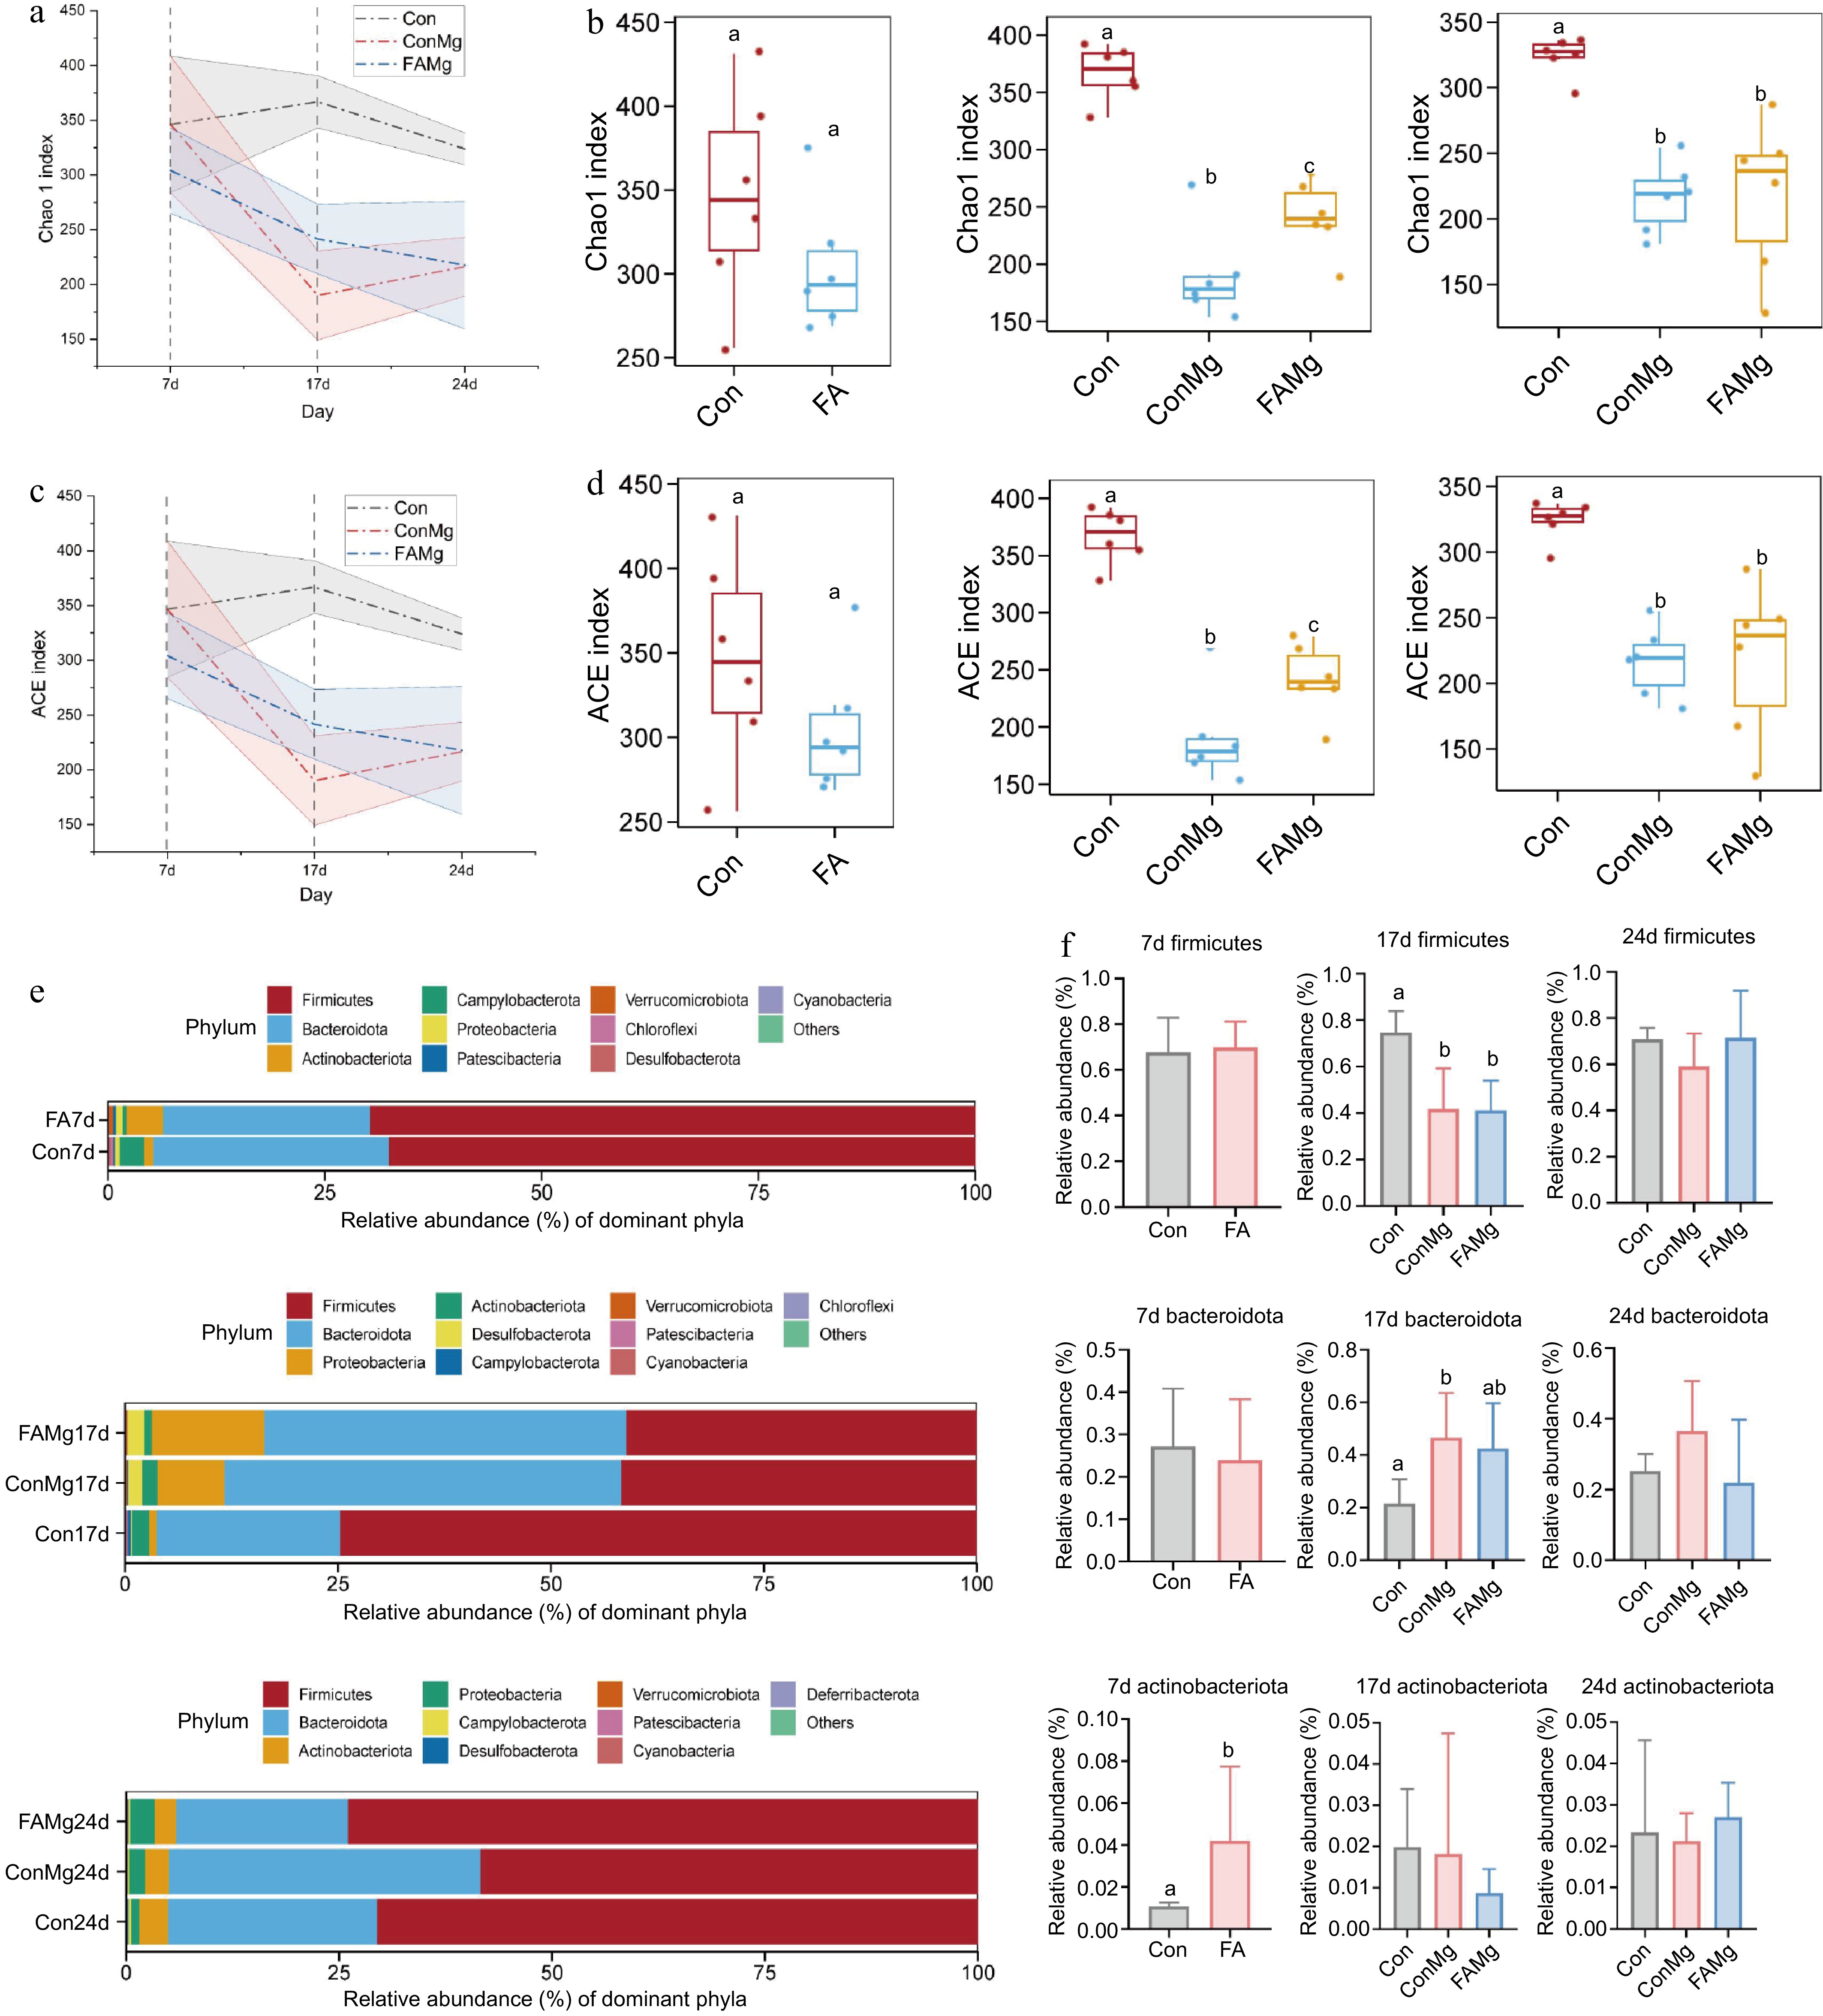
Figure 6.
Effects of FA on fecal microbiota at defferent periods of rats. (a), (c) Dynamic changes of Chao 1 and ACE indexes in each group of diarrhea model. (b), (d) Comparison of the change of Chao 1 and ACE indexes in the balance, diarrhea and recovery periods. (e) Composition of fecal microbiota at the phylum level. (f) Statistical analysis of abundances of Firmicutes, Bacteroidota and Actinobacteria in different periods.
-
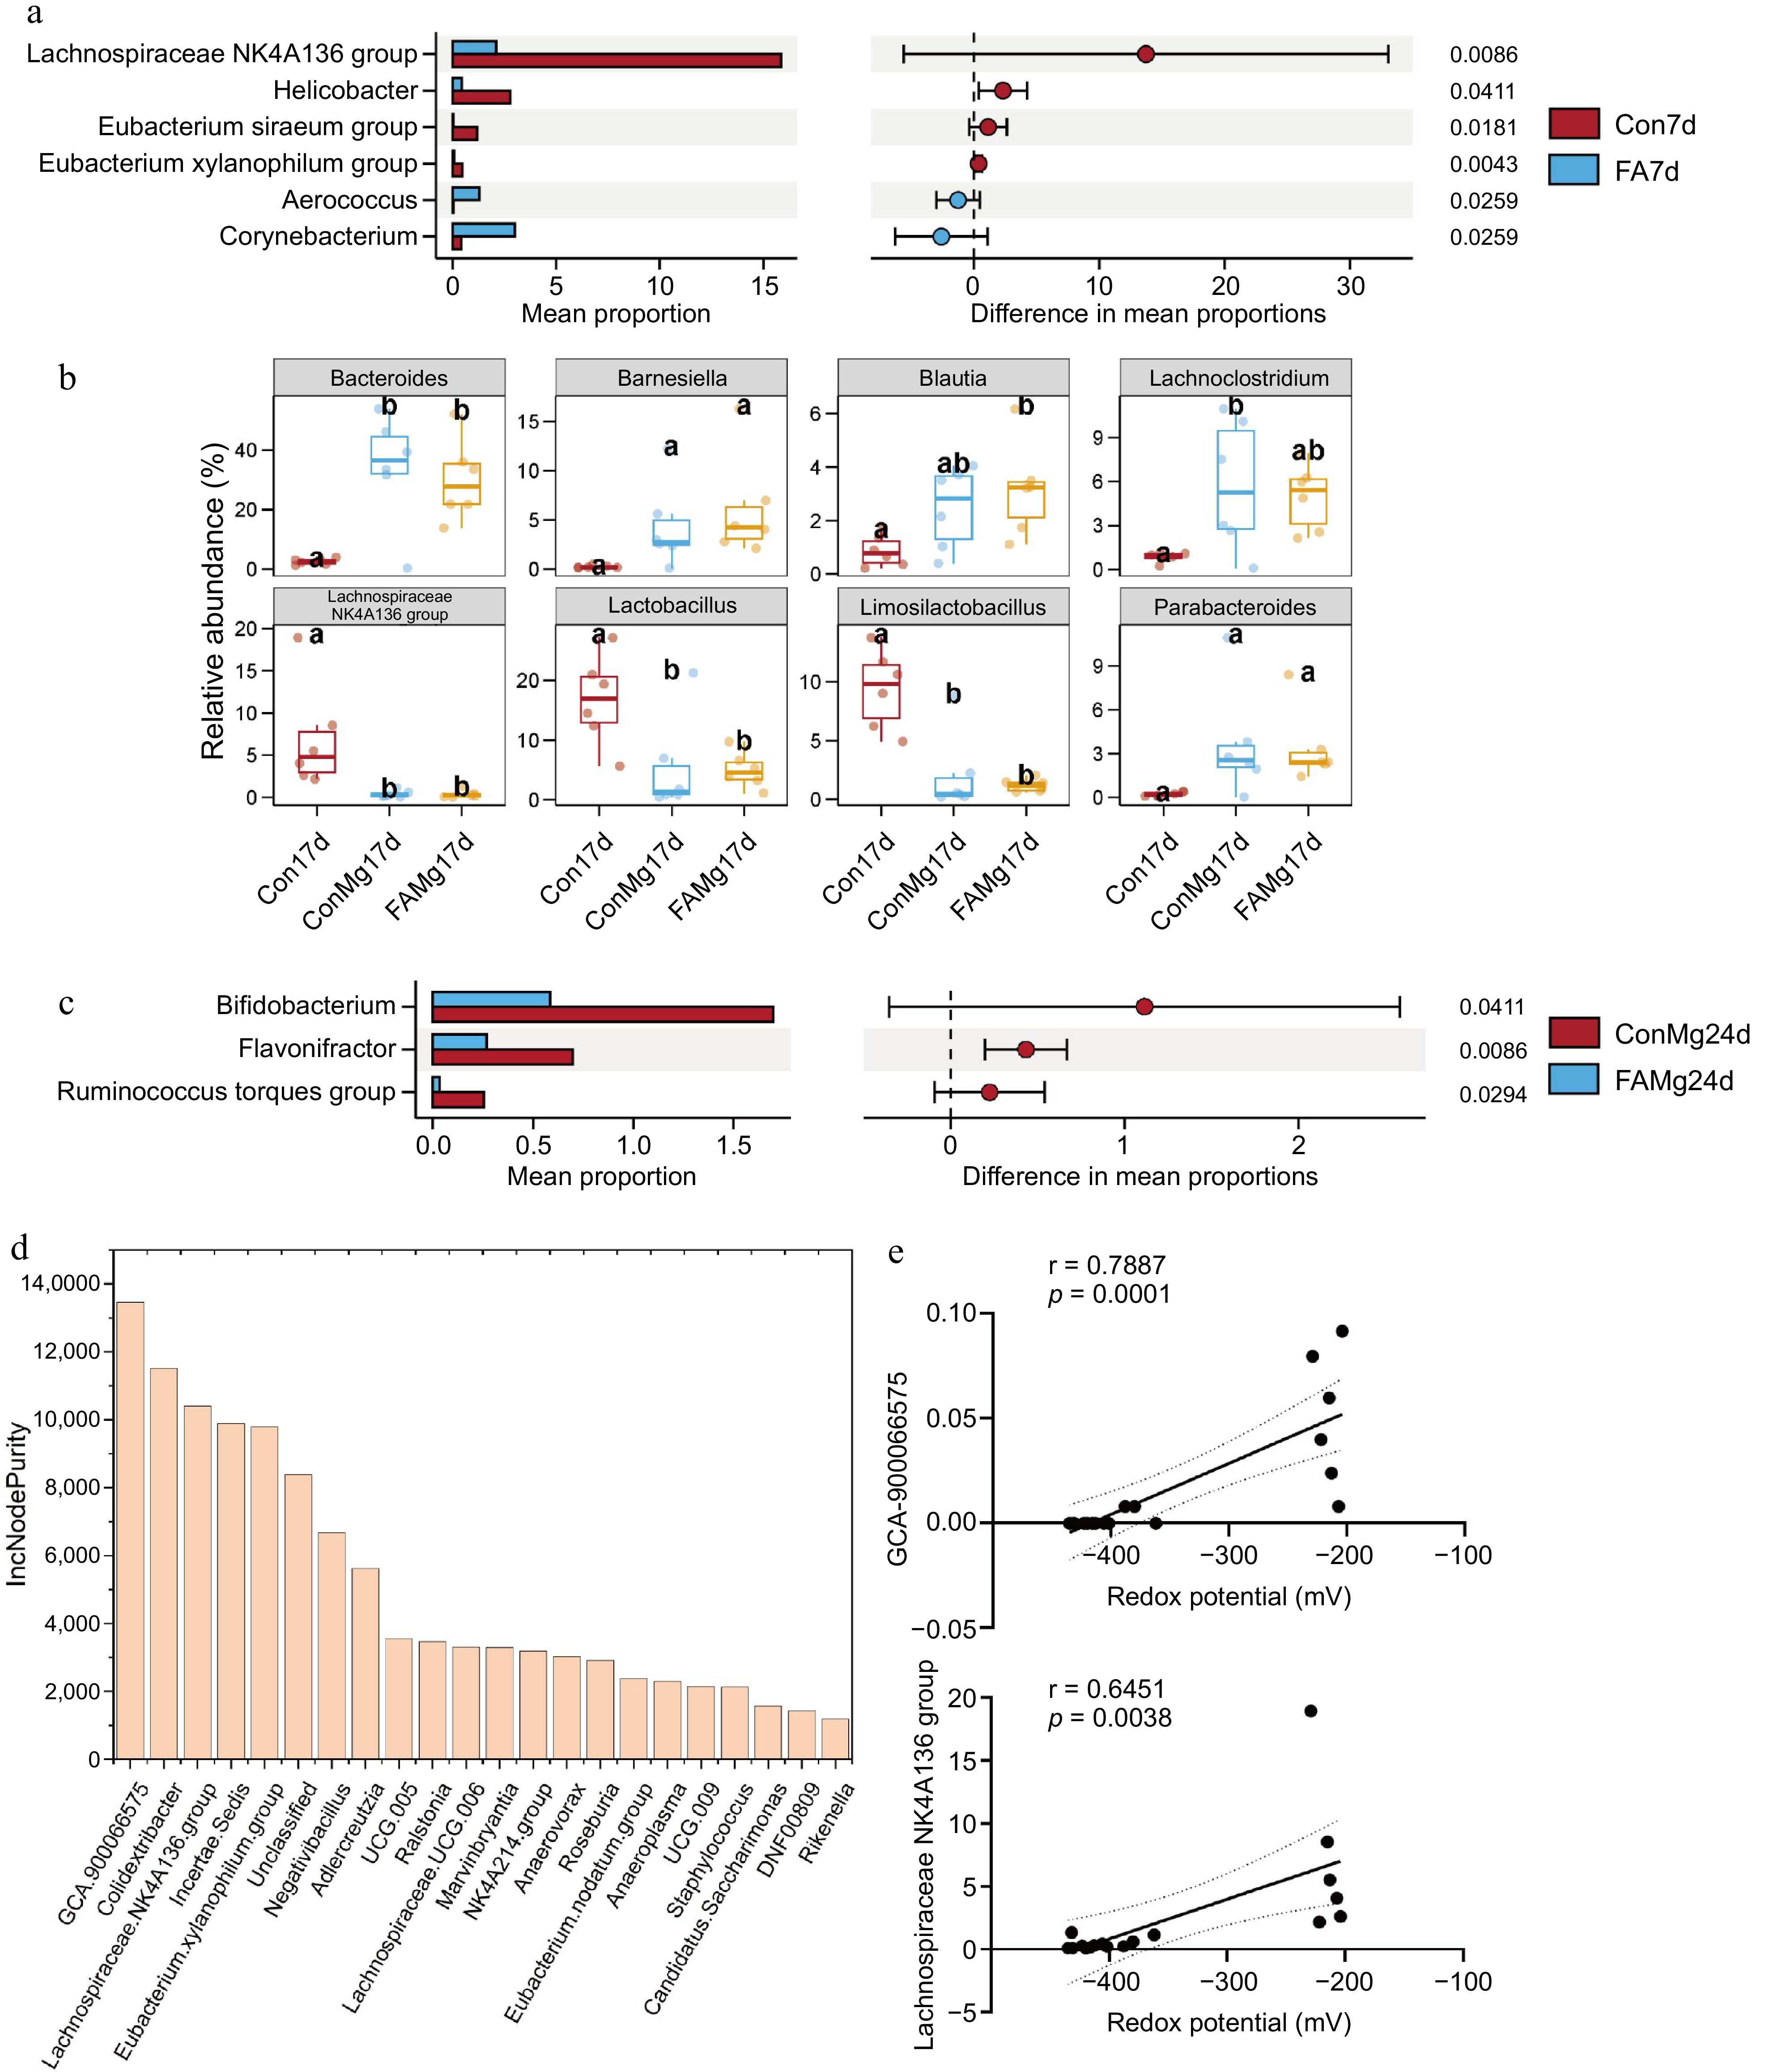
Figure 7.
Effects of FA on fecal microbiota at genus level by regulating redox potential. (a) Differential microbiota was analyzed using the Wilcoxon test in the balance period. (b) Statistical analysis on the top eight microbiota in the diarrhea period. Different letters on the column indicate significant differences, while the same letters indicate non-significant differences. (c) Differential microbiota was analyzed using the Wilcoxon test in the recovery period. (d) Significantly different microbiota was ranked in descending order of importance to redox potential prediction using random forest regression. (e) The correlation between GCA-900066575, Lachnospiraceae_NK4A136_group and redox potential. The random forest regression was calculated using the hmisc R package (v.4.5.0). Pearman's rho with asymptotic measure-specific P value between microbiota and redox potential and p < 0.05 was used to identify a significant correlation.
Figures
(7)
Tables
(0)