-
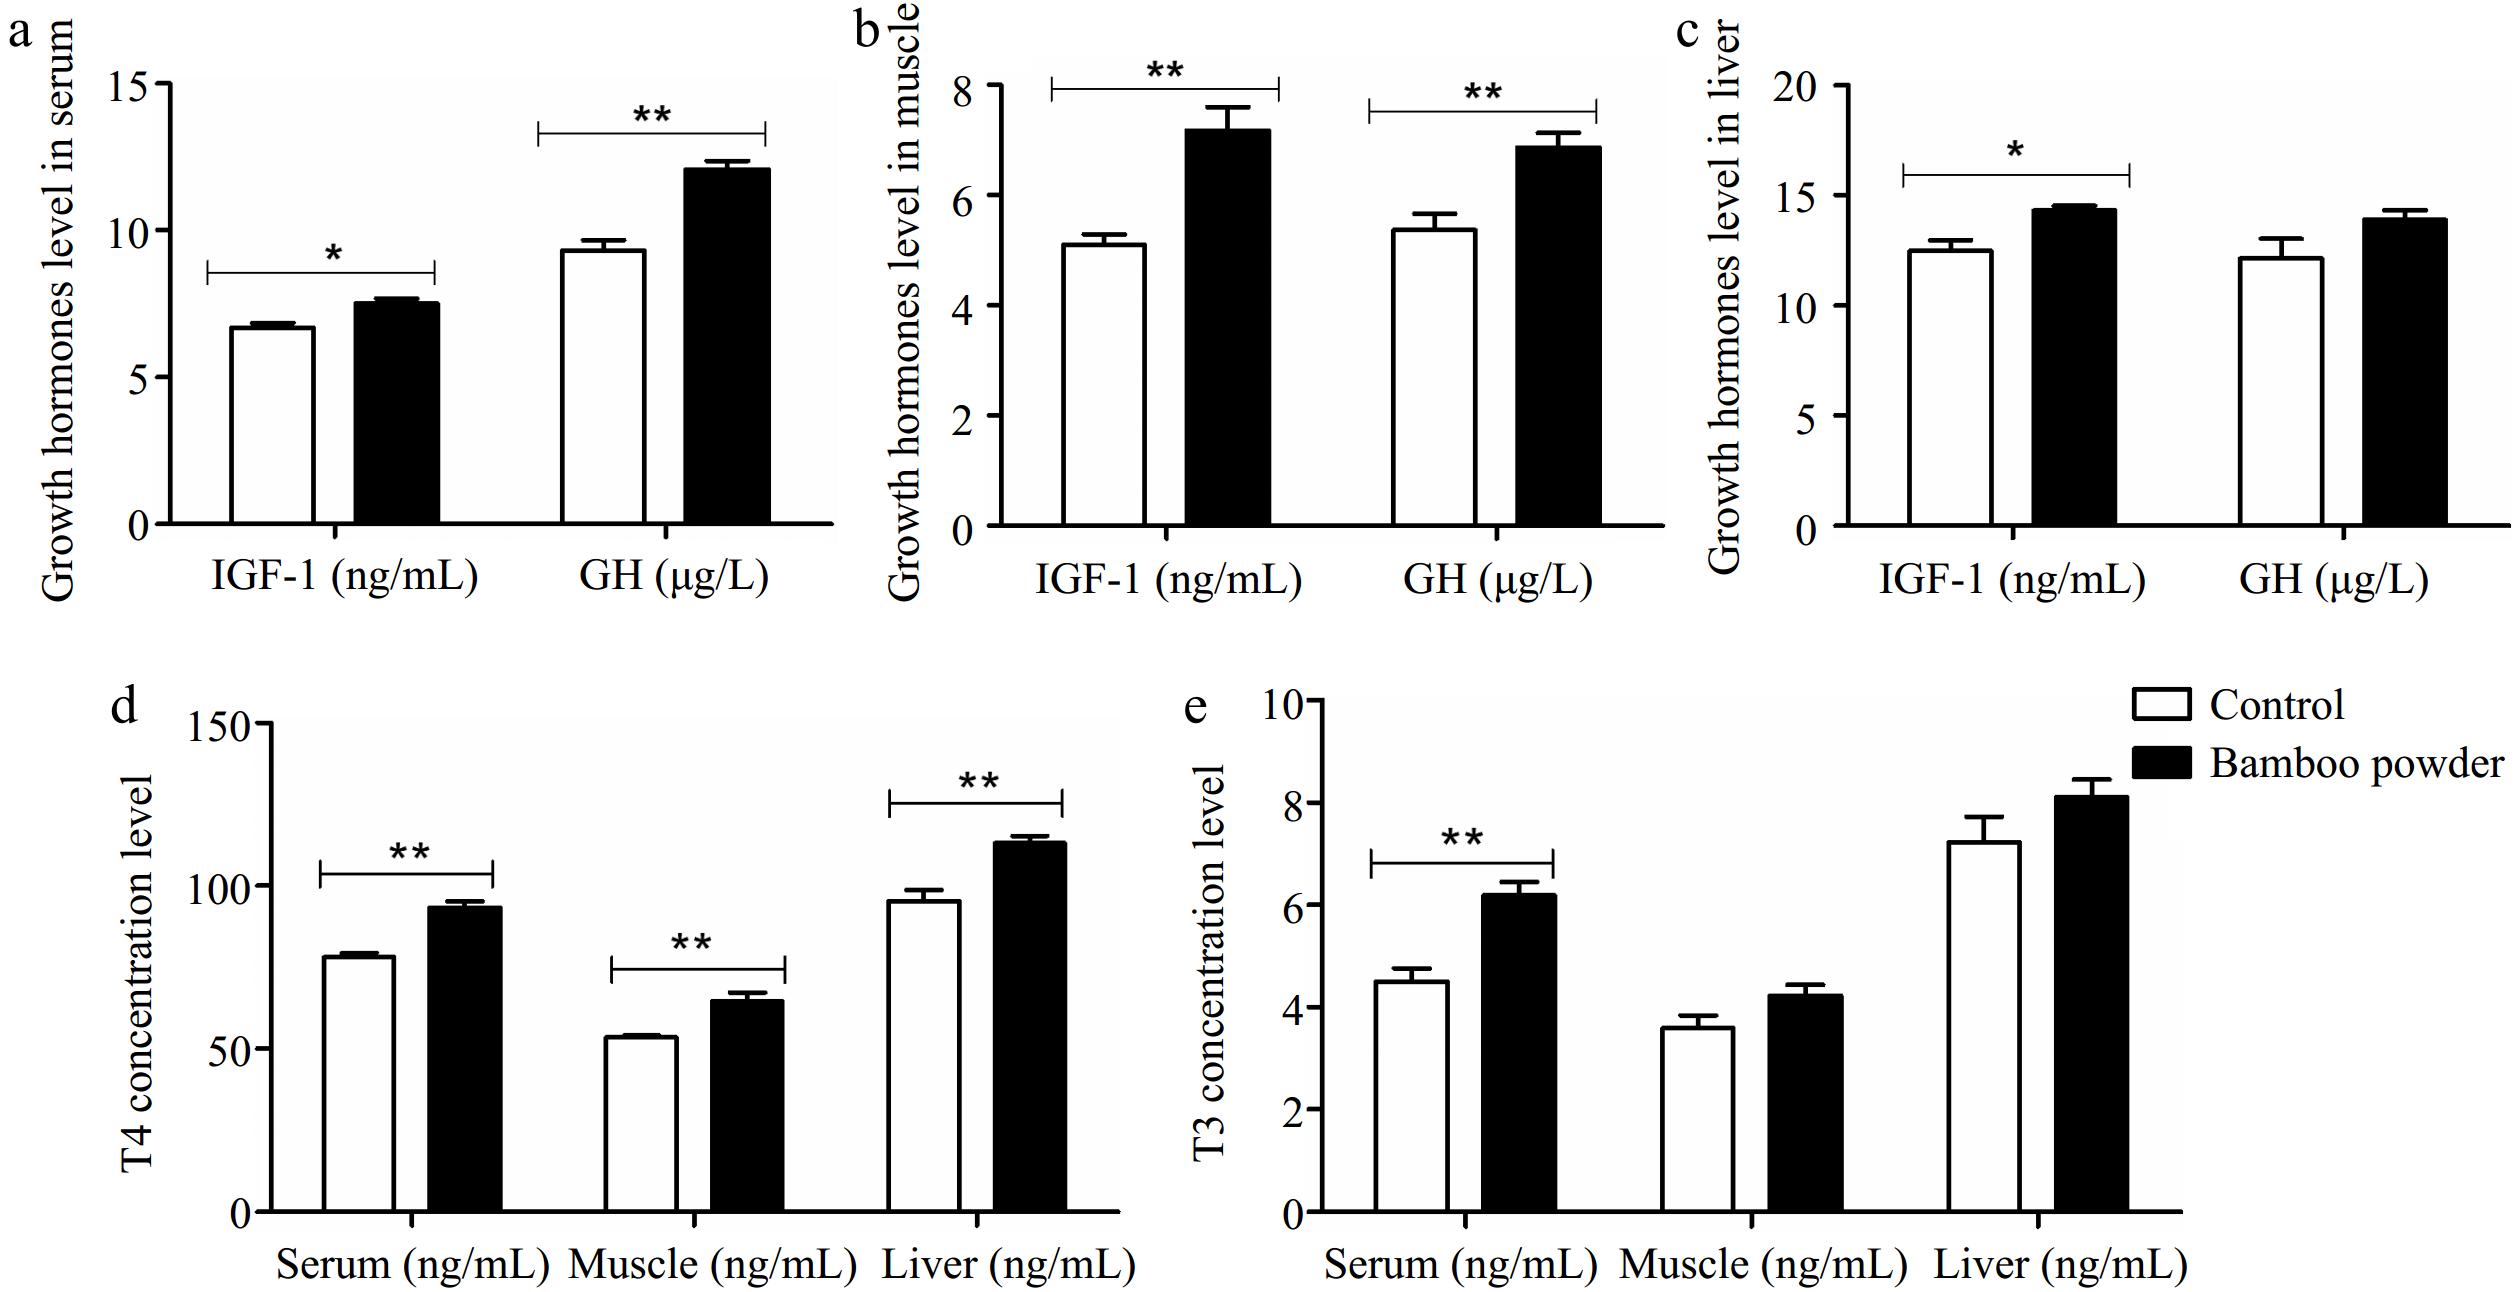
Figure 1.
Impact of FBP supplementation on growth and thyroid hormone concentrations. The figure illustrates the effects of FBP supplementation on growth and thyroid hormone concentrations in yellow-feathered broiler chickens (n = 10). The figure comprises five panels: (a) growth hormone levels in serum, (b) growth hormone levels in muscle, (c) growth hormone levels in liver, (d) thyroxine (T4) levels across serum, muscle, and liver, and (e) triiodothyronine (T3) levels across serum, muscle, and liver. The bar graphs display the mean values for each variable, with error bars representing the standard error of the mean. Statistical significance is indicated by asterisks (* and **), denoting different significance levels (p < 0.05). The experiment's results reveal that FBP supplementation significantly elevated growth and thyroid hormone concentrations in the serum, muscle, and liver tissues of yellow-feathered broiler chickens.
-
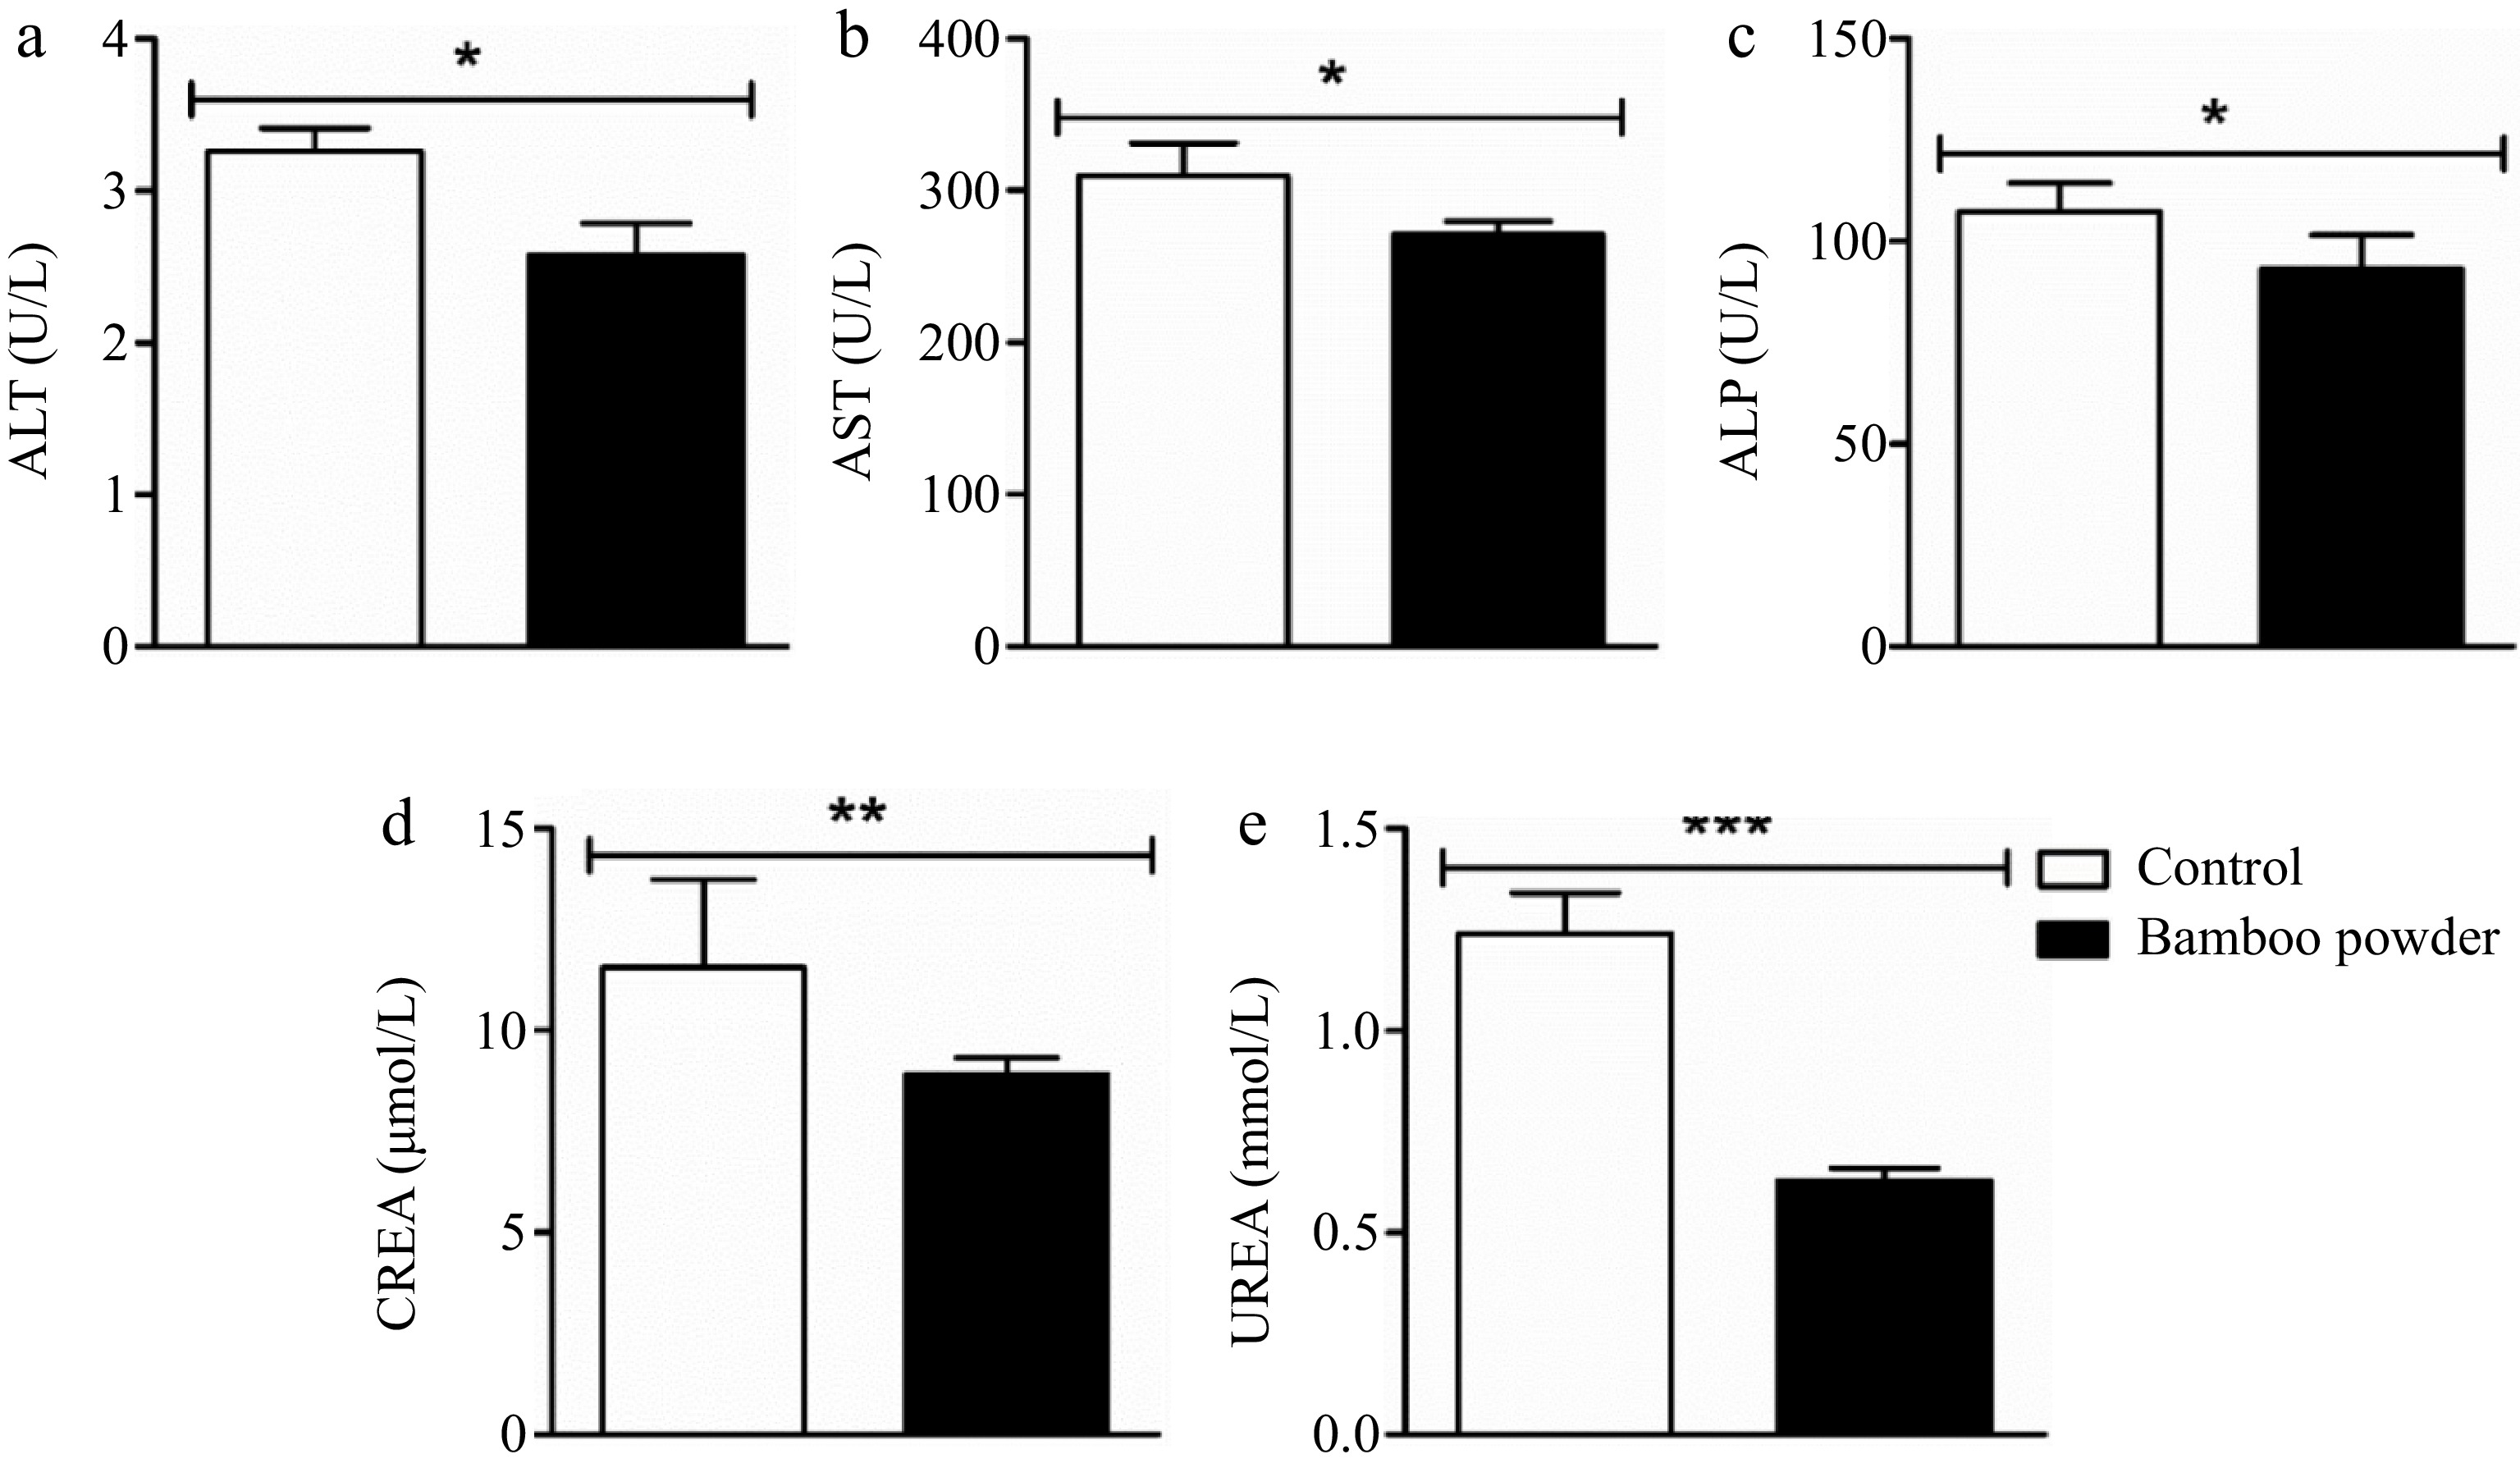
Figure 2.
Impact of FBP on serum biochemical indexes. The figure provides a comprehensive analysis of the effects of FBP supplementation on serum biochemical indices in Yellow-Feathered Broiler Chickens (n = 10). The parameters examined include (a) ALT (U/L), (b) AST (U/L), (c) ALP (U/L), (d) CREA (nmol/L), and (e) UREA (nmol/L). The bar graphs depict the mean values for each parameter, with error bars representing the standard error of the mean. Statistical significance between groups is indicated by symbols (*, **, ***), with the specific number of asterisks corresponding to different levels of significance (p < 0.05).
-

Figure 3.
Effects of FBP on antioxidant genes expression. The figure illustrates the expression levels of GPX1, SOD1, and CAT genes in (a) liver, and (b) heart tissues of broilers. The bar graphs represent the mean expression values, while the error bars indicate the standard error of the mean. Statistical significance is denoted by asterisks (*, **, ***), with * indicating p < 0.05, ** representing p < 0.01, and *** corresponding to p < 0.001, highlighting differences among the means.
-
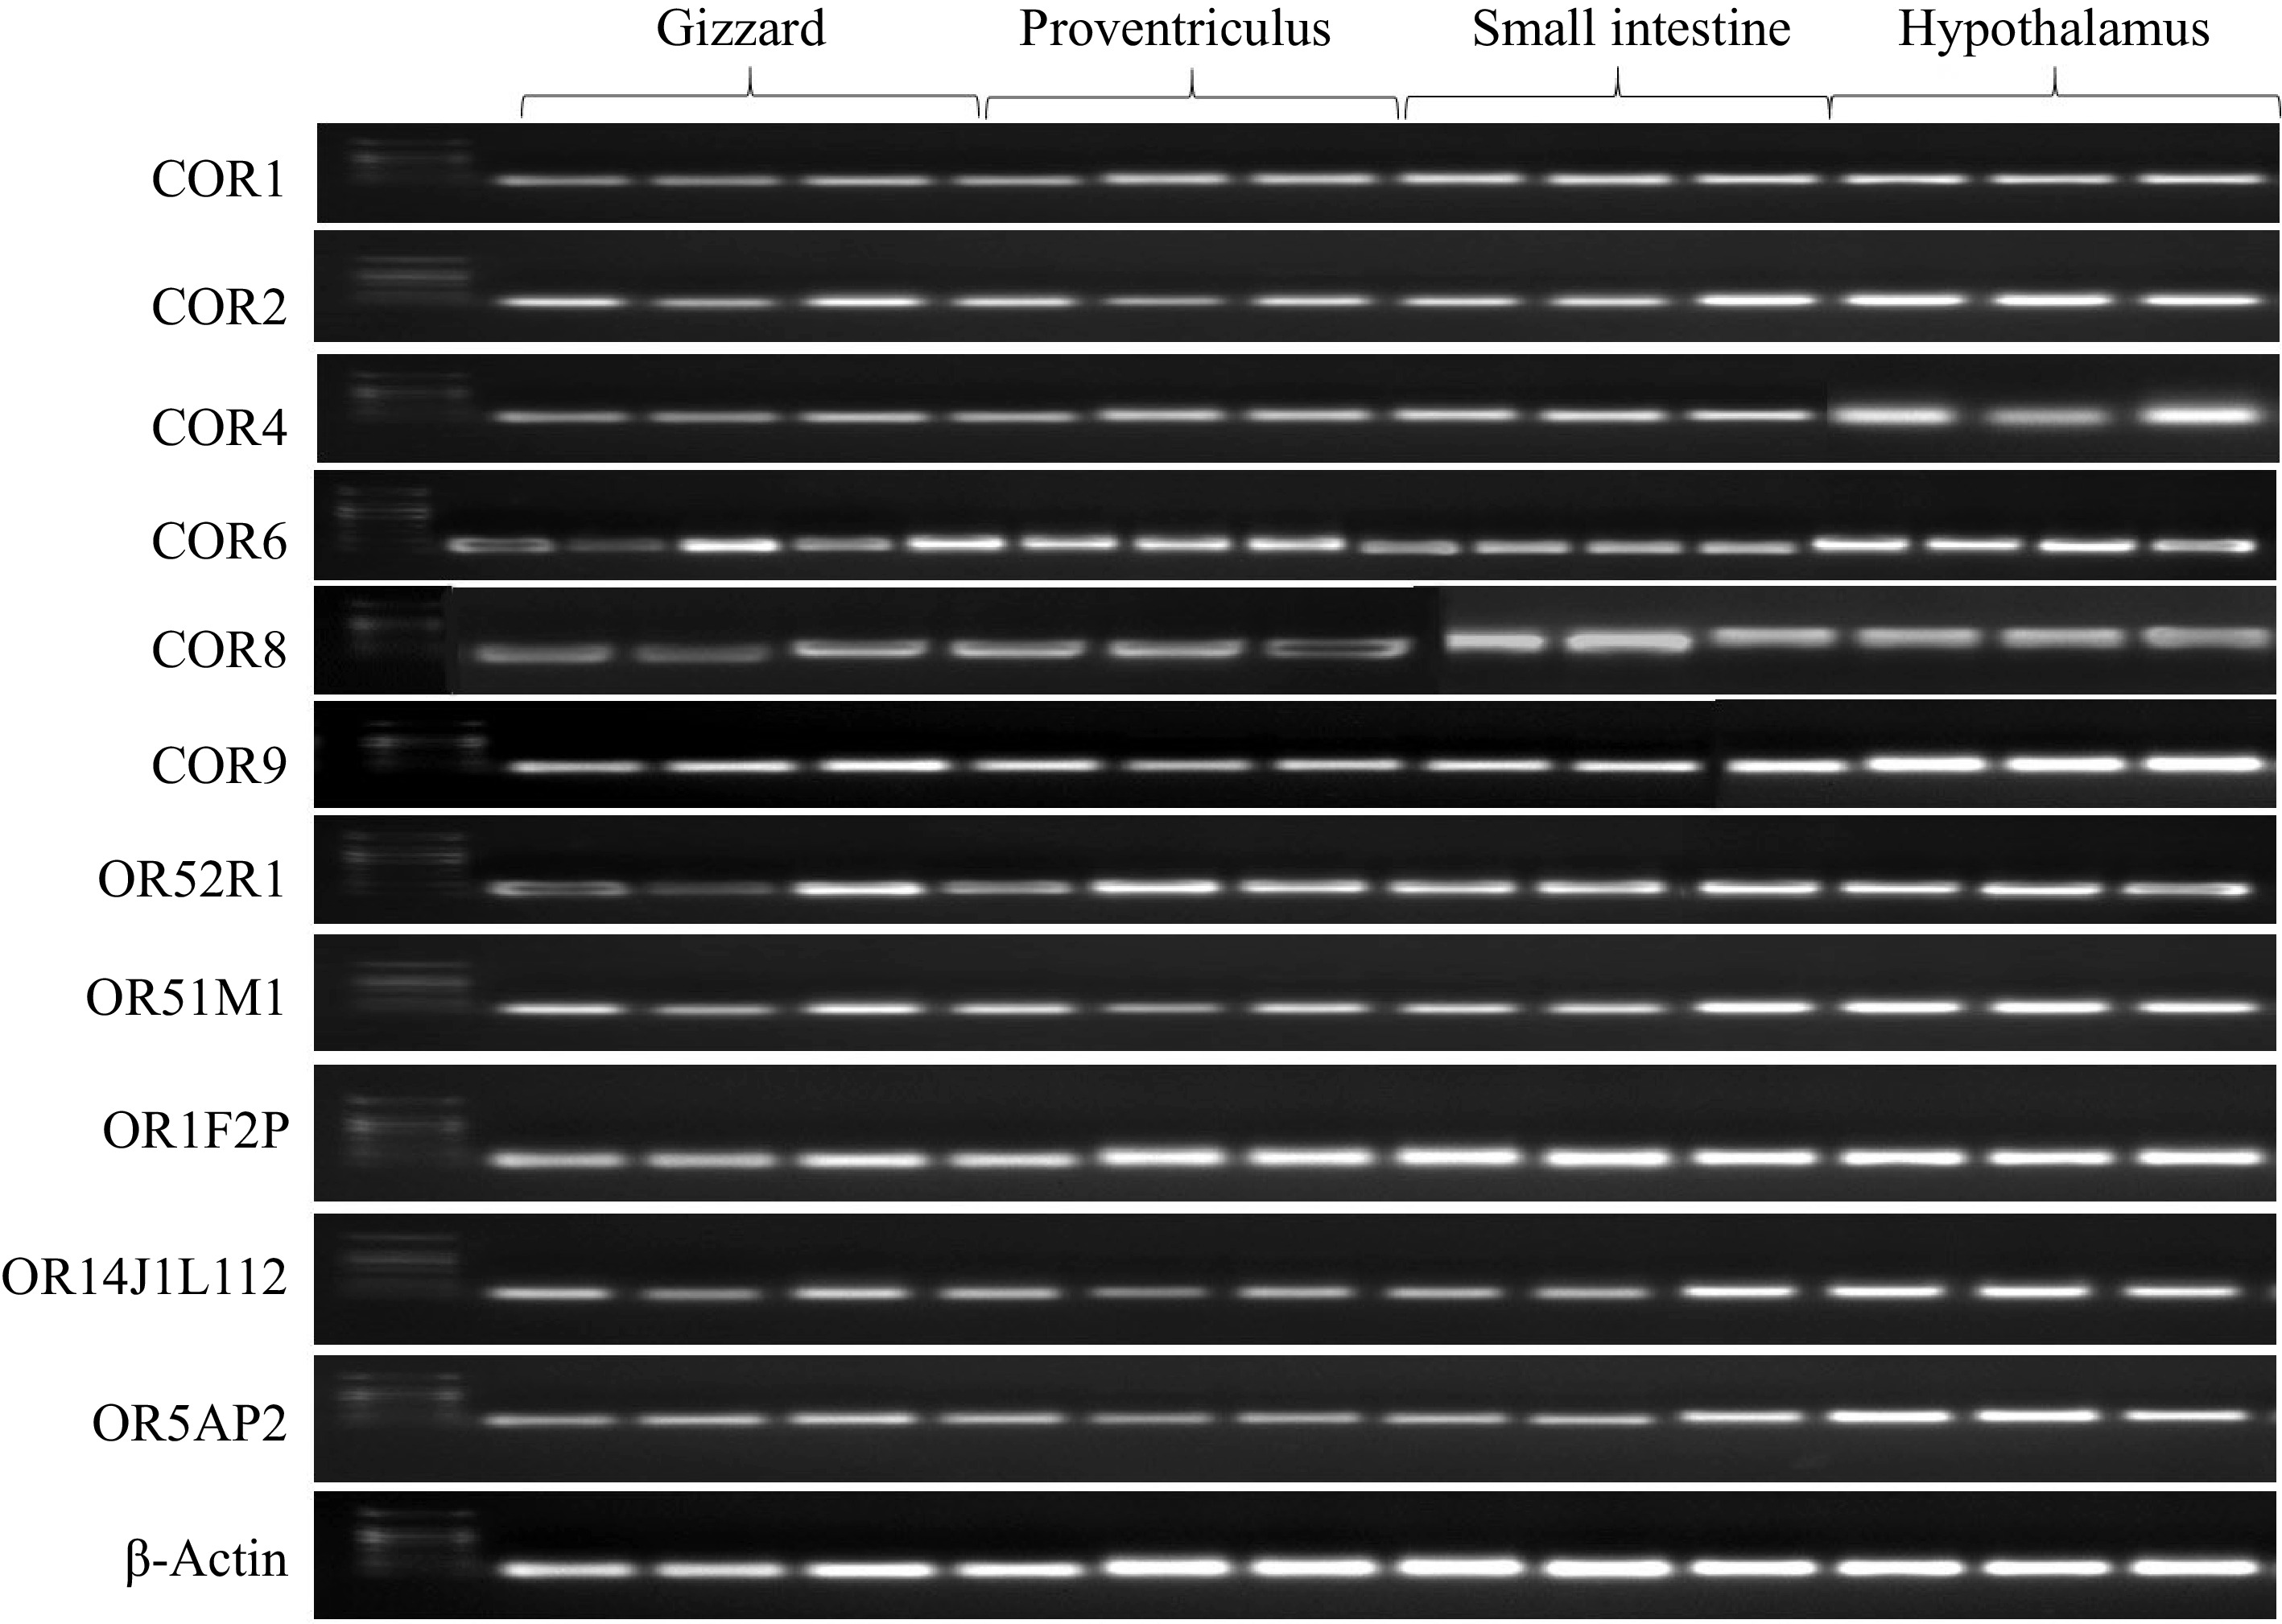
Figure 4.
Illustrates the tissue-specific expression patterns of odorant receptor genes, including COR1, COR2, COR4, COR6, OR14J1L112, OR5AP2, COR8, COR9, OR52R1, OR51M1, and OR1F2P, across various tissues such as the gizzard, proventriculus, small intestine, and hypothalamus. The analysis was conducted using RT-PCR, with cDNAs prepared from each tissue and gene-specific primers. PCR products were subjected to gel electrophoresis, and all observed bands corresponded to the expected sizes based on the designed primers.
-
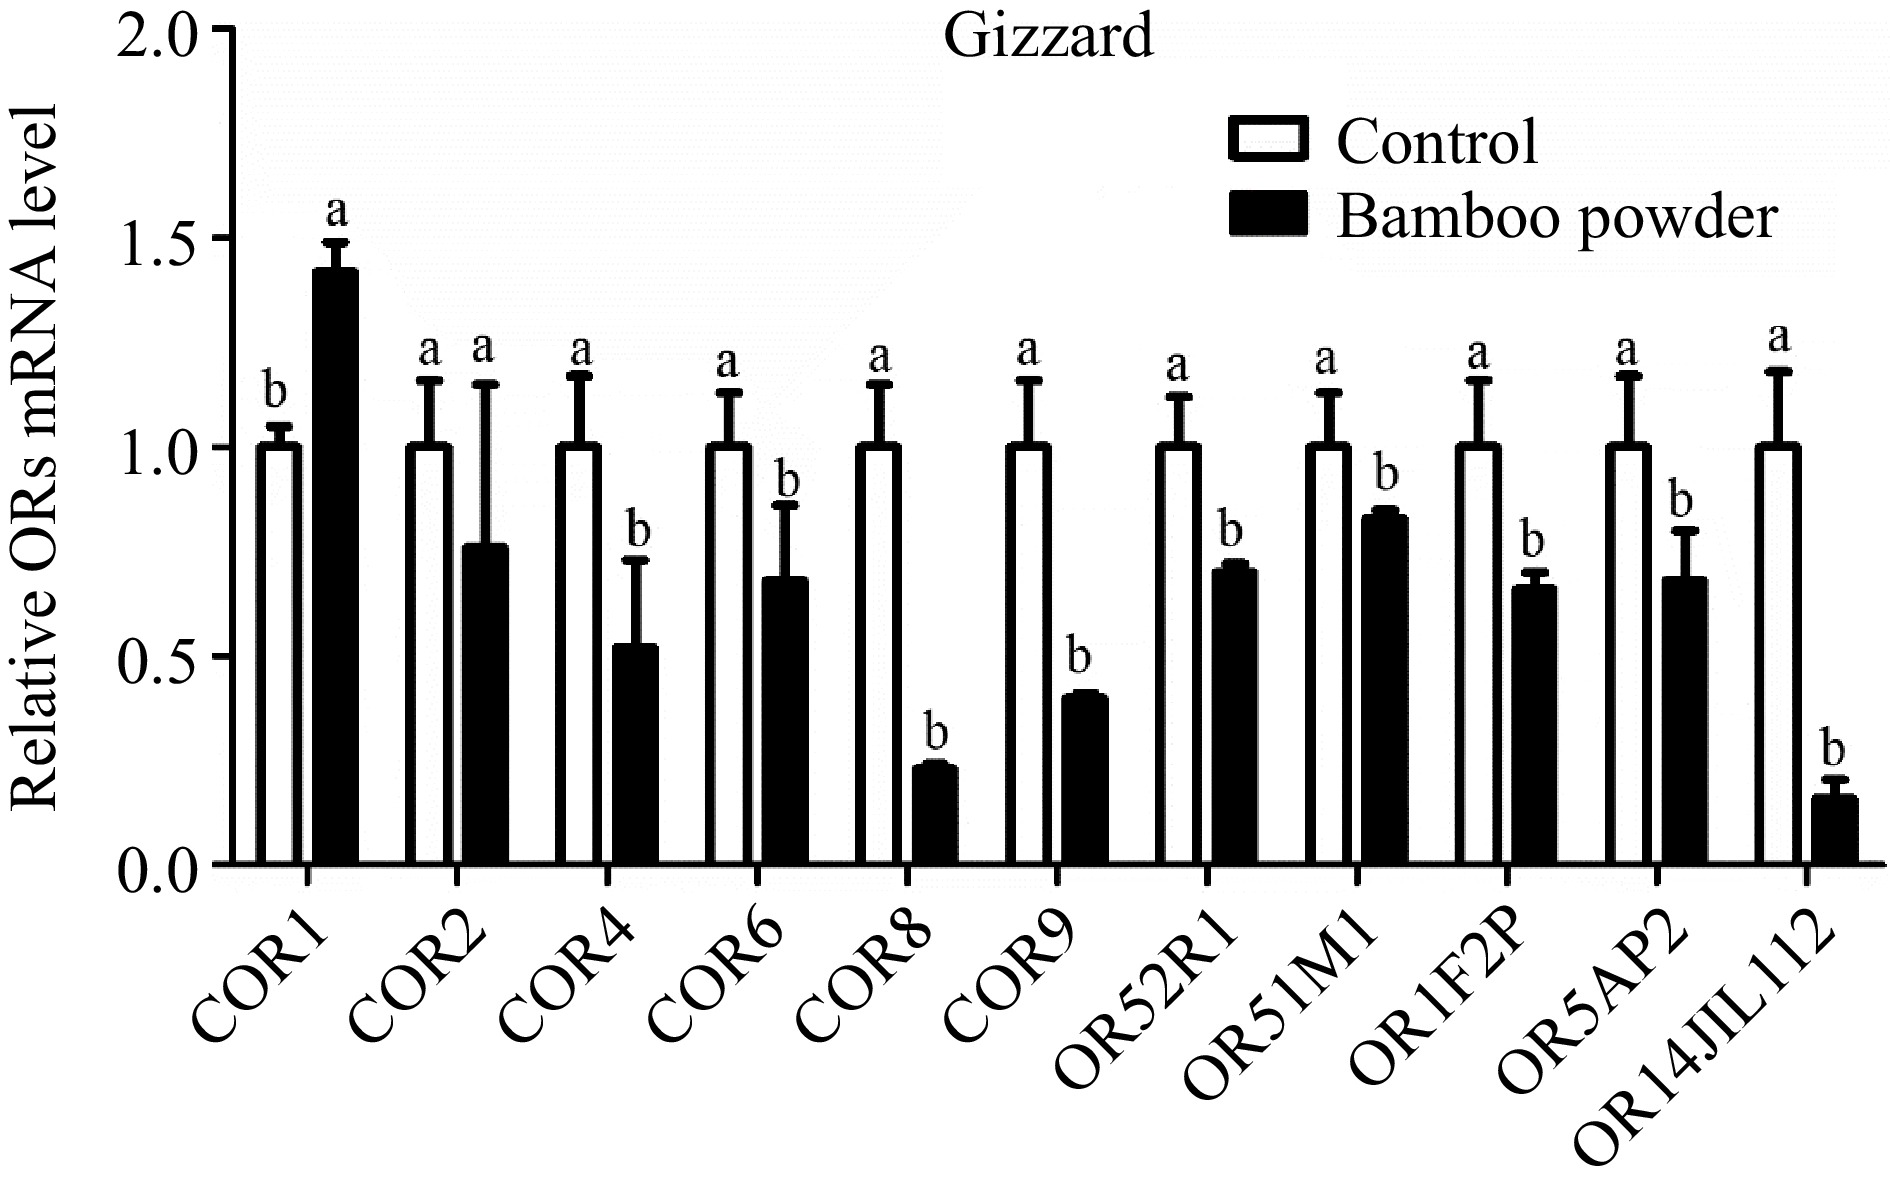
Figure 5.
Shows the qPCR expression levels of OR genes in the gizzard tissue of yellow broilers. For accurate comparison, expression values were normalized against control data from the same samples. The letters in the figure represent significant differences: 'a' indicates higher expression levels, while 'b' denotes lower expression levels. The bar graphs display the mean values, with error bars representing the standard error of the mean. Statistical significance at p < 0.05 is indicated by the letters 'a' and 'b' highlighting differences among the means.
-
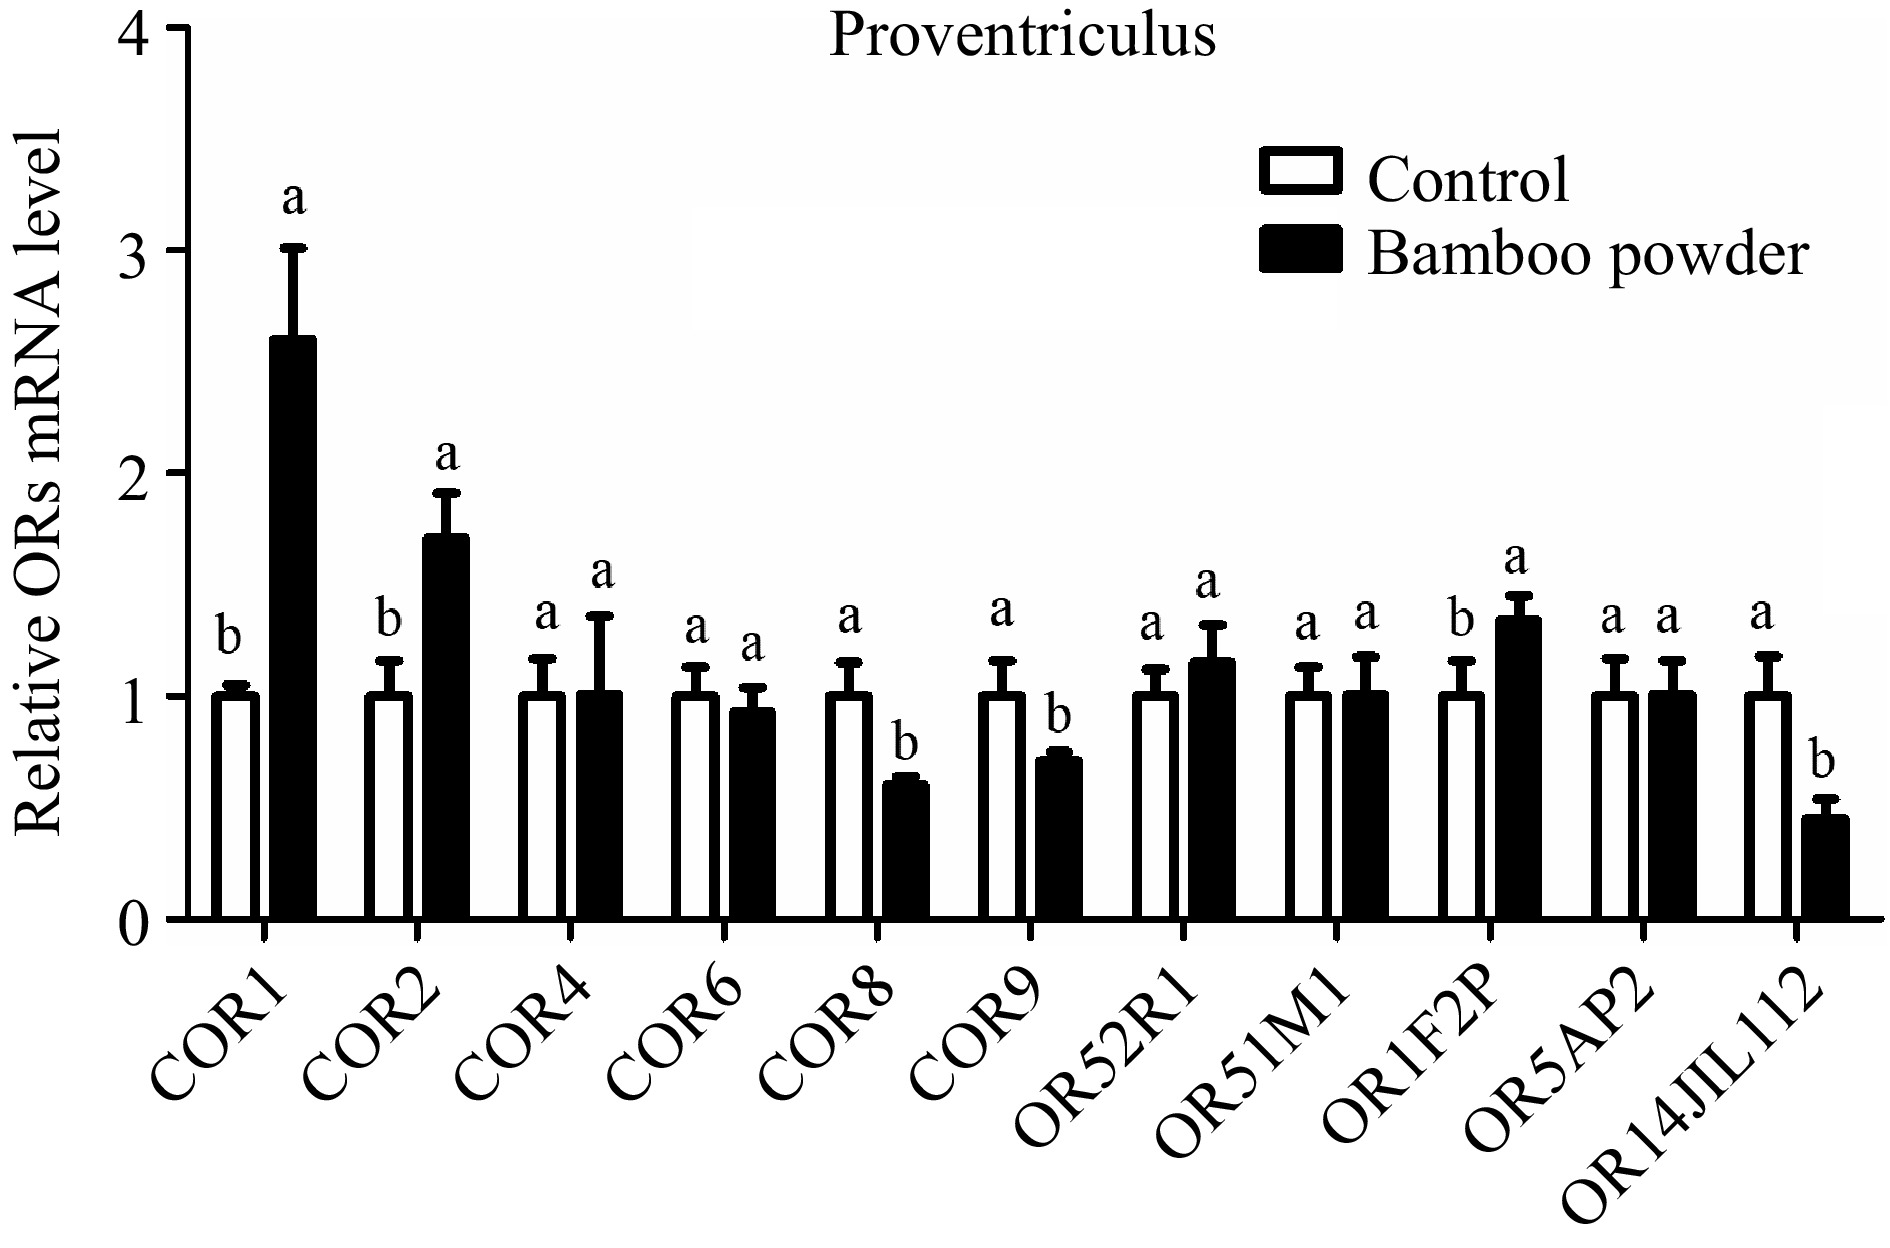
Figure 6.
Illustrates the qPCR expression levels of OR genes in the proventriculus tissue of Yellow broilers. The expression values were normalized against control data from the same samples to ensure accurate comparison. Significant differences are denoted by letters: 'a' indicates significantly higher expression, while 'b' represents significantly lower expression. The bar graphs display the mean values, with error bars reflecting the standard error of the mean. Statistical significance, determined at p < 0.05, is indicated by the letters 'a' and 'b' highlighting differences among the means.
-
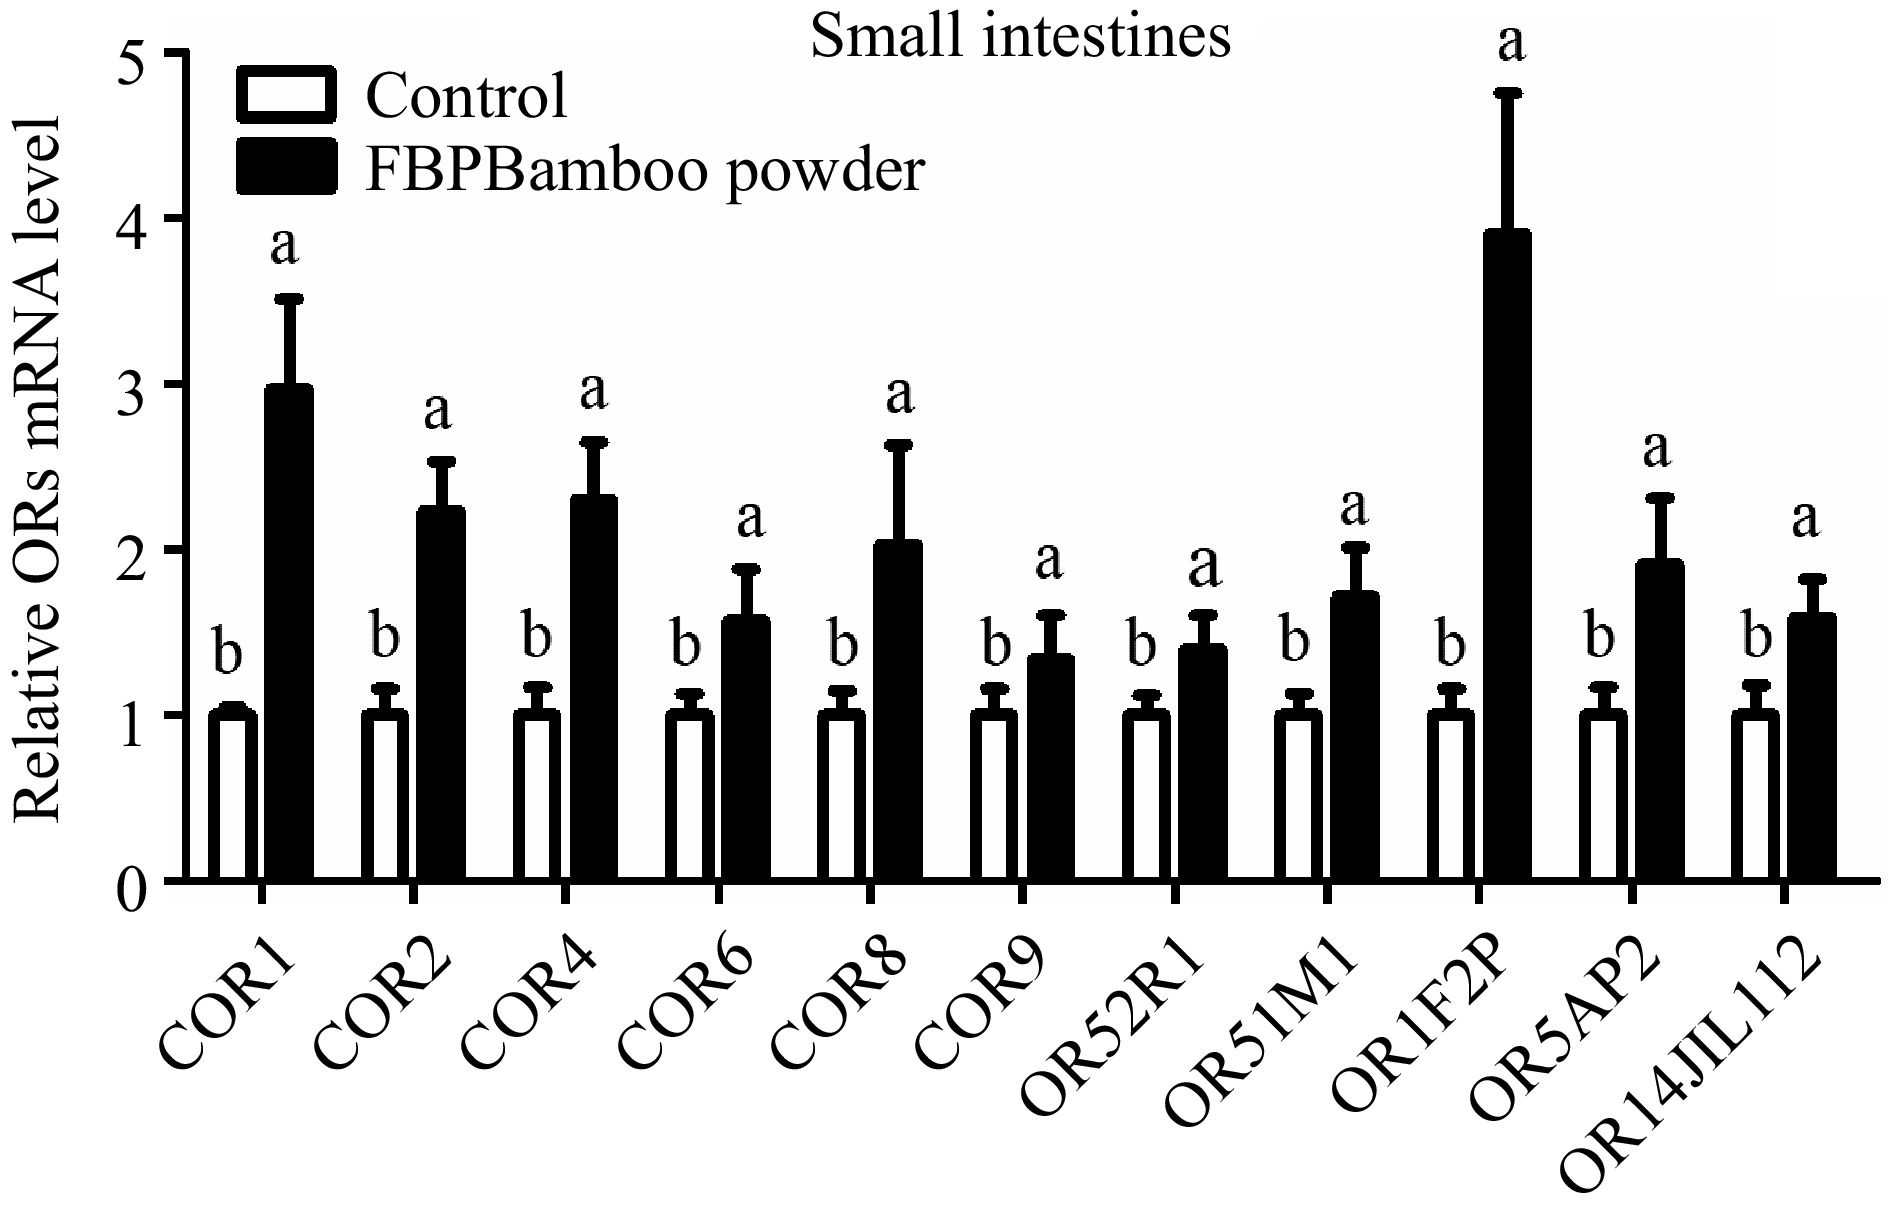
Figure 7.
Depicts the qPCR expression levels of OR genes in the small intestine tissue of yellow broilers. The expression values were normalized against control data from the same samples to ensure accurate comparisons. Significant differences are indicated by letters: 'a' represents higher expression levels, while 'b' denotes lower expression. The bar graphs display the mean values, with error bars reflecting the standard error of the mean. Statistical significance is denoted by the letters 'a' and 'b' at a threshold of p < 0.05, highlighting differences among the means.
-
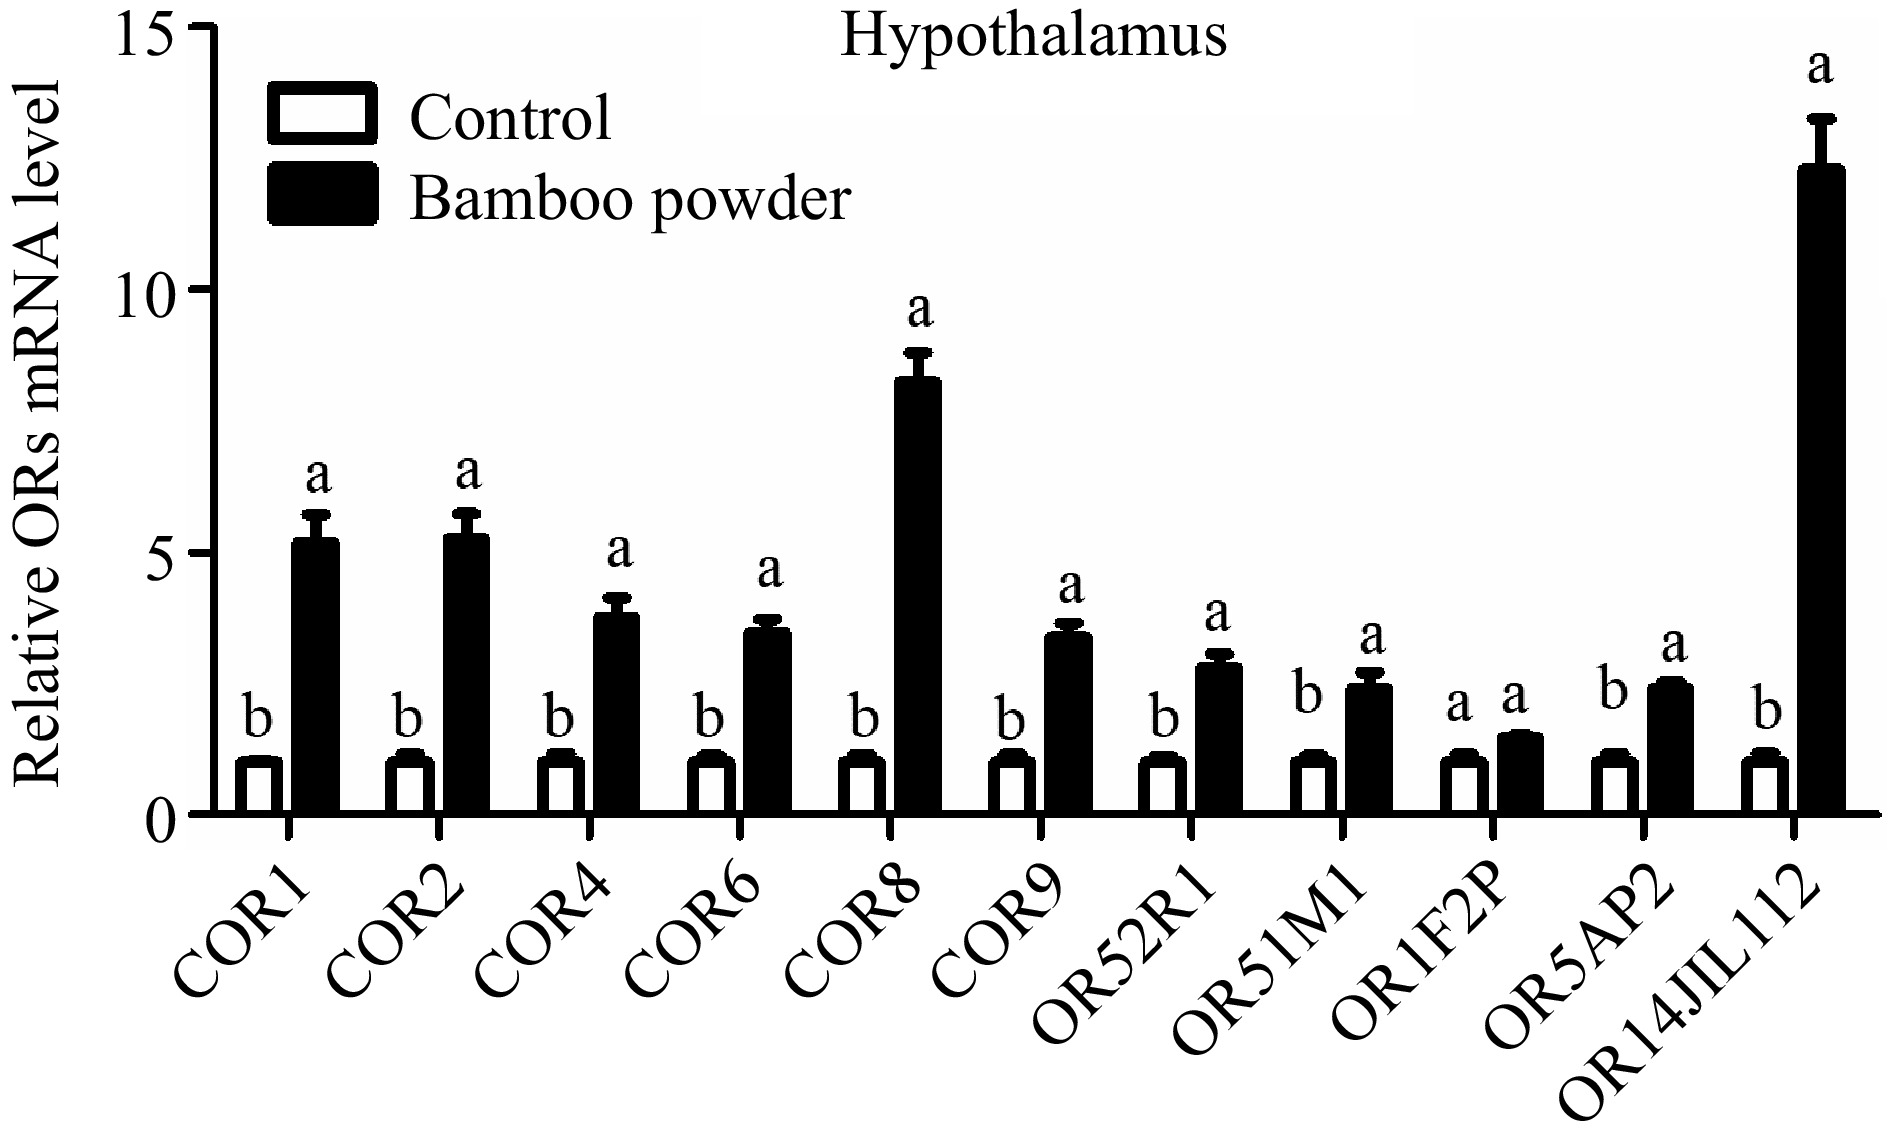
Figure 8.
Illustrates the qPCR expression levels of OR genes in the hypothalamus tissue of yellow broilers. The expression values were normalized against control data from the same samples to ensure accurate comparisons. Different letters in the figure indicate significant differences: 'a' represents higher expression levels, while 'b' indicates lower expression. The bar graphs depict the mean values, with error bars representing the standard error of the mean. Statistical significance at p < 0.05 is denoted by the letters 'a' and 'b', highlighting differences among the means.
-
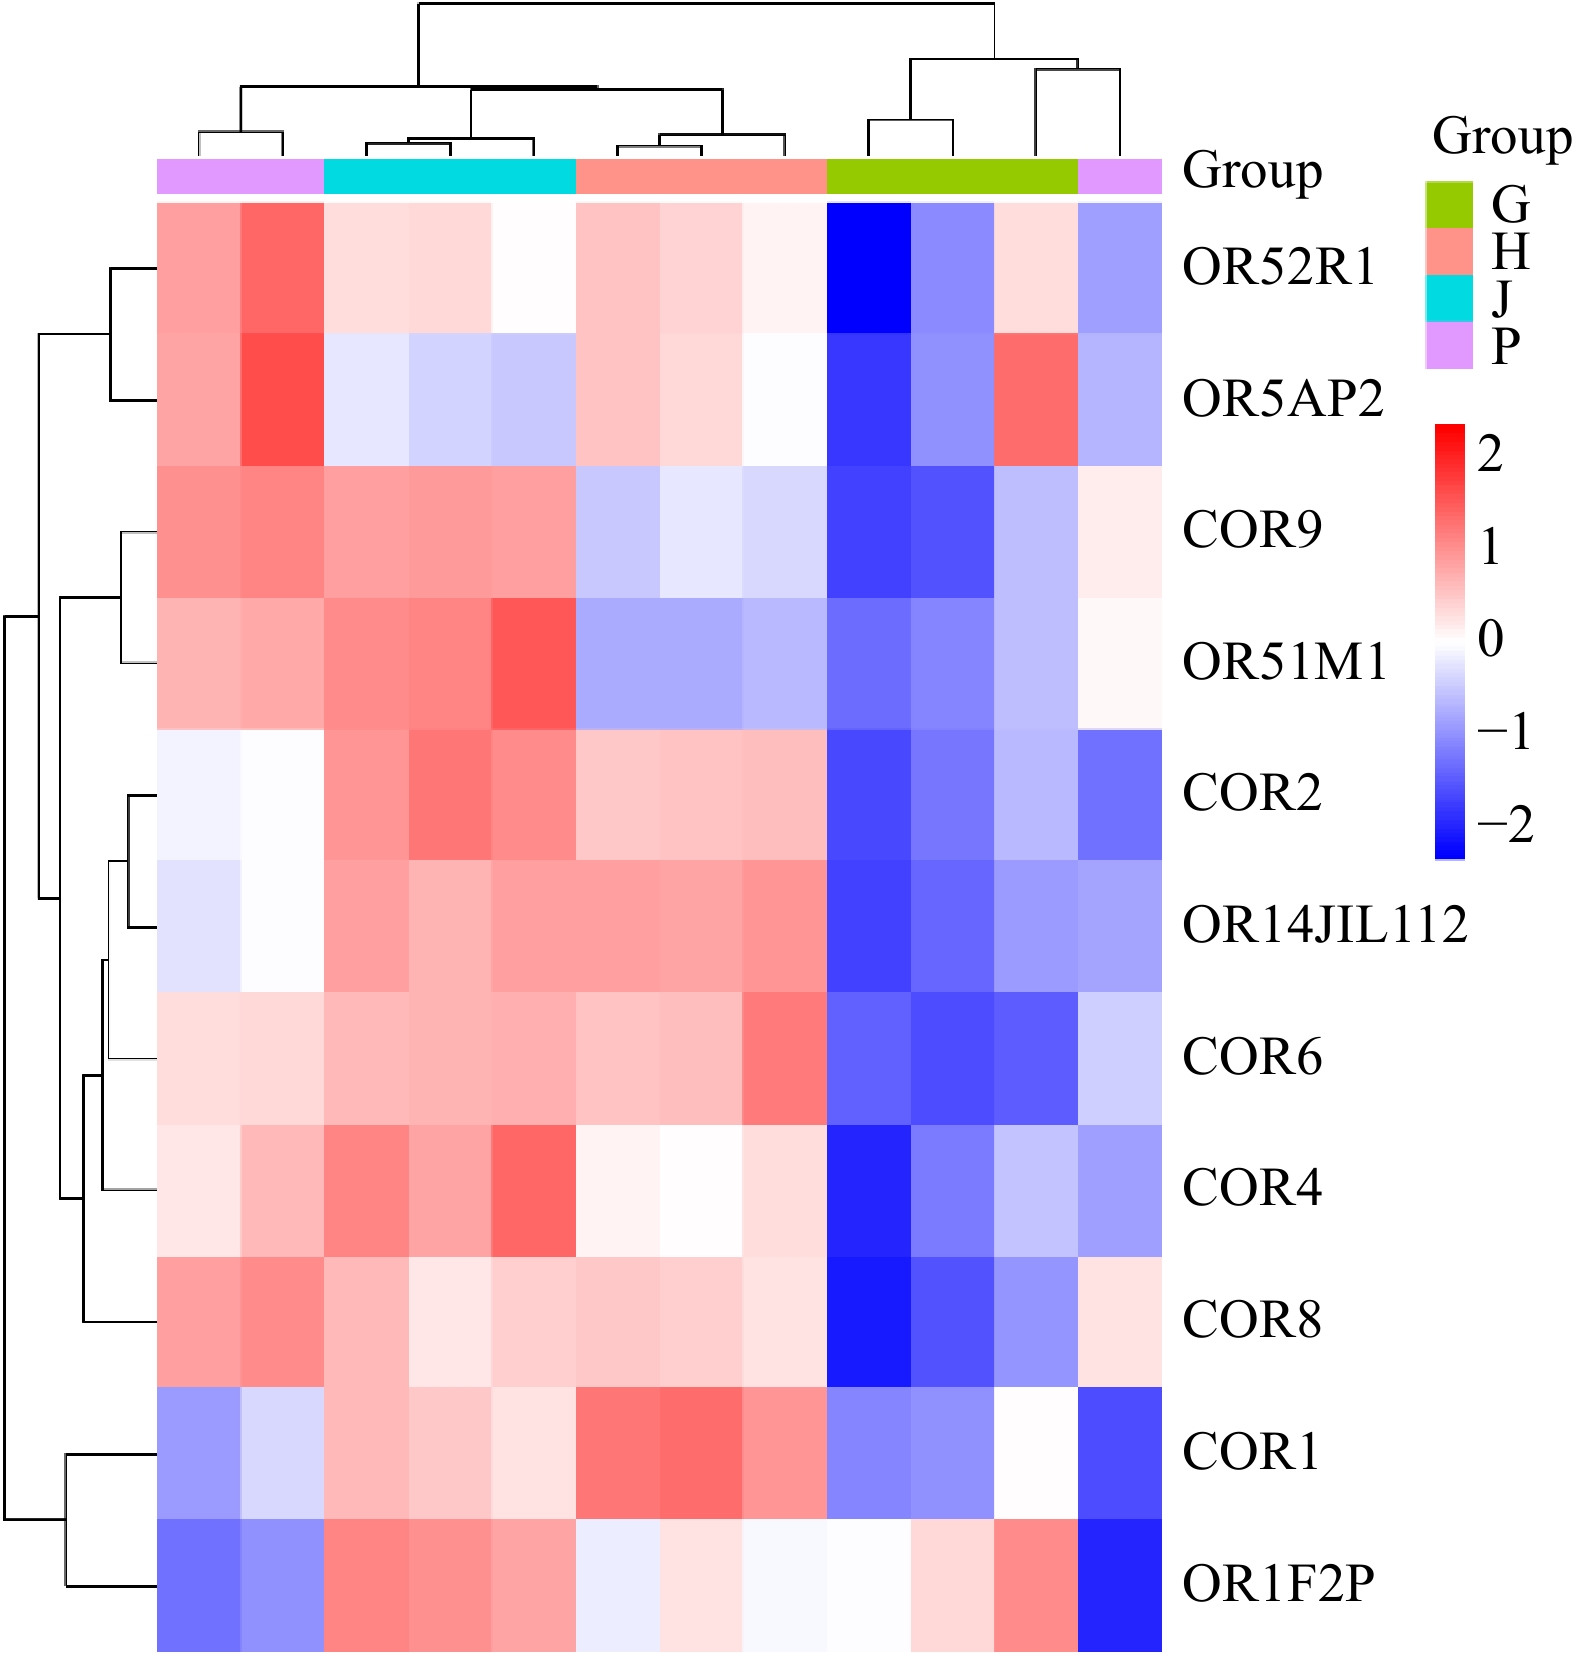
Figure 9.
Heatmap analysis of the samples across different organs samples. P: Proventriculus, G: Gizzard, J: Jejunum, H: Hypothalamus.
-
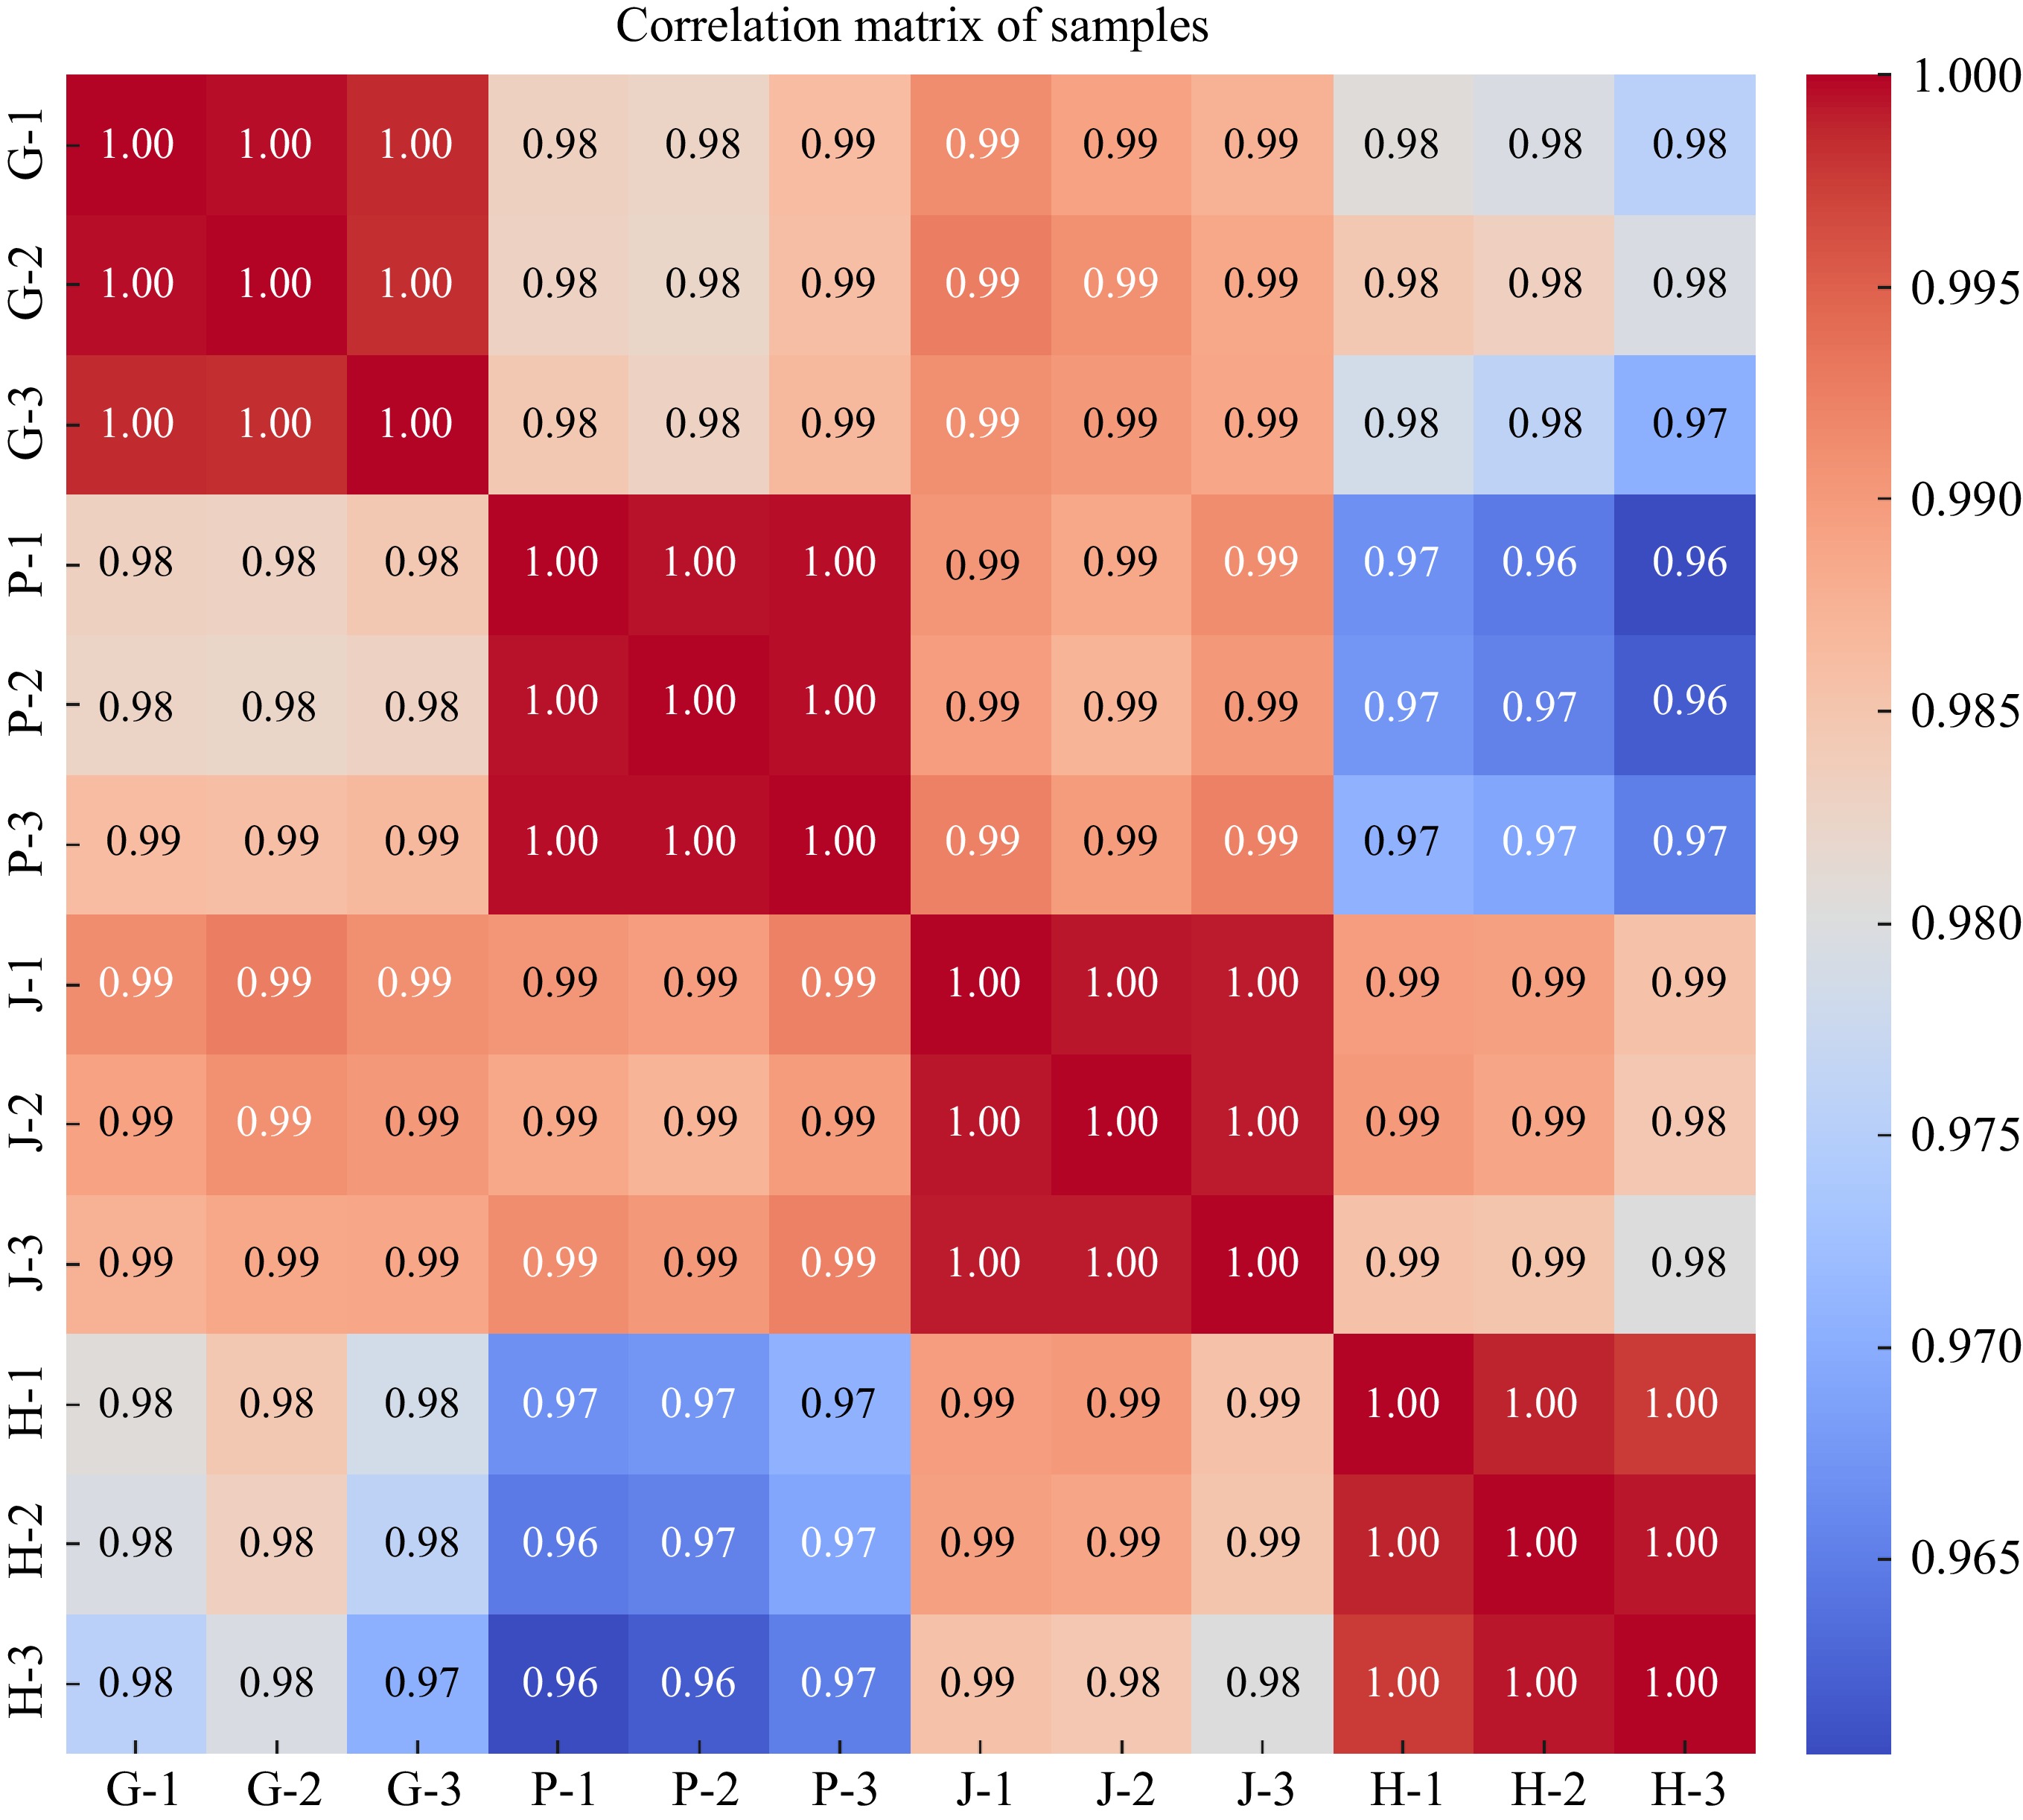
Figure 10.
The image displays the correlation matrix of the samples, represented as a heatmap. This heatmap visualizes the correlation coefficients between each pair of samples. The color gradient reflects the strength of the correlations, with values near 1 (red) indicating a strong positive correlation, while values closer to −1 (blue) represent a strong negative correlation. The samples are labeled as follows: P for Proventriculus, G for Gizzard, J for Jejunum, and H for Hypothalamus.
-

Figure 11.
Effects of FBP on immune-related gene expression. The figure presents a detailed analysis of the expression levels of IL-10, IL-2, and IL-6 genes in (a) liver, and (b) spleen of broilers. The bar graphs illustrate the mean values, with error bars representing the standard error of the mean. Statistical significance is indicated by asterisks (*, **), where * denotes p < 0.05 and ** denotes p < 0.01, reflecting differences among the means.
-
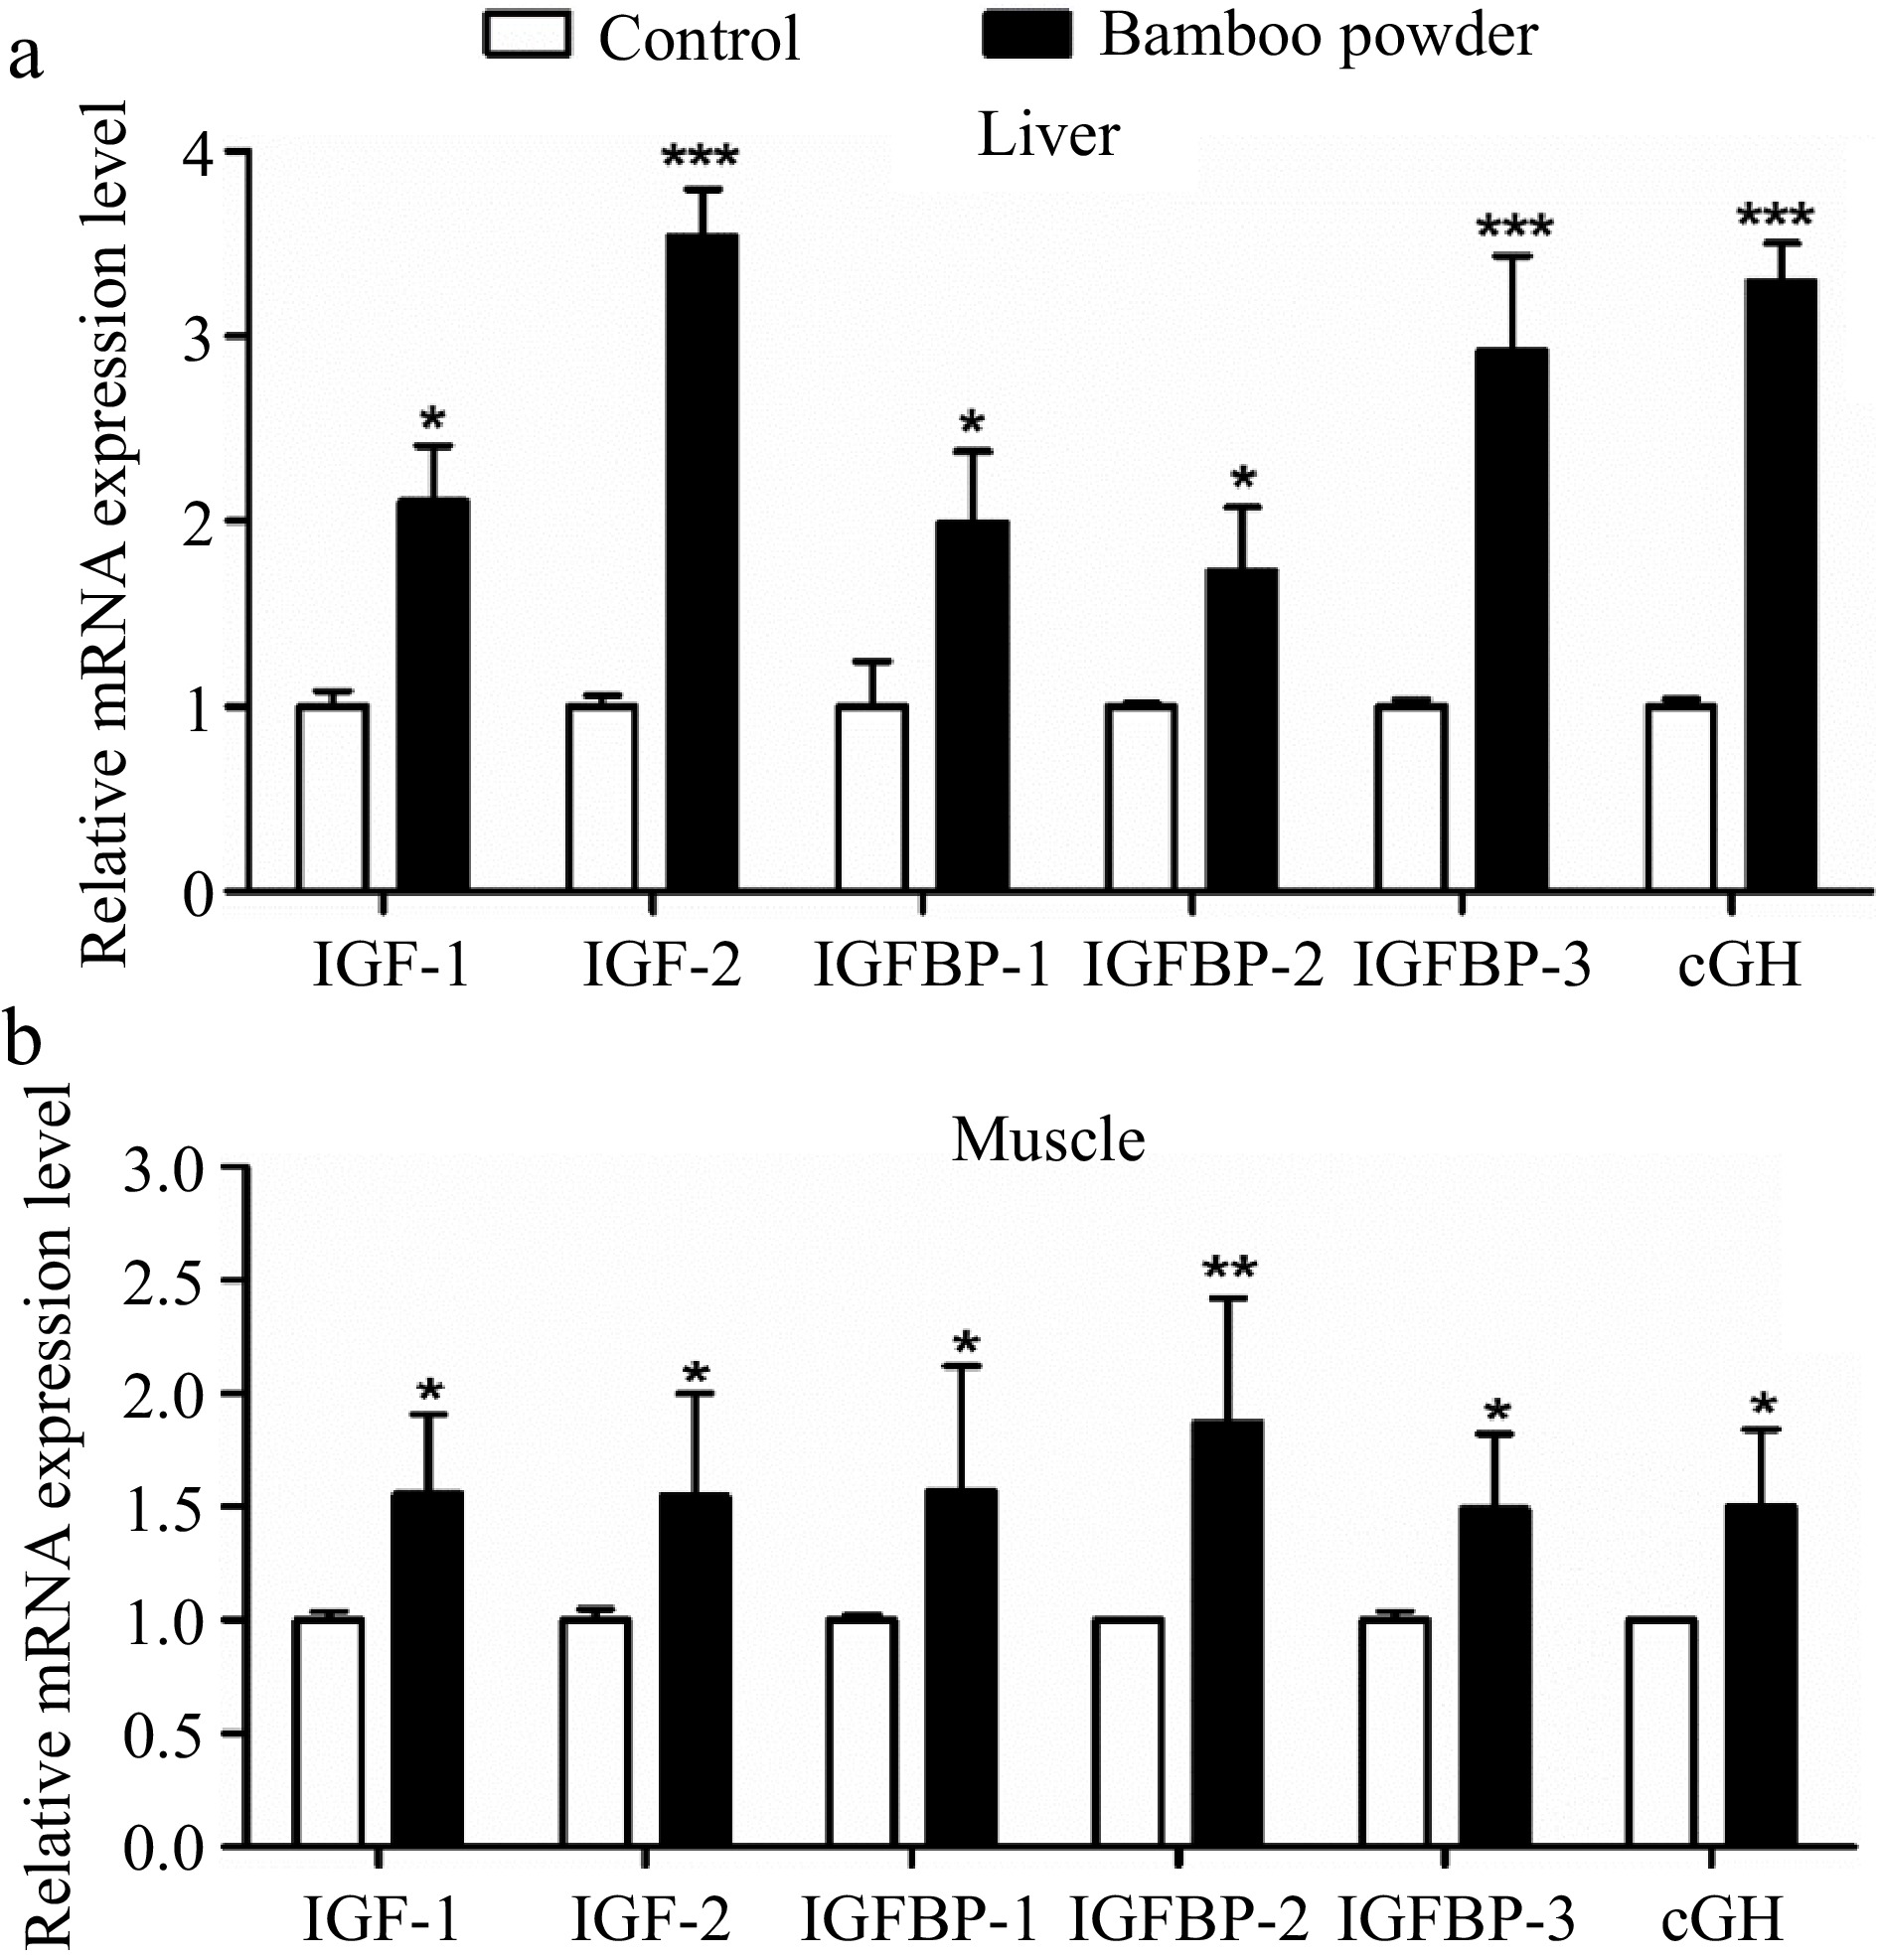
Figure 12.
Effects of FBP on growth-related gene expression. The figure presents a comprehensive analysis of the expression levels of IGF-1, IGF-2, IGFBP-1, IGFBP-2, IGFBP-3, and cGH genes in (a) liver, and (b) muscle of broilers. The bar graphs represent the mean values for each gene, with error bars displaying the standard error of the mean. Statistical significance is indicated by asterisks (*, **, ***), where * denotes p < 0.05, ** indicates p < 0.01, and *** represents p < 0.001, highlighting differences among the means.
-
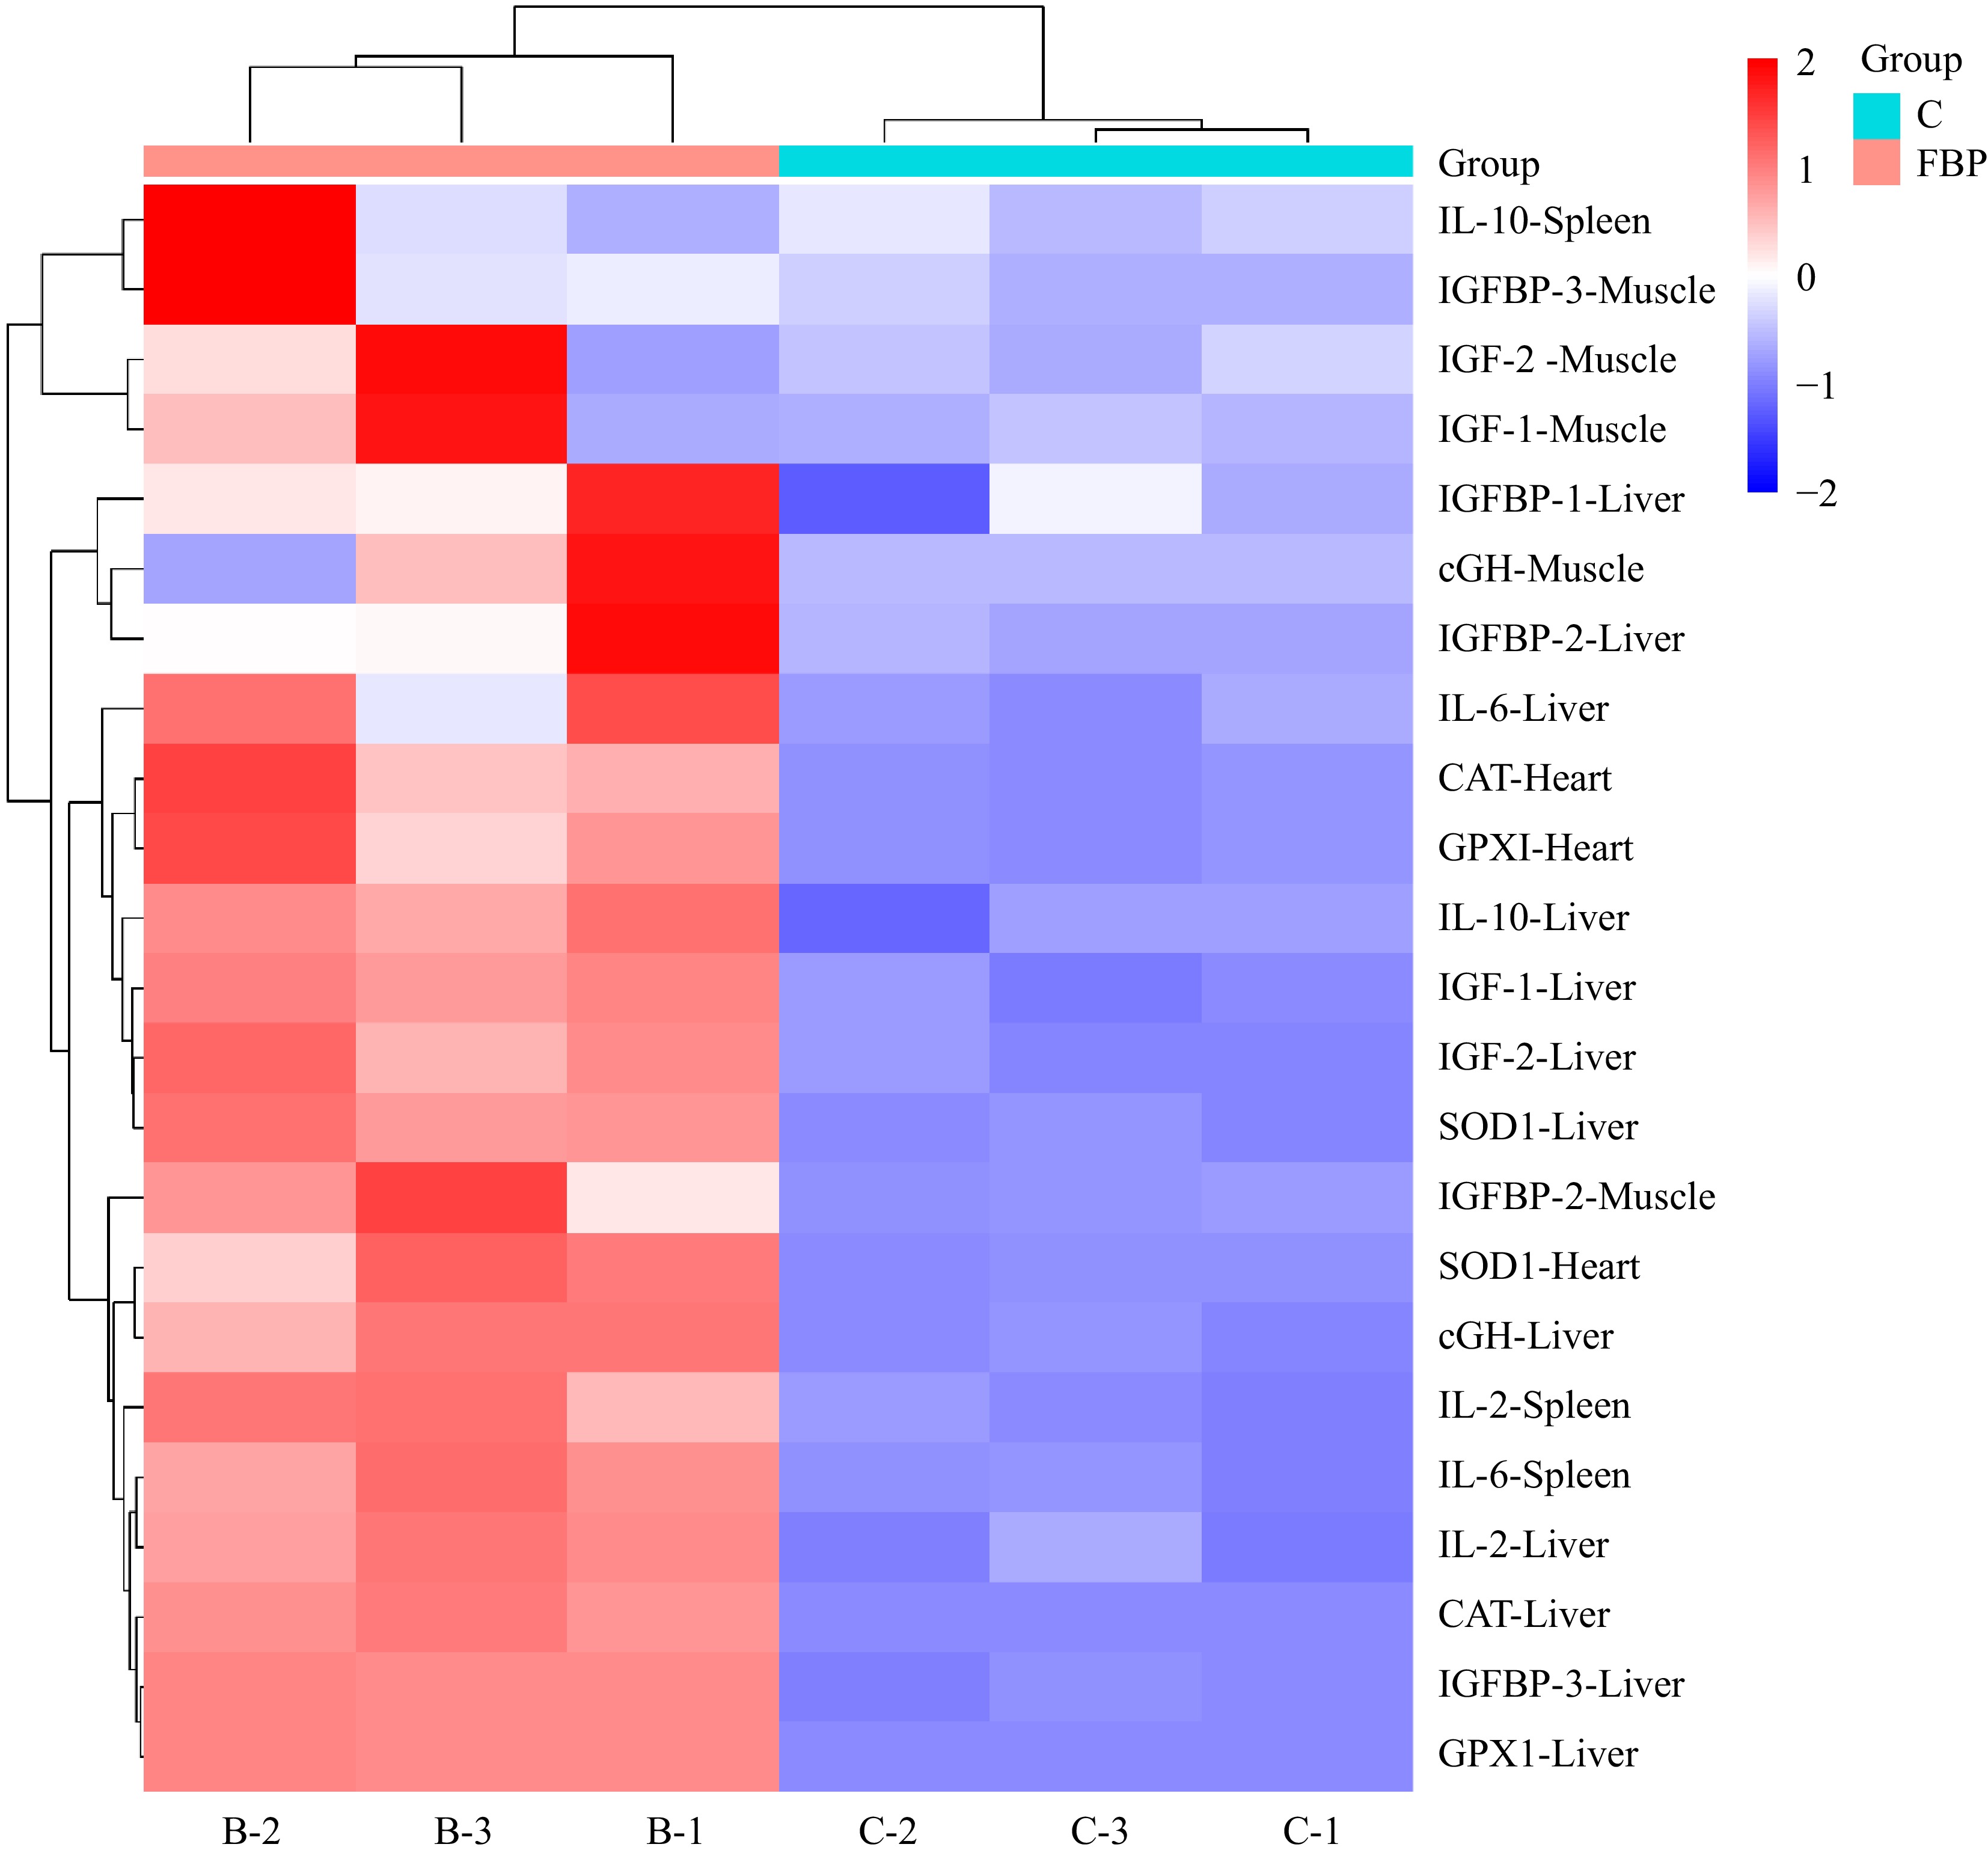
Figure 13.
Heat map analysis of FBP-supplemented broiler chickens. The figure presents the heat map analysis of antioxidant, growth, and immunity-related genes in Yellow-Feathered Broiler Chickens supplemented with FBP. The color intensity in the heat map reflects the relative expression of genes in different tissues. Higher intensities of red signify elevated expression levels of the respective genes, whereas lower intensities of blue indicate diminished expression levels.
-
Testing item Fermented bamboo powder (FBP) Moisture 11.21% Crude protein 17.07% Coarse fiber 17.66% Crude fat 3.48% Coarse ash content 9.21% Acid soluble protein 7.13% Acid washing lignin 3.41% Calcium 0.12% Total phosphorus 0.02% Unknown substance 18.81% Table 1.
The composition of the fermented bamboo powder based on an as-fed basis.
-
Items Basal diet
starter phase
(1−22 d)Basal diet
growth phase
(23−45 d)Basal diet
finisher phase
(46−77 d)Corn 40.66 29.73 20.5 Wheat 20 40 50 DGYC 0 0 0 Soybean meal (43%) 22.31 5.73 2.92 Palm kernel meal 0 2 4 Sunflower kernel meal (35%) 3 5 8 Lard 0 0 6.03 Rapeseed meal (38%) 3 4 0 Corn gluten meal (60%) 4 5 4.4 Rice husk oil 2.31 4.22 0 Calcium bisphosphate 1.4 1.03 0.87 Limestone 1.18 1.12 1.13 Liquid methionine (88%) 0.14 0.23 0.15 Premix* 2 2 2 Total 100 100 100 Calculation of nutrients Metabolizable energy (MJ/kg) 285.6 300.8 307.6 Crude protein 21.14% 20.87% 20.23% Crude fat 4.048% 4.41% 4.53% Methionine 0.486% 0.764% 0.491% Lysine 1.097% 1.364% 1.13% Calcium (%) 0.989% 0.962% 0.97% Available phosphorus 0.485% 0.51% 0.45% * Premix provides the following nutrients (per kilogram of diet): choline, 1 g; enzyme complex, 300 mg; broiler multivitamin, 300 mg; glyceryl tributyrate, 300 mg; probiotics, 200 mg; organomineral, 400 mg; phytase, 200 mg ; NaCl, 2.8 g; vitamin A, 9800 IU; vitamin D3, 2500 IU; vitamin E, 60 IU; vitamin K, 2.3 mg; vitamin B1, 2 mg; vitamin B2, 6 mg; vitamin B6, 4 mg; vitamin B12, 0.02 mg; nicotinic acid, 45 mg; pantothenic acid, 20 mg; folic acid, 1.25 mg; biotin, 0.02 mg; Fe, 75 mg ; Cu, 8 mg; Mn, 75 mg; Zn 60 mg; Cu, 8 mg; Se, 0.3 mg; Co, 0.3 mg. Table 2.
Basal diet ingredients and nutritional composition.
-
Genes NCBI gene ID Primer Sequence Product length (bp) β-actin NM_205518.2 Forward GCCCTCTTCCAGCCATCTTT 150 Reverse CAATGGAGGGTCCGGATTCA CAT NM_001031215.2 Forward GGTAACTGGGATCTTGTGGGA 112 Reverse CCTTCAAATGAGTCTGAGGGTTC CGH NM_204359.2 Forward TGAGAAACTAAAGGACCTGGAAGA 110 Reverse TGTCGAACTTATCGTAGGTGGG GPX1 NM_001277853.3 Forward GCCCGCACCTCTGTCATAC 156 Reverse GCTTCTCCAGGCTGTTCCC IGF1 NM_001004384.3 Forward AGTTCGTATGTGGAGACAGAGGC 83 Reverse TCCCTTGTGGTGTAAGCGTC IGF2 NM_001030342.5 Forward TGCCAACAACCTTGACACCT 98 Reverse GGCCTCACTACCCAAACCTC IGFBP1 NM_001001294.2 Forward GCAAGATCAGGTCCTCCAGTC 199 Reverse AGTAGCATCATTTCTCCAGCGTA IGFBP2 NM_205359.2 Forward GCATGAAGGAGATGGCGGT 99 Reverse TCTTTGAGTCCTCGTGGTTGTG IGFBP3 NM_001395957.1 Forward ATCAGGAAAGAGCAAGCCAAA 121 Reverse TACGACAGGGACCATATTCAGTT IL-2 NM_204153.2 Forward TATCCCGTGGCTAACTAACCTG 159 Reverse ACCGACAAAGTGAGAATCAATCA IL-6 NM_204628.2 Forward CGTTTATGGAGAAGACCGTGAG 92 Reverse CAGAGGATTGTGCCCGAAC IL-10 NM_001004414.4 Forward AGTGCTGTTGTATTCCTTGCTTC 164 Reverse AGGGCTCGTCTGGTGTTTG SOD NM_205064.2 Forward CGCTCGTAGGTGGTTGTATTG 127 Reverse CCTGCTGCTGGAAGTGGAT COR1 NM_001031545.2 Forward CTTCCATCATGACCAAGGCG 197 Reverse CAGCAGCTCACTGATAGCG COR2 NM_001396933.2 Forward GTCATCTACACCACCACCTTGC 245 Reverse AGCAAGCACTCTGAGGTTGT COR4 NM_001031176.2 Forward ATCCCTATGCTGAACCCCCT 70 Reverse TAACTCTGCGTAGAGCGTCC COR6 NM_001031544.2 Forward GCACCTCTCAACTGATGGCT 210 Reverse ACAAAACAGCGGTGGCTATG COR8 NM_001396932.1 Forward GGACCCAGGTTCAGGCTTAC 120 Reverse TTATGGCTTCGACCCACACC COR9 NM_001305217.2 Forward TTTACATGCTCCACCAGGCG 355 Reverse GATCATGCCAAGGTTCCCCA OR52R1 NM_001009878.2 Forward ATCCATGGTCTGATGCCCAC 141 Reverse GGTGGTGGACGTTGATCTGA OR51M1 NM_001008754.4 Forward CATGGGAGTGACTGTGTCCC 516 Reverse CAGCCCTCTGTCTGGACTTG OR1F2P XM_040685819.1 Forward CACCATCACTGTGCCGAAGA 113 Reverse TCTCTGTGCCAACAACGTCA OR5AP2 XM_040685466.1 Forward GTCCAGACAGGAGTGTGCTC 179 Reverse GTGCAAAGCGTGTGTCAGAG OR14J1L112 XM_040654712.1 Forward TCCTGCACTTCTGGCTCTTG 778 GCTGGAGGCACTACCGAATA Table 3.
Primers used for Real-Time Quantitative PCR.
-
Item Control Bamboo powder p-Value IgA (ng/ml) 113.16 ± 7.23 150.98 ± 8.89 0.01 IgG (ng/ml) 62.28 ± 3.25 89.47 ± 1.18 0.04 IgM (ng/ml) 1.40 ± 0.04 1.74 ± 0.03 0.01 IL-2 (ng/ml) 19.13 ± 0.99 40.99 ± 1.23 0.001 IL-6 (ng/ml) 23.38 ± 1.29 40.66 ± 0.61 0.03 IL-10 (ng/ml) 16.41 ± 1.58 24.70 ± 1.32 0.04 IL-1β (ng/ml) 19.63 ± 1.19 43.65 ± 1.04 0.001 TNF-α (ng/ml) 23.13 ± 1.57 11.27 ± 1.14 0.01 IgG, immunoglobulin G; IgA, immunoglobulin A; IgM, immunoglobulin M; IL-2, interleukin-2; IL-6, interleukin-6, and IL-10, interleukin-10 (n = 10). Data presented are mean ± SE. p-value in the same row less then (p < 0.05) significantly different from each other. Table 4.
Effects of FBP supplementation on serum immunoglobulins and inflammatory cytokines of broilers.
-
Genes Gizzard tissue Proventriculus tissue Small intestine tissue Hypothalamus tissue 2−ΔΔCᴛ SEM 2−ΔΔCᴛ SEM 2−ΔΔCᴛ SEM 2−ΔΔCᴛ SEM COR1 1.420c 0.070 2.600b 0.41 2.97b 0.54 5.20a 0.52 COR2 0.760c 0.390 1.710b 0.20 2.23b 0.30 5.27a 0.46 COR4 0.520c 0.210 1.010c 0.35 2.30b 0.35 3.75a 0.38 COR6 0.680c 0.180 0.930c 0.11 1.57b 0.31 3.47a 0.26 COR8 0.230c 0.010 0.600c 0.04 2.03b 0.60 8.24a 0.57 COR9 0.400c 0.010 0.710c 0.04 1.34b 0.26 3.38a 0.27 OR52R1 0.700c 0.020 1.150b 0.17 1.40b 0.20 2.81a 0.26 OR51M1 0.830c 0.020 1.007c 0.17 1.72b 0.29 2.41a 0.31 OR1F2P 0.660c 0.040 1.340b 0.11 3.90a 0.85 1.47b 0.04 OR5AP2 0.680c 0.120 1.010c 0.15 1.91b 0.40 2.40a 0.13 OR14J1L112 0.160c 0.045 0.450c 0.09 1.59b 0.23 12.29a 0.96 The relative expression values (2−ΔΔCᴛ) for the gizzard, proventriculus, small intestine, and hypothalamus tissues of yellow broiler chickens are displayed. The values in each column represent the mean along with the standard error of the mean (SEM). Significant differences at the 0.05 level are indicated by the letters a, b, and c. Means within the same row that share a lowercase letter are considered significantly different. Table 5.
Odorant receptor genes relative expression values in broiler chicken gizzard, proventriculus, small intestine, and hypothalamus tissues
Figures
(13)
Tables
(5)