2024 Volume 1
Article Contents
About this article
RESEARCH ARTICLE   Open Access    

Effects of fermented bamboo powder supplementation on gene expressions of antioxidant, odorant receptors, growth and immunity in yellow-feather broiler chickens

More Information
  • Received: 24 August 2024
    Revised: 23 September 2024
    Accepted: 18 October 2024
    Published online: 08 November 2024
    Animal Advances  1 Article number: e005 (2024)  |  Cite this article
  • Bamboo powder, an economically advantageous supplement for broiler diets, contains a significant amount of insoluble fiber, making its inclusion essential. This study aimed to investigate the effects of fermented bamboo powder (FBP) on the expression of genes related to antioxidants, odorant receptors, growth, and immunity in Yellow-Feathered Broiler chickens. Six hundred healthy 1-day-old chicks were randomly divided into two groups: Control (CON) and Fermented Bamboo Powder (FBP) supplementation. Each group consisted of 10 replicates, with 30 chicks per replicate. The CON group was fed a basal diet, while the FBP group received the basal diet supplemented with FBP across four distinct phases. The first two phases were designated as pretreatment, while the latter phases comprised the experimental period. Tissue samples were collected for analysis at the end of phase IV. The results revealed that supplementation with FBP (p < 0.05) significantly increased the mRNA levels of genes related to antioxidants, odorant receptors, growth, and immunity. Additionally, growth hormone levels, including IGF-1, GH, T4, and T3, were significantly higher (p < 0.01) in the FBP group compared to the control. Moreover, the FBP group exhibited a notable increase in biochemical markers (ALT, AST, and ALP) and immune indicators (IgA, IgG, IgM, IL-2, IL-6, and IL-1β), while levels of TNF-α, CREA, and UREA were significantly reduced (p < 0.01) compared to the control group. These findings highlight the potential of FBP as a natural supplement, positively influencing growth, immunity, and antioxidant mechanisms in broiler chickens.
  • Aquaporins (AQPs) constitute a large family of transmembrane channel proteins that function as regulators of intracellular and intercellular water flow[1,2]. Since their first discovery in the 1990s, AQPs have been found not only in three domains of life, i.e., bacteria, eukaryotes, and archaea, but also in viruses[3,4]. Each AQP monomer is composed of an internal repeat of three transmembrane helices (i.e., TM1–TM6) as well as two half helixes that are formed by loop B (LB) and LE through dipping into the membrane[5]. The dual Asn-Pro-Ala (NPA) motifs that are located at the N-terminus of two half helixes act as a size barrier of the pore via creating an electrostatic repulsion of protons, whereas the so-called aromatic/arginine (ar/R) selectivity filter (i.e., H2, H5, LE1, and LE2) determines the substrate specificity by rendering the pore constriction site diverse in both size and hydrophobicity[59]. Based on sequence similarity, AQPs in higher plants could be divided into five subfamilies, i.e., plasma membrane intrinsic protein (PIP), tonoplast intrinsic protein (TIP), NOD26-like intrinsic protein (NIP), X intrinsic protein (XIP), and small basic intrinsic protein (SIP)[1017]. Among them, PIPs, which are typically localized in the cell membrane, are most conserved and play a central role in controlling plant water status[12,1822]. Among two phylogenetic groups present in the PIP subfamily, PIP1 possesses a relatively longer N-terminus and PIP2 features an extended C-terminus with one or more conserved S residues for phosphorylation modification[5,15,17].

    Tigernut (Cyperus esculentus L.), which belongs to the Cyperaceae family within Poales, is a novel and promising herbaceous C4 oil crop with wide adaptability, large biomass, and short life period[2327]. Tigernut is a unique species accumulating up to 35% oil in the underground tubers[2830], which are developed from stolons and the process includes three main stages, i.e., initiation, swelling, and maturation[3133]. Water is essential for tuber development and tuber moisture content maintains a relatively high level of approximately 85% until maturation when a significant drop to about 45% is observed[28,32]. Thereby, uncovering the mechanism of tuber water balance is of particular interest. Despite crucial roles of PIPs in the cell water balance, to date, their characterization in tigernut is still in the infancy[21]. The recently available genome and transcriptome datasets[31,33,34] provide an opportunity to address this issue.

    In this study, a global characterization of PIP genes was conducted in tigernut, including gene localizations, gene structures, sequence characteristics, and evolutionary patterns. Moreover, the correlation of CePIP mRNA/protein abundance with water content during tuber development as well as subcellular localizations were also investigated, which facilitated further elucidating the water balance mechanism in this special species.

    PIP genes reported in Arabidopsis (Arabidopsis thaliana)[10] and rice (Oryza sativa)[11] were respectively obtained from TAIR11 (www.arabidopsis.org) and RGAP7 (http://rice.uga.edu), and detailed information is shown in Supplemental Table S1. Their protein sequences were used as queries for tBLASTn[35] (E-value, 1e–10) search of the full-length tigernut transcriptome and genome sequences that were accessed from CNGBdb (https://db.cngb.org/search/assembly/CNA0051961)[31,34]. RNA sequencing (RNA-seq) reads that are available in NCBI (www.ncbi.nlm.nih.gov/sra) were also adopted for gene structure revision as described before[13], and presence of the conserved MIP (major intrinsic protein, Pfam accession number PF00230) domain in candidates was confirmed using MOTIF Search (www.genome.jp/tools/motif). To uncover the origin and evolution of CePIP genes, a similar approach was also employed to identify homologs from representative plant species, i.e., Carex cristatella (v1, Cyperaceae)[36], Rhynchospora breviuscula (v1, Cyperaceae)[37], and Juncus effusus (v1, Juncaceae)[37], whose genome sequences were accessed from NCBI (www.ncbi.nlm.nih.gov). Gene structure of candidates were displayed using GSDS 2.0 (http://gsds.gao-lab.org), whereas physiochemical parameters of deduced proteins were calculated using ProtParam (http://web.expasy.org/protparam). Subcellular localization prediction was conducted using WoLF PSORT (www.genscript.com/wolf-psort.html).

    Nucleotide and protein multiple sequence alignments were respectively conducted using ClustalW and MUSCLE implemented in MEGA6[38] with default parameters, and phylogenetic tree construction was carried out using MEGA6 with the maximum likelihood method and bootstrap of 1,000 replicates. Systematic names of PIP genes were assigned with two italic letters denoting the source organism and a progressive number based on sequence similarity. Conserved motifs were identified using MEME Suite 5.5.3 (https://meme-suite.org/tools/meme) with optimized parameters as follows: Any number of repetitions, maximum number of 15 motifs, and a width of 6 and 250 residues for each motif. TMs and conserved residues were identified using homology modeling and sequence alignment with the structure resolved spinach (Spinacia oleracea) SoPIP2;1[5].

    Synteny analysis was conducted using TBtools-II[39] as described previously[40], where the parameters were set as E-value of 1e-10 and BLAST hits of 5. Duplication modes were identified using the DupGen_finder pipeline[41], and Ks (synonymous substitution rate) and Ka (nonsynonymous substitution rate) of duplicate pairs were calculated using codeml in the PAML package[42]. Orthologs between different species were identified using InParanoid[43] and information from synteny analysis, and orthogroups (OGs) were assigned only when they were present in at least two species examined.

    Plant materials used for gene cloning, qRT-PCR analysis, and 4D-parallel reaction monitoring (4D-PRM)-based protein quantification were derived from a tigernut variety Reyan3[31], and plants were grown in a greenhouse as described previously[25]. For expression profiling during leaf development, three representative stages, i.e., young, mature, and senescing, were selected and the chlorophyll content was checked using SPAD-502Plus (Konica Minolta, Shanghai, China) as previously described[44]. Young and senescing leaves are yellow in appearance, and their chlorophyll contents are just half of that of mature leaves that are dark green. For diurnal fluctuation regulation, mature leaves were sampled every 4 h from the onset of light at 8 a.m. For gene regulation during tuber development, fresh tubers at 1, 5, 10, 15, 20, 25, and 35 d after tuber initiation (DAI) were collected as described previously[32]. All samples with three biological replicates were quickly frozen with liquid nitrogen and stored at −80 °C for further use. For subcellular localization analysis, tobacco (Nicotiana benthamiana) plants were grown as previously described[20].

    Tissue-specific expression profiles of CePIP genes were investigated using Illumina RNA-seq samples (150 bp paired-end reads) with three biological replicates for young leaf, mature leaf, sheath of mature leaf, shoot apex, root, rhizome, and three stages of developmental tuber (40, 85, and 120 d after sowing (DAS)), which are under the NCBI accession number of PRJNA703731. Raw sequence reads in the FASTQ format were obtained using fastq-dump, and quality control was performed using fastQC (www.bioinformatics.babraham.ac.uk/projects/fastqc). Read mapping was performed using HISAT2 (v2.2.1, https://daehwankimlab.github.io/hisat2), and relative gene expression level was presented as FPKM (fragments per kilobase of exon per million fragments mapped)[45].

    For qRT-PCR analysis, total RNA extraction and synthesis of the first-strand cDNA were conducted as previously described[24]. Primers used in this study are shown in Supplemental Table S2, where CeUCE2 and CeTIP41[25,33] were employed as two reference genes. PCR reaction in triplicate for each biological sample was carried out using the SYBR-green Mix (Takara) on a Real-time Thermal Cycler Type 5100 (Thermal Fisher Scientific Oy). Relative gene abundance was estimated with the 2−ΔΔCᴛ method and statistical analysis was performed using SPSS Statistics 20 as described previously[13].

    Raw proteomic data for tigernut roots, leaves, freshly harvested, dried, rehydrated for 48 h, and sprouted tubers were downloaded from ProteomeXchange/PRIDE (www.proteomexchange.org, PXD021894, PXD031123, and PXD035931), which were further analyzed using Maxquant (v1.6.15.0, www.maxquant.org). Three dominant members, i.e., CePIP1;1, -2;1, and -2;8, were selected for 4D-PRM quantification analysis, and related unique peptides are shown in Supplemental Table S3. Protein extraction, trypsin digestion, and LC-MS/MS analysis were conducted as described previously[46].

    For subcellular localization analysis, the coding region (CDS) of CePIP1;1, -2;1, and -2;8 were cloned into pNC-Cam1304-SubN via Nimble Cloning as described before[30]. Then, recombinant plasmids were introduced into Agrobacterium tumefaciens GV3101 with the helper plasmid pSoup-P19 and infiltration of 4-week-old tobacco leaves were performed as previously described[20]. For subcellular localization analysis, the plasma membrane marker HbPIP2;3-RFP[22] was co-transformed as a positive control. Fluorescence observation was conducted using confocal laser scanning microscopy imaging (Zeiss LMS880, Germany): The wavelength of laser-1 was set as 730 nm for RFP observation, where the fluorescence was excited at 561 nm; the wavelength of laser-2 was set as 750 nm for EGFP observation, where the fluorescence was excited at 488 nm; and the wavelength of laser-3 was set as 470 nm for chlorophyll autofluorescence observation, where the fluorescence was excited at 633 nm.

    As shown in Table 1, a total of 14 PIP genes were identified from eight tigernut scaffolds (Scfs). The CDS length varies from 831 to 882 bp, putatively encoding 276–293 amino acids (AA) with a molecular weight (MW) of 29.16–31.59 kilodalton (kDa). The theoretical isoelectric point (pI) varies from 7.04 to 9.46, implying that they are all alkaline. The grand average of hydropathicity (GRAVY) is between 0.344 and 0.577, and the aliphatic index (II) ranges from 94.57 to 106.90, which are consistent with the hydrophobic characteristic of AQPs[47]. As expected, like SoPIP2;1, all CePIPs include six TMs, two typical NPA motifs, the invariable ar/R filter F-H-T-R, five conserved Froger's positions Q/M-S-A-F-W, and two highly conserved residues corresponding to H193 and L197 in SoPIP2;1 that were proven to be involved in gating[5,48], though the H→F variation was found in CePIP2;9, -2;10, and -2;11 (Supplemental Fig. S1). Moreover, two S residues, corresponding to S115 and S274 in SoPIP2;1[5], respectively, were also found in the majority of CePIPs (Supplemental Fig. S1), implying their posttranslational regulation by phosphorylation.

    Table 1.  Fourteen PIP genes identified in C. esculentus.
    Gene name Locus Position Intron no. AA MW (kDa) pI GRAVY AI TM MIP
    CePIP1;1 CESC_15147 Scf9:2757378..2759502(–) 3 288 30.76 8.82 0.384 95.28 6 47..276
    CePIP1;2 CESC_04128 Scf4:3806361..3807726(–) 3 291 31.11 8.81 0.344 95.95 6 46..274
    CePIP1;3 CESC_15950 Scf54:5022493..5023820(+) 3 289 31.06 8.80 0.363 94.57 6 49..278
    CePIP2;1 CESC_15350 Scf9:879960..884243(+) 3 288 30.34 8.60 0.529 103.02 6 33..269
    CePIP2;2 CESC_00011 Scf30:4234620..4236549(+) 3 293 31.59 9.27 0.394 101.57 6 35..268
    CePIP2;3 CESC_00010 Scf30:4239406..4241658(+) 3 291 30.88 9.44 0.432 98.97 6 31..266
    CePIP2;4 CESC_05080 Scf46:307799..309544(+) 3 285 30.44 7.04 0.453 100.32 6 28..265
    CePIP2;5 CESC_05079 Scf46:312254..314388(+) 3 286 30.49 7.04 0.512 101.68 6 31..268
    CePIP2;6 CESC_05078 Scf46:316024..317780(+) 3 288 30.65 7.68 0.475 103.06 6 31..268
    CePIP2;7 CESC_05077 Scf46:320439..322184(+) 3 284 30.12 8.55 0.500 100.00 6 29..266
    CePIP2;8 CESC_14470 Scf2:4446409..4448999(+) 3 284 30.37 8.30 0.490 106.90 6 33..263
    CePIP2;9 CESC_02223 Scf1:2543928..2545778(–) 3 283 30.09 9.46 0.533 106.47 6 31..262
    CePIP2;10 CESC_10007 Scf27:1686032..1688010(–) 3 276 29.16 9.23 0.560 106.05 6 26..256
    CePIP2;11 CESC_10009 Scf27:1694196..1696175(–) 3 284 29.71 9.10 0.577 105.49 6 33..263
    AA: amino acid; AI: aliphatic index; GRAVY: grand average of hydropathicity; kDa: kilodalton; MIP: major intrinsic protein; MW: molecular weight; pI: isoelectric point; PIP: plasma membrane intrinsic protein; Scf: scaffold; TM: transmembrane helix.
     | Show Table
    DownLoad: CSV

    To uncover the evolutionary relationships, an unrooted phylogenetic tree was constructed using the full-length protein sequences of CePIPs together with 11 OsPIPs and 13 AtPIPs. As shown in Fig. 1a, these proteins were clustered into two main groups, corresponding to PIP1 and PIP2 as previously defined[10,49], and each appears to have evolved into several subgroups. Compared with PIP1s, PIP2s possess a relatively shorter N-terminal but an extended C-terminal with one conserved S residue (Supplemental Fig. S1). Interestingly, a high number of gene repeats were detected, most of which seem to be species-specific, i.e., AtPIP1;1/-1;2/-1;3/-1;4/-1;5, AtPIP2;1/-2;2/-2;3/-2;4/-2;5/-2;6, AtPIP2;7/-2;8, OsPIP1;1/-1;2/-1;3, OsPIP2;1/-2;4/-2;5, OsPIP2;2/-2;3, CePIP1;1/-1;2, CePIP2;2/-2;3, CePIP2;4/-2;5/-2;6/-2;7, and CePIP2;9/-2;10/-2;11, reflecting the occurrence of more than one lineage-specific whole-genome duplications (WGDs) after their divergence[50,51]. In Arabidopsis that experienced three WGDs (i.e. γ, β, and α) after the split with the monocot clade[52], AtPIP1;5 in the PIP1 group first gave rise to AtPIP1;1 via the γ WGD shared by all core eudicots[50], which latter resulted in AtPIP1;3, -1;4, and -1;2 via β and α WGDs; AtPIP2;1 in the PIP2 group first gave rise to AtPIP2;6 via the γ WGD, and they latter generated AtPIP2;2, and -2;5 via the α WGD (Supplemental Table S1). In rice, which also experienced three WGDs (i.e. τ, σ, and ρ) after the split with the eudicot clade[51], OsPIP1;2 and -2;3 generated OsPIP1;1 and -2;2 via the Poaceae-specific ρ WGD, respectively. Additionally, tandem, proximal, transposed and dispersed duplications also played a role on the gene expansion in these two species (Supplemental Table S1).

    Figure 1.  Structural and phylogenetic analysis of PIPs in C. esculentus, O. sativa, and A. thaliana. (a) Shown is an unrooted phylogenetic tree resulting from full-length PIPs with MEGA6 (maximum likelihood method and bootstrap of 1,000 replicates), where the distance scale denotes the number of amino acid substitutions per site. (b) Shown are the exon-intron structures. (c) Shown is the distribution of conserved motifs among PIPs, where different motifs are represented by different color blocks as indicated and the same color block in different proteins indicates a certain motif. (At: A. thaliana; Ce: C. esculentus; PIP: plasma membrane intrinsic protein; Os: O. sativa).

    Analysis of gene structures revealed that all CePIP and AtPIP genes possess three introns and four exons in the CDS, in contrast to the frequent loss of certain introns in rice, including OsPIP1;2, -1;3, -2;1, -2;3, -2;4, -2;5, -2;6, -2;7, and -2;8 (Fig. 1b). The positions of three introns are highly conserved, which are located in sequences encoding LB (three residues before the first NPA), LD (one residue before the conserved L involved in gating), and LE (18 residues after the second NPA), respectively (Supplemental Fig. S1). The intron length of CePIP genes is highly variable, i.e., 109–993 bp, 115–1745 bp, and 95–866 bp for three introns, respectively. By contrast, the exon length is relatively less variable: Exons 2 and 3 are invariable with 296 bp and 141 bp, respectively, whereas Exons 1 and 4 are of 277–343 bp and 93–132 bp, determining the length of N- and C-terminus of PIP1 and PIP2, respectively (Fig. 1b). Correspondingly, their protein structures were shown to be highly conserved, and six (i.e., Motifs 1–6) out of 15 motifs identified are broadly present. Among them, Motif 3, -2, -6, -1, and -4 constitute the conserved MIP domain. In contrast to a single Motif 5 present in most PIP2s, all PIP1s possess two sequential copies of Motif 5, where the first one is located at the extended N-terminal. In CePIP2;3 and OsPIP2;7, Motif 5 is replaced by Motif 13; in CePIP2;2, it is replaced by two copies of Motif 15; and no significant motif was detected in this region of CePIP2;10. PIP1s and PIP2s usually feature Motif 9 and -7 at the C-terminal, respectively, though it is replaced by Motif 12 in CePIP2;6 and OsPIP2;8. PIP2s usually feature Motif 8 at the N-terminal, though it is replaced by Motif 14 in CePIP2;2 and -2;3 or replaced by Motif 11 in CePIP2;10 and -2;11 (Fig. 1c).

    As shown in Fig. 2a, gene localization of CePIPs revealed three gene clusters, i.e., CePIP2;2/-2;3 on Scf30, CePIP2;4/-2;5/-2;6/-2;7 on Scf46, and CePIP2;10/-2;11 on Scf27, which were defined as tandem repeats for their high sequence similarities and neighboring locations. The nucleotide identities of these duplicate pairs vary from 70.5% to 91.2%, and the Ks values range from 0.0971 to 1.2778 (Table 2), implying different time of their birth. According to intra-species synteny analysis, two duplicate pairs, i.e., CePIP1;1/-1;2 and CePIP2;2/-2;4, were shown to be located within syntenic blocks (Fig. 2b) and thus were defined as WGD repeats. Among them, CePIP1;1/-1;2 possess a comparable Ks value to CePIP2;2/-2;3, CePIP1;1/-1;3, and CePIP2;4/-2;8 (1.2522 vs 1.2287–1.2778), whereas CePIP2;2/-2;4 harbor a relatively higher Ks value of 1.5474 (Table 2), implying early origin or fast evolution of the latter. While CePIP1;1/-1;3 and CePIP2;1/-2;8 were characterized as transposed repeats, CePIP2;1/-2;2, CePIP2;9/-2;10, and CePIP2;8/-2;10 were characterized as dispersed repeats (Fig. 2a). The Ks values of three dispersed repeats vary from 0.8591 to 3.0117 (Table 2), implying distinct times of origin.

    Figure 2.  Duplication events of CePIP genes and synteny analysis within and between C. esculentus, O. sativa, and A. thaliana. (a) Duplication events detected in tigernut. Serial numbers are indicated at the top of each scaffold, and the scale is in Mb. Duplicate pairs identified in this study are connected using lines in different colors, i.e., tandem (shown in green), transposed (shown in purple), dispersed (shown in gold), and WGD (shown in red). (b) Synteny analysis within and between C. esculentus, O. sativa, and A. thaliana. (c) Synteny analysis within and between C. esculentus, C. cristatella, R. breviuscula, and J. effusus. Shown are PIP-encoding chromosomes/scaffolds and only syntenic blocks that contain PIP genes are marked, i.e., red and purple for intra- and inter-species, respectively. (At: A. thaliana; Cc: C. cristatella; Ce: C. esculentus; Je: J. effusus; Mb: megabase; PIP: plasma membrane intrinsic protein; Os: O. sativa; Rb: R. breviuscula; Scf: scaffold; WGD: whole-genome duplication).
    Table 2.  Sequence identity and evolutionary rate of homologous PIP gene pairs identified in C. esculentus. Ks and Ka were calculated using PAML.
    Duplicate 1 Duplicate 2 Identity (%) Ka Ks Ka/Ks
    CePIP1;1 CePIP1;3 78.70 0.0750 1.2287 0.0610
    CePIP1;2 CePIP1;1 77.20 0.0894 1.2522 0.0714
    CePIP2;1 CePIP2;4 74.90 0.0965 1.7009 0.0567
    CePIP2;3 CePIP2;2 70.50 0.1819 1.2778 0.1424
    CePIP2;4 CePIP2;2 66.50 0.2094 1.5474 0.1353
    CePIP2;5 CePIP2;4 87.30 0.0225 0.4948 0.0455
    CePIP2;6 CePIP2;5 84.90 0.0545 0.5820 0.0937
    CePIP2;7 CePIP2;6 78.70 0.0894 1.0269 0.0871
    CePIP2;8 CePIP2;4 72.90 0.1401 1.2641 0.1109
    CePIP2;9 CePIP2;10 76.40 0.1290 0.8591 0.1502
    CePIP2;10 CePIP2;8 64.90 0.2432 3.0117 0.0807
    CePIP2;11 CePIP2;10 91.20 0.0562 0.0971 0.5783
    Ce: C. esculentus; Ka: nonsynonymous substitution rate; Ks: synonymous substitution rate; PIP: plasma membrane intrinsic protein.
     | Show Table
    DownLoad: CSV

    According to inter-species syntenic analysis, six out of 14 CePIP genes were shown to have syntelogs in rice, including 1:1, 1:2, and 2:2 (i.e. CePIP1;1 vs OsPIP1;3, CePIP1;3 vs OsPIP1;2/-1;1, CePIP2;1 vs OsPIP2;4, CePIP2;2/-2;4 vs OsPIP2;3/-2;2, and CePIP2;8 vs OsPIP2;6), in striking contrast to a single one found in Arabidopsis (i.e. CePIP1;2 vs AtPIP1;2). Correspondingly, only OsPIP1;2 in rice was shown to have syntelogs in Arabidopsis, i.e., AtPIP1;3 and -1;4 (Fig. 2b). These results are consistent with their taxonomic relationships that tigernut and rice are closely related[50,51], and also imply lineage-specific evolution after their divergence.

    As described above, phylogenetic and syntenic analyses showed that the last common ancestor of tigernut and rice is more likely to possess only two PIP1s and three PIP2s. However, it is not clear whether the gene expansion observed in tigernut is species-specific or Cyperaceae-specific. To address this issue, recently available genomes were used to identify PIP subfamily genes from C. cristatella, R. breviuscula, and J. effuses, resulting in 15, 13, and nine members, respectively. Interestingly, in contrast to a high number of tandem repeats found in Cyperaceae species, only one pair of tandem repeats (i.e., JePIP2;3 and -2;4) were identified in J. effusus, a close outgroup species to Cyperaceae in the Juncaceae family[36,37]. According to homologous analysis, a total of 12 orthogroups were identified, where JePIP genes belong to PIP1A (JePIP1;1), PIP1B (JePIP1;2), PIP1C (JePIP1;3), PIP2A (JePIP2;1), PIP2B (JePIP2;2), PIP2F (JePIP2;3 and -2;4), PIP2G (JePIP2;5), and PIP2H (JePIP2;6) (Table 3). Further intra-species syntenic analysis revealed that JePIP1;1/-1;2 and JePIP2;2/-2;3 are located within syntenic blocks, which is consistent with CePIP1;1/-1;2, CePIP2;2/-2;4, CcPIP1;1/-1;2, CcPIP2;3/-2;4, RbPIP1;1/-1;2, and RbPIP2;2/-2;5 (Fig. 2c), implying that PIP1A/PIP1B and PIP2B/PIP2D were derived from WGDs occurred sometime before Cyperaceae-Juncaceae divergence. After the split with Juncaceae, tandem duplications frequently occurred in Cyperaceae, where PIP2B/PIP2C and PIP2D/PIP2E/PIP2F retain in most Cyperaceae plants examined in this study. By contrast, species-specific expansion was also observed, i.e., CePIP2;4/-2;5, CePIP2;10/-2;11, CcPIP1;2/-1;3, CcPIP2;4/-2;5, CcPIP2;8/-2;9, CcPIP2;10/-2;11, RbPIP2;3/-2;4, and RbPIP2;9/-2;10 (Table 3 & Fig. 2c).

    Table 3.  Twelve proposed orthogroups based on comparison of representative plant species.
    Orthogroup C. esculentus C. cristatella R. breviuscula J. effusus O. sativa A. thaliana
    PIP1A CePIP1;1 CcPIP1;1 RbPIP1;1 JePIP1;1 OsPIP1;3 AtPIP1;1, AtPIP1;2,
    AtPIP1;3, AtPIP1;4,
    AtPIP1;5
    PIP1B CePIP1;2 CcPIP1;2, CcPIP1;3 RbPIP1;2 JePIP1;2
    PIP1C CePIP1;3 CcPIP1;4 RbPIP1;3 JePIP1;3 OsPIP1;1, OsPIP1;2
    PIP2A CePIP2;1 CcPIP2;1 RbPIP2;1 JePIP2;1 OsPIP2;1, OsPIP2;4,
    OsPIP2;5
    AtPIP2;1, AtPIP2;2,
    AtPIP2;3, AtPIP2;4,
    AtPIP2;5, AtPIP2;6
    PIP2B CePIP2;2 CcPIP2;2 RbPIP2;2 JePIP2;2 OsPIP2;2, OsPIP2;3
    PIP2C CePIP2;3 CcPIP2;3 RbPIP2;3, RbPIP2;4
    PIP2D CePIP2;4, CePIP2;5 CcPIP2;4, CcPIP2;5 RbPIP2;5
    PIP2E CePIP2;5 CcPIP2;5 RbPIP2;6
    PIP2F CePIP2;6 CcPIP2;6
    PIP2G CePIP2;7 CcPIP2;7 RbPIP2;7 JePIP2;3, JePIP2;4
    PIP2H CePIP2;8 CcPIP2;8, CcPIP2;9 RbPIP2;8 JePIP2;5 OsPIP2;6 AtPIP2;7, AtPIP2;8
    PIP2I CePIP2;9, CePIP2;10,
    CePIP2;11
    CcPIP2;10, CcPIP2;11 RbPIP2;9, RbPIP2;10 JePIP2;6 OsPIP2;7, OsPIP2;8
    At: A. thaliana; Cc: C. cristatella; Ce: C. esculentus; Je: J. effuses; Os: O. sativa; Rb: R. breviuscula; PIP: plasma membrane intrinsic protein.
     | Show Table
    DownLoad: CSV

    Tissue-specific expression profiles of CePIP genes were investigated using transcriptome data available for young leaf, mature leaf, sheath, root, rhizome, shoot apex, and tuber. As shown in Fig. 3a, CePIP genes were mostly expressed in roots, followed by sheaths, moderately in tubers, young leaves, rhizomes, and mature leaves, and lowly in shoot apexes. In most tissues, CePIP1;1, -2;1, and -2;8 represent three dominant members that contributed more than 90% of total transcripts. By contrast, in rhizome, these three members occupied about 80% of total transcripts, which together with CePIP1;3 and -2;4 contributed up to 96%; in root, CePIP1;1, -1;3, -2;4, and -2;7 occupied about 84% of total transcripts, which together with CePIP2;1 and -2;8 contributed up to 94%. According to their expression patterns, CePIP genes could be divided into five main clusters: Cluster I includes CePIP1;1, -2;1, and -2;8 that were constitutively and highly expressed in all tissues examined; Cluster II includes CePIP2;2, -2;9, and -2;10 that were lowly expressed in all tested tissues; Cluster III includes CePIP1;2 and -2;11 that were preferentially expressed in young leaf and sheath; Cluster IV includes CePIP1;3 and -2;4 that were predominantly expressed in root and rhizome; and Cluster V includes remains that were typically expressed in root (Fig. 3a). Collectively, these results imply expression divergence of most duplicate pairs and three members (i.e. CePIP1;1, -2;1, and -2;8) have evolved to be constitutively co-expressed in most tissues.

    Figure 3.  Expression profiles of CePIP genes in various tissues, different stages of leaf development, and mature leaves of diurnal fluctuation. (a) Tissue-specific expression profiles of 14 CePIP genes. The heatmap was generated using the R package implemented with a row-based standardization. Color scale represents FPKM normalized log2 transformed counts, where blue indicates low expression and red indicates high expression. (b) Expression profiles of CePIP1;1, -2;1, and -2;8 at different stages of leaf development. (c) Expression profiles of CePIP1;1, -2;1, and -2;8 in mature leaves of diurnal fluctuation. Bars indicate SD (N = 3) and uppercase letters indicate difference significance tested following Duncan's one-way multiple-range post hoc ANOVA (p< 0.01). (Ce: C. esculentus; FPKM: Fragments per kilobase of exon per million fragments mapped; PIP: plasma membrane intrinsic protein)

    As shown in Fig. 3a, compared with young leaves, transcriptome profiling showed that CePIP1;2, -2;3, -2;7, -2;8, and -2;11 were significantly down-regulated in mature leaves, whereas CePIP1;3 and -2;1 were up-regulated. To confirm the results, three dominant members, i.e., CePIP1;1, -2;1, and -2;8, were selected for qRT-PCR analysis, which includes three representative stages, i.e., young, mature, and senescing leaves. As shown in Fig. 3b, in contrast to CePIP2;1 that exhibited a bell-like expression pattern peaking in mature leaves, transcripts of both CePIP1;1 and -2;8 gradually decreased during leaf development. These results were largely consistent with transcriptome profiling, and the only difference is that CePIP1;1 was significantly down-regulated in mature leaves relative to young leaves. However, this may be due to different experiment conditions used, i.e., greenhouse vs natural conditions.

    Diurnal fluctuation expression patterns of CePIP1;1, -2;1, and -2;8 were also investigated in mature leaves and results are shown in Fig. 3c. Generally, transcripts of all three genes in the day (8, 12, 16, and 20 h) were higher than that in the night (24 and 4 h). During the day, both CePIP1;1 and -2;8 exhibited an unimodal expression pattern that peaked at 12 h, whereas CePIP2;1 possessed two peaks (8 and 16 h) and their difference was not significant. Nevertheless, transcripts of all three genes at 20 h (onset of night) were significantly lower than those at 8 h (onset of day) as well as 12 h. In the night, except for CePIP2;1, no significant difference was observed between the two stages for both CePIP1;1 and -2;8. Moreover, their transcripts were comparable to those at 20 h (Fig. 3c).

    To reveal the expression patterns of CePIP genes during tuber development, three representative stages, i.e., 40 DAS (early swelling stage), 85 DAS (late swelling stage), and 120 DAS (mature stage), were first profiled using transcriptome data. As shown in Fig. 4a, except for rare expression of CePIP1;2, -2;2, -2;9, and -2;10, most genes exhibited a bell-like expression pattern peaking at 85 DAS, in contrast to a gradual decrease of CePIP2;3 and -2;8. Notably, except for CePIP2;4, other genes were expressed considerably lower at 120 DAS than that at 40 DAS. For qRT-PCR confirmation of CePIP1;1, -2;1, and -2;8, seven stages were examined, i.e., 1, 5, 10, 15, 20, 25, and 35 DAI, which represent initiation, five stages of swelling, and maturation as described before[32]. As shown in Fig. 4b, two peaks were observed for all three genes, though their patterns were different. As for CePIP1;1, compared with the initiation stage (1 DAI), significant up-regulation was observed at the early swelling stage (5 DAI), followed by a gradual decrease except for the appearance of the second peak at 20 DAI, which is something different from transcriptome profiling. As for CePIP2;1, a sudden drop of transcripts first appeared at 5 DAI, then gradually increased until 20 DAI, which was followed by a gradual decrease at two late stages. The pattern of CePIP2;8 is similar to -1;1, two peaks appeared at 5 and 20 DAI and the second peak was significantly lower than the first. The difference is that the second peak of CePIP2;8 was significantly lower than the initiation stage. By contrast, the second peak (20 DAI) of CePIP2;1 was significantly higher than that of the first one (1 DAI). Nevertheless, the expression patterns of both CePIP2;1 and -2;8 are highly consistent with transcriptome profiling.

    Figure 4.  Transcript and protein abundances of CePIP genes during tuber development. (a) Transcriptome-based expression profiling of 14 CePIP genes during tuber development. The heatmap was generated using the R package implemented with a row-based standardization. Color scale represents FPKM normalized log2 transformed counts, where blue indicates low expression and red indicates high expression. (b) qRT-PCR-based expression profiling of CePIP1;1, -2;1, and -2;8 in seven representative stages of tuber development. (c) Relative protein abundance of CePIP1;1, -2;1, and -2;8 in three representative stages of tuber development. Bars indicate SD (N = 3) and uppercase letters indicate difference significance tested following Duncan's one-way multiple-range post hoc ANOVA (p < 0.01). (Ce: C. esculentus; DAI: days after tuber initiation; DAS: days after sowing; FPKM: Fragments per kilobase of exon per million fragments mapped; PIP: plasma membrane intrinsic protein).

    Since protein abundance is not always in agreement with the transcript level, protein profiles of three dominant members (i.e. CePIP1;1, -2;1, and -2;8) during tuber development were further investigated. For this purpose, we first took advantage of available proteomic data to identify CePIP proteins, i.e., leaves, roots, and four stages of tubers (freshly harvested, dried, rehydrated for 48 h, and sprouted). As shown in Supplemental Fig. S2, all three proteins were identified in both leaves and roots, whereas CePIP1;1 and -2;8 were also identified in at least one of four tested stages of tubers. Notably, all three proteins were considerably more abundant in roots, implying their key roles in root water balance.

    To further uncover their profiles during tuber development, 4D-PRM-based protein quantification was conducted in three representative stages of tuber development, i.e., 1, 25, and 35 DAI. As expected, all three proteins were identified and quantified. In contrast to gradual decrease of CePIP2;8, both CePIP1;1 and -2;1 exhibited a bell-like pattern that peaked at 25 DAI, though no significant difference was observed between 1 and 25 DAI (Fig. 4c). The trends are largely in accordance with their transcription patterns, though the reverse trend was observed for CePIP2;1 at two early stages (Fig. 4b & Fig. 4c).

    As predicted by WoLF PSORT, CePIP1;1, -2;1, and -2;8 may function in the cell membrane. To confirm the result, subcellular localization vectors named pNC-Cam1304-CePIP1;1, pNC-Cam1304-CePIP2;1, and pNC-Cam1304-CePIP2;8 were further constructed. When transiently overexpressed in tobacco leaves, green fluorescence signals of all three constructs were confined to cell membranes, highly coinciding with red fluorescence signals of the plasma membrane marker HbPIP2;3-RFP (Fig. 5).

    Figure 5.  (a) Schematic diagram of overexpressing constructs, (b) subcellular localization analysis of CePIP1;1, -2;1, and -2;8 in N. benthamiana leaves. (35S: cauliflower mosaic virus 35S RNA promoter; Ce: C. esculentus; EGFP: enhanced green fluorescent protein; kb: kilobase; NOS: terminator of the nopaline synthase gene; RFP: red fluorescent protein; PIP: plasma membrane intrinsic protein).

    Water balance is particularly important for cell metabolism and enlargement, plant growth and development, and stress responses[2,19]. As the name suggests, AQPs raised considerable interest for their high permeability to water, and plasma membrane-localized PIPs were proven to play key roles in transmembrane water transport between cells[1,18]. The first PIP was discovered in human erythrocytes, which was named CHIP28 or AQP1, and its homolog in plants was first characterized in Arabidopsis, which is known as RD28, PIP2c, or AtPIP2;3[3,7,53]. Thus far, genome-wide identification of PIP genes have been reported in a high number of plant species, including two model plants Arabidopsis and rice[10,11,1317,5456]. By contrast, little information is available on Cyperaceae, the third largest family within the monocot clade that possesses more than 5,600 species[57].

    Given the crucial roles of water balance for tuber development and crop production, in this study, tigernut, a representative Cyperaceae plant producing high amounts of oil in underground tubers[28,30,32], was employed to study PIP genes. A number of 14 PIP genes representing two phylogenetic groups (i.e., PIP1 and PIP2) or 12 orthogroups (i.e., PIP1A, PIP1B, PIP1C, PIP2A, PIP2B, PIP2C, PIP2D, PIP2E, PIP2F, PIP2G, PIP2H, and PIP2I) were identified from the tigernut genome. Though the family amounts are comparative or less than 13–21 present in Arabidopsis, cassava (Manihot esculenta), rubber tree (Hevea brasiliensis), poplar (Populus trichocarpa), C. cristatella, R. breviuscula, banana (Musa acuminata), maize (Zea mays), sorghum (Sorghum bicolor), barley (Hordeum vulgare), and switchgrass (Panicum virgatum), they are relatively more than four to 12 found in eelgrass (Zostera marina), Brachypodium distachyon, foxtail millet (Setaria italic), J. effuses, Aquilegia coerulea, papaya (Carica papaya), castor been (Ricinus communis), and physic nut (Jatropha curcas) (Supplemental Table S4). Among them, A. coerulea represents a basal eudicot that didn't experience the γ WGD shared by all core eudicots[50], whereas eelgrass is an early diverged aquatic monocot that didn't experience the τ WGD shared by all core monocots[56]. Interestingly, though both species possess two PIP1s and two PIP2s, they were shown to exhibit complex orthologous relationships of 1:1, 2:2, 1:0, and 0:1 (Supplemental Table S5). Whereas AcPIP1;1/AcPIP1;2/ZmPIP1;1/ZmPIP1;2 and ZmPIP2;1/AcPIP2;1 belong to PIP1A and PIP2A identified in this study, AcPIP2;2 and ZmPIP2;2 belong to PIP2H and PIP2I, respectively (Supplemental Table S5), implying that the last common ancestor of monocots and eudicots possesses only one PIP1 and two PIP2s followed by clade-specific expansion. A good example is the generation of AtPIP1;1 and -2;6 from AtPIP1;5 and -2;1 via the γ WGD, respectively[17].

    In tigernut, extensive expansion of the PIP subfamily was contributed by WGD (2), transposed (2), tandem (5), and dispersed duplications (3). It's worth noting that, two transposed repeats (i.e., CePIP1;1/-1;3 and CePIP2;1/-2;8) are shared by rice, implying their early origin that may be generated sometime after the split with the eudicot clade but before Cyperaceae-Poaceae divergence. By contrast, two WGD repeats (i.e., CePIP1;1/-1;2 and CePIP2;2/-2;4) are shared by C. cristatella, R. breviuscula, and J. effusus but not rice and Arabidopsis, implying that they may be derived from WGDs that occurred sometime after Cyperaceae-Poaceae split but before Cyperaceae-Juncaceae divergence. The possible WGD is the one that was described in C. littledalei[58], though the exact time still needs to be studied. Interestingly, compared with Arabidopsis (1) and rice (2), tandem/proximal duplications played a more important role in the expansion of PIP genes in tigernut (5) as well as other Cyperaceae species tested (5–6), which were shown to be Cyperaceae-specific or even species-specific. These tandem repeats may play a role in the adaptive evolution of Cyperaceae species as described in a high number of plant species[14,41]. According to comparative genomics analyses, tandem duplicates experienced stronger selective pressure than genes formed by other modes (WGD, transposed duplication, and dispersed duplication) and evolved toward biased functional roles involved in plant self-defense[41].

    As observed in most species such as Arabidopsis[10,1417], PIP genes in all Cyperaceae and Juncaceae species examined in this study, i.e., tigernut, C. cristatella, R. breviuscula, and J. effuses, feature three introns with conserved positions. By contrast, zero to three introns was not only found in rice but also in other Poaceae species such as maize, sorghum, foxtail millet, switchgrass, B. distachyon, and barley[54,55], implying lineage/species-specific evolution.

    Despite the extensive expansion of PIP genes (PIP2) in tigernut even after the split with R. breviuscula, CePIP1;1, -2;1, and -2;8 were shown to represent three dominant members in most tissues examined in this study, i.e., young leaf, mature leaf, sheath, rhizome, shoot apex, and tuber, though the situation in root is more complex. CePIP1;1 was characterized as a transposed repeat of CePIP1;3, which represents the most expressed member in root. Moreover, its recent WGD repeat CePIP1;2 was shown to be lowly expressed in most tested tissues, implying their divergence. The ortholog of CePIP1;1 in rice is OsPIP1;3 (RWC-3), which was shown to be preferentially expressed in roots, stems, and leaves, in contrast to constitutive expression of OsPIP1;1 (OsPIP1a) and -1;2[5961], two recent WGD repeats. Injecting the cRNA of OsPIP1;3 into Xenopus oocytes could increase the osmotic water permeability by 2–3 times[60], though the activity is considerably lower than PIP2s such as OsPIP2;2 and -2;2[6163]. Moreover, OsPIP1;3 was shown to play a role in drought avoidance in upland rice and its overexpression in lowland rice could increase root osmotic hydraulic conductivity, leaf water potential, and relative cumulative transpiration at the end of 10 h PEG treatment[64]. CePIP2;8 was characterized as a transposed repeat of CePIP2;1. Since their orthologs are present in both rice and Arabidopsis (Supplemental Table S3), the duplication event is more likely to occur sometime before monocot-eudicot split. Interestingly, their orthologs in rice, i.e., OsPIP2;1 (OsPIP2a) and -2;6, respectively, are also constitutively expressed[61], implying a conserved evolution with similar functions. When heterologously expressed in yeast, OsPIP2;1 was shown to exhibit high water transport activity[62,6466]. Moreover, root hydraulic conductivity was decreased by approximately four folds in OsPIP2;1 RNAi knock-down rice plants[64]. The water transport activity of OsPIP2;6 has not been tested, however, it was proven to be an H2O2 transporter that is involved in resistance to rice blast[61]. More work especially transgenic tests may improve our knowledge of the function of these key CePIP genes.

    Leaf is a photosynthetic organ that regulates water loss through transpiration. In tigernut, PIP transcripts in leaves were mainly contributed by CePIP1;1, -2;1, and -2;8, implying their key roles. During leaf development, in contrast to gradual decrease of CePIP1;1 and -2;8 transcripts in three stages (i.e. young, mature, and senescing) examined in this study, CePIP2;1 peaked in mature leaves. Their high abundance in young leaves is by cell elongation and enlargement at this stage, whereas upregulation of CePIP2;1 in mature leaves may inform its possible role in photosynthesis[67]. Thus far, a high number of CO2 permeable PIPs have been identified, e.g., AtPIP2;1, HvPIP2;1, HvPIP2;2, HvPIP2;3, HvPIP2;5, and SiPIP2;7[6870]. Moreover, in mature leaves, CePIP1;1, -2;1, and -2;8 were shown to exhibit an apparent diurnal fluctuation expression pattern that was expressed more in the day and usually peaked at noon, which reflects transpiration and the fact that PIP genes are usually induced by light[11,7173]. In rice, OsPIP2;4 and -2;5 also showed a clear diurnal fluctuation in roots that peaked at 3 h after the onset of light and dropped to a minimum 3 h after the onset of darkness[11]. Notably, further studies showed that temporal and dramatic induction of OsPIP2;5 around 2 h after light initiation was triggered by transpirational demand but not circadian rhythm[74].

    As an oil-bearing tuber crop, the main economic goal of tigernut cultivation is to harvest underground tubers, whose development is highly dependent on water available[32,75]. According to previous studies, the moisture content of immature tigernut tubers maintains more than 80.0%, followed by a seed-like dehydration process with a drop of water content to less than 50% during maturation[28,32]. Thereby, the water balance in developmental tubers must be tightly regulated. Like leaves, the majority of PIP transcripts in tubers were shown to be contributed by CePIP1;1, -2;1, and -2;8, which was further confirmed at the protein level. In accordance with the trend of water content during tuber development, mRNA, and protein abundances of CePIP1;1, -2;1, and -2;8 in initiation and swelling tubers were considerably higher than that at the mature stage. High abundances of CePIP1;1, -2;1, and -2;8 at the initiation stage reflects rapid cell division and elongation, whereas upregulation of CePIP1;1 and -2;1 at the swelling stage is in accordance with cell enlargement and active physiological metabolism such as rapid oil accumulation[28,30]. At the mature stage, downregulation of PIP transcripts and protein abundances resulted in a significant drop in the moisture content, which is accompanied by the significant accumulation of late embryogenesis-abundant proteins[23,32]. The situation is highly distinct from other tuber plants such as potato (Solanum tuberosum), which may contribute to the difference in desiccation resistance between two species[32,76]. It's worth noting that, in one study, CePIP2;1 was not detected in any of the four tested stages, i.e., freshly harvested, dried, rehydrated for 48 h, and sprouted tubers[23]. By contrast, it was quantified in all three stages of tuber development examined in this study, i.e., 1, 25, and 35 DAI (corresponding to freshly harvested tubers), which represent initiation, swelling, and maturation. One possible reason is that the protein abundance of CePIP2;1 in mature tubers is not high enough to be quantified by nanoLC-MS/MS, which is relatively less sensitive than 4D-PRM used in this study[30,46]. In fact, nanoLC-MS/MS-based proteomic analysis of 30 samples representing six tissues/stages only resulted in 2,257 distinct protein groups[23].

    Taken together, our results imply a key role of CePIP1;1, -2;1, and -2;8 in tuber water balance, however, the mechanism underlying needs to be further studied, e.g., posttranslational modifications, protein interaction patterns, and transcriptional regulators.

    To our knowledge, this is the first genome-wide characterization of PIP genes in tigernut, a representative Cyperaceae plant with oil-bearing tubers. Fourteen CePIP genes representing two phylogenetic groups or 12 orthogroups are relatively more than that present in two model plants rice and Arabidopsis, and gene expansion was mainly contributed by WGD and transposed/tandem duplications, some of which are lineage or even species-specific. Among these genes, CePIP1;1, -2;1, and -2;8 have evolved to be three dominant members that are constitutively expressed in most tissues, including leaf and tuber. Transcription of these three dominant members in leaves are subjected to development and diurnal regulation, whereas in tubers, their mRNA and protein abundances are positively correlated with the moisture content during tuber development. Moreover, their plasma membrane-localization was confirmed by subcellular localization analysis, implying that they may function in the cell membrane. These findings shall not only provide valuable information for further uncovering the mechanism of tuber water balance but also lay a solid foundation for genetic improvement by regulating these key PIP members in tigernut.

    The authors confirm contribution to the paper as follows: study conception and design, supervision: Zou Z; analysis and interpretation of results: Zou Z, Zheng Y, Xiao Y, Liu H, Huang J, Zhao Y; draft manuscript preparation: Zou Z, Zhao Y. All authors reviewed the results and approved the final version of the manuscript.

    All the relevant data is available within the published article.

    This work was supported by the Hainan Province Science and Technology Special Fund (ZDYF2024XDNY171 and ZDYF2024XDNY156), China; the National Natural Science Foundation of China (32460342, 31971688 and 31700580), China; the Project of Sanya Yazhou Bay Science and Technology City (SCKJ-JYRC-2022-66), China. The funders had no role in study design, data collection and analysis, decision to publish, or preparation of the manuscript.

  • The authors declare that they have no conflict of interest.

  • [1]

    Makkar HPS. 2018. Feed demand landscape and implications of food-not feed strategy for food security and climate change. Animal 12:1744−54

    doi: 10.1017/S175173111700324X

    CrossRef   Google Scholar

    [2]

    Amata I. 2014. The use of non-conventional feed resources (NCFR) for livestock feeding in the tropics: a review. Journal of Global Biosciences 3(2):604−13

    Google Scholar

    [3]

    Jiménez-Moreno E, González-Alvarado JM, de Coca-Sinova A, Lázaro RP, Cámara L, et al. 2019. Insoluble fiber sources in mash or pellets diets for young broilers. 2. Effects on gastrointestinal tract development and nutrient digestibility. Poultry Science 98:2531−47

    doi: 10.3382/ps/pey599

    CrossRef   Google Scholar

    [4]

    Jiménez-Moreno E, de Coca-Sinova A, González-Alvarado JM, Mateos GG. 2016. Inclusion of insoluble fiber sources in mash or pellet diets for young broilers. 1. Effects on growth performance and water intake. Poultry Science 95:41−52

    doi: 10.3382/ps/pev309

    CrossRef   Google Scholar

    [5]

    Luo X, Wang Q, Zheng B, Lin L, Chen B, et al. 2017. Hydration properties and binding capacities of dietary fibers from bamboo shoot shell and its hypolipidemic effects in mice. Food and Chemical Toxicology 109:1003−9

    doi: 10.1016/j.fct.2017.02.029

    CrossRef   Google Scholar

    [6]

    Shang Q, Liu S, Liu H, Mahfuz S, Piao X. 2021. Impact of sugar beet pulp and wheat bran on serum biochemical profile, inflammatory responses and gut microbiota in sows during late gestation and lactation. Journal of Animal Science and Biotechnology 12:54

    doi: 10.1186/s40104-021-00573-3

    CrossRef   Google Scholar

    [7]

    Adibmoradi M, Navidshad B, Faseleh Jahromi M. 2016. The effect of moderate levels of finely ground insoluble fibre on small intestine morphology, nutrient digestibility and performance of broiler chickens. Italian Journal of Animal Science 15:310−17

    doi: 10.1080/1828051X.2016.1147335

    CrossRef   Google Scholar

    [8]

    Kheravii SK, Swick RA, Choct M, Wu SB. 2017. Dietary sugarcane bagasse and coarse particle size of corn are beneficial to performance and gizzard development in broilers fed normal and high sodium diets. Poultry Science 96:4006−16

    doi: 10.3382/ps/pex225

    CrossRef   Google Scholar

    [9]

    Rezaei M, Torshizi MAK, Rouzbehan Y. 2011. The influence of different levels of micronized insoluble fiber on broiler performance and litter moisture. Poultry Science 90:2008−12

    doi: 10.3382/ps.2011-01352

    CrossRef   Google Scholar

    [10]

    Donadelli RA, Stone DA, Aldrich CG, Beyer RS. 2019. Effect of fiber source and particle size on chick performance and nutrient utilization. Poultry Science 98:5820−30

    doi: 10.3382/ps/pez382

    CrossRef   Google Scholar

    [11]

    Singh AK, Kim WK. 2021. Effects of dietary fiber on nutrients utilization and gut health of poultry: a review of challenges and opportunities. Animals 11:181

    doi: 10.3390/ani11010181

    CrossRef   Google Scholar

    [12]

    Nassar MK, Lyu S, Zentek J, Brockmann GA. 2019. Dietary fiber content affects growth, body composition, and feed intake and their associations with a major growth locus in growing male chickens of an advanced intercross population. Livestock Science 227:135−42

    doi: 10.1016/j.livsci.2019.07.015

    CrossRef   Google Scholar

    [13]

    Sozcu A. 2019. Growth performance, pH value of gizzard, hepatic enzyme activity, immunologic indicators, intestinal histomorphology, and cecal microflora of broilers fed diets supplemented with processed lignocellulose. Poultry Science 98:6880−87

    doi: 10.3382/ps/pez449

    CrossRef   Google Scholar

    [14]

    He MX, Wang JL, Qin H, Shui ZX, Zhu QL, et al. 2014. Bamboo: A new source of carbohydrate for biorefinery. Carbohydrate Polymers 111:645−54

    doi: 10.1016/j.carbpol.2014.05.025

    CrossRef   Google Scholar

    [15]

    Lancefield CS, Panovic I, Deuss PJ, Barta K, Westwood NJ. 2017. Pre-treatment of lignocellulosic feedstocks using biorenewable alcohols: towards complete biomass valorisation. Green Chemistry 19:202−14

    doi: 10.1039/C6GC02739C

    CrossRef   Google Scholar

    [16]

    Sims JA, Parsons JL, Bissell HA, Sikes RS, Ouellette JR, et al. 2007. Determination of bamboo-diet digestibility and fecal output by giant pandas. Ursus 18:38−45

    doi: 10.2192/1537-6176(2007)18[38:DOBDAF]2.0.CO;2

    CrossRef   Google Scholar

    [17]

    Felisberto MHF, Miyake PSE, Beraldo AL, Clerici MTPS. 2017. Young bamboo culm: Potential food as source of fiber and starch. Food Research International 101:96−102

    doi: 10.1016/j.foodres.2017.08.058

    CrossRef   Google Scholar

    [18]

    Ge Q, Li H, Wu P, Sha R, Xiao Z, et al. 2020. Investigation of physicochemical properties and antioxidant activity of ultrafine bamboo leaf powder prepared by ball milling. Journal of Food Processing and Preservation 44:e14506

    doi: 10.1111/jfpp.14506

    CrossRef   Google Scholar

    [19]

    Wu W, Hu J, Gao H, Chen H, Fang X, et al. 2020. The potential cholesterol-lowering and prebiotic effects of bamboo shoot dietary fibers and their structural characteristics. Food Chemistry 332:127372

    doi: 10.1016/j.foodchem.2020.127372

    CrossRef   Google Scholar

    [20]

    Okano K, Ohkoshi N, Nishiyama A, Usagawa T, Kitagawa M. 2009. Improving the nutritive value of madake bamboo, Phyllostachys bambusoides, for ruminants by culturing with the white-rot fungus Ceriporiopsis subvermispora. Animal Feed Science and Technology 152:278−85

    doi: 10.1016/j.anifeedsci.2009.04.021

    CrossRef   Google Scholar

    [21]

    Oguri M, Okano K, Ieki H, Kitagawa M, Tadokoro O, et al. 2013. Feed intake, digestibility, nitrogen utilization, ruminal condition and blood metabolites in wethers fed ground bamboo pellets cultured with white‐rot fungus (Ceriporiopsis subvermispora) and mixed with soybean curd residue and soy sauce cake. Animal Science Journal 84:650−55

    doi: 10.1111/asj.12054

    CrossRef   Google Scholar

    [22]

    Aftab U, Bedford MR. 2018. The use of NSP enzymes in poultry nutrition: myths and realities. World's Poultry Science Journal 74:277−86

    doi: 10.1017/S0043933918000272

    CrossRef   Google Scholar

    [23]

    Zhao G, Zhang R, Dong L, Huang F, Tang X, et al. 2018. Particle size of insoluble dietary fiber from rice bran affects its phenolic profile, bioaccessibility and functional properties. LWT 87:450−56

    doi: 10.1016/j.lwt.2017.09.016

    CrossRef   Google Scholar

    [24]

    Bao K, Wang K, Wang X, Zhang T, Liu H, et al. 2017. Effects of dietary manganese supplementation on nutrient digestibility and production performance in male sika deer (Cervus Nippon). Animal Science Journal 88:463−67

    doi: 10.1111/asj.12657

    CrossRef   Google Scholar

    [25]

    Zhao JB, Zhang G, Dong WX, Zhang Y, Wang JJ, et al. 2019. Effects of dietary particle size and fiber source on nutrient digestibility and short chain fatty acid production in cannulated growing pigs. Animal Feed Science and Technology 258:114310

    doi: 10.1016/j.anifeedsci.2019.114310

    CrossRef   Google Scholar

    [26]

    Speroni CS, Bender ABB, Stiebe J, Ballus CA, Ávila PF, et al. 2020. Granulometric fractionation and micronization: A process for increasing soluble dietary fiber content and improving technological and functional properties of olive pomace. LWT 130:109526

    doi: 10.1016/j.lwt.2020.109526

    CrossRef   Google Scholar

    [27]

    Malyar RM, Naseri E, Li H, Ali I, Farid RA, et al. 2021. Hepatoprotective effects of selenium-enriched probiotics supplementation on heat-stressed wistar rat through anti-inflammatory and antioxidant effects. Biological Trace Element Research 199:3445−56

    doi: 10.1007/s12011-020-02475-3

    CrossRef   Google Scholar

    [28]

    Mohammad Malyar R, Li H, Enayatullah H, Hou L, Ahmad Farid R, et al. 2019. Zinc-enriched probiotics enhanced growth performance, antioxidant status, immune function, gene expression, and morphological characteristics of Wistar rats raised under high ambient temperature. 3 Biotech 9:291

    doi: 10.1007/s13205-019-1819-0

    CrossRef   Google Scholar

    [29]

    Malyar RM, Wei Q, Hou L, Elsaid SH, Zhang Y, et al. 2024. Fermented bamboo powder activates gut odorant receptors, and promotes intestinal health and growth performance of dwarf yellow-feathered broiler chickens. Poultry Science 103:103570

    doi: 10.1016/j.psj.2024.103570

    CrossRef   Google Scholar

    [30]

    Okrathok S, Khempaka S. 2020. Modified-dietary fiber from cassava pulp reduces abdominal fat and meat cholesterol contents without affecting growth performance of broiler chickens. Journal of Applied Poultry Research 29:229−39

    doi: 10.1016/j.japr.2019.10.009

    CrossRef   Google Scholar

    [31]

    Shirzadegan K, Taheri HR. 2017. Insoluble Fibers Affected the Performance, Carcass Characteristics and Serum Lipid of Broiler Chickens Fed Wheat-Based Diet. Iranian Journal of Applied Animal Science 7:109−17

    Google Scholar

    [32]

    Röhe I, Metzger F, Vahjen W, Brockmann GA, Zentek J. 2020. Effect of feeding different levels of lignocellulose on performance, nutrient digestibility, excreta dry matter, and intestinal microbiota in slow growing broilers. Poultry Science 99:5018−26

    doi: 10.1016/j.psj.2020.06.053

    CrossRef   Google Scholar

    [33]

    Reyns GE, Janssens KA, Buyse J, Kühn ER, Darras VM. 2002. Changes in thyroid hormone levels in chicken liver during fasting and refeeding. Comparative Biochemistry and Physiology Part B: Biochemistry and Molecular Biology 132:239−45

    doi: 10.1016/S1096-4959(01)00528-0

    CrossRef   Google Scholar

    [34]

    Anh NTL, Kunhareang S, Duangjinda M. 2015. Association of chicken growth hormones and insulin-like growth factor gene polymorphisms with growth performance and carcass traits in Thai broilers. Asian-Australasian Journal of Animal Sciences 28:1686−95

    doi: 10.5713/ajas.15.0028

    CrossRef   Google Scholar

    [35]

    Balan P, Sik-Han K, Moughan PJ. 2019. Impact of oral immunoglobulins on animal health-A review. Animal Science Journal 90:1099−110

    doi: 10.1111/asj.13258

    CrossRef   Google Scholar

    [36]

    Murtaugh MP, Baarsch MJ, Zhou Y, Scamurra RW, Lin G. 1996. Inflammatory cytokines in animal health and disease. Veterinary Immunology and Immunopathology 54:45−55

    doi: 10.1016/S0165-2427(96)05698-X

    CrossRef   Google Scholar

    [37]

    Ogbuewu IP, Emenalom OO, Okoli IC. 2017. Alternative feedstuffs and their effects on blood chemistry and haematology of rabbits and chickens: a review. Comparative Clinical Pathology 26:277−86

    doi: 10.1007/s00580-015-2210-0

    CrossRef   Google Scholar

    [38]

    Ali I, Raza A, Ahmad MA, Li L. 2022. Nutrient sensing mechanism of short-chain fatty acids in mastitis control. Microbial Pathogenesis 170:105692

    doi: 10.1016/j.micpath.2022.105692

    CrossRef   Google Scholar

    [39]

    Takayanagi K. 2011. Prevention of Adiposity by the Oral Administration of β-Cryptoxanthin. Frontiers in Neurology 2:67

    doi: 10.3389/fneur.2011.00067

    CrossRef   Google Scholar

    [40]

    Liu Z, Li N, Zhou X, Zheng Z, Zhang C, et al. 2022. Effects of Fermented Bamboo Powder Supplementation on Serum Biochemical Parameters, Immune Indices, and Fecal Microbial Composition in Growing-Finishing Pigs. Animals 12:3127

    doi: 10.3390/ani12223127

    CrossRef   Google Scholar

    [41]

    Chu GM, Jung CK, Kim HY, Ha JH, Kim JH, et al. 2013. Effects of bamboo charcoal and bamboo vinegar as antibiotic alternatives on growth performance, immune responses and fecal microflora population in fattening pigs. Animal Science Journal 84:113−20

    doi: 10.1111/j.1740-0929.2012.01045.x

    CrossRef   Google Scholar

    [42]

    de Sousa-Pereira P, Woof JM. 2019. IgA: Structure, Function, and Developability. Antibodies 8:57

    doi: 10.3390/antib8040057

    CrossRef   Google Scholar

    [43]

    Heim KE, Tagliaferro AR, Bobilya DJ. 2002. Flavonoid antioxidants: chemistry, metabolism and structure-activity relationships. The Journal of Nutritional Biochemistry 13:572−84

    doi: 10.1016/S0955-2863(02)00208-5

    CrossRef   Google Scholar

    [44]

    Zhang R, Shi X, Liu J, Jiang Y, Wu Y, et al. 2022. The effects of bamboo leaf flavonoids on growth performance, immunity, antioxidant status, and intestinal microflora of Chinese mitten crabs (Eriocheir sinensis). Animal Feed Science and Technology 288:115297

    doi: 10.1016/j.anifeedsci.2022.115297

    CrossRef   Google Scholar

    [45]

    Xie Z, Yu G, Yun Y, Zhang X, Shen M, et al. 2022. Effects of bamboo leaf extract on energy metabolism, antioxidant capacity, and biogenesis of small intestine mitochondria in broilers. Journal of Animal Science 101:skac391

    doi: 10.1093/jas/skac391

    CrossRef   Google Scholar

    [46]

    Shen M, Xie Z, Jia M, Li A, Han H, et al. 2019. Effect of Bamboo Leaf Extract on Antioxidant Status and Cholesterol Metabolism in Broiler Chickens. Animals 9:699

    doi: 10.3390/ani9090699

    CrossRef   Google Scholar

    [47]

    Jundi D, Coutanceau JP, Bullier E, Imarraine S, Fajloun Z, et al. 2023. Expression of olfactory receptor genes in non-olfactory tissues in the developing and adult zebrafish. Scientific Reports 13:4651

    doi: 10.1038/s41598-023-30895-3

    CrossRef   Google Scholar

    [48]

    Jiang Y, Gong NN, Hu XS, Ni MJ, Pasi R, et al. 2015. Molecular profiling of activated olfactory neurons identifies odorant receptors for odors in vivo. Nature Neuroscience 18:1446−54

    doi: 10.1038/nn.4104

    CrossRef   Google Scholar

    [49]

    Pluznick JL, Zou DJ, Zhang X, Yan Q, Rodriguez-Gil DJ, et al. 2009. Functional expression of the olfactory signaling system in the kidney. Proceedings of the National Academy of Sciences of the United States of America 106:2059−64

    doi: 10.1073/pnas.0812859106

    CrossRef   Google Scholar

    [50]

    Grison A, Zucchelli S, Urzì A, Zamparo I, Lazarevic D, et al. 2014. Mesencephalic dopaminergic neurons express a repertoire of olfactory receptors and respond to odorant-like molecules. BMC Genomics 15:729

    doi: 10.1186/1471-2164-15-729

    CrossRef   Google Scholar

    [51]

    Morton GJ, Meek TH, Schwartz MW. 2014. Neurobiology of food intake in health and disease. Nature Reviews Neuroscience 15:367−78

    doi: 10.1038/nrn3745

    CrossRef   Google Scholar

    [52]

    Imoto D, Yamamoto I, Matsunaga H, Yonekura T, Lee ML, et al. 2021. Refeeding activates neurons in the dorsomedial hypothalamus to inhibit food intake and promote positive valence. Molecular Metabolism 54:101366

    doi: 10.1016/j.molmet.2021.101366

    CrossRef   Google Scholar

    [53]

    Chen WY, Peng XL, Deng QS, Chen MJ, Du JL, et al. 2019. Role of olfactorily responsive neurons in the right dorsal habenula-ventral interpeduncular nucleus pathway in food-seeking behaviors of larval zebrafish. Neuroscience 404:259−67

    doi: 10.1016/j.neuroscience.2019.01.057

    CrossRef   Google Scholar

    [54]

    Stamatakis AM, Van Swieten M, Basiri ML, Blair GA, Kantak P, et al. 2016. Lateral hypothalamic area glutamatergic neurons and their projections to the lateral habenula regulate feeding and reward. The Journal of Neuroscience 36:302−11

    doi: 10.1523/JNEUROSCI.1202-15.2016

    CrossRef   Google Scholar

    [55]

    London E, Wester JC, Bloyd M, Bettencourt S, McBain CJ, et al. 2020. Loss of habenular Prkar2a reduces hedonic eating and increases exercise motivation. JCI Insight 5:141670

    doi: 10.1172/jci.insight.141670

    CrossRef   Google Scholar

    [56]

    Braun T, Voland P, Kunz L, Prinz C, Gratzl M. 2007. Enterochromaffin cells of the human gut: sensors for spices and odorants. Gastroenterology 132:1890−901

    doi: 10.1053/j.gastro.2007.02.036

    CrossRef   Google Scholar

    [57]

    Rogers GB, Keating DJ, Young RL, Wong ML, Licinio J, et al. 2016. From gut dysbiosis to altered brain function and mental illness: mechanisms and pathways. Molecular Psychiatry 21:738−48

    doi: 10.1038/mp.2016.50

    CrossRef   Google Scholar

  • Cite this article

    Malyar RM, Ding W, Wei Q, Sun J, Hou L, et al. 2024. Effects of fermented bamboo powder supplementation on gene expressions of antioxidant, odorant receptors, growth and immunity in yellow-feather broiler chickens. Animal Advances 1: e005 doi: 10.48130/animadv-0024-0005
    Malyar RM, Ding W, Wei Q, Sun J, Hou L, et al. 2024. Effects of fermented bamboo powder supplementation on gene expressions of antioxidant, odorant receptors, growth and immunity in yellow-feather broiler chickens. Animal Advances 1: e005 doi: 10.48130/animadv-0024-0005

Figures(13)  /  Tables(5)

Article Metrics

Article views(1621) PDF downloads(375)

RESEARCH ARTICLE   Open Access    

Effects of fermented bamboo powder supplementation on gene expressions of antioxidant, odorant receptors, growth and immunity in yellow-feather broiler chickens

Animal Advances  1 Article number: e005  (2024)  |  Cite this article

Abstract: Bamboo powder, an economically advantageous supplement for broiler diets, contains a significant amount of insoluble fiber, making its inclusion essential. This study aimed to investigate the effects of fermented bamboo powder (FBP) on the expression of genes related to antioxidants, odorant receptors, growth, and immunity in Yellow-Feathered Broiler chickens. Six hundred healthy 1-day-old chicks were randomly divided into two groups: Control (CON) and Fermented Bamboo Powder (FBP) supplementation. Each group consisted of 10 replicates, with 30 chicks per replicate. The CON group was fed a basal diet, while the FBP group received the basal diet supplemented with FBP across four distinct phases. The first two phases were designated as pretreatment, while the latter phases comprised the experimental period. Tissue samples were collected for analysis at the end of phase IV. The results revealed that supplementation with FBP (p < 0.05) significantly increased the mRNA levels of genes related to antioxidants, odorant receptors, growth, and immunity. Additionally, growth hormone levels, including IGF-1, GH, T4, and T3, were significantly higher (p < 0.01) in the FBP group compared to the control. Moreover, the FBP group exhibited a notable increase in biochemical markers (ALT, AST, and ALP) and immune indicators (IgA, IgG, IgM, IL-2, IL-6, and IL-1β), while levels of TNF-α, CREA, and UREA were significantly reduced (p < 0.01) compared to the control group. These findings highlight the potential of FBP as a natural supplement, positively influencing growth, immunity, and antioxidant mechanisms in broiler chickens.

    • The continued and sustainable development of the animal husbandry industry faces significant challenges due to diminishing resources and rising feed costs. The rapid expansion of the industry has created an urgent need to investigate non-traditional feed sources[15]. Compounded by China's policy prohibiting the use of growth-enhancing antibiotics in feed, there is a critical need to identify viable alternatives for promoting intestinal health and growth in animals[4,6,7]. A common alternative is the incorporation of appropriate amounts of insoluble dietary fiber into broiler diets, offering a range of benefits such as reducing bedding moisture, promoting stomach development, decreasing fat deposition, lowering gizzard pH, improving nutrient digestibility, and increasing consumption rates, all of which collectively stimulate chicken growth[3,812].

      While the positive impacts of processed lignocellulose supplementation on performance metrics have been demonstrated, variations in the effects of different fiber types in broiler feed highlight the importance of identifying reliable fiber sources[3,13]. Bamboo stands out as a prime candidate, being a naturally occurring, renewable resource with rapid growth rates and abundant yields. Its availability and distribution are extensive[14,15]. Remarkably, pandas demonstrate an apparent digestibility of 33.8% for crude protein and 31.8% for crude fiber when fed whole bamboo[16]. Bamboo powder, derived from bamboo, is rich in polysaccharides, leaf flavonoids, and insoluble dietary fiber[17,18], which impart regulatory effects on animal immune systems and antioxidant capacities. Additionally, fibers from bamboo shoot shells exhibit significant prebiotic potential and cholesterol adsorption activity, promoting the growth of lactic acid bacteria and enhancing substrate fermentability, particularly beneficial in conditions such as hyperlipidemia in mice[5,19]. The incorporation of bamboo powder into sheep and pig feed further substantiates its potential as a valuable fiber source[20,21].

      Historically, concerns have persisted regarding the negative impact of added fiber on overall nutrition, feed digestibility, and growth performance[22]. However, recent research has revealed positive outcomes associated with moderate levels of insoluble dietary fiber in broiler diets. Specifically, it helps lower litter moisture content and reduce fat deposition, while simultaneously enhancing broiler growth rates[8,12]. The inclusion of insoluble dietary fiber in the diet stimulates stomach development in chickens, improving nutrient utilization, and overall growth[10]. Similarly, supplementing low-fiber broiler diets with appropriate levels of structural insoluble dietary fiber yields comparable positive results[4].

      The impact of processing technology and fiber sources on the chemical composition and nutritional characteristics of fibers is an important consideration[10]. Micronization, a processing method, can alter the particle size distribution and functional properties of insoluble dietary fiber in rice bran, influencing the digestibility of the raw material. For instance, micronized rice bran exhibits improved water-holding capacity, swelling ability, phenol extraction efficiency, and oxidative stability[23]. Bionic digestion studies on wheat have shown that reducing grain size enhances the in vitro digestibility of both dry matter and crude protein[24]. Decreasing grain size improves the apparent ileal digestibility of total energy, dry matter, total fiber, and insoluble dietary fiber. Notably, significant interactions between grain size and fiber source have been observed, influencing hindgut fiber digestibility[25]. The selection of fiber sources is also crucial. A comparison of fibers extracted from bamboo shoot shells and bamboo stem powder revealed differences in lignin content. Ultra-micronization can increase soluble fiber components, reduce lignin levels, and enhance the water-holding capacity and fat adsorption properties of raw materials[26].

      Bamboo powder, known for its high content of insoluble dietary fiber, flavonoids, and polysaccharides, is a common feed ingredient in Chinese broiler diets. This study focuses on fermented bamboo powder (FBP) and aims to investigate its effects on Yellow-Feathered Broiler Chickens. Specifically, we aim to examine the impact of FBP supplementation on the expression of genes related to antioxidant activity, odorant receptors, growth, and immunity. The findings of this study are expected to provide valuable insights into the potential application of FBP in broiler diets, contributing to improvements in growth, health, and immune function.

    • This study aimed to evaluate the effects of fermented bamboo powder supplementation on the expression of genes associated with antioxidant activity, odorant receptors, growth, and immunity in Yellow-Feathered Broiler chickens. Six hundred healthy 1-day-old Yellow-Feathered Broiler chicks were randomly divided into two groups: Control (CON) and Fermented Bamboo Powder (FBP) supplementation groups. Each group consisted of 10 replicates, with 30 chicks per replicate. The CON group was fed a basal diet, while the FBP group received the basal diet supplemented with 1.0 g of FBP per kg of feed for phase I, 2.0 g for phase II, 4.0 g for phase III, and 6.0 g for phase IV. The first two phases were designated as the pretreatment period, followed by the experimental phase. Chickens, averaging 1.14 ± 5 kg in weight and of both genders with similar initial body weights, were used in the study. The experiment lasted 77 d, with the pretreatment phase extending from day 1 to day 45. The use of 45-day-old chickens enabled effective monitoring of growth and developmental changes over a relatively short duration. Tissue samples were collected at the conclusion of phase IV for analysis.

    • The basal and experimental diets were obtained from Jiangsu Yancheng Xiling Agricultural Science and Technology Co., Ltd. (Jiangsu, China), while the FBP used in the study was analyzed by Jiangsu Gaosheng Biological Feed Co., Ltd (Jiangsu, China). Details regarding the specific ingredients of FBP are provided in Table 1. The basal diets were formulated according to the nutritional requirements outlined by NRC (1994) for four phases. The CON group was fed the basal diet without supplementation, whereas the FBP group received varying levels of FBP (1.0, 2.0, 4.0, and 6.0 g/kg) during each phase. The composition of these diets is presented in Table 2.

      Table 1.  The composition of the fermented bamboo powder based on an as-fed basis.

      Testing item Fermented bamboo powder (FBP)
      Moisture 11.21%
      Crude protein 17.07%
      Coarse fiber 17.66%
      Crude fat 3.48%
      Coarse ash content 9.21%
      Acid soluble protein 7.13%
      Acid washing lignin 3.41%
      Calcium 0.12%
      Total phosphorus 0.02%
      Unknown substance 18.81%

      Table 2.  Basal diet ingredients and nutritional composition.

      Items Basal diet
      starter phase
      (1−22 d)
      Basal diet
      growth phase
      (23−45 d)
      Basal diet
      finisher phase
      (46−77 d)
      Corn 40.66 29.73 20.5
      Wheat 20 40 50
      DGYC 0 0 0
      Soybean meal (43%) 22.31 5.73 2.92
      Palm kernel meal 0 2 4
      Sunflower kernel meal (35%) 3 5 8
      Lard 0 0 6.03
      Rapeseed meal (38%) 3 4 0
      Corn gluten meal (60%) 4 5 4.4
      Rice husk oil 2.31 4.22 0
      Calcium bisphosphate 1.4 1.03 0.87
      Limestone 1.18 1.12 1.13
      Liquid methionine (88%) 0.14 0.23 0.15
      Premix* 2 2 2
      Total 100 100 100
      Calculation of nutrients
      Metabolizable energy (MJ/kg) 285.6 300.8 307.6
      Crude protein 21.14% 20.87% 20.23%
      Crude fat 4.048% 4.41% 4.53%
      Methionine 0.486% 0.764% 0.491%
      Lysine 1.097% 1.364% 1.13%
      Calcium (%) 0.989% 0.962% 0.97%
      Available phosphorus 0.485% 0.51% 0.45%
      * Premix provides the following nutrients (per kilogram of diet): choline, 1 g; enzyme complex, 300 mg; broiler multivitamin, 300 mg; glyceryl tributyrate, 300 mg; probiotics, 200 mg; organomineral, 400 mg; phytase, 200 mg ; NaCl, 2.8 g; vitamin A, 9800 IU; vitamin D3, 2500 IU; vitamin E, 60 IU; vitamin K, 2.3 mg; vitamin B1, 2 mg; vitamin B2, 6 mg; vitamin B6, 4 mg; vitamin B12, 0.02 mg; nicotinic acid, 45 mg; pantothenic acid, 20 mg; folic acid, 1.25 mg; biotin, 0.02 mg; Fe, 75 mg ; Cu, 8 mg; Mn, 75 mg; Zn 60 mg; Cu, 8 mg; Se, 0.3 mg; Co, 0.3 mg.
    • Upon completion of the 77-d experiment, humane slaughter procedures were followed. Blood samples were collected for the evaluation of hormone levels (IGF-1, GH, T3, and T4). Plasma was separated after centrifugation for the analysis of immune indices and serum biochemical markers. Tissues from the liver, heart, spleen, muscle, gizzard, proventriculus, hypothalamus, and small intestine (jejunum) were rapidly frozen for subsequent mRNA expression analysis of specific genes, including β-actin, IGF-1, IGF-2, IGFBP-1, IGFBP-2, IGFBP-3, cGH, IL-10, IL-2, IL-6, SOD1, CAT, GPx1, COR1, COR2, COR4, COR6, COR8, COR9, OR52R1, OR51M1, OR1F2P, OR5AP2, and OR14J1L112, following excision and rinsing.

    • To quantify the concentrations of IGF-1, GH, T3, and T4 in liver, muscle, and serum, an enzyme-linked immunosorbent assay (ELISA) was employed. Initially, tissues were meticulously ground, weighed, and subsequently diluted with PBS buffer (1:9 ratio). The resulting mixture underwent centrifugation (2,000–3,000 rpm for 20 min), and the collected supernatant was carefully extracted for further analysis. ELISA procedures involved the preparation of standard wells, sequential addition of samples with diluent and enzyme label reagent, followed by a 60-min incubation period. After incubation, the plate underwent multiple washes with a washing solution to remove unbound substances. Color reagent and stop solution were added to each well, and the optical density (OD) value of each well was measured using an enzyme-labeled instrument. Utilizing a standard curve, the concentrations of IGF-1, GH, T3, and T4 in liver, muscle, and serum were calculated, providing a quantitative assessment of these peptides.

    • The levels of IgA, IgG, IgM, IL-1β, IL-2, IL-6, IL-10, and IFN-γ in serum samples were determined using Enzyme-Linked Immunosorbent Assay (ELISA) kits, following the manufacturer's instructions (Nanjing Aoqing Biotechnology Co., Ltd., Nanjing, China). The concentrations were reported in ng/ml.

    • Serum concentrations of Alanine transaminase (ALT), Alkaline phosphatase (ALP), Aspartate aminotransferase (AST), UREA, and CREA were measured using commercially available kits according to the manufacturer's protocols (Nanjing Aoqing Biotechnology Co., Ltd., Nanjing, China), offering insights into the enzymatic activity within the FBP-treated group.

    • The primer sequences were designed to be 18 to 20 base pairs in length, with an annealing temperature set between 55 and 58 °C. The GC content was kept at 20%, and the expected product size ranged from 150 to 200 base pairs. The integrity of the cDNA from tissues of yellow broiler chickens was verified through PCR amplification using β-actin as the reference gene on a StepOnePlus Real-Time PCR system (Applied Biosystems, USA). PCR amplification was performed with cDNA as the template in a total reaction volume of 20 μl, consisting of 11.6 μl of nuclease-free water, 4 μl of MyTaq Reaction Buffer, 0.4 μl of MyTaq DNA Polymerase, 1 μl (10 mM) of each forward and reverse OR primer, and 2 μl (20 ng/μl) of cDNA template. The PCR cycling protocol included an initial denaturation at 95 °C for 1 min, followed by 35 cycles of denaturation at 95 °C for 30 s, annealing at 55 °C for 30 s, and extension at 72 °C for 20 s, with a final extension at 72 °C for 7 min. The resulting PCR products were analyzed on a 1.5% agarose gel.

    • The real-time quantitative PCR technique was used to evaluate the mRNA expression levels of 11 genes in Yellow-Feathered Broiler chickens, including β-actin, IGF-1, IGFBP-1, IGFBP-3, cGH, IL-10, IL-2, IL-6, SOD1, CAT, and GPx1, as well as 11 olfactory receptor-related genes (ORs), such as COR1, COR2, COR4, COR6, COR8, COR9, OR52R1, OR51M1, OR1F2P, OR5AP2, and OR14J1L112. Gene-specific primers were designed using primer software, based on Gallus gallus sequences from the NCBI database (Table 3).To ensure accurate normalization and facilitate comparisons across different samples, the reference gene β-actin, known for its stable expression, was included. The primer for β-actin was also designed based on gallus gallus β-actin sequences in the NCBI database. Real-time quantitative PCR with the designed primers enabled determination of relative mRNA expression levels for the 13 genes of interest along with β-actin. Total RNA extraction from frozen liver, heart, spleen, and breast muscle tissue samples employed RNAiso Plus (TaKaRa) reagent following the manufacturer's protocol. The concentration and quality of extracted total RNA were assessed using a micro-spectrophotometer (Thermo Scientific). The RNA samples, dissolved in Diethyl pyrocarbonate (DEPC) water, were analyzed for concentration and purity. First-strand cDNA was synthesized from total RNA using 5× PrimeScript RT Master Mix and RNase-free water (TaKaRa). Real-time PCR reactions were carried out with a mixture of 2× SYBR Green I PCR Master Mix (TaKaRa BIO INC), Rox Reference Dye 1, primers, cDNA, and PCR-grade water. Amplification and detection were performed using SYBR Green I fluorescent dye on a StepOnePlus Real-Time PCR system (Applied Biosystems), following the established cycling conditions. Data analysis utilized the ΔCt method, which involved calculating the difference in Ct values between the target gene and β-actin. Gene expression was determined using the 2−ΔΔCᴛ equation. RNA samples were stored at −80 °C until further use[27,28].

      Table 3.  Primers used for Real-Time Quantitative PCR.

      Genes NCBI gene ID Primer Sequence Product length (bp)
      β-actin NM_205518.2 Forward GCCCTCTTCCAGCCATCTTT 150
      Reverse CAATGGAGGGTCCGGATTCA
      CAT NM_001031215.2 Forward GGTAACTGGGATCTTGTGGGA 112
      Reverse CCTTCAAATGAGTCTGAGGGTTC
      CGH NM_204359.2 Forward TGAGAAACTAAAGGACCTGGAAGA 110
      Reverse TGTCGAACTTATCGTAGGTGGG
      GPX1 NM_001277853.3 Forward GCCCGCACCTCTGTCATAC 156
      Reverse GCTTCTCCAGGCTGTTCCC
      IGF1 NM_001004384.3 Forward AGTTCGTATGTGGAGACAGAGGC 83
      Reverse TCCCTTGTGGTGTAAGCGTC
      IGF2 NM_001030342.5 Forward TGCCAACAACCTTGACACCT 98
      Reverse GGCCTCACTACCCAAACCTC
      IGFBP1 NM_001001294.2 Forward GCAAGATCAGGTCCTCCAGTC 199
      Reverse AGTAGCATCATTTCTCCAGCGTA
      IGFBP2 NM_205359.2 Forward GCATGAAGGAGATGGCGGT 99
      Reverse TCTTTGAGTCCTCGTGGTTGTG
      IGFBP3 NM_001395957.1 Forward ATCAGGAAAGAGCAAGCCAAA 121
      Reverse TACGACAGGGACCATATTCAGTT
      IL-2 NM_204153.2 Forward TATCCCGTGGCTAACTAACCTG 159
      Reverse ACCGACAAAGTGAGAATCAATCA
      IL-6 NM_204628.2 Forward CGTTTATGGAGAAGACCGTGAG 92
      Reverse CAGAGGATTGTGCCCGAAC
      IL-10 NM_001004414.4 Forward AGTGCTGTTGTATTCCTTGCTTC 164
      Reverse AGGGCTCGTCTGGTGTTTG
      SOD NM_205064.2 Forward CGCTCGTAGGTGGTTGTATTG 127
      Reverse CCTGCTGCTGGAAGTGGAT
      COR1 NM_001031545.2 Forward CTTCCATCATGACCAAGGCG 197
      Reverse CAGCAGCTCACTGATAGCG
      COR2 NM_001396933.2 Forward GTCATCTACACCACCACCTTGC 245
      Reverse AGCAAGCACTCTGAGGTTGT
      COR4 NM_001031176.2 Forward ATCCCTATGCTGAACCCCCT 70
      Reverse TAACTCTGCGTAGAGCGTCC
      COR6 NM_001031544.2 Forward GCACCTCTCAACTGATGGCT 210
      Reverse ACAAAACAGCGGTGGCTATG
      COR8 NM_001396932.1 Forward GGACCCAGGTTCAGGCTTAC 120
      Reverse TTATGGCTTCGACCCACACC
      COR9 NM_001305217.2 Forward TTTACATGCTCCACCAGGCG 355
      Reverse GATCATGCCAAGGTTCCCCA
      OR52R1 NM_001009878.2 Forward ATCCATGGTCTGATGCCCAC 141
      Reverse GGTGGTGGACGTTGATCTGA
      OR51M1 NM_001008754.4 Forward CATGGGAGTGACTGTGTCCC 516
      Reverse CAGCCCTCTGTCTGGACTTG
      OR1F2P XM_040685819.1 Forward CACCATCACTGTGCCGAAGA 113
      Reverse TCTCTGTGCCAACAACGTCA
      OR5AP2 XM_040685466.1 Forward GTCCAGACAGGAGTGTGCTC 179
      Reverse GTGCAAAGCGTGTGTCAGAG
      OR14J1L112 XM_040654712.1 Forward TCCTGCACTTCTGGCTCTTG 778
      GCTGGAGGCACTACCGAATA
    • The study parameters were evaluated by calculating mean values and their corresponding standard errors. Statistical analyses were performed using SPSS version 25. To compare gene expression across multiple groups, a one-way analysis of variance (ANOVA) was applied, followed by Tukey's Honestly Significant Difference (HSD) post hoc test to identify specific group differences. For comparisons between two independent group, an independent sample t-test was utilized. A threshold of p < 0.05 was set to establish statistical significance. OR gene expression in various tissues, including the gizzard, proventriculus, small intestine, and hypothalamus of broiler chickens, was quantified using the delta delta Ct (ddCt) method, normalizing the Ct values of OR genes to β-actin, the reference gene.

    • In this experimental study, the effects of FBP supplementation were investigated by measuring the levels of growth and thyroid hormones, including IGF-1, GH, T4, and T3, in the serum, muscle, and liver tissues of yellow-feathered broiler chickens, as illustrated in Fig. 1.
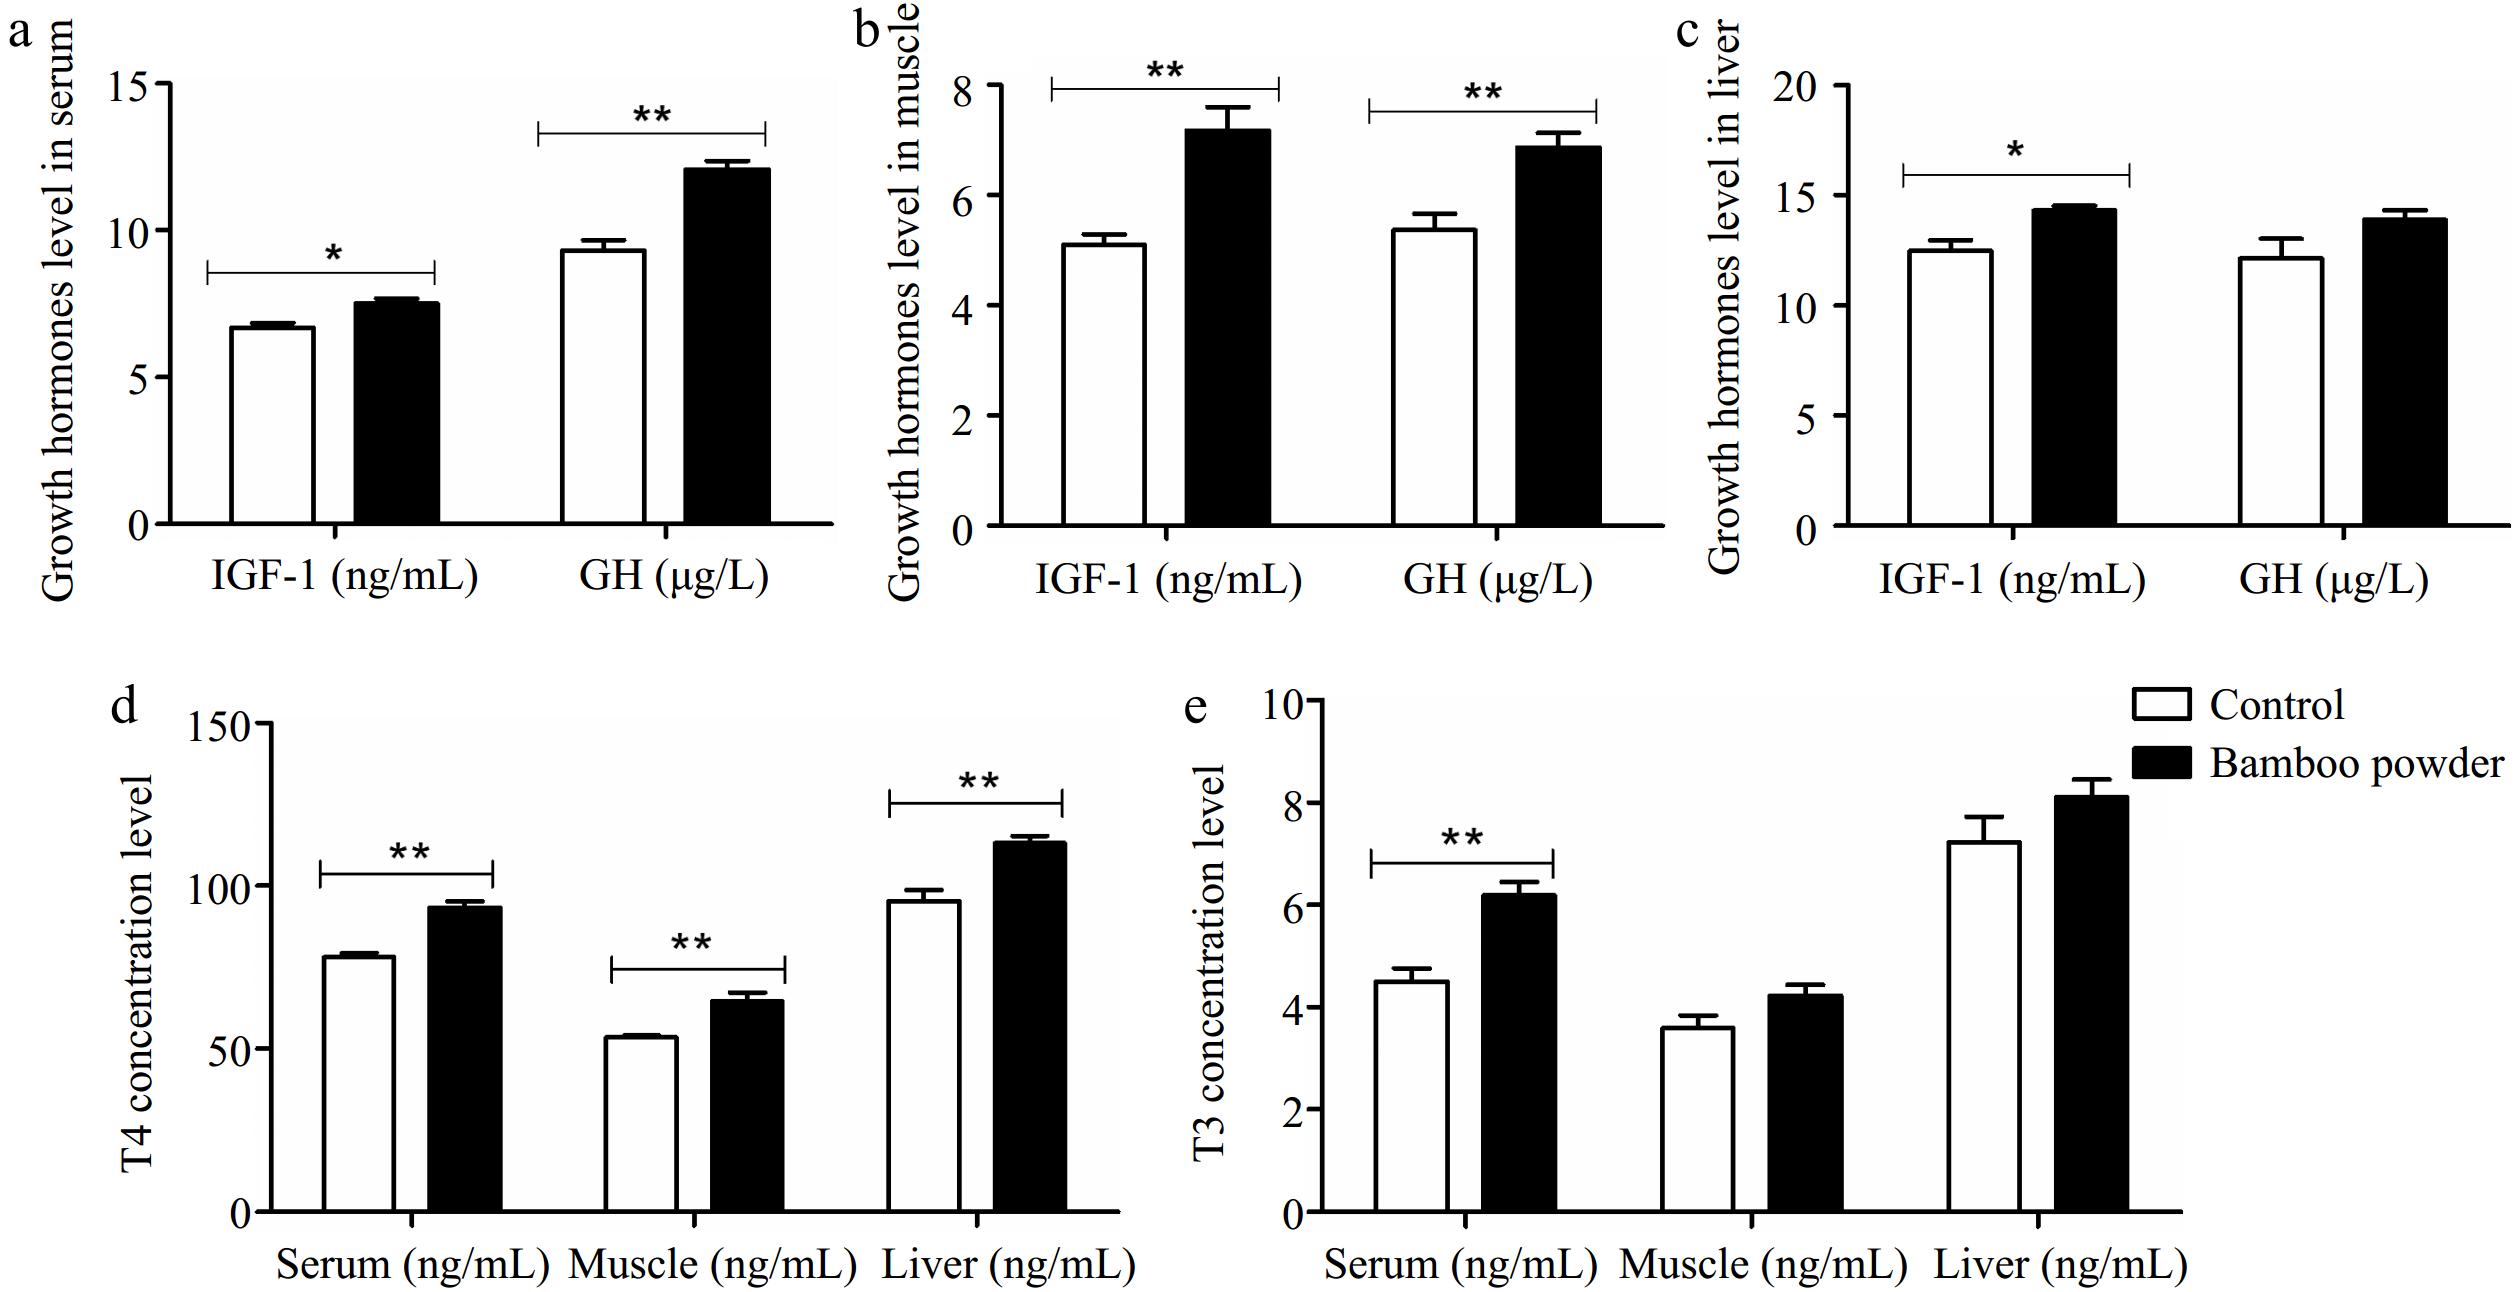
      Figure 1. 

      Impact of FBP supplementation on growth and thyroid hormone concentrations. The figure illustrates the effects of FBP supplementation on growth and thyroid hormone concentrations in yellow-feathered broiler chickens (n = 10). The figure comprises five panels: (a) growth hormone levels in serum, (b) growth hormone levels in muscle, (c) growth hormone levels in liver, (d) thyroxine (T4) levels across serum, muscle, and liver, and (e) triiodothyronine (T3) levels across serum, muscle, and liver. The bar graphs display the mean values for each variable, with error bars representing the standard error of the mean. Statistical significance is indicated by asterisks (* and **), denoting different significance levels (p < 0.05). The experiment's results reveal that FBP supplementation significantly elevated growth and thyroid hormone concentrations in the serum, muscle, and liver tissues of yellow-feathered broiler chickens.

      In this study, a comparison was made between a control group and an experimental group that received FBP as a dietary supplement. Thyroid and growth hormone levels were assessed using enzyme-linked immunosorbent assays (ELISA). Statistical analysis revealed significant differences in hormone concentrations between the control and FBP-supplemented groups. The FBP group exhibited significantly higher serum levels of GH (µg/L), T4 (ng/ml), and T3 (ng/ml) (p < 0.01) compared to the control group. In muscle tissue, growth and thyroid hormone concentrations were also significantly elevated (p < 0.01) in the FBP group relative to the control, although the increase in muscle T3 (ng/ml) did not reach statistical significance. Additionally, in liver tissue, the levels of IGF-1 (ng/ml) and T4 (ng/ml) were significantly higher (p < 0.01) in the FBP-supplemented group compared to the control. However, no significant differences were observed in GH (ng/L) and T3 (ng/ml) levels in liver tissue between the two groups. These findings provide strong scientific evidence that FBP supplementation induces significant changes in the levels of growth and thyroid hormones (IGF-1, GH, T4, and T3) in the liver, muscle, and serum of Yellow-Feathered Broiler Chickens.

    • To evaluate the effects of FBP supplementation on inflammation and injury markers in the liver, heart, and kidneys, an extensive analysis of serum levels of Aspartate Transaminase (AST), Alanine Transaminase (ALT), Alkaline Phosphatase (ALP), creatinine (CREA), and urea were conducted in yellow-feathered broiler chickens, as illustrated in Fig. 2.
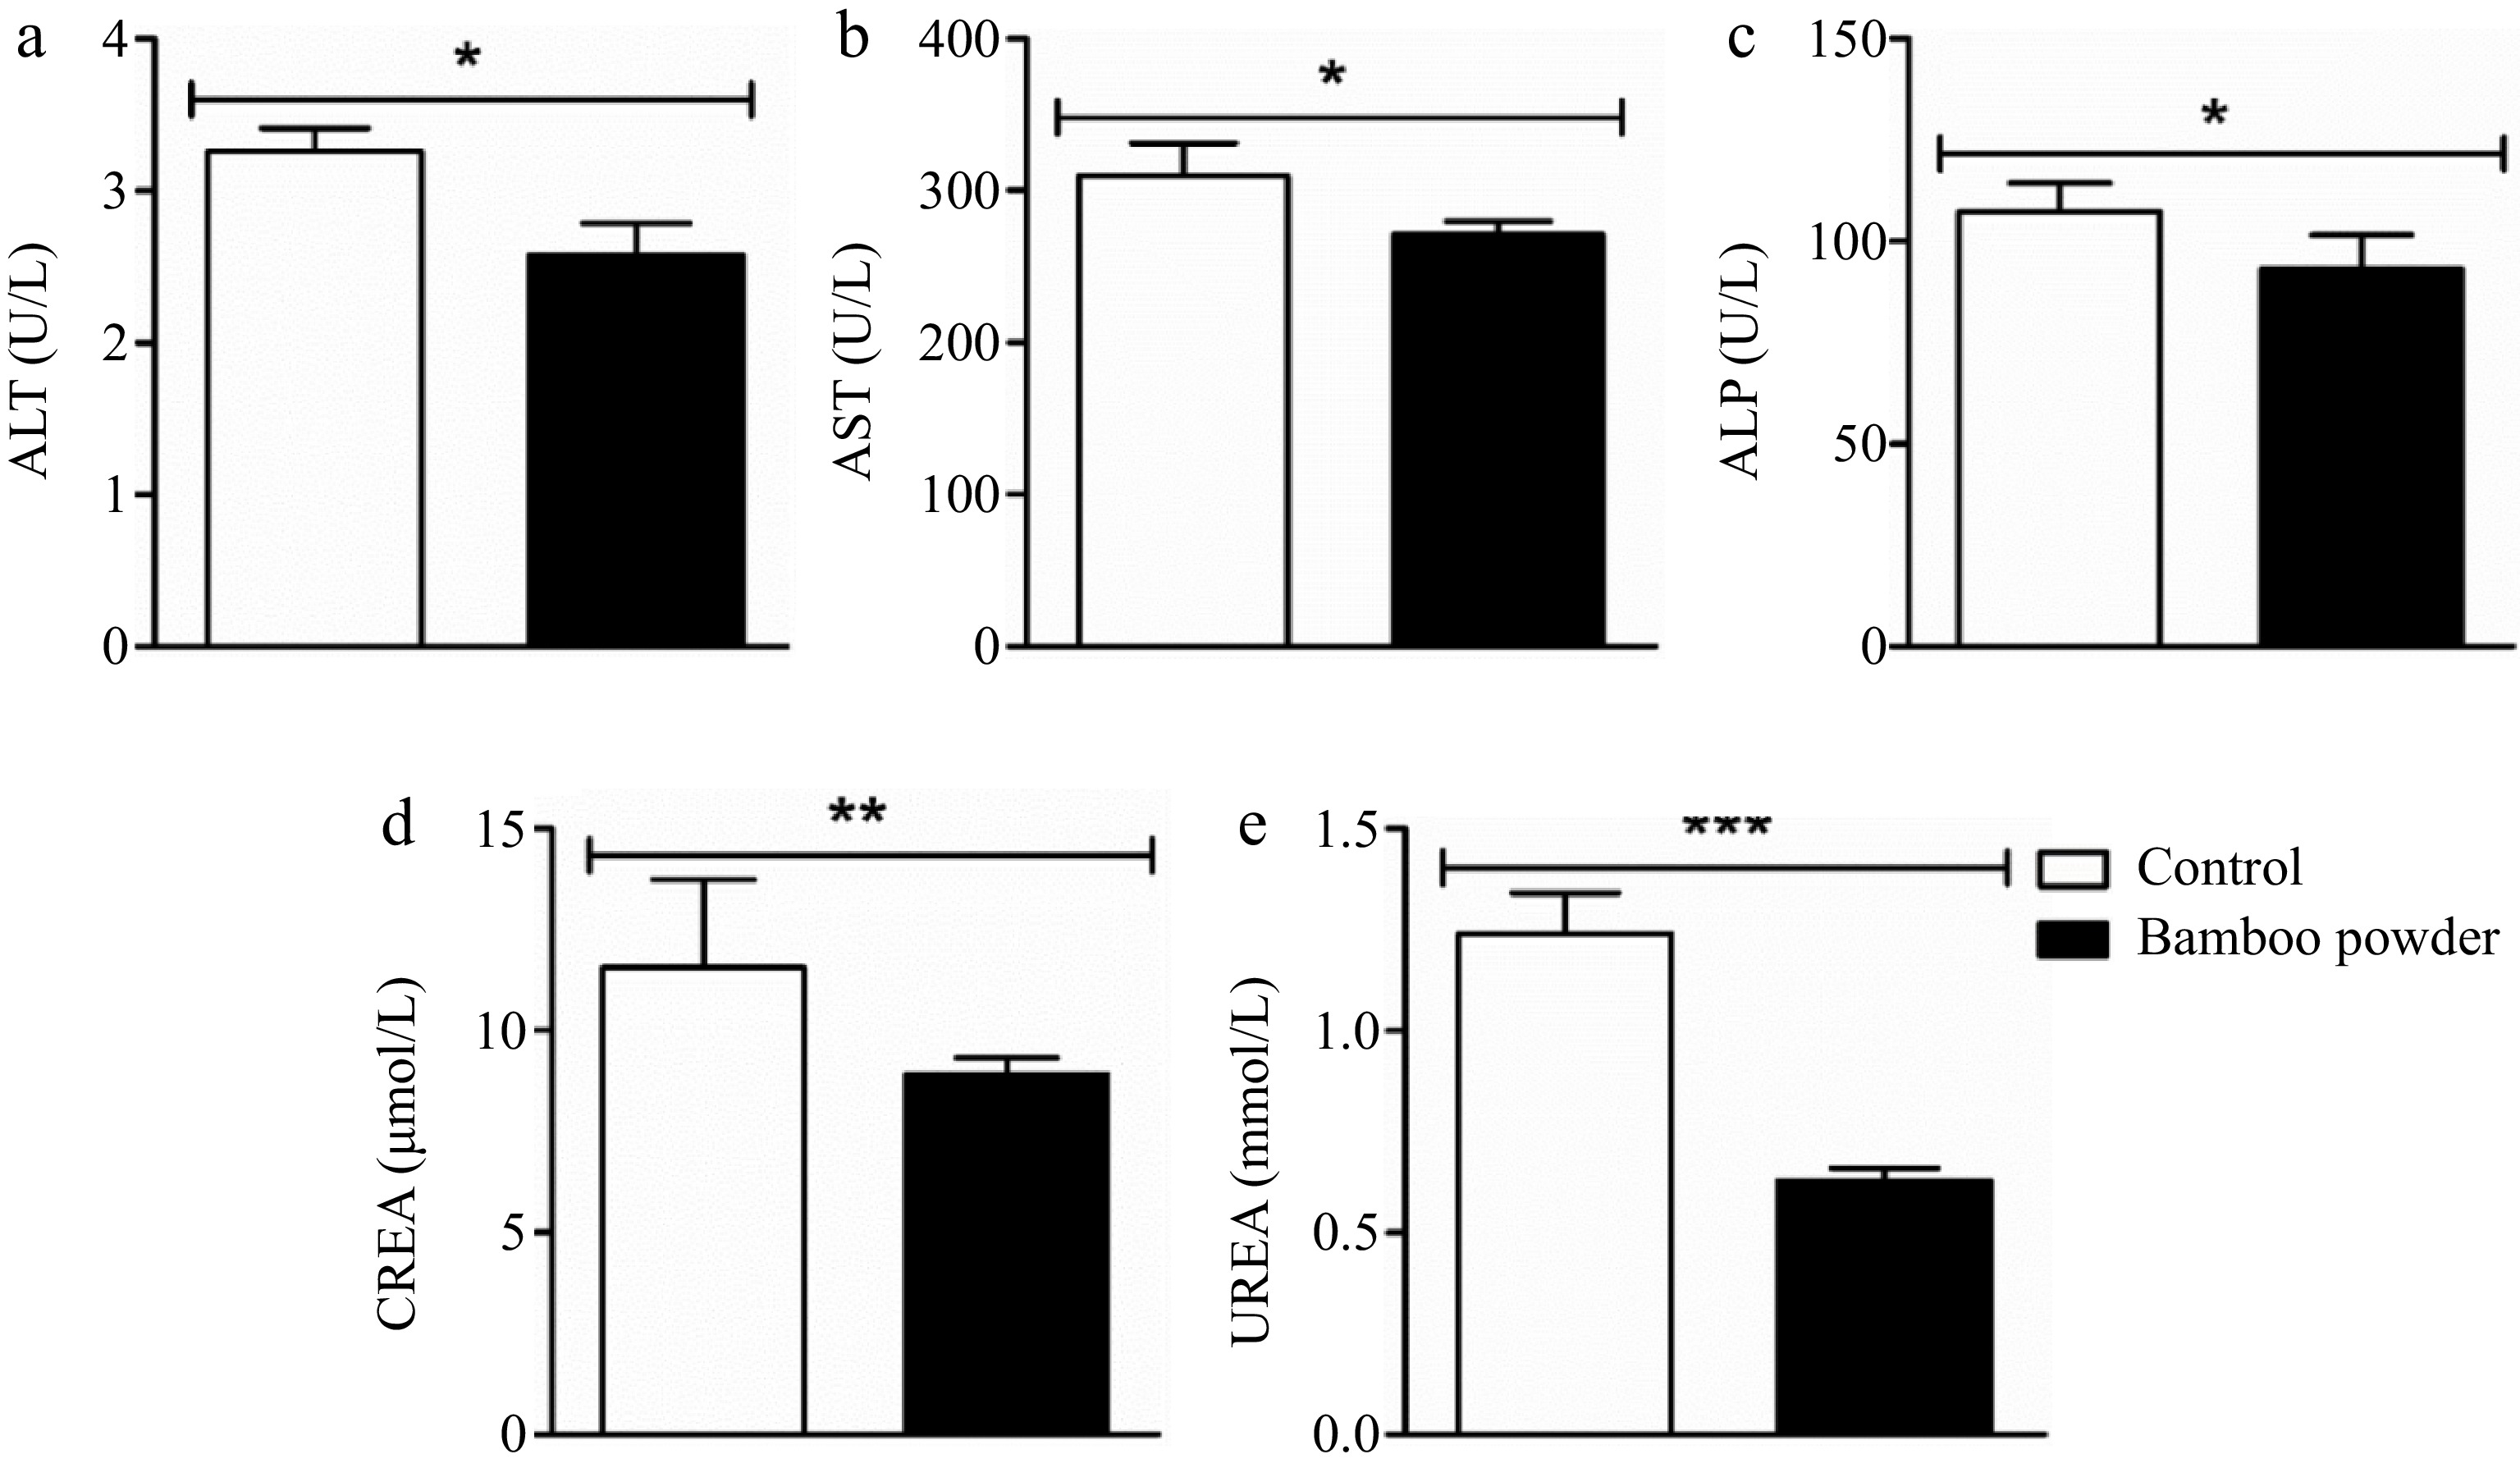
      Figure 2. 

      Impact of FBP on serum biochemical indexes. The figure provides a comprehensive analysis of the effects of FBP supplementation on serum biochemical indices in Yellow-Feathered Broiler Chickens (n = 10). The parameters examined include (a) ALT (U/L), (b) AST (U/L), (c) ALP (U/L), (d) CREA (nmol/L), and (e) UREA (nmol/L). The bar graphs depict the mean values for each parameter, with error bars representing the standard error of the mean. Statistical significance between groups is indicated by symbols (*, **, ***), with the specific number of asterisks corresponding to different levels of significance (p < 0.05).

      The present findings demonstrate a significant reduction in the activity of ALT, AST, ALP, CREA, and UREA enzymes in the experimental group treated with FBP compared to the control group. Statistical analysis revealed significant differences (p < 0.05), highlighting the efficacy of FBP supplementation in protecting liver, heart, and kidney tissues in yellow-feathered broiler chickens.

    • To evaluate the impact of FBP supplementation on immune indicators, we conducted a comprehensive analysis of serum immunoglobulins and inflammatory cytokines were conducted, as detailed in Table 4.

      Table 4.  Effects of FBP supplementation on serum immunoglobulins and inflammatory cytokines of broilers.

      Item Control Bamboo powder p-Value
      IgA (ng/ml) 113.16 ± 7.23 150.98 ± 8.89 0.01
      IgG (ng/ml) 62.28 ± 3.25 89.47 ± 1.18 0.04
      IgM (ng/ml) 1.40 ± 0.04 1.74 ± 0.03 0.01
      IL-2 (ng/ml) 19.13 ± 0.99 40.99 ± 1.23 0.001
      IL-6 (ng/ml) 23.38 ± 1.29 40.66 ± 0.61 0.03
      IL-10 (ng/ml) 16.41 ± 1.58 24.70 ± 1.32 0.04
      IL-1β (ng/ml) 19.63 ± 1.19 43.65 ± 1.04 0.001
      TNF-α (ng/ml) 23.13 ± 1.57 11.27 ± 1.14 0.01
      IgG, immunoglobulin G; IgA, immunoglobulin A; IgM, immunoglobulin M; IL-2, interleukin-2; IL-6, interleukin-6, and IL-10, interleukin-10 (n = 10). Data presented are mean ± SE. p-value in the same row less then (p < 0.05) significantly different from each other.

      The present findings reveal a significant upregulation in the levels of immunoglobulins (IgA, IgG, and IgM) and inflammatory cytokines (IL-2, IL-6, IL-1β, and IL-10) in the serum of broiler chickens treated with FBP (p < 0.01). Notably, the increase in immunological markers correlated positively with the inclusion level of FBP. Additionally, the TNF-α level showed a significant decrease (p < 0.01) compared to the control group, indicating a potential anti-inflammatory effect of FBP supplementation. These results highlight the immunomodulatory impact of FBP on broiler chickens, suggesting its potential role in enhancing immune responses and reducing inflammatory processes. The observed changes in immune indicators further emphasize the promising immunotherapeutic properties of FBP for poultry health.

    • To assess the impact of FBP supplementation on the expression of antioxidant-related genes, a thorough examination of the SOD1, GPX1, and CAT genes in liver and heart tissues were conducted, as illustrated in Fig. 3.
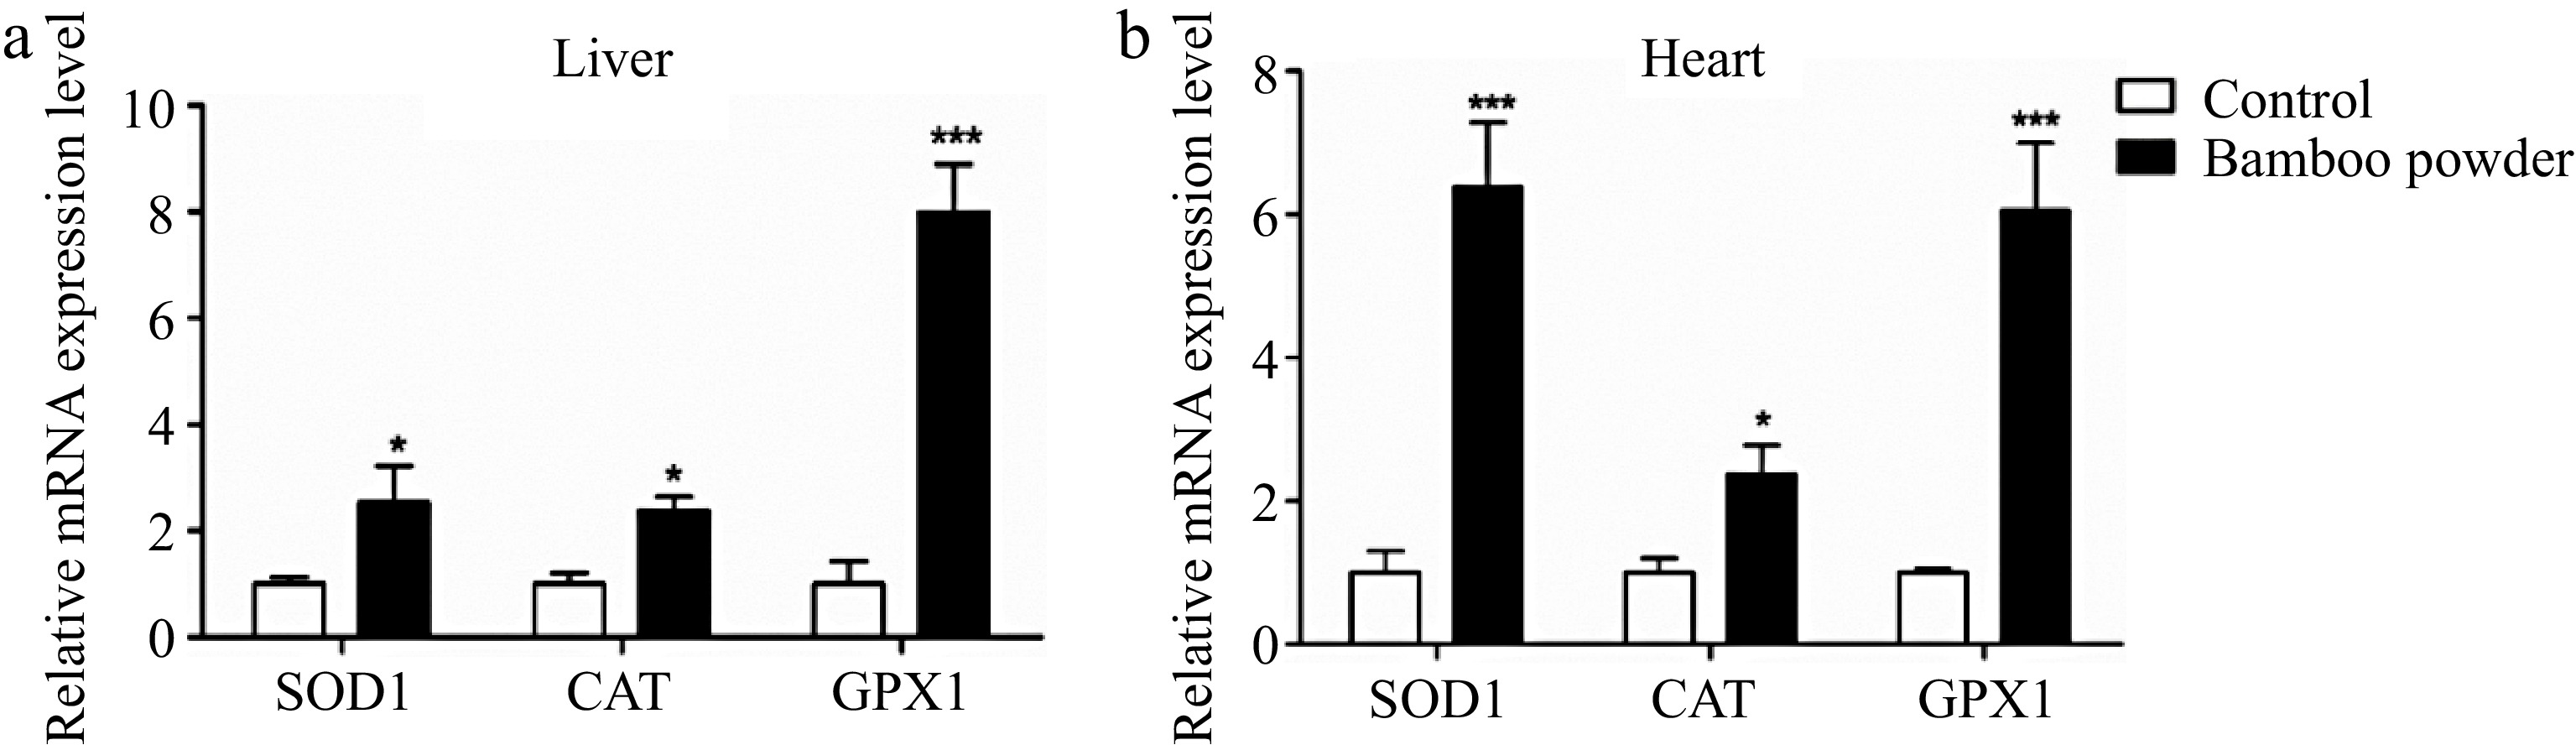
      Figure 3. 

      Effects of FBP on antioxidant genes expression. The figure illustrates the expression levels of GPX1, SOD1, and CAT genes in (a) liver, and (b) heart tissues of broilers. The bar graphs represent the mean expression values, while the error bars indicate the standard error of the mean. Statistical significance is denoted by asterisks (*, **, ***), with * indicating p < 0.05, ** representing p < 0.01, and *** corresponding to p < 0.001, highlighting differences among the means.

      The present results demonstrate a substantial increase in the mRNA expression levels of antioxidant-related genes (SOD1, GPX1, and CAT) in both liver and heart tissues of broilers treated with FBP. In the liver, the FBP-supplemented group exhibited significantly higher mRNA levels of SOD1, GPX1, and CAT compared to the control group (p < 0.01). Similarly, in heart tissue, the expression levels of these genes were also significantly elevated in the FBP-supplemented group compared to the control group (p < 0.05). These findings strongly suggest that FBP supplementation plays a pivotal role in activating antioxidant defense systems in liver and heart tissues. The observed upregulation of antioxidant genes implies a potential enhancement of antioxidant defense mechanisms, highlighting the positive impact of FBP supplementation on the overall health and resilience of these vital organs in broiler chickens.

    • RT-PCR was conducted to confirm the expression of 11 specific OR genes in the hypothalamus, gizzard, proventriculus, and small intestine tissues of broiler chickens, as shown in Fig. 4.
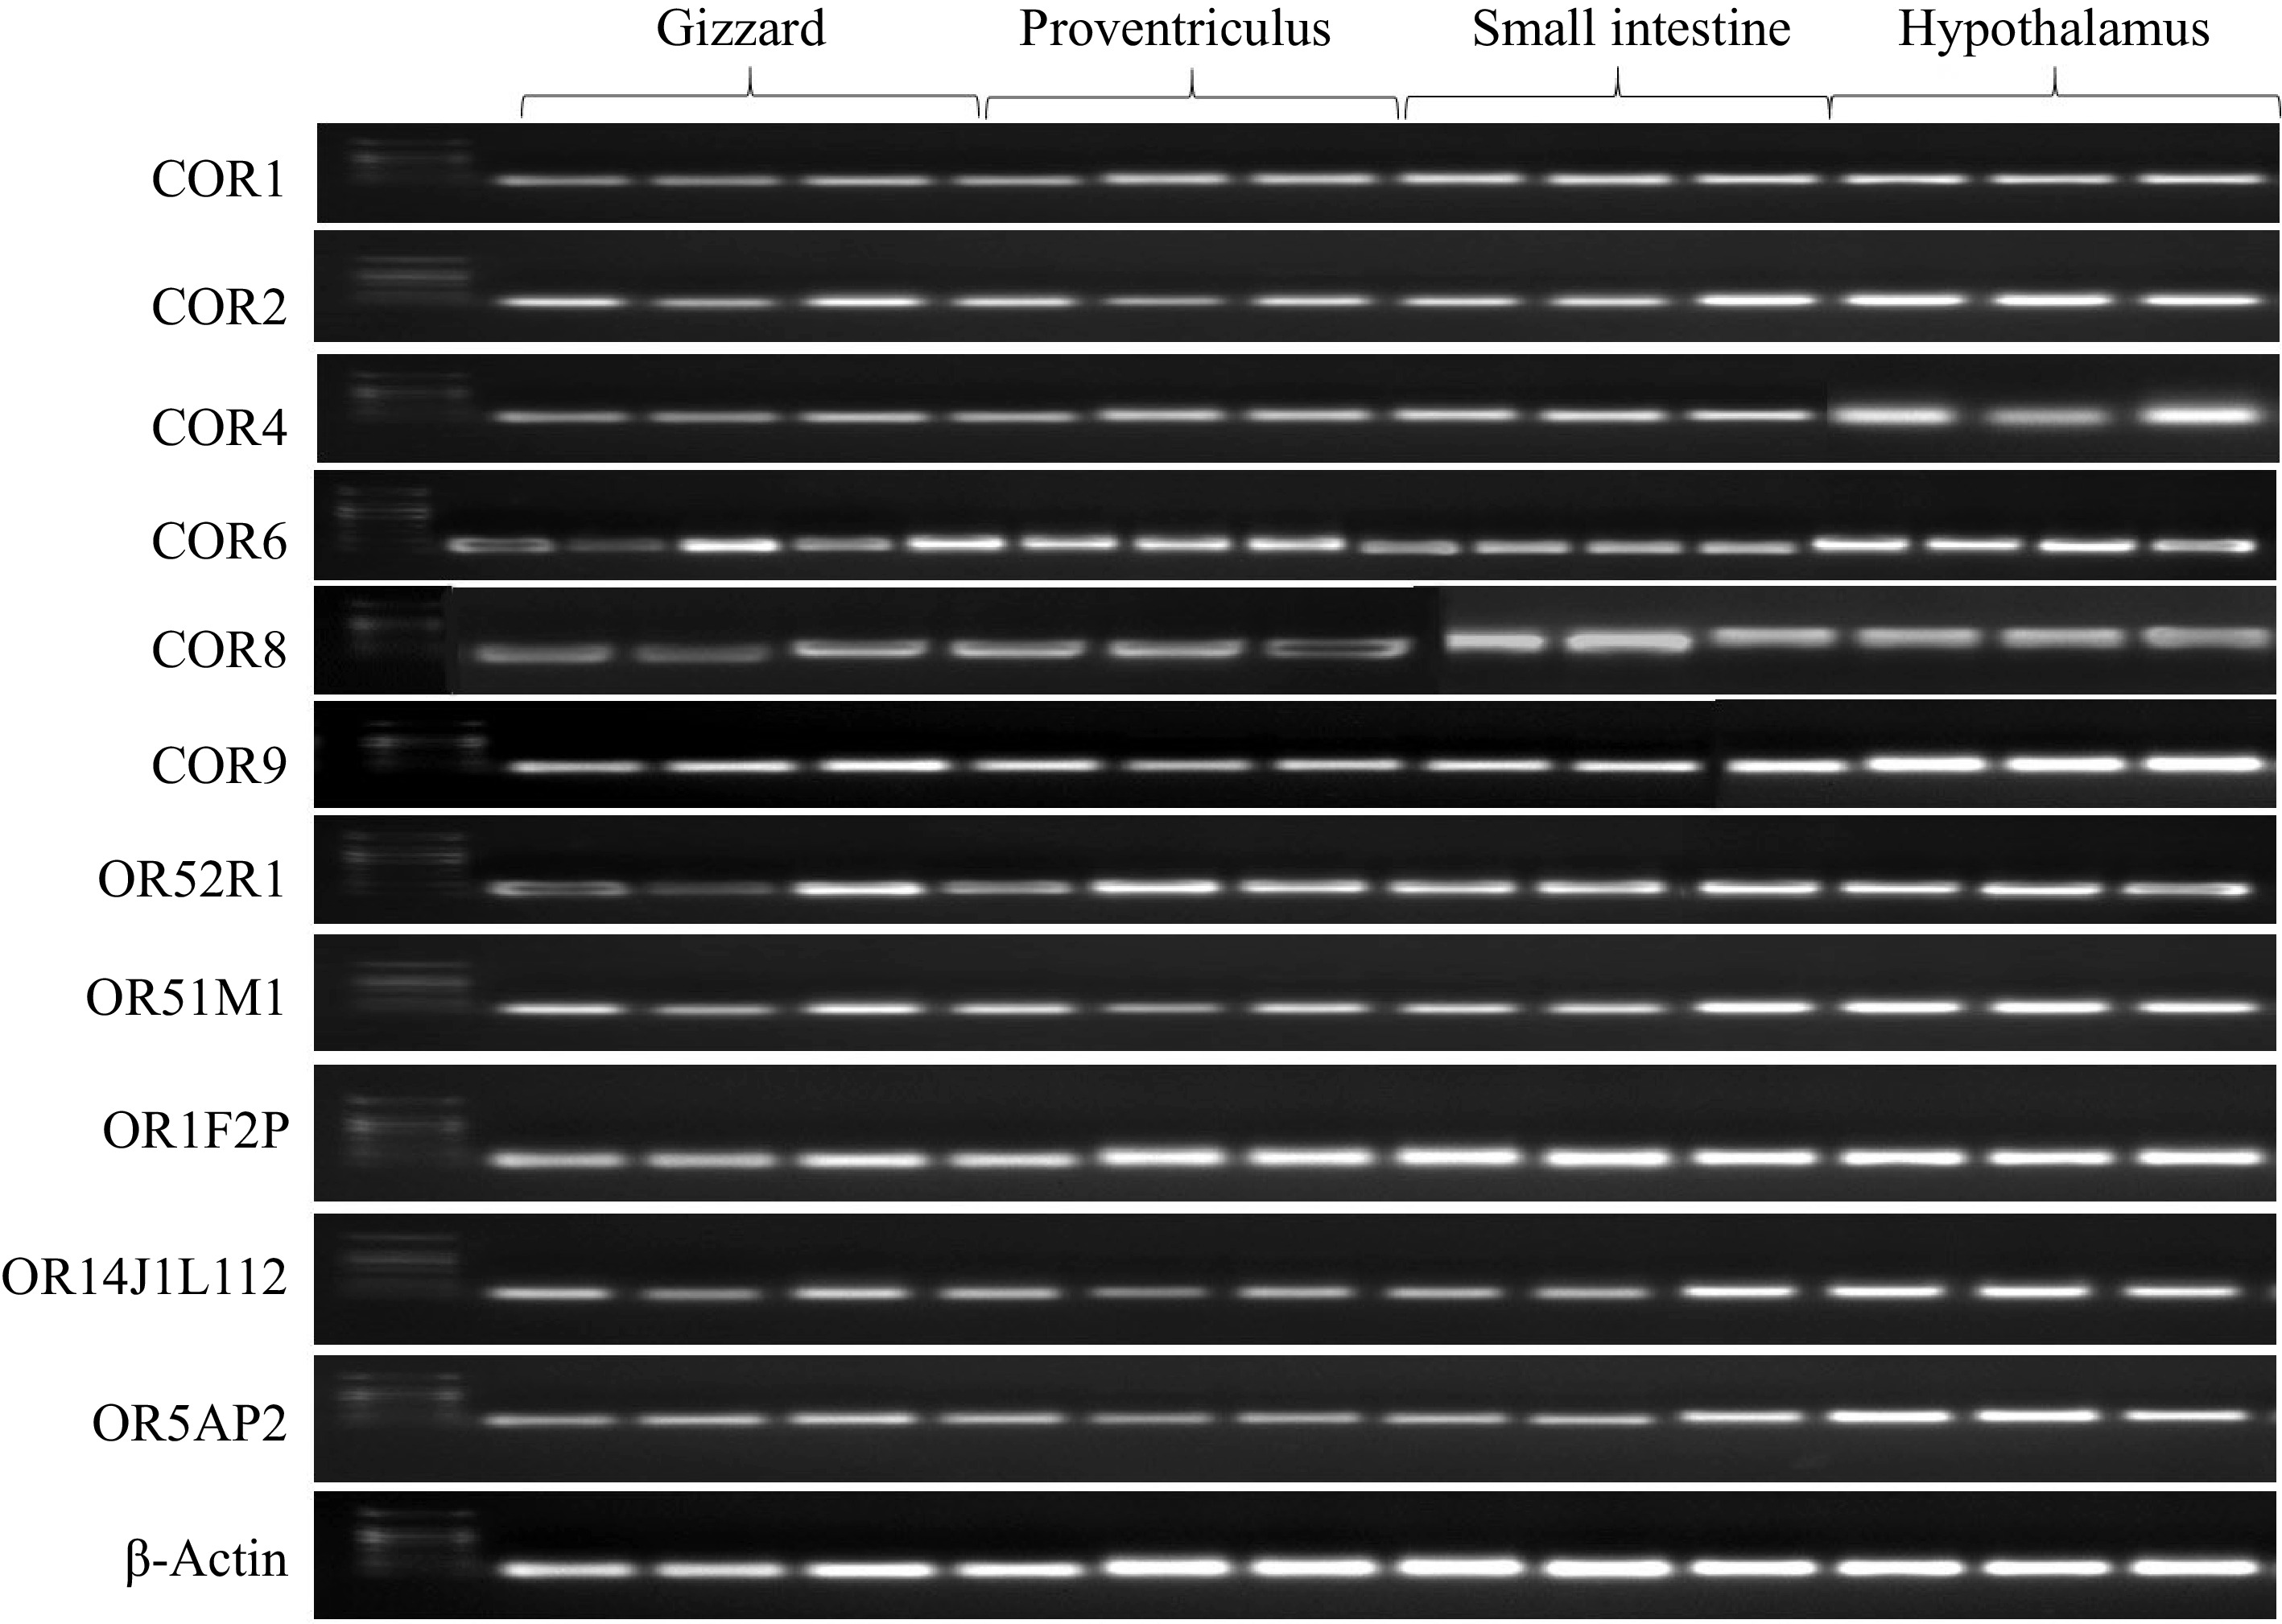
      Figure 4. 

      Illustrates the tissue-specific expression patterns of odorant receptor genes, including COR1, COR2, COR4, COR6, OR14J1L112, OR5AP2, COR8, COR9, OR52R1, OR51M1, and OR1F2P, across various tissues such as the gizzard, proventriculus, small intestine, and hypothalamus. The analysis was conducted using RT-PCR, with cDNAs prepared from each tissue and gene-specific primers. PCR products were subjected to gel electrophoresis, and all observed bands corresponded to the expected sizes based on the designed primers.

      The quality of the cDNA preparations was validated using β-actin primers, which produced consistent band intensities across cDNA samples from the hypothalamus, gizzard, proventriculus, and small intestine tissues. RT-qPCR analysis revealed significant expression of specific OR genes, including COR1, COR2, COR4, COR6, COR8, COR9, OR14J1L112, OR5AP2, OR52R1, OR51M1, and OR1F2P, in these tissues from broiler chickens supplemented with fermented bamboo powder. The expression levels of these OR genes differed noticeably from those of the β-actin gene. A comparative assessment of gene expression profiles further indicated that OR gene expression was considerably lower in the gizzard and proventriculus compared to the small intestine and hypothalamus, with the highest OR gene expression observed in the hypothalamus (Figs 4 & 5). These findings demonstrate distinct tissue-specific expression patterns of OR genes in broiler chickens.
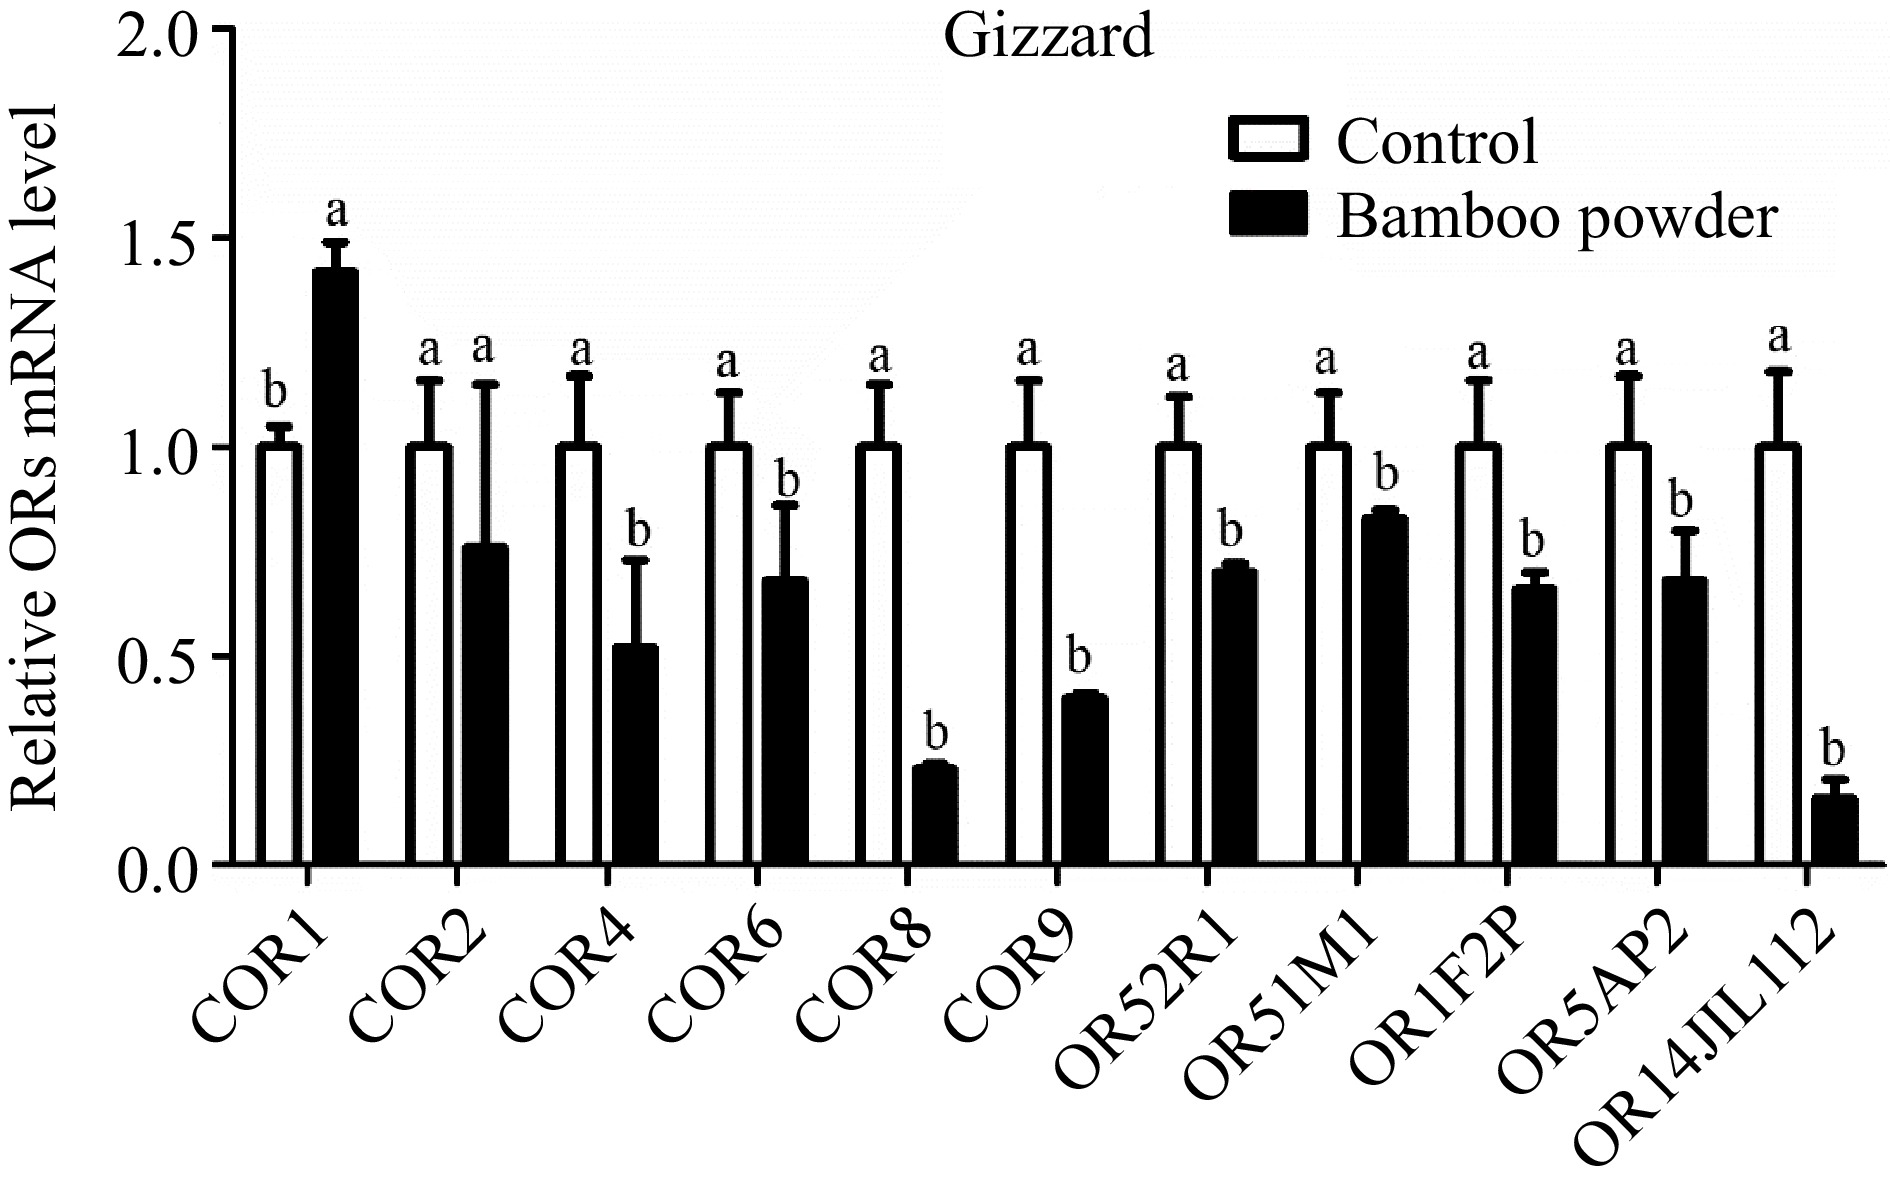
      Figure 5. 

      Shows the qPCR expression levels of OR genes in the gizzard tissue of yellow broilers. For accurate comparison, expression values were normalized against control data from the same samples. The letters in the figure represent significant differences: 'a' indicates higher expression levels, while 'b' denotes lower expression levels. The bar graphs display the mean values, with error bars representing the standard error of the mean. Statistical significance at p < 0.05 is indicated by the letters 'a' and 'b' highlighting differences among the means.

    • The expression levels of OR genes in the gizzard tissue of broiler chickens were measured using RT-qPCR (Fig. 5 & Table 5). The results showed a significant overall downregulation of these genes in the gizzard tissue. However, it is noteworthy that although the expression of the COR2 gene was downregulated, the difference was not statistically significant.

      Table 5.  Odorant receptor genes relative expression values in broiler chicken gizzard, proventriculus, small intestine, and hypothalamus tissues

      Genes Gizzard tissue Proventriculus tissue Small intestine tissue Hypothalamus tissue
      2−ΔΔCᴛ SEM 2−ΔΔCᴛ SEM 2−ΔΔCᴛ SEM 2−ΔΔCᴛ SEM
      COR1 1.420c 0.070 2.600b 0.41 2.97b 0.54 5.20a 0.52
      COR2 0.760c 0.390 1.710b 0.20 2.23b 0.30 5.27a 0.46
      COR4 0.520c 0.210 1.010c 0.35 2.30b 0.35 3.75a 0.38
      COR6 0.680c 0.180 0.930c 0.11 1.57b 0.31 3.47a 0.26
      COR8 0.230c 0.010 0.600c 0.04 2.03b 0.60 8.24a 0.57
      COR9 0.400c 0.010 0.710c 0.04 1.34b 0.26 3.38a 0.27
      OR52R1 0.700c 0.020 1.150b 0.17 1.40b 0.20 2.81a 0.26
      OR51M1 0.830c 0.020 1.007c 0.17 1.72b 0.29 2.41a 0.31
      OR1F2P 0.660c 0.040 1.340b 0.11 3.90a 0.85 1.47b 0.04
      OR5AP2 0.680c 0.120 1.010c 0.15 1.91b 0.40 2.40a 0.13
      OR14J1L112 0.160c 0.045 0.450c 0.09 1.59b 0.23 12.29a 0.96
      The relative expression values (2−ΔΔCᴛ) for the gizzard, proventriculus, small intestine, and hypothalamus tissues of yellow broiler chickens are displayed. The values in each column represent the mean along with the standard error of the mean (SEM). Significant differences at the 0.05 level are indicated by the letters a, b, and c. Means within the same row that share a lowercase letter are considered significantly different.
    • The study examined the expression profile of OR genes in the proventriculus tissue of yellow broiler chickens using RT-qPCR to measure their relative expression levels (Fig. 6 & Table 5). The findings showed both upregulation and downregulation of various OR genes in the proventriculus tissue. Notably, the COR6 gene was downregulated, although this change was not statistically significant. Similarly, while the COR4 and OR52R1 genes were upregulated, these differences were also not statistically significant. The expression of OR5AP2 showed no significant change. However, the COR1, COR2, and OR1F2P genes were significantly upregulated, while OR14JIL112 was significantly downregulated in the proventriculus tissue.
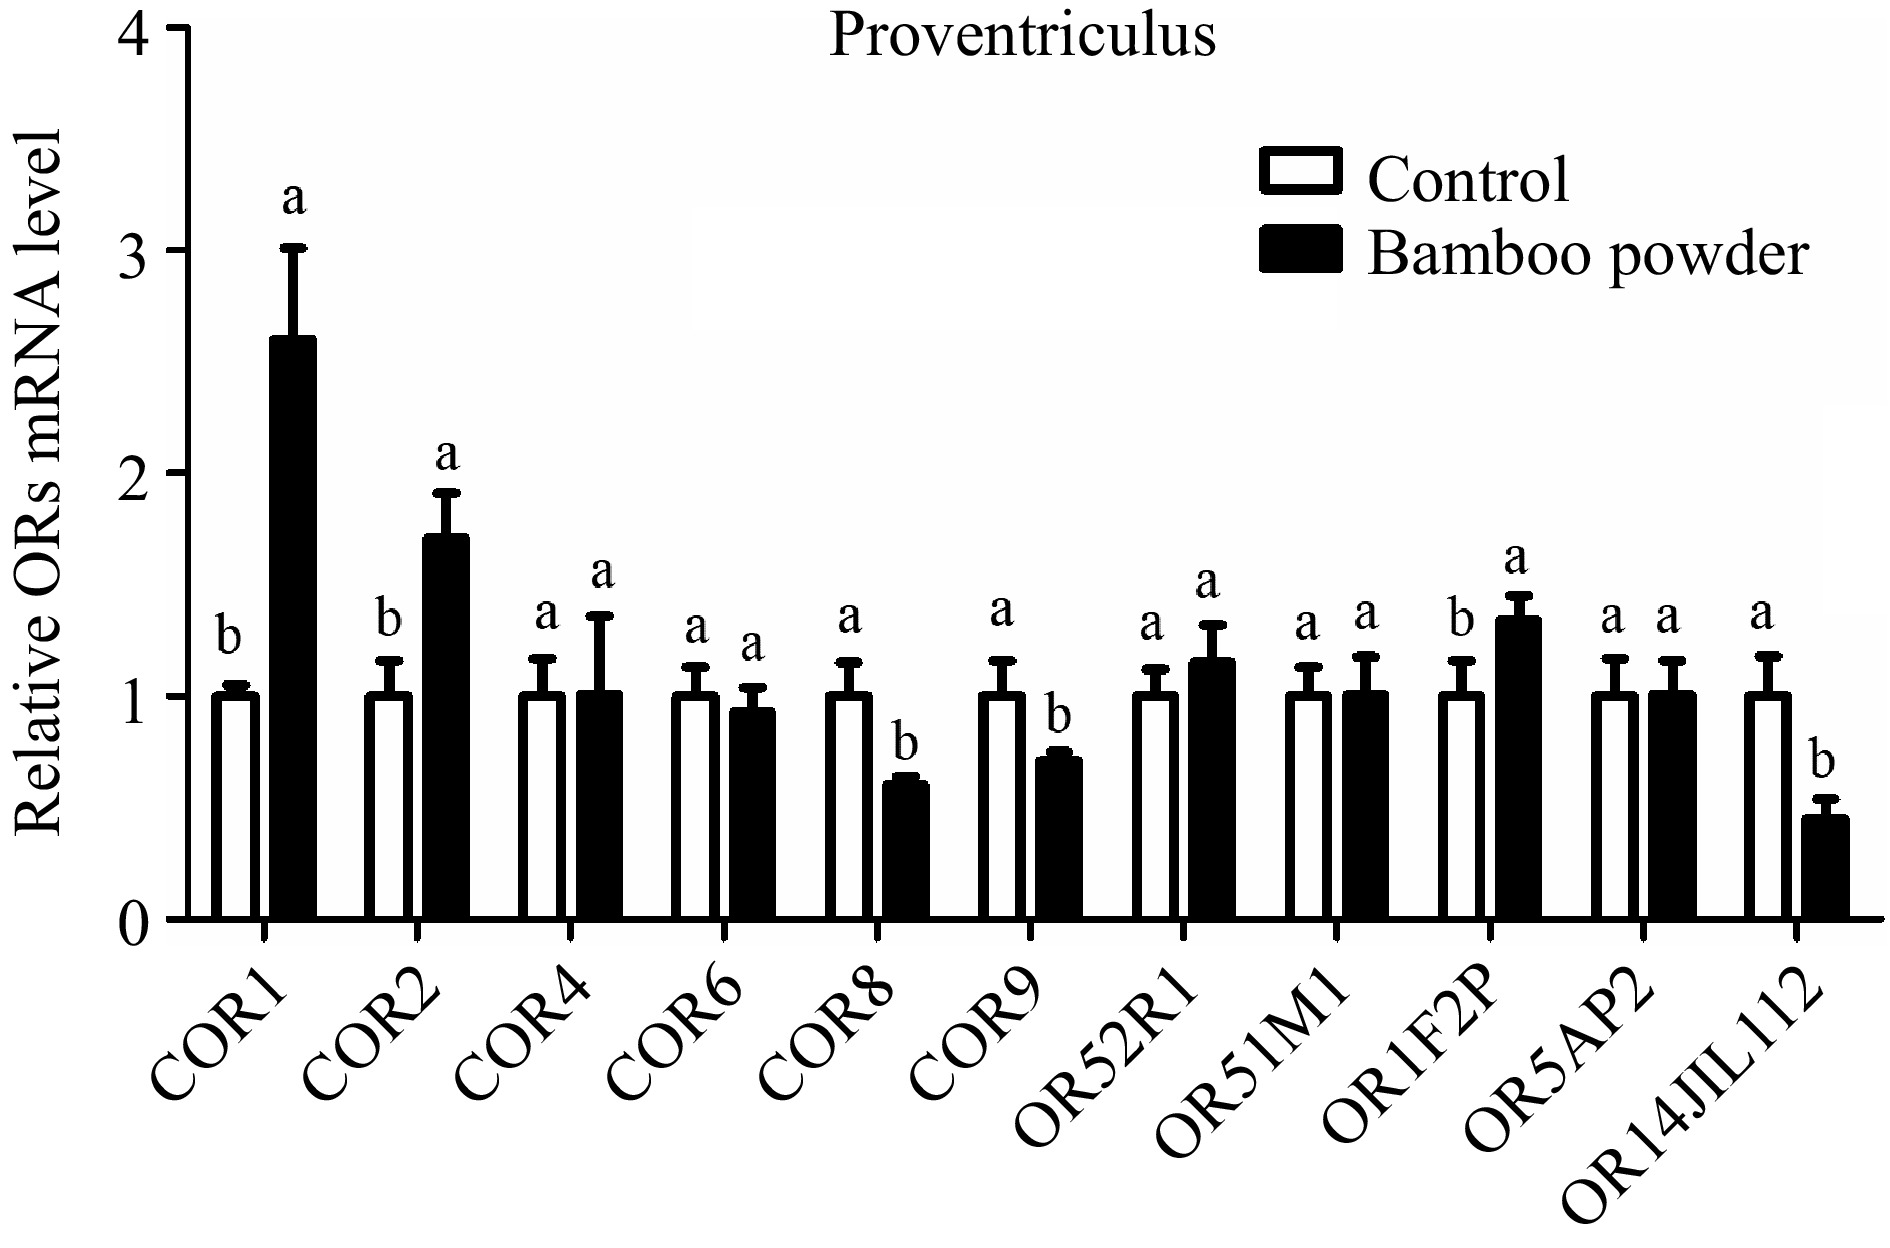
      Figure 6. 

      Illustrates the qPCR expression levels of OR genes in the proventriculus tissue of Yellow broilers. The expression values were normalized against control data from the same samples to ensure accurate comparison. Significant differences are denoted by letters: 'a' indicates significantly higher expression, while 'b' represents significantly lower expression. The bar graphs display the mean values, with error bars reflecting the standard error of the mean. Statistical significance, determined at p < 0.05, is indicated by the letters 'a' and 'b' highlighting differences among the means.

    • The study aimed to examine the expression of OR genes in the small intestine tissue of yellow broiler chickens. RT-qPCR was used to assess the relative expression levels of these genes (Fig. 7 & Table 5). The results revealed a notable upregulation in the expression of several OR genes, including COR1, COR2, COR4, COR6, COR8, COR9, OR52R1, OR51M1, OR1F2P, OR5AP2, and OR14JL112, in the small intestine tissues of yellow broilers.
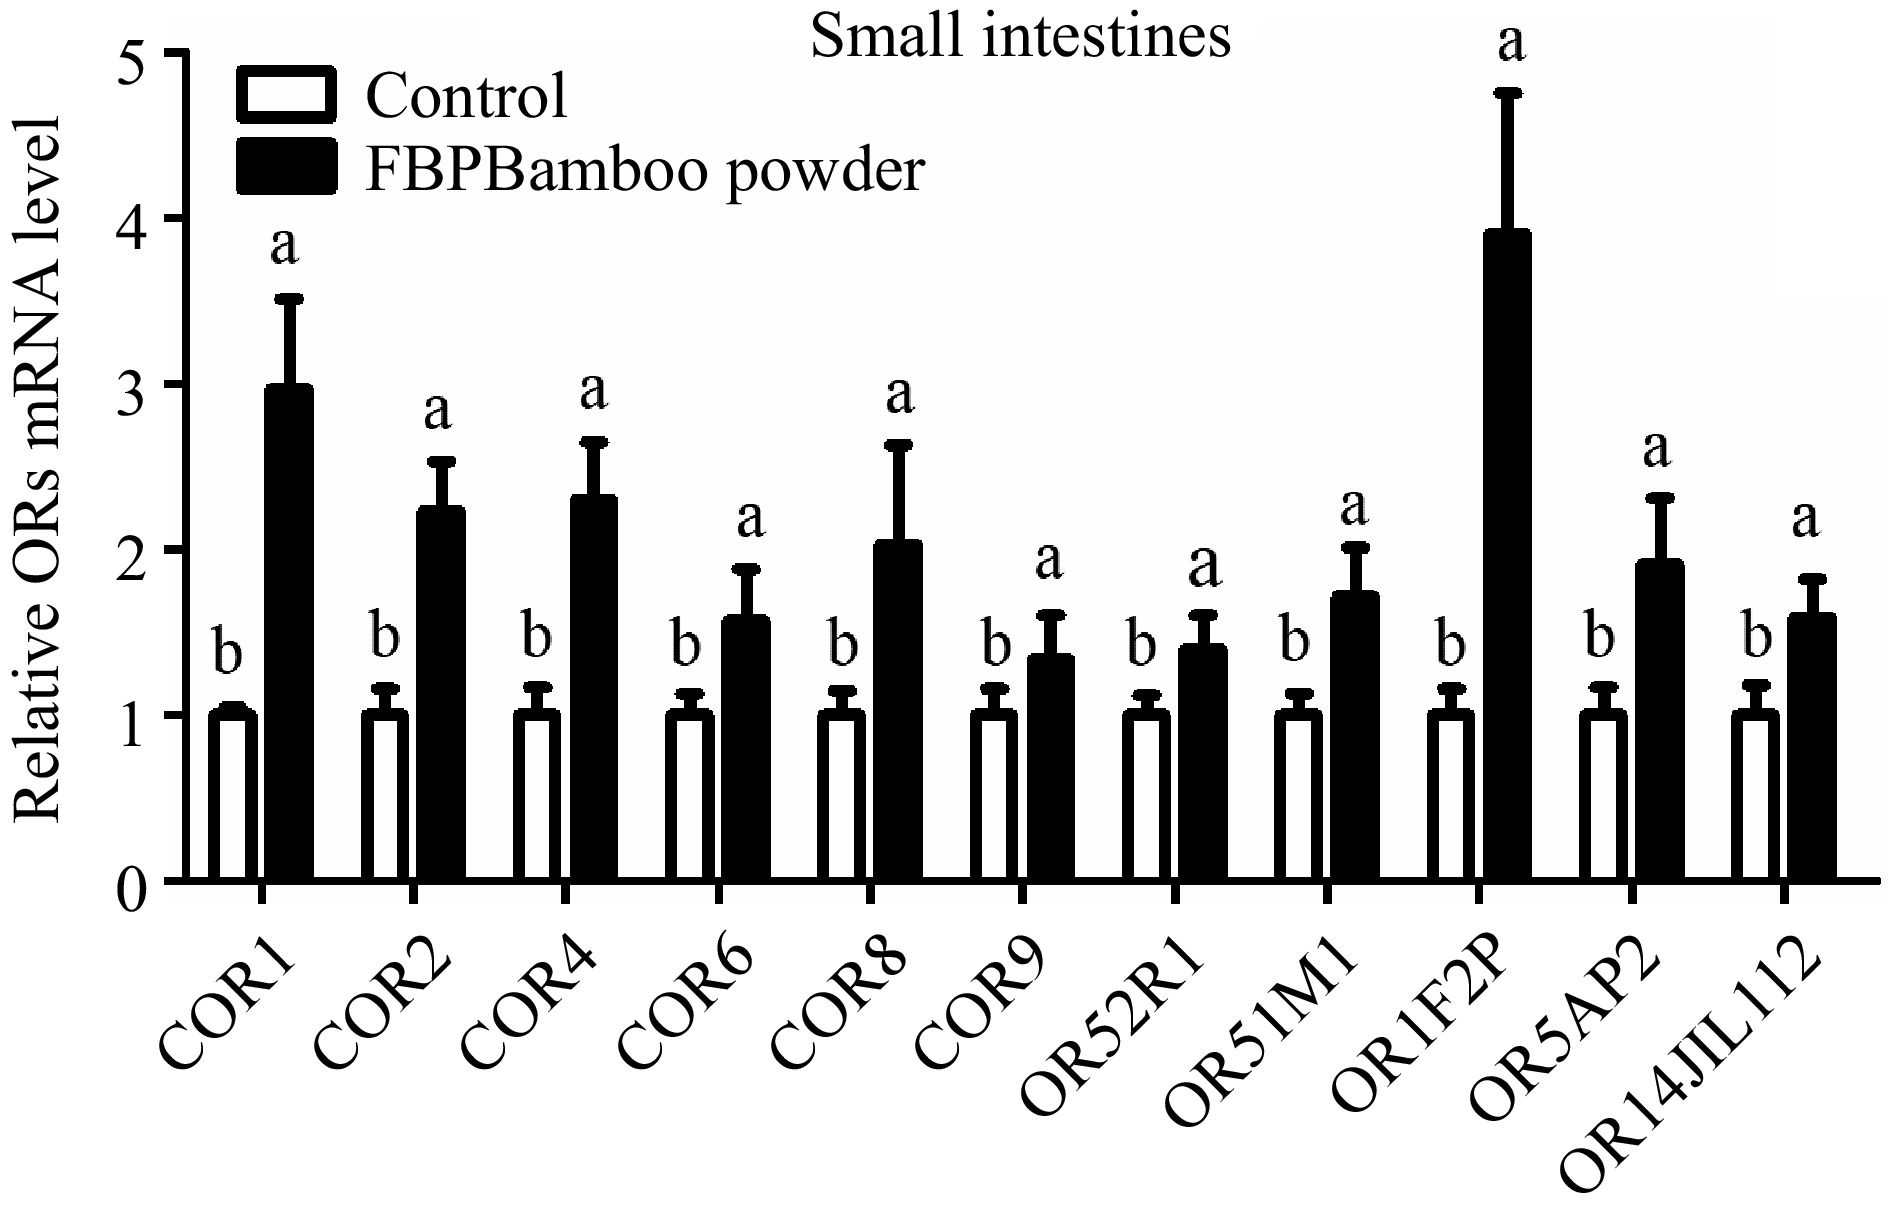
      Figure 7. 

      Depicts the qPCR expression levels of OR genes in the small intestine tissue of yellow broilers. The expression values were normalized against control data from the same samples to ensure accurate comparisons. Significant differences are indicated by letters: 'a' represents higher expression levels, while 'b' denotes lower expression. The bar graphs display the mean values, with error bars reflecting the standard error of the mean. Statistical significance is denoted by the letters 'a' and 'b' at a threshold of p < 0.05, highlighting differences among the means.

    • This study aimed to evaluate the expression profile of OR genes in the small intestine tissue of yellow broiler chickens. RT-qPCR was used to quantify the relative expression levels of these genes (Fig. 8 & Table 5). The findings revealed a significant reduction in the expression of several OR genes, including COR1, COR2, COR4, COR6, COR8, COR9, OR52R1, OR51M1, OR5AP2, and OR14JL112, in the hypothalamus tissues of yellow broilers. Conversely, the expression level of the OR1F2P gene remained unchanged, showing no significant difference.
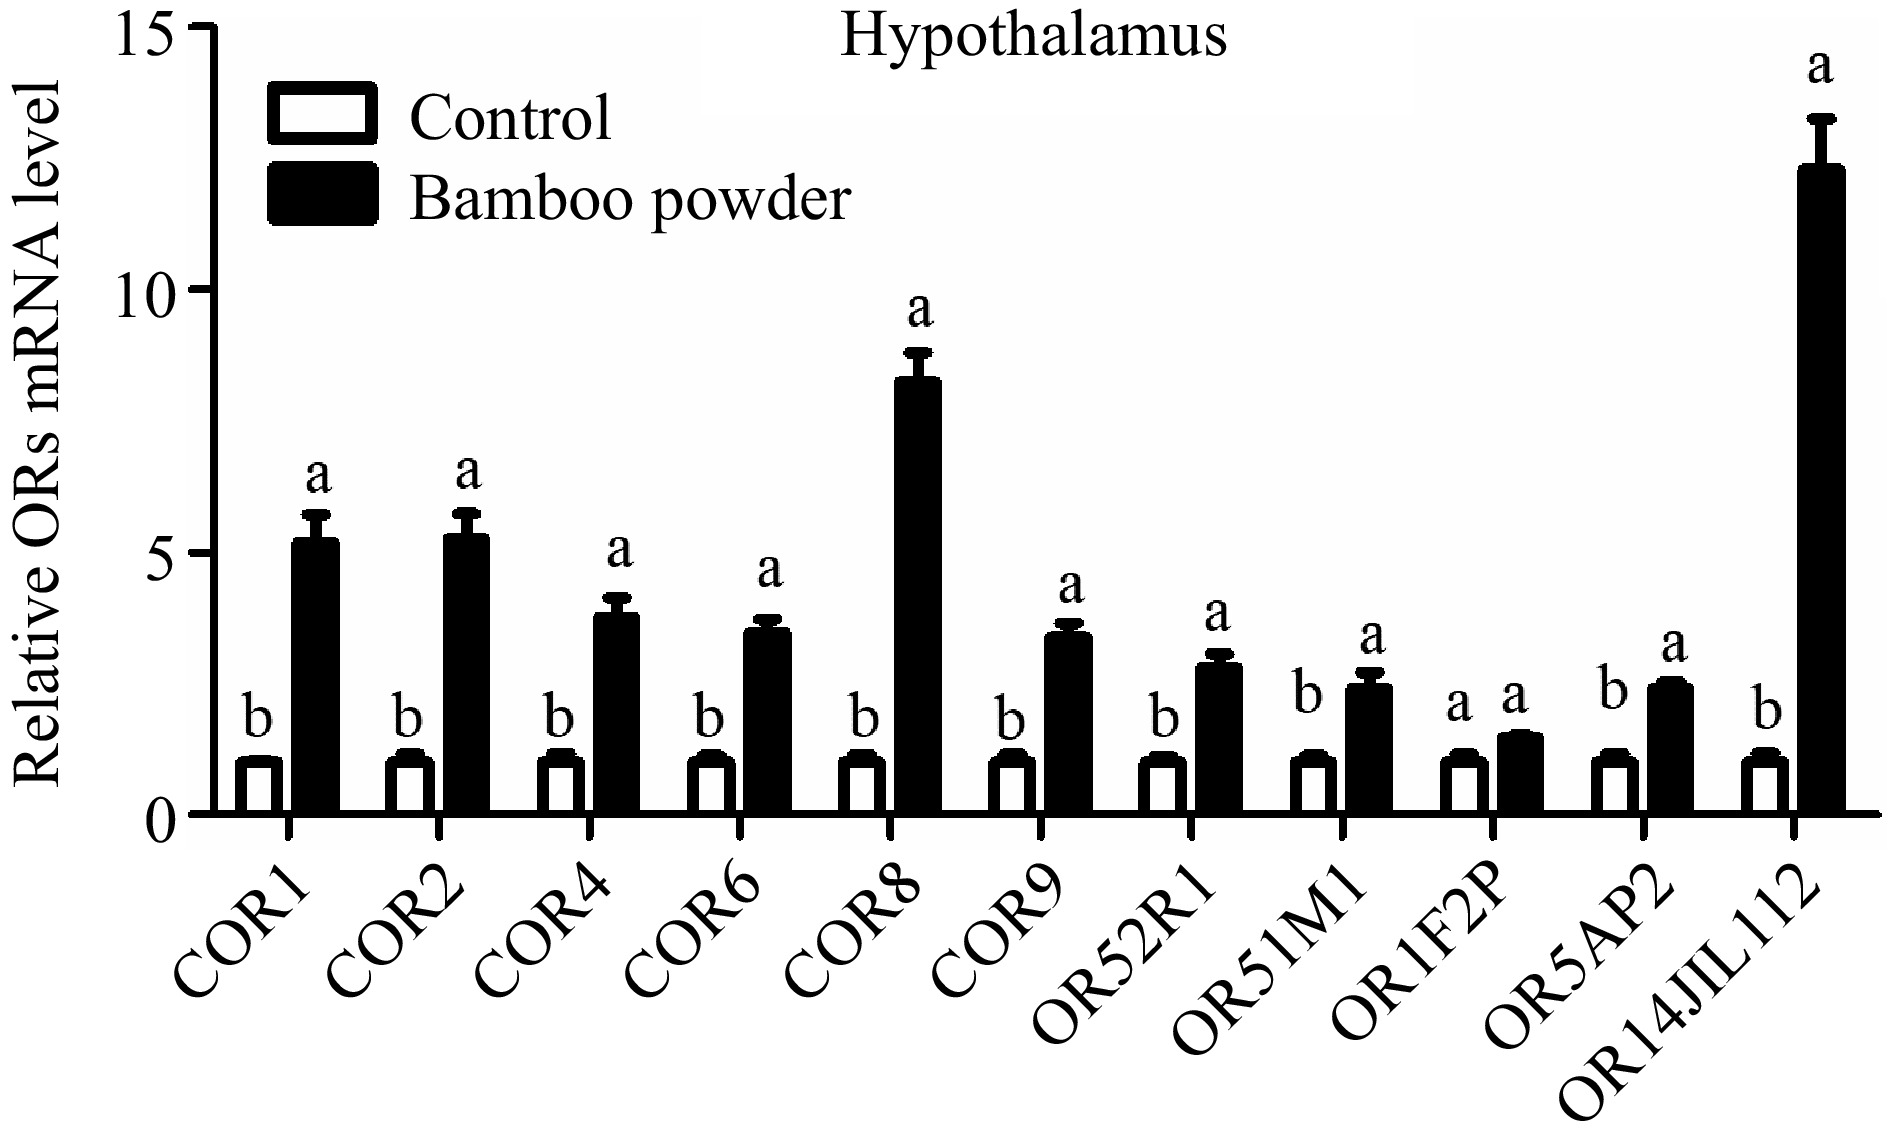
      Figure 8. 

      Illustrates the qPCR expression levels of OR genes in the hypothalamus tissue of yellow broilers. The expression values were normalized against control data from the same samples to ensure accurate comparisons. Different letters in the figure indicate significant differences: 'a' represents higher expression levels, while 'b' indicates lower expression. The bar graphs depict the mean values, with error bars representing the standard error of the mean. Statistical significance at p < 0.05 is denoted by the letters 'a' and 'b', highlighting differences among the means.

    • The heatmap analysis illustrates the variations across different groups, using a color gradient to represent value differences. Warmer colors indicate higher values, while cooler colors represent lower ones. This visualization method effectively highlights patterns and distinctions among the samples and groups (Fig. 9).
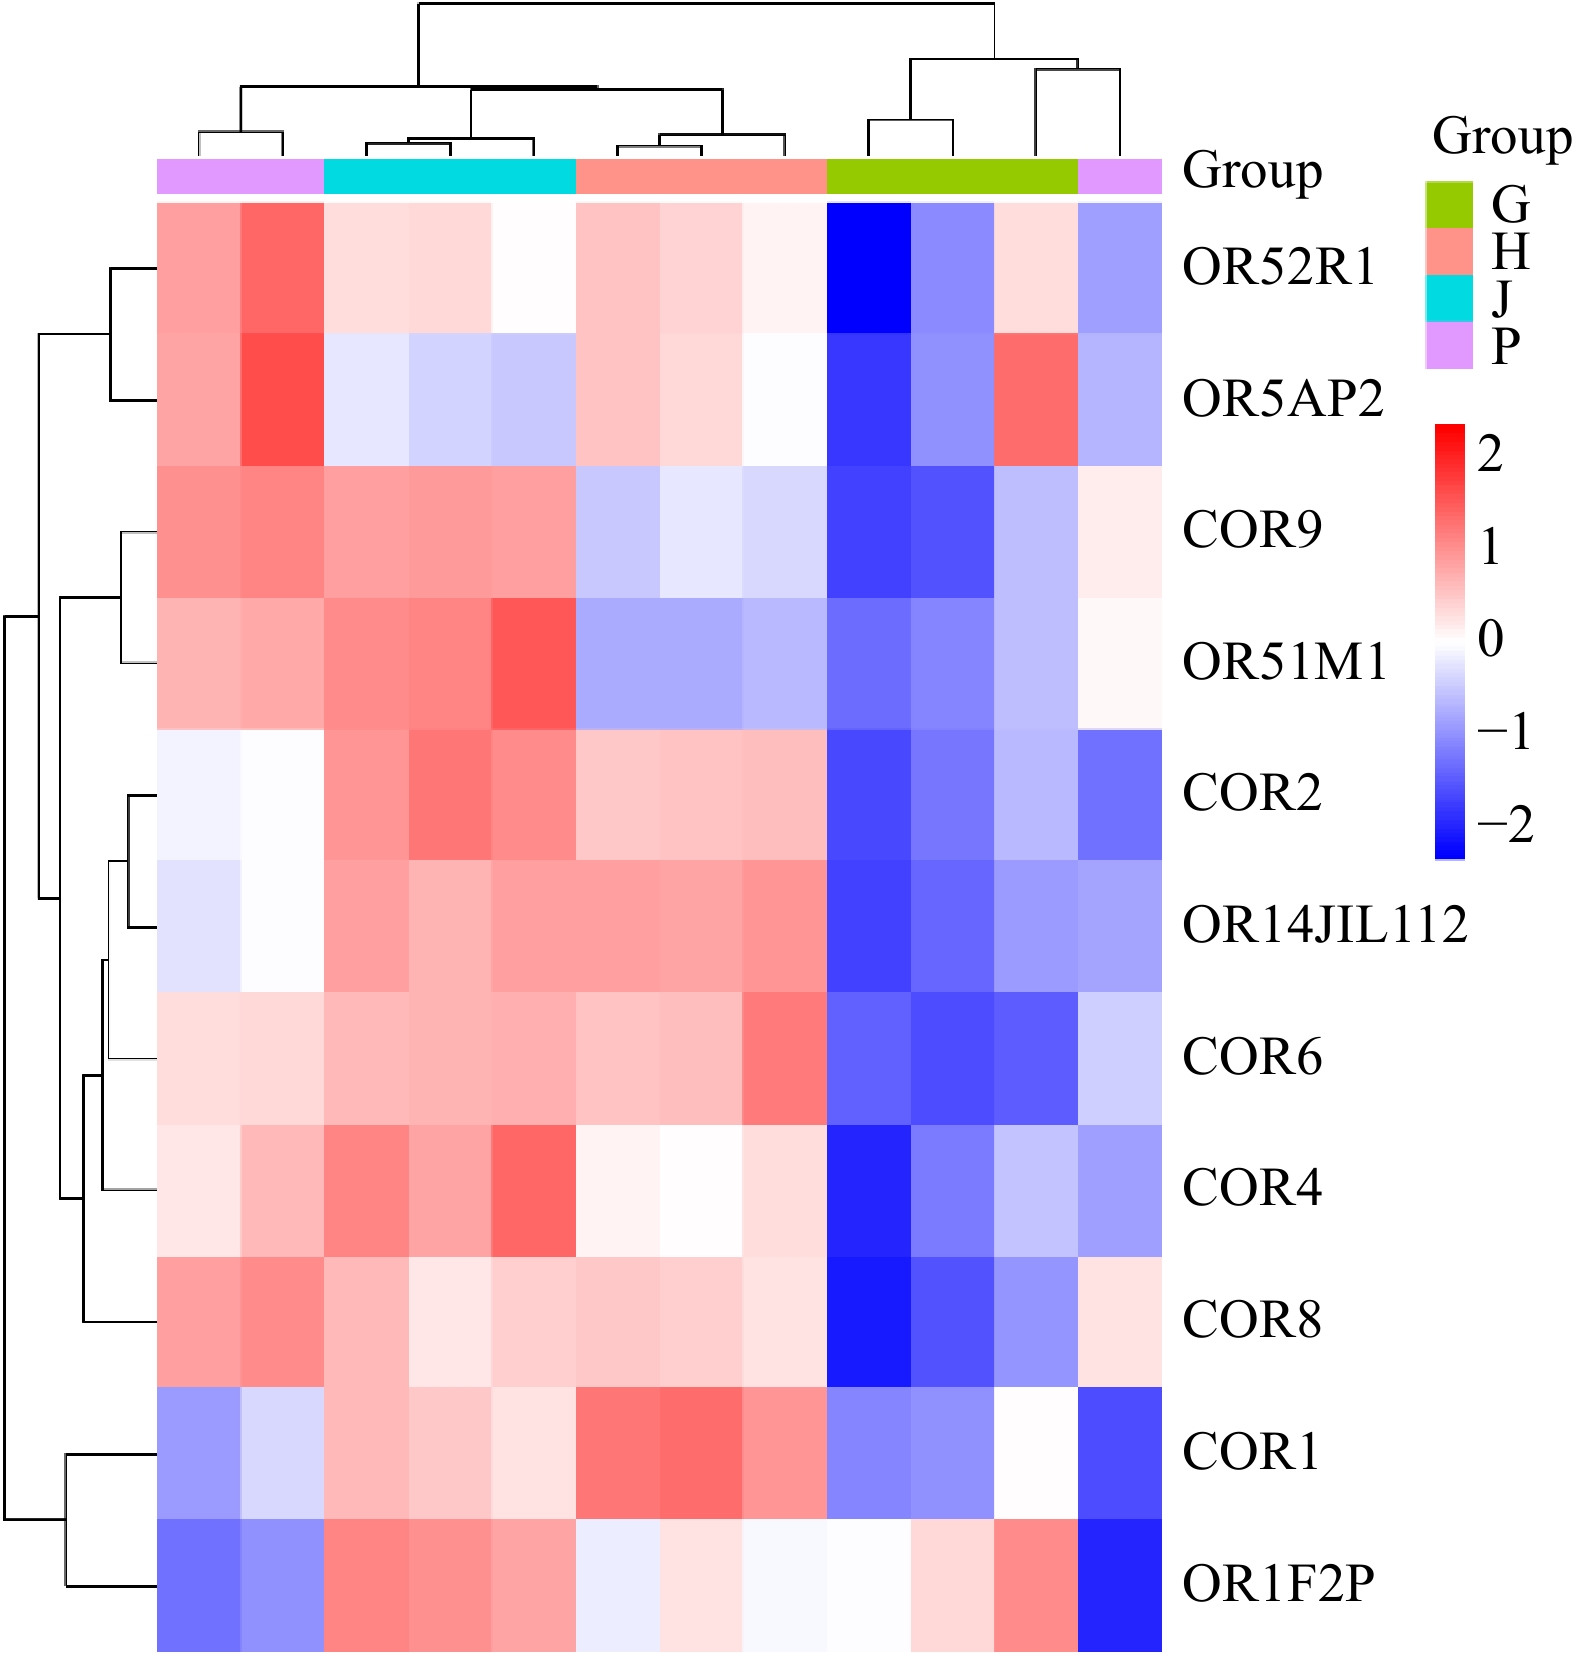
      Figure 9. 

      Heatmap analysis of the samples across different organs samples. P: Proventriculus, G: Gizzard, J: Jejunum, H: Hypothalamus.

    • The correlation matrix of samples in the image shows high correlations among different tissues of yellow broiler chickens: the gizzard (G), proventriculus (P), jejunum (J), and hypothalamus (H). The matrix uses a color gradient where warmer colors represent higher correlations, while cooler colors represent lower correlations. The gizzard samples are highly correlated with each other, showing correlation coefficients of 1.00. Their correlations with the proventriculus, jejunum, and hypothalamus are slightly lower but still high, mostly above 0.98. Moreover, the proventriculus samples are also strongly correlated within their group (correlations of 1.00). There is a moderate decrease in correlation with the hypothalamus samples (correlation ranging between 0.96 and 0.97). Additionally, Jejunum samples show strong correlations within their group (1.00). Their correlations with other tissue types (Gizzard, Proventriculus, and Hypothalamus) are above 0.99, indicating very close relationships. Furthermore, Hypothalamus samples have strong correlations among themselves (1.00). Their correlations with the gizzard and jejunum are very high (above 0.98), but correlations with the proventriculus are slightly lower, reaching down to 0.96 (Fig. 10).
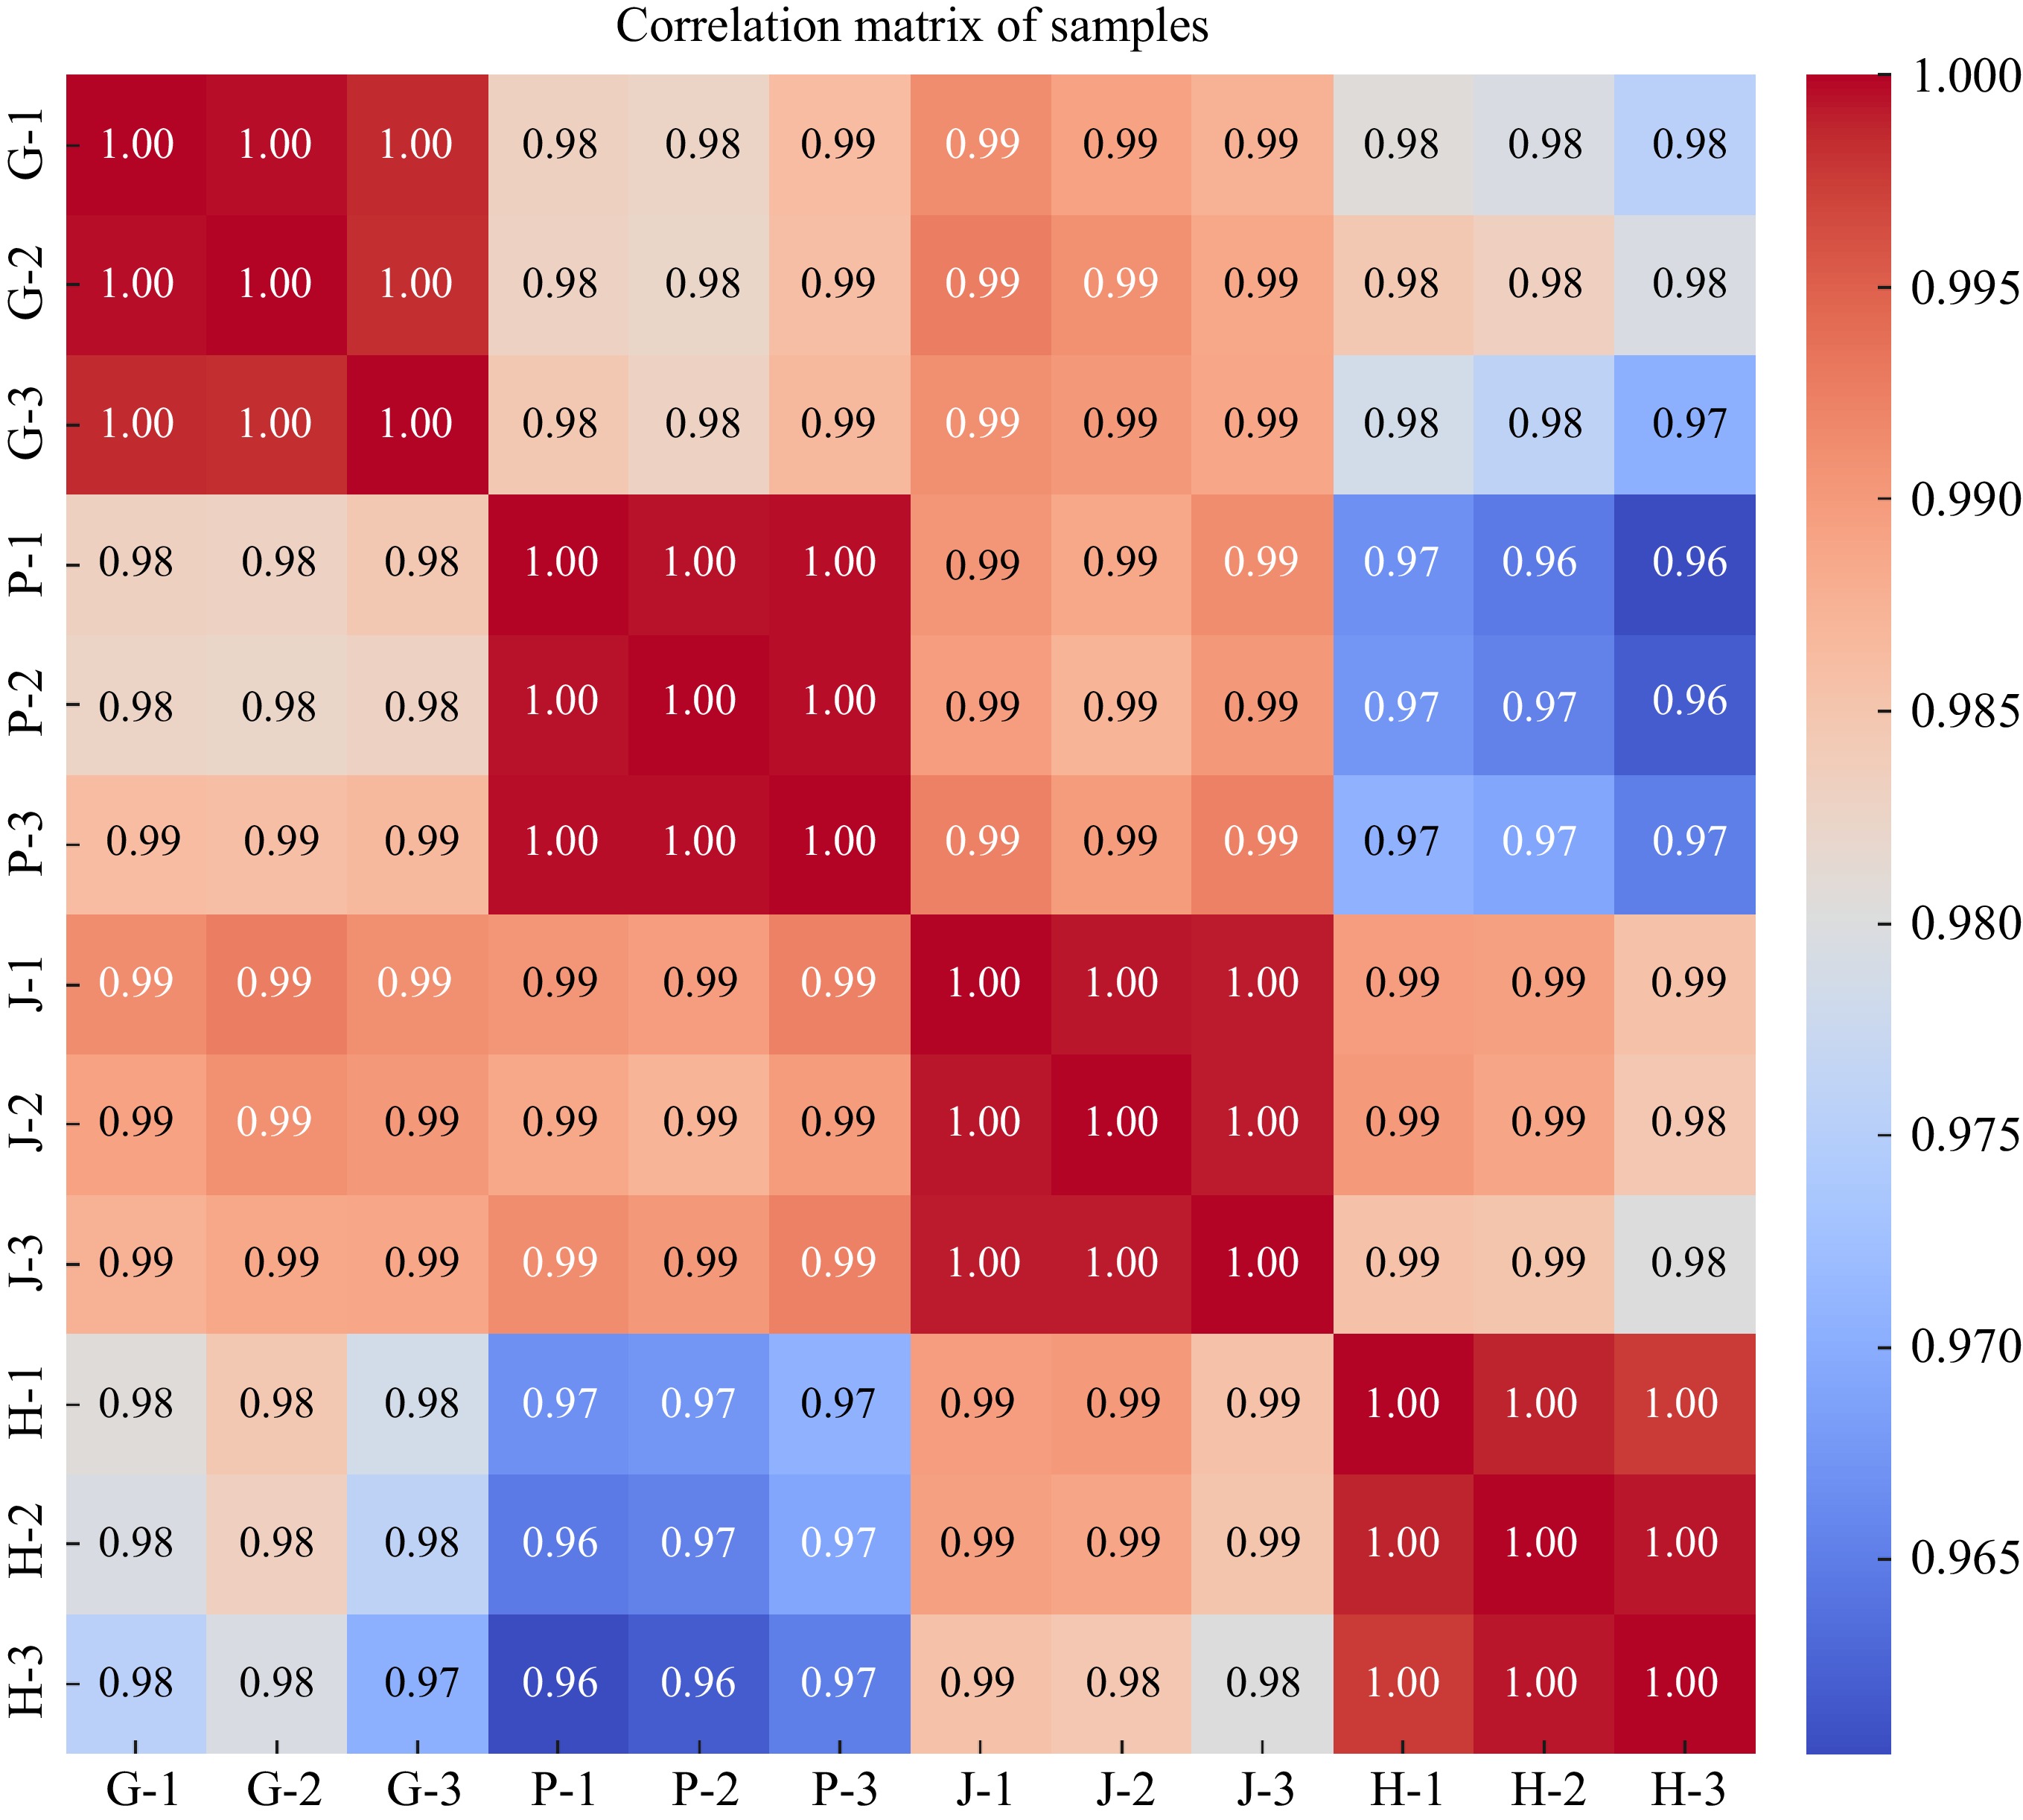
      Figure 10. 

      The image displays the correlation matrix of the samples, represented as a heatmap. This heatmap visualizes the correlation coefficients between each pair of samples. The color gradient reflects the strength of the correlations, with values near 1 (red) indicating a strong positive correlation, while values closer to −1 (blue) represent a strong negative correlation. The samples are labeled as follows: P for Proventriculus, G for Gizzard, J for Jejunum, and H for Hypothalamus.

    • To investigate the impact of FBP supplementation on immune-related genes expression, an in-depth analysis of IL-10, IL-2, and IL-6 genes in liver and spleen tissues were conducted, as elucidated in Fig. 11.
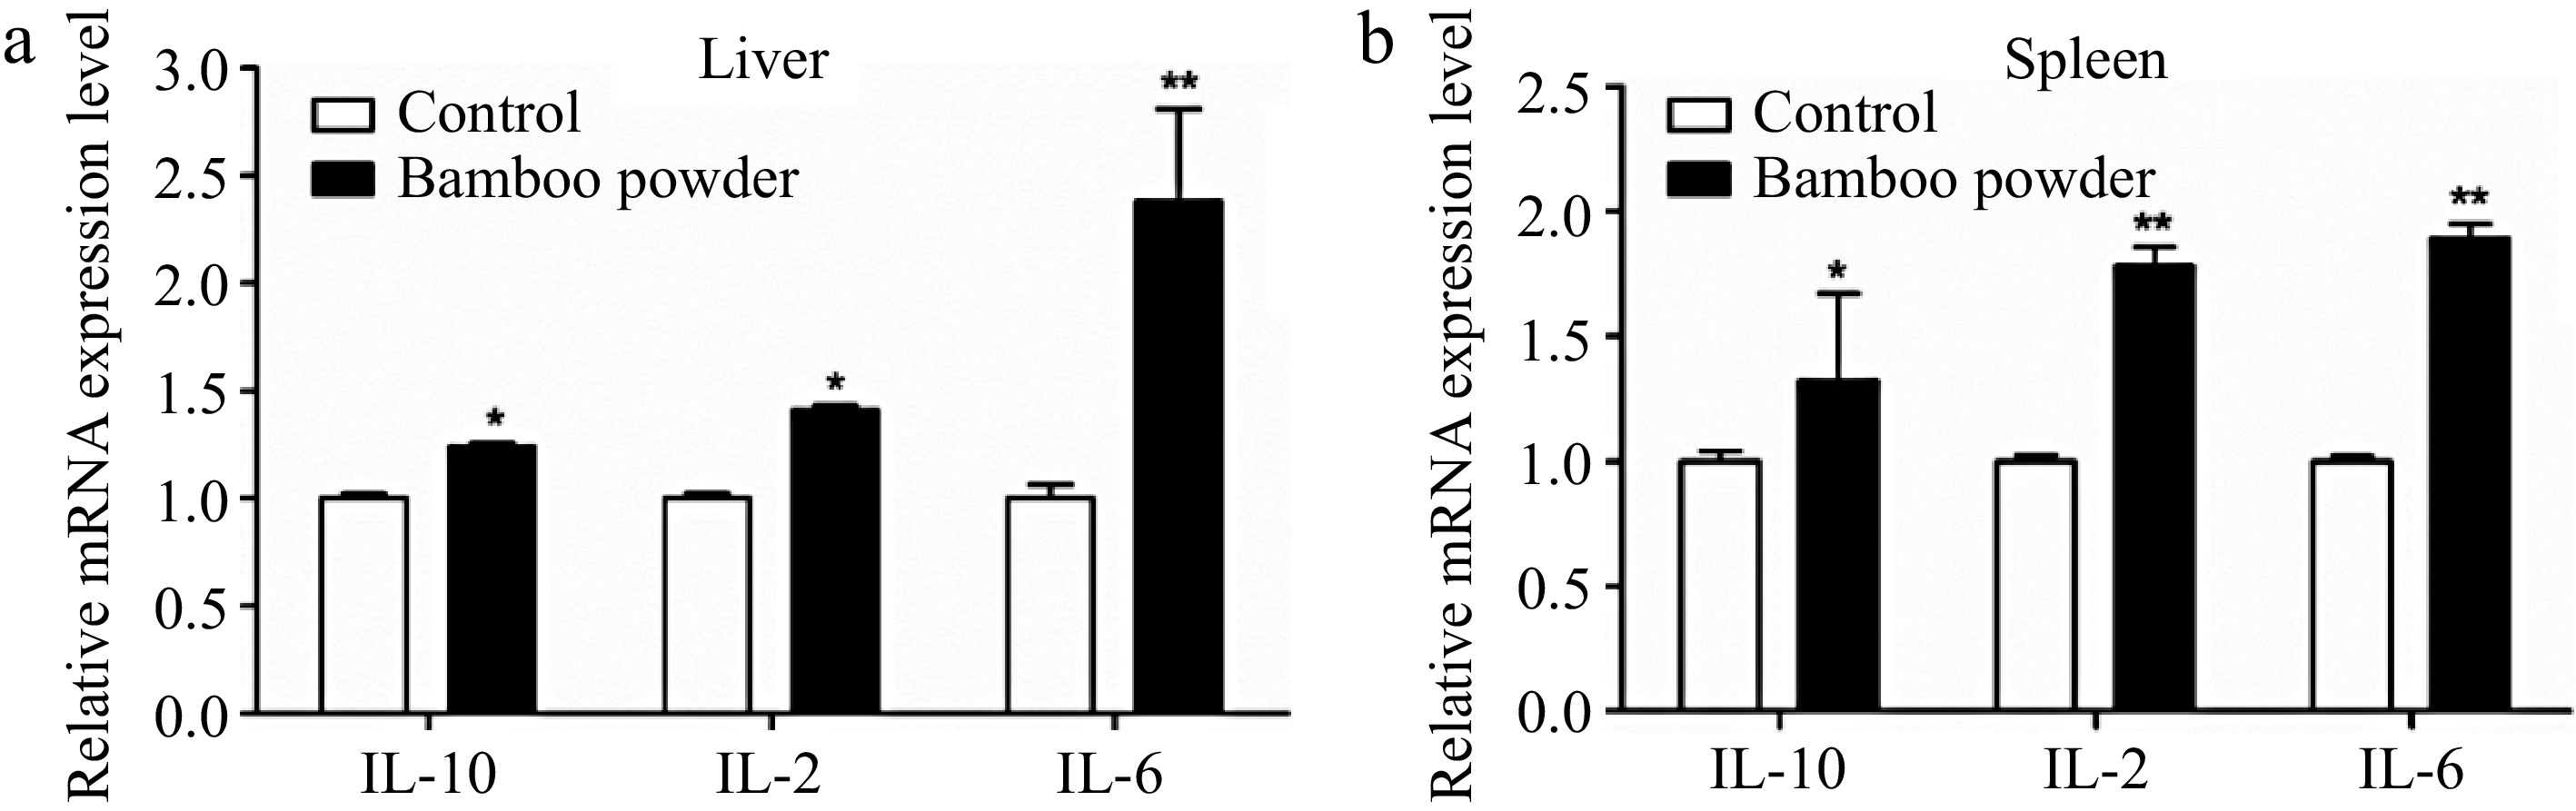
      Figure 11. 

      Effects of FBP on immune-related gene expression. The figure presents a detailed analysis of the expression levels of IL-10, IL-2, and IL-6 genes in (a) liver, and (b) spleen of broilers. The bar graphs illustrate the mean values, with error bars representing the standard error of the mean. Statistical significance is indicated by asterisks (*, **), where * denotes p < 0.05 and ** denotes p < 0.01, reflecting differences among the means.

      The present results demonstrate a marked upregulation in the mRNA expression levels of IL-10, IL-2, and IL-6 in the liver and spleen tissues of broilers supplemented with FBP. In the liver, the FBP-treated group exhibited a significant increase (p < 0.01) in the expression of IL-10, IL-2, and IL-6 compared to the control group. Similarly, in the spleen tissue, the FBP-supplemented group showed significantly (p < 0.05) elevated expression levels of these immune-related genes relative to the control group. These observed changes suggest enhanced immune regulatory activity, improved immune defense mechanisms, and the potential activation of the inflammatory response. The results underscore the positive impact of FBP supplementation on the modulation of immune-related genes in both the liver and spleen of broiler chickens, highlighting its potential role in bolstering immune responses and regulating inflammatory processes.

    • To investigate the effects of FBP supplementation on the expression of growth-related genes, a detailed analysis of IGF-1, IGF-2, IGFBP-1, IGFBP-2, IGFBP-3, and cGH genes in liver and breast muscle tissues were conducted, as illustrated in Fig. 12. The present findings demonstrate a significant increase (p < 0.01) in the mRNA expression levels of growth-related genes, including IGF-1, IGF-2, IGFBP-1, IGFBP-2, IGFBP-3, and cGH, in the liver of the FBP-supplemented group compared to the control group. Likewise, the breast muscle tissue of the FBP-supplemented group exhibited a notable upregulation (p < 0.05) in the expression of these genes relative to the control group. In summary, the overexpression of growth-related genes in both liver and breast muscle tissues indicates potential positive effects on development and growth. This upregulation reflects enhanced tissue differentiation and growth, emphasizing the beneficial role of FBP supplementation in modulating growth-related genes in broiler chickens.
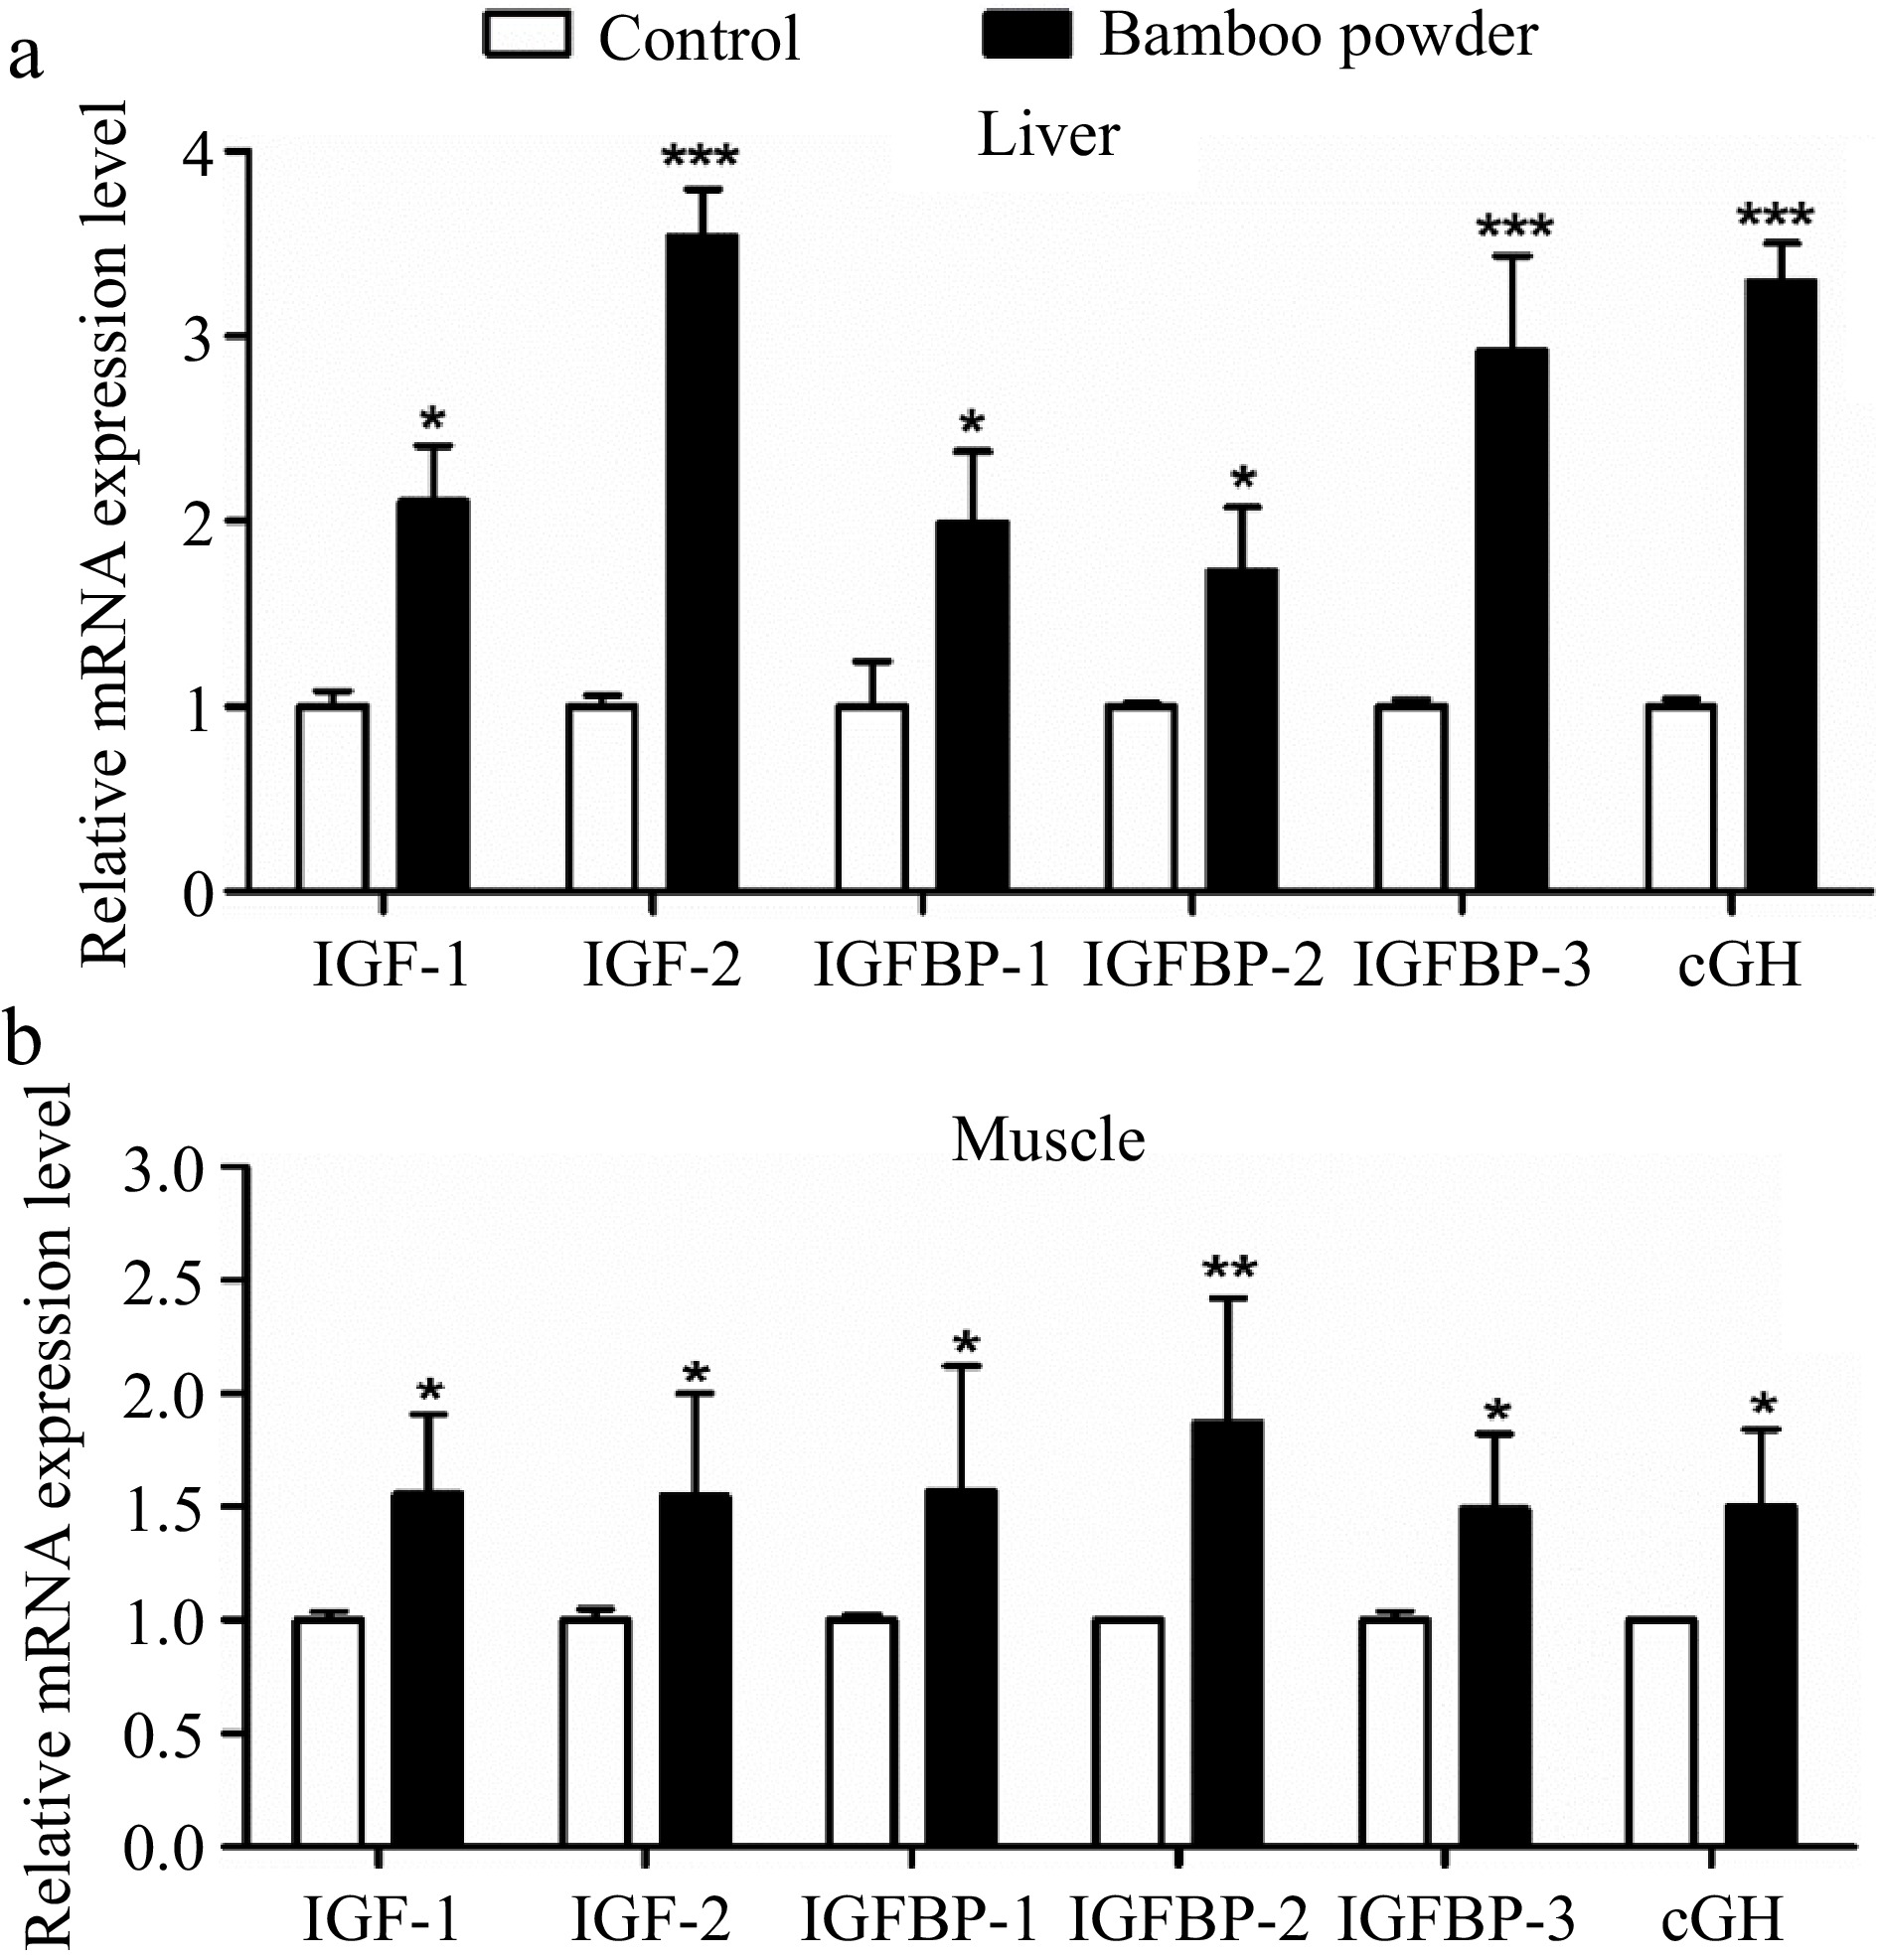
      Figure 12. 

      Effects of FBP on growth-related gene expression. The figure presents a comprehensive analysis of the expression levels of IGF-1, IGF-2, IGFBP-1, IGFBP-2, IGFBP-3, and cGH genes in (a) liver, and (b) muscle of broilers. The bar graphs represent the mean values for each gene, with error bars displaying the standard error of the mean. Statistical significance is indicated by asterisks (*, **, ***), where * denotes p < 0.05, ** indicates p < 0.01, and *** represents p < 0.001, highlighting differences among the means.

    • In the present study, a comprehensive heat map analysis was conducted to visualize the expression levels of genes associated with antioxidant, growth, and immunity in various tissues of Yellow-Feathered Broiler Chickens (Fig. 13). The heat map provided a graphical representation of gene expression patterns, with the intensity of color serving as an indicator of the relative expression of each gene. The heat map analysis corroborates and reinforces the earlier findings reported in Figs 3, 11 & 12, affirming the trends observed in gene expression levels. The visualization of antioxidant, growth, and immunity-related gene expressions provides a holistic understanding of the impact of FBP supplementation on the molecular dynamics within different tissues of broiler chickens. This comprehensive analysis further strengthens the evidence supporting the positive influence of FBP on gene expression profiles associated with antioxidant defense, growth promotion, and immune enhancement in Yellow-Feathered Broiler Chickens.
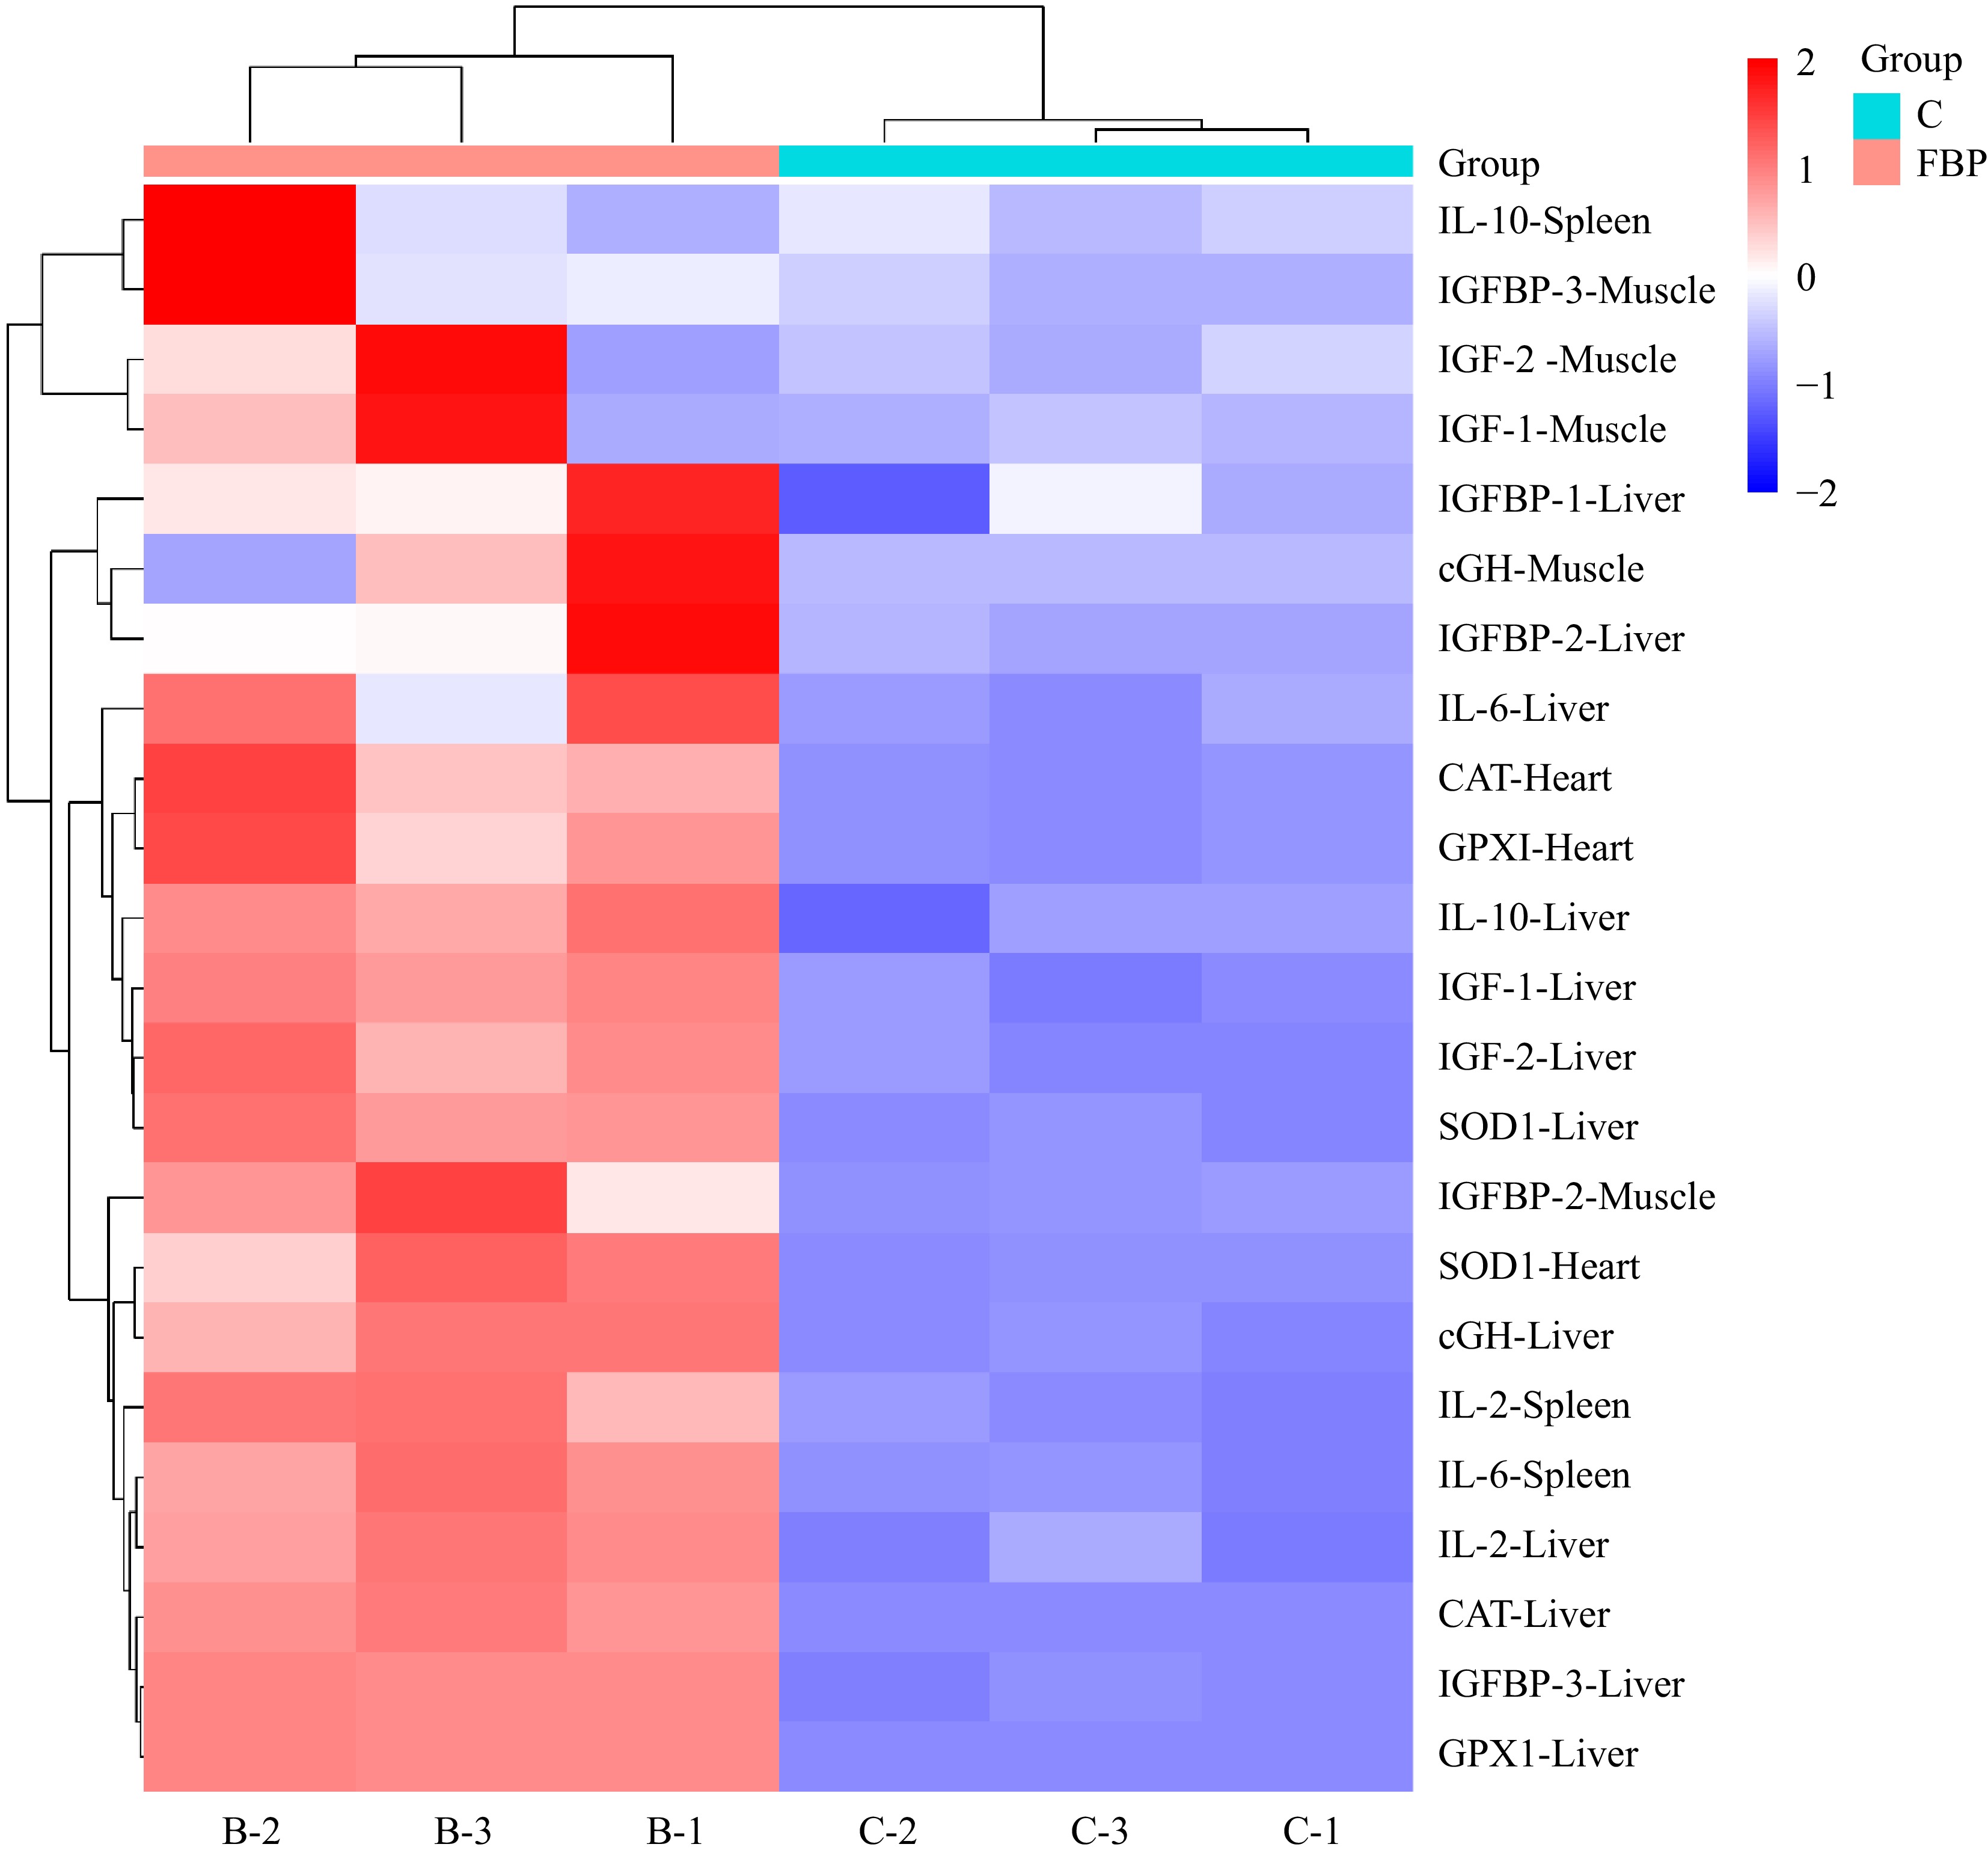
      Figure 13. 

      Heat map analysis of FBP-supplemented broiler chickens. The figure presents the heat map analysis of antioxidant, growth, and immunity-related genes in Yellow-Feathered Broiler Chickens supplemented with FBP. The color intensity in the heat map reflects the relative expression of genes in different tissues. Higher intensities of red signify elevated expression levels of the respective genes, whereas lower intensities of blue indicate diminished expression levels.

    • This study investigated the effects of supplementing Yellow-Feathered Broiler chicken diets with fermented bamboo powder on various physiological parameters, including growth performance, immune response, and antioxidant status. The results demonstrated significant changes in gene expression, serum biochemical markers, and hormone levels, highlighting the notable impact of FBP supplementation.

      Enhancements in intestinal morphology and organ development improve nutrient absorption, positively impacting growth performance. Incorporating an optimal amount of bamboo powder into broiler diets strengthens immune function and promotes intestinal health, leading to better growth outcomes[29]. Additionally, including 1%–1.5% insoluble dietary fiber from cassava pulp-modified fiber improves nutrient digestibility, reduces abdominal fat, and enhances muscle and gastric function in broilers[30]. Incorporating 3%–6% insoluble fiber into a wheat-based diet has been shown to improve broiler growth performance[31]. Similar outcomes have been observed with the addition of appropriate levels of structural insoluble dietary fiber[4]. However, a significant increase in fiber content considerably reduced the digestion of organic matter and energy[32]. Including 3%–6% insoluble fiber in the diet, such as sawdust, rice bran, or alfalfa meal, had no noticeable impact on broiler performance at slaughter[31]. Studies in chickens have shown that fasting leads to an increase in intrahepatic T4 levels and a decrease in T3 levels compared to chickens fed ad libitum[33]. Overall, feed additives have been investigated for their potential to modulate growth hormone levels in poultry. These additives may influence gut health and nutrient absorption, thereby indirectly affecting growth hormone regulation. Based on our research, adding FBP to broiler chicken diets can improve growth hormone levels in the serum, muscle, and liver, including IGF-1, GH, T3, and T4. As a previous study reported, chicken growth hormones, including cGH and IGF-I, are among the most crucial for growth performance and carcass quality in chickens[34].

      In nutritional evaluations, serum biological markers, immunoglobulins, and inflammatory cytokines are commonly used to assess the quality of test feedstuffs or additives, as they reflect the animals' physiological, metabolic, and immune status[3538]. In this study, the addition of FBP significantly affected immunoglobulins, inflammatory cytokines, and several serum biochemical markers. FBP supplementation increased AST, ALT, and ALP levels while reducing UREA and CREA levels compared to the control group. It also caused significant changes in inflammatory cytokines and immunoglobulins, including TNF-α, IL-10, IgA, IgG, IgM, IL-2, IL-6, and IL-1β. These findings align with previous research, which suggests that serum biochemical parameters are inversely related to the risk of cardiovascular disease, metabolic syndrome, liver and kidney disorders, and obesity[39]. In addition to improving immunological and serum biochemical markers, the addition of FBP to the diet also altered the pigs' fecal microbiome. These findings suggest that FBP could be a potential fiber-rich component for growing and finishing pigs, with a recommended inclusion of 5% in their diet[40]. Consistent with previous studies, the addition of FBP increased serum IgA concentrations, supporting findings from earlier research[41]. IgA plays a crucial role in defending against bacterial and viral infections in both serum and mucosal secretions[42].

      Published studies suggest that the antioxidant properties of flavonoids in biological systems are attributed to their ability to transfer electron free radicals, chelate metal catalysts, activate antioxidant enzymes, and inhibit oxidase activity[43]. It is likely that the flavonoids in bamboo leaf extract (BLE) significantly contribute to increased antioxidant enzyme activity. The study indicates that BLE can scavenge peroxide[44]. As previously reported, dismutase mRNA expression in ileum tissue was significantly elevated when 1.0, 2.0, or 4.0 g/kg of BLE was added to poultry feed[45]. The current study found that the addition of FBP positively influenced the expression of genes related to antioxidants. Compared to the control group, FBP supplementation enhanced the expression of SOD1, GPX1, and CAT in the liver and heart. Similarly, research revealed that treating broiler chicks with BLE increased the expression of many of these antioxidant enzymes and their antioxidant capacity[46].

      In this study, the expression levels of odorant receptors were investigated in various tissues, specifically the hypothalamus and gut. Our findings revealed significantly higher expression levels of odorant receptors in the hypothalamus compared to the gut. These results are consistent with previous studies, which also reported higher expression of odorant receptor genes in the brain than in the gut[47]. An intriguing hypothesis emerging from these findings is that odorant molecules encountered during food consumption may be transported to the brain, where they could influence neural regions involved in regulating food-related behaviors[47]. This aligns with previous studies suggesting that odorant receptors (ORs) may play significant roles in the central nervous system beyond olfaction. For example, Jiang et al. demonstrated that ORs in the hypothalamus are involved in detecting metabolic states and mediating feeding behaviors. The abundant presence of ORs in this brain region suggests they may sense endogenous or exogenous chemical signals that influence hypothalamic functions[48]. Although the expression levels of ORs were lower in gut tissues compared to the hypothalamus, their presence in the gastrointestinal tract is still noteworthy. ORs in gut tissues are thought to contribute to various physiological processes, including digestion, nutrient absorption, and gut motility. Previous research has shown that ORs can detect dietary chemicals and microbial metabolites, influencing gut function and health[49]. Additionally, in rodents, odorant receptors are found in several brain regions, such as the hypothalamus and the ventral tegmental area (VTA)[50]. In vitro experiments have shown that dopaminergic neurons in the VTA, which express odorant receptors, respond to natural odorant molecules. However, the exact endogenous ligands responsible for activating these receptors have yet to be identified. Notably, all odorant receptors analyzed in the study were expressed in the adult brain, with a particular presence in the habenula and hypothalamus. The hypothalamus is well-established as a key regulator of food intake[51,52] , while recent research has also implicated the habenula in the modulation of food-related behaviors[5355].

      This study explored the expression levels of odorant receptors (ORs) across various tissues of the model organism, focusing on the small intestines, gizzard, and proventriculus. Using molecular techniques such as RT-PCR and qRT-PCR, the findings revealed that ORs were expressed at significantly higher levels in the small intestines compared to the gizzard and proventriculus. These results provide new insights into the potential physiological roles of ORs within distinct regions of the avian gastrointestinal tract, suggesting specific functions related to nutrient detection and gut health. Notably, the small intestines are the primary site for nutrient digestion and absorption in birds. The significantly higher OR expression levels in this tissue suggest that these receptors play a key role in detecting and responding to various chemical cues related to ingested food. Previous studies in mammals have shown that ORs in the gut can detect dietary components and microbial metabolites, influencing digestion, nutrient absorption, and gut motility[49,56]. The present findings support the idea that ORs in the small intestines of birds may serve similar functions. The high expression levels of ORs in the small intestines could facilitate the detection of specific nutrients and other chemical signals, optimizing the digestive process and enhancing nutrient uptake. This capability may be particularly important for avian species with varied diets, enabling them to efficiently process and utilize a wide range of dietary components. Additionally, ORs in the small intestines might play a role in regulating the gut microbiota by detecting microbial metabolites and modulating immune responses to maintain gut health[57]. Overall, these results highlight the potential benefits of FBP supplementation, including enhanced health and development, as well as positive effects on growth hormone levels, biochemical markers, antioxidant activity, and the expression of immune-related and odorant receptor genes.

    • The study findings demonstrated that adding FBP to the diet had a significant positive impact on several aspects of biological functioning. FBP also increased growth hormone levels, serum biochemical markers, and growth-related functions. Overall, the results suggest potential benefits of FBP supplementation for immune-related gene expression, activation of odorant receptors, growth hormone regulation, biochemical indicators, antioxidant activity, and growth processes. These findings highlight FBP’s potential as a natural dietary supplement to promote general health and well-being. However, it is crucial to conduct further investigations to fully understand the mechanisms underlying these effects and to evaluate the long-term efficacy and safety of FBP supplementation.

    • All procedures were reviewed and preapproved by the the Institutional Animal Care and Ethical Committee of Nanjing Agricultural University (Nanjing, China), identification number: SYXK (Su) 2022–0031, approval date: 01/09/2022. Temperature was carefully controlled throughout the study, starting at 32–35 °C for the first five days, then gradually reduced to 22 °C and maintained consistently until the end of the experiment. At the conclusion, a total of 10 chickens were humanely euthanized. The research aimed to examine the effects of fermented bamboo powder (FBP) on the expression of genes related to antioxidants, odorant receptors, growth, and immunity in Yellow-Feathered Broiler chickens. The research followed the 'Replacement, Reduction, and Refinement' principles to minimize harm to animals. This article provides details on the housing conditions, care, and pain management for the animals, ensuring that the impact on the animals is minimized during the experiment.

      • This research was funded by the Jiangsu Provincial Seed Industry Revitalization Project (JBGS (2021) 108). The study was conducted at the College of Animal Science and Technology, Nanjing Agricultural University, Nanjing, Jiangsu, China.

      • The authors confirm contribution to the paper as follows: study conception and design: Malyar RM, Shi F; data collection: Malyar RM, Hou L, Elsaid SH; analysis and interpretation of results: Malyar RM, Ali I, Shi F; draft manuscript preparation: Malyar RM, Ding W, Wei Q, Zhou W. All authors examined the findings and gave their approval for the final version of the manuscript.

      • All data generated or analyzed during this study are included in this published article.

      • This article does not have any conflicts of interest. Weisheng Zhou and Fangxiong Shi are the Editorial Board members of Animal Advances who were blinded from reviewing or making decisions on the manuscript. The article was subject to the journal's standard procedures, with peer-review handled independently of these Editorial Board members and the research groups.

      • Copyright: © 2024 by the author(s). Published by Maximum Academic Press on behalf of Nanjing Agricultural University. This article is an open access article distributed under Creative Commons Attribution License (CC BY 4.0), visit https://creativecommons.org/licenses/by/4.0/.
    Figure (13)  Table (5) References (57)
  • About this article
    Cite this article
    Malyar RM, Ding W, Wei Q, Sun J, Hou L, et al. 2024. Effects of fermented bamboo powder supplementation on gene expressions of antioxidant, odorant receptors, growth and immunity in yellow-feather broiler chickens. Animal Advances 1: e005 doi: 10.48130/animadv-0024-0005
    Malyar RM, Ding W, Wei Q, Sun J, Hou L, et al. 2024. Effects of fermented bamboo powder supplementation on gene expressions of antioxidant, odorant receptors, growth and immunity in yellow-feather broiler chickens. Animal Advances 1: e005 doi: 10.48130/animadv-0024-0005

Catalog

  • About this article

/

DownLoad:  Full-Size Img  PowerPoint
Return
Return