-
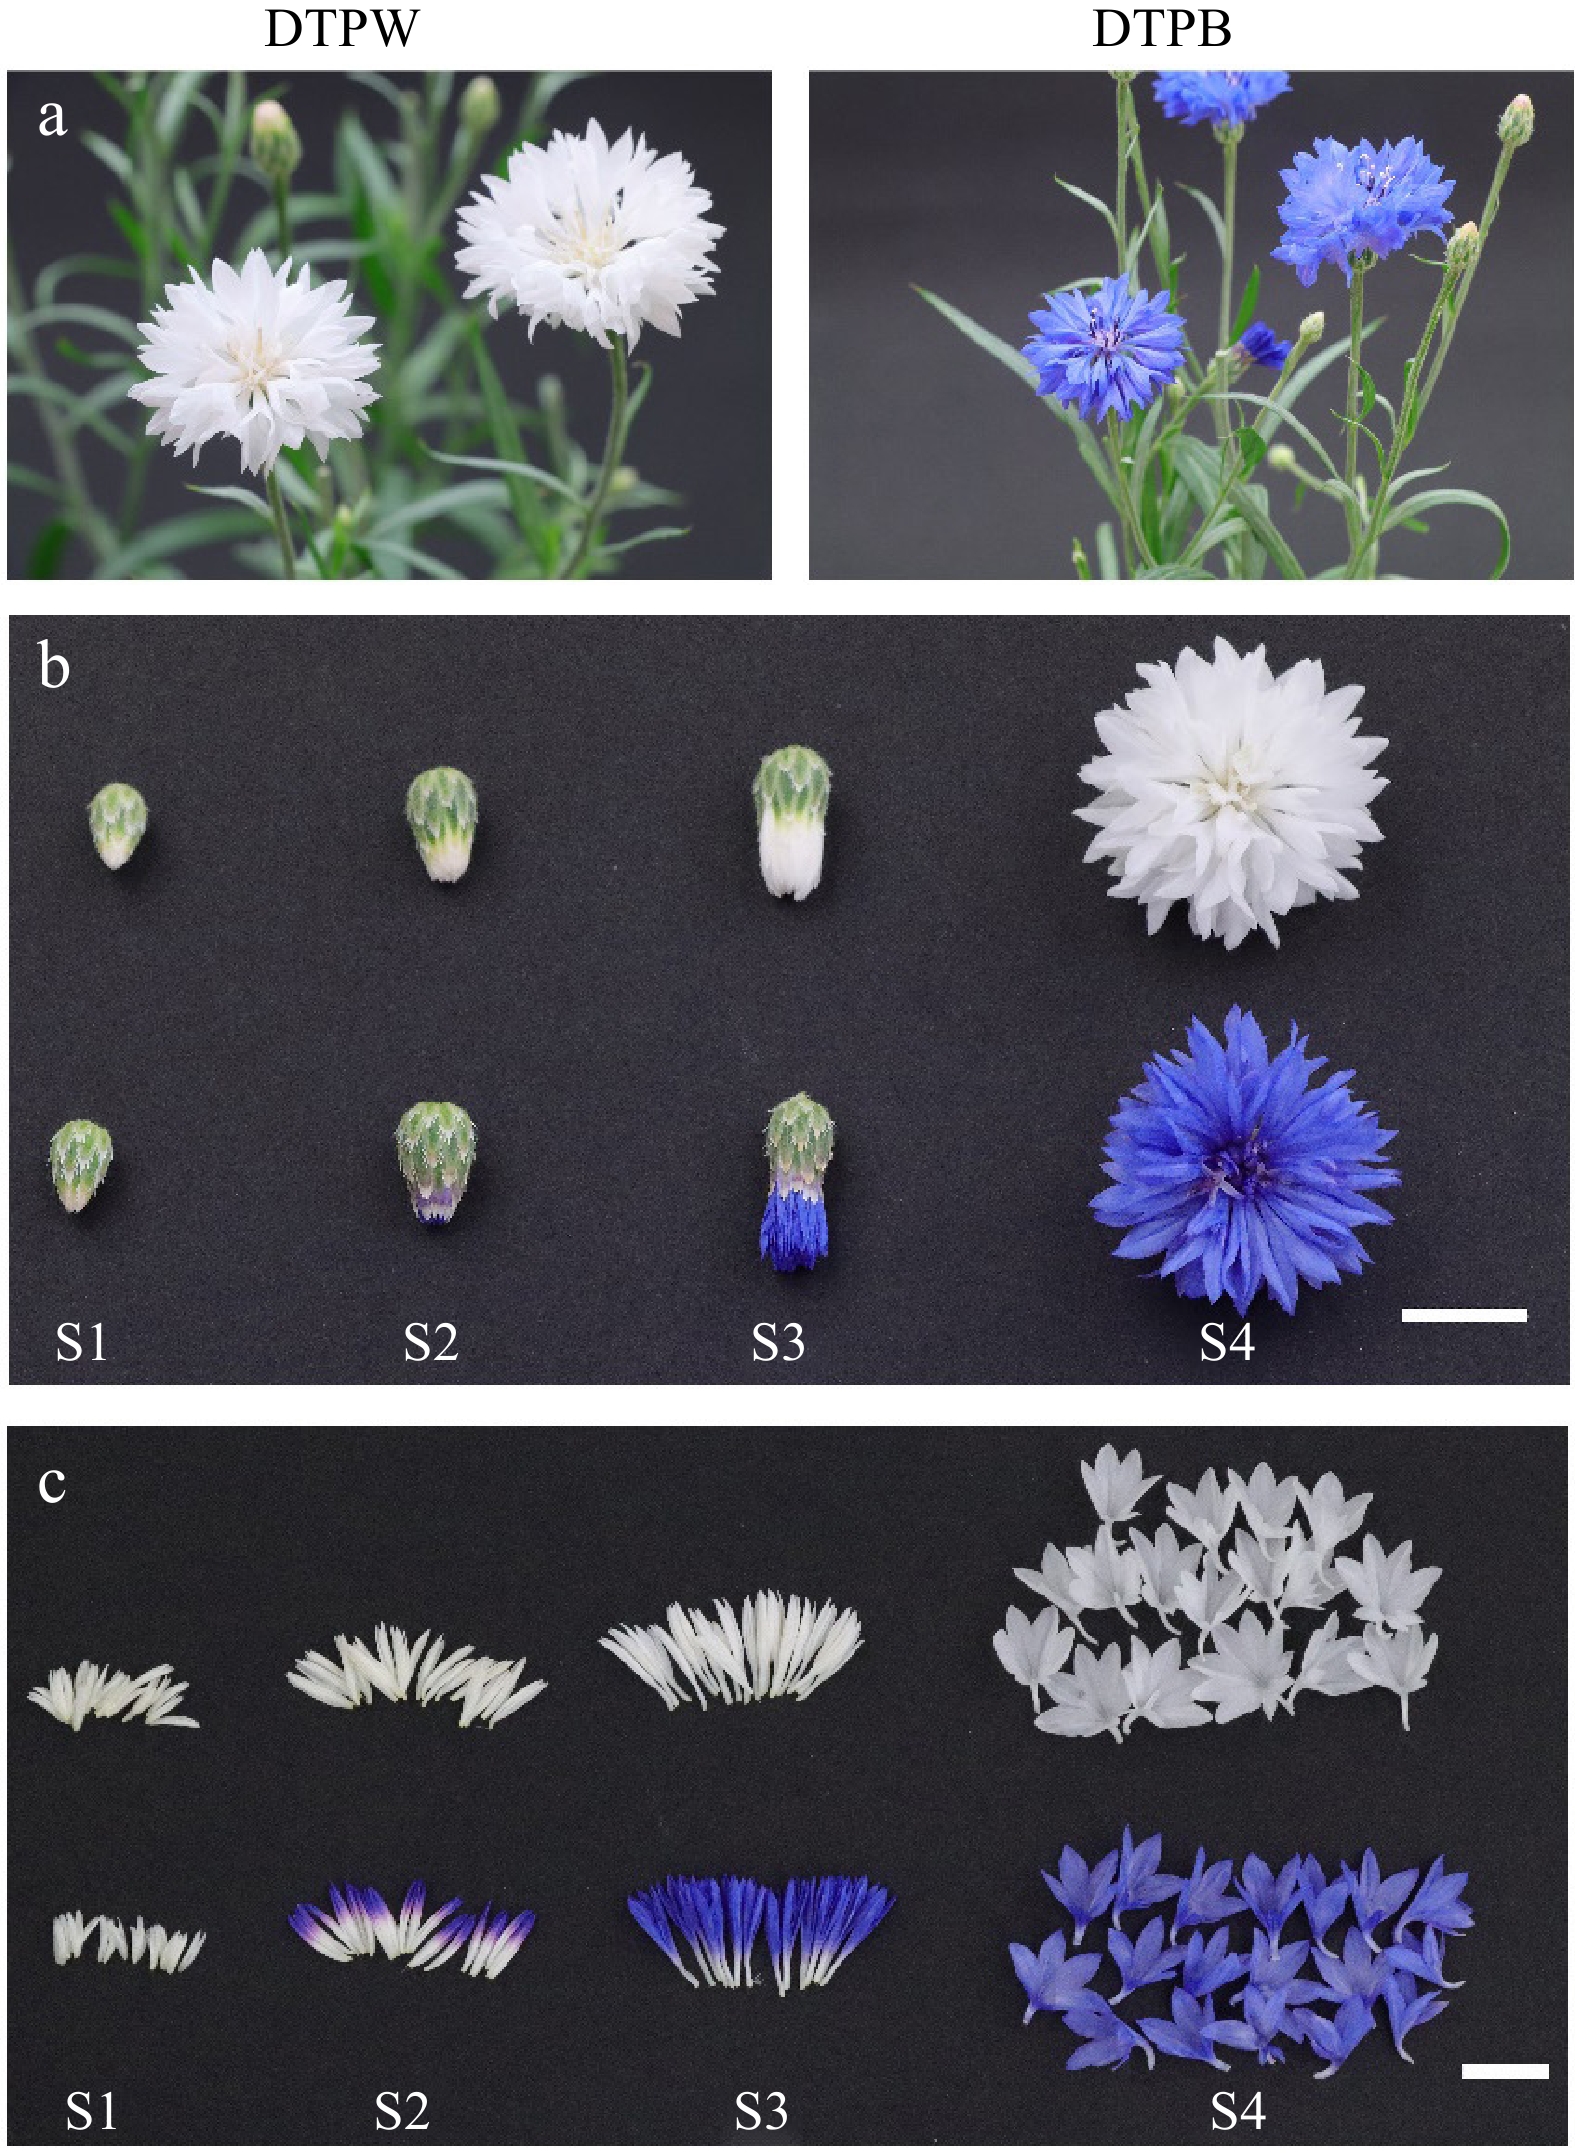
Figure 1.
Different cultivars and developmental stages of cornflower. (a) Two cornflower cultivars with white and blue petals in DTPW and DTPB, respectively. (b) The capitula were classified into four developmental stages, bar = 1 cm. (c) The pigmentation pattern of cornflower petals in different developmental stages, bar = 1 cm.
-
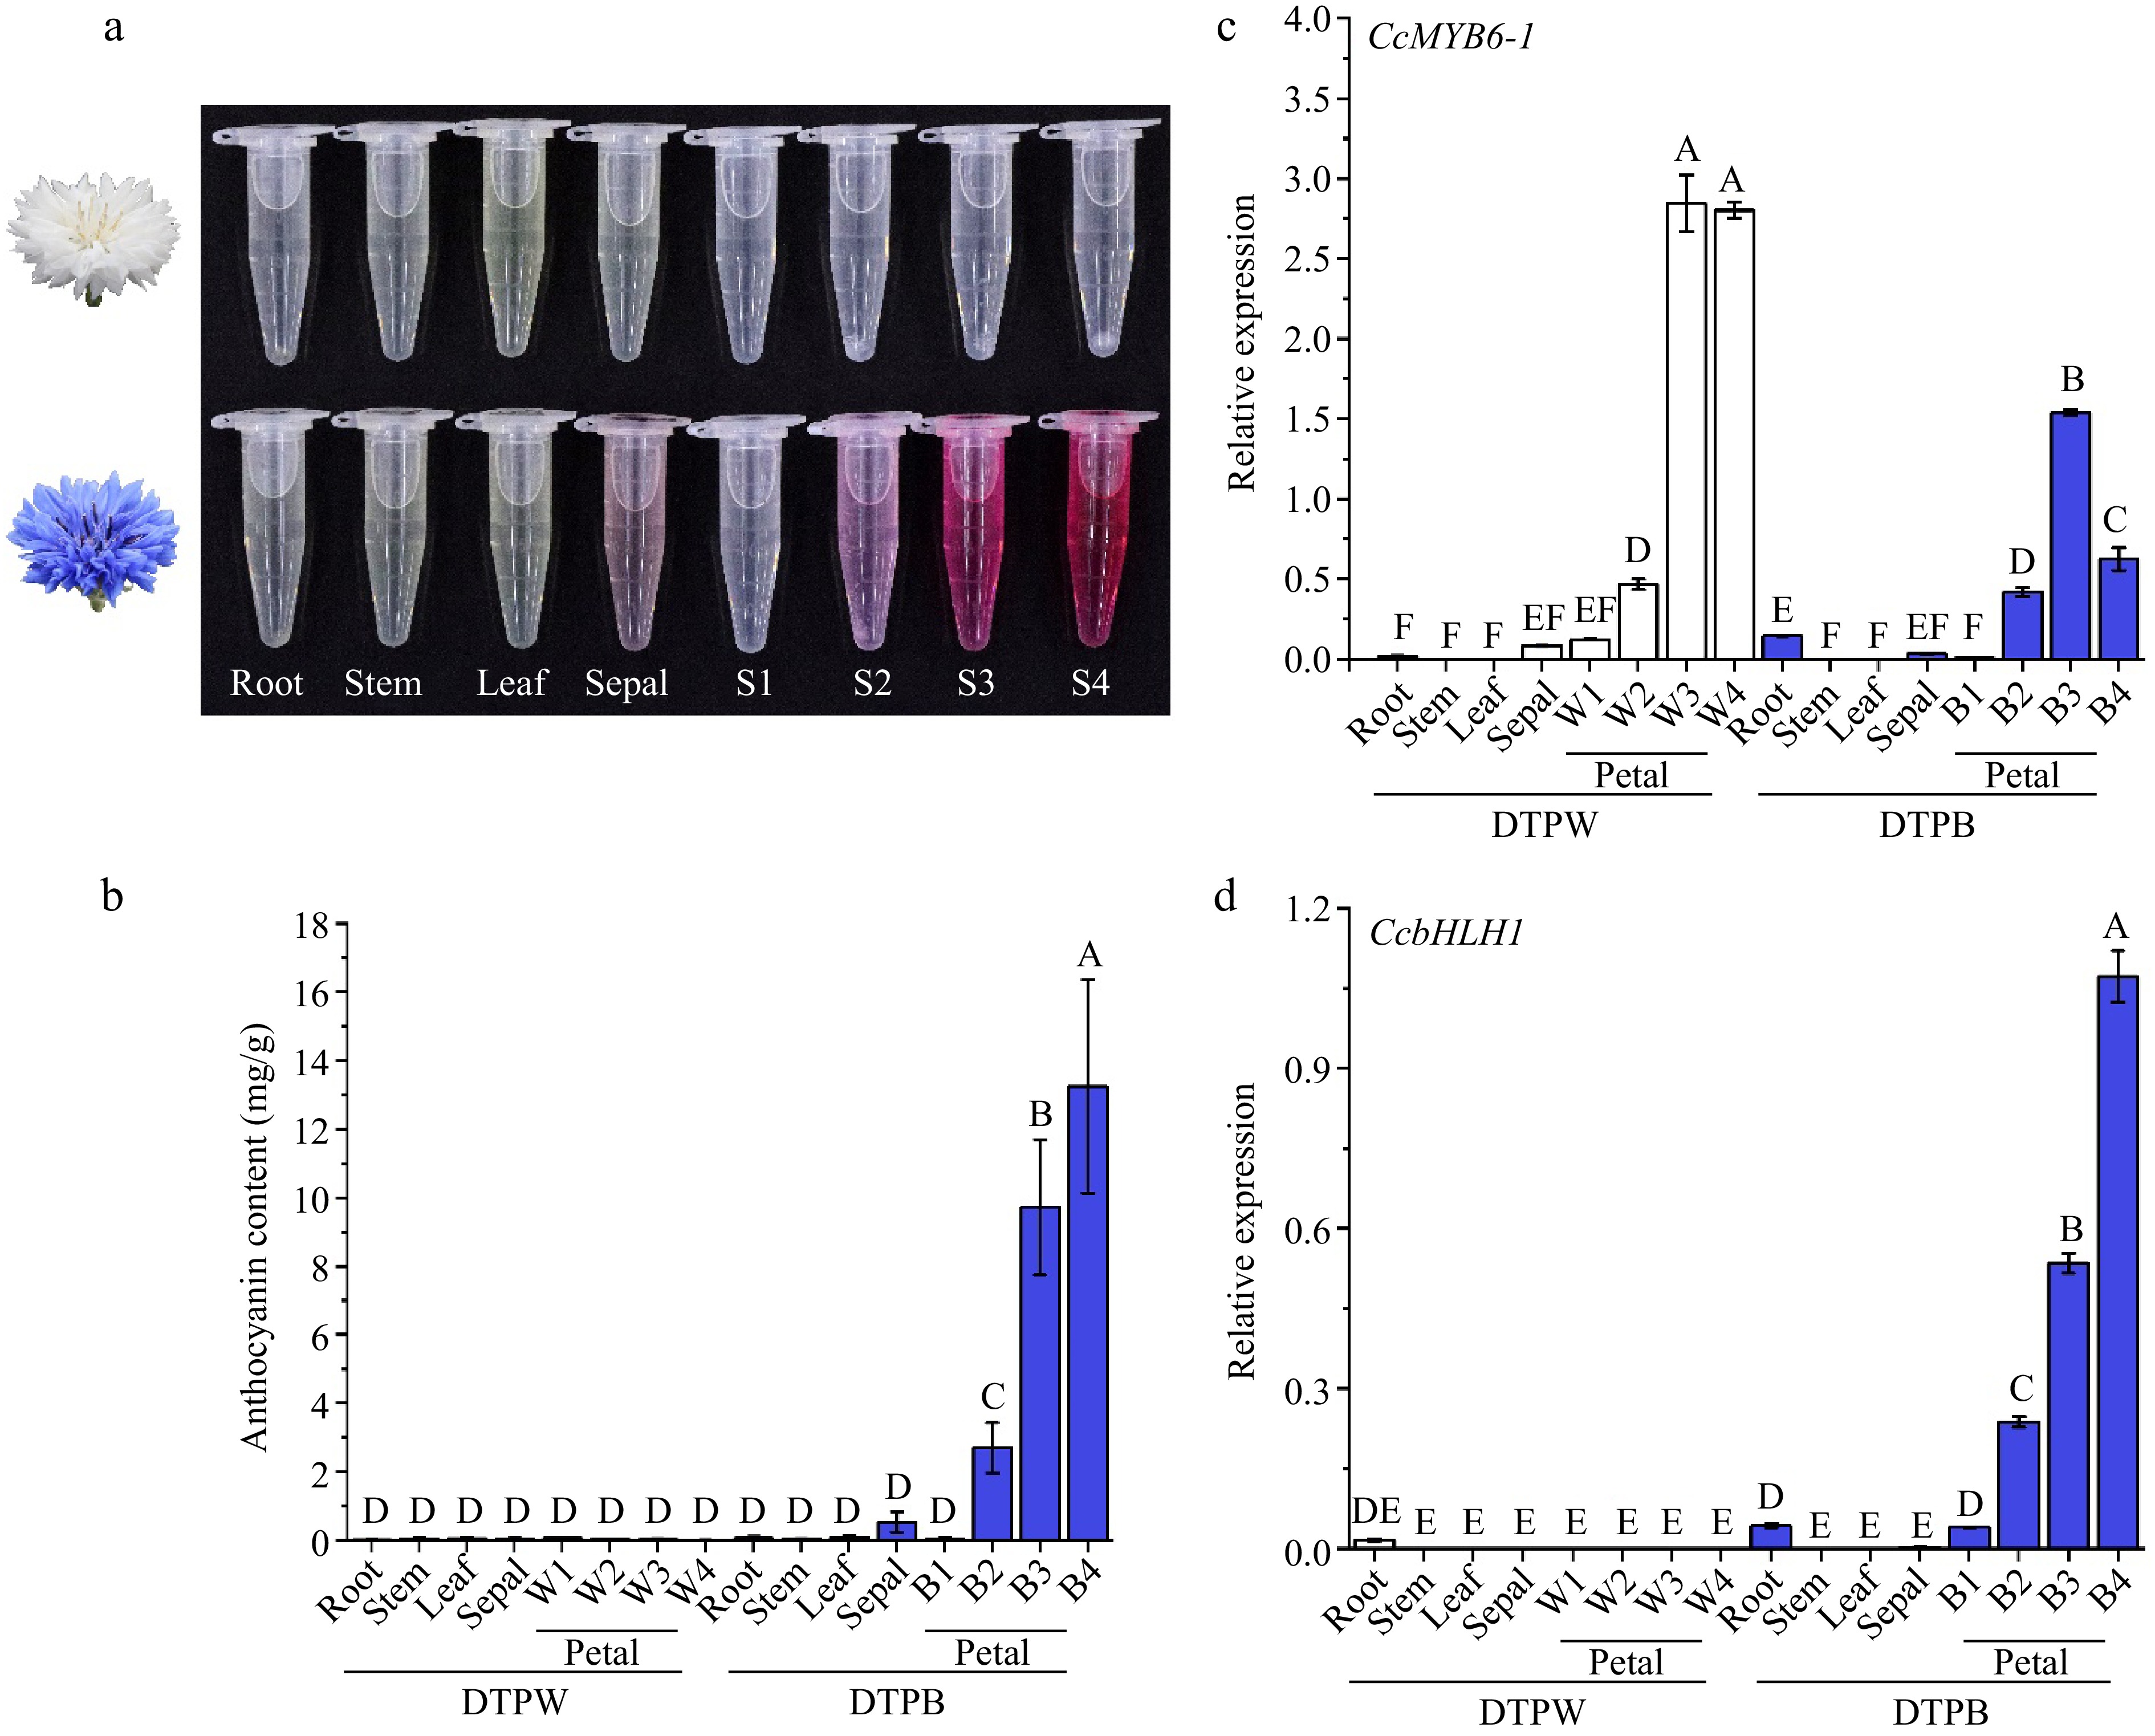
Figure 2.
Anthocyanins showed specific accumulation in different cultivars and organs of cornflower. (a) The anthocyanin extracts of distinct organs from DTPW and DTPB. (b) Anthocyanin content in different cultivars and organs. Error bars were the S.E. of four biological replicates with each from three individual plantlets. (c), (d) The spatio and temporal expression patterns of CcMYB6-1 and CcbHLH1 in DTPW and DTPB. Error bars were the S.E. of three technical replicates. Different capital letters indicate significant difference at 1% level by Duncan's multiple test.
-
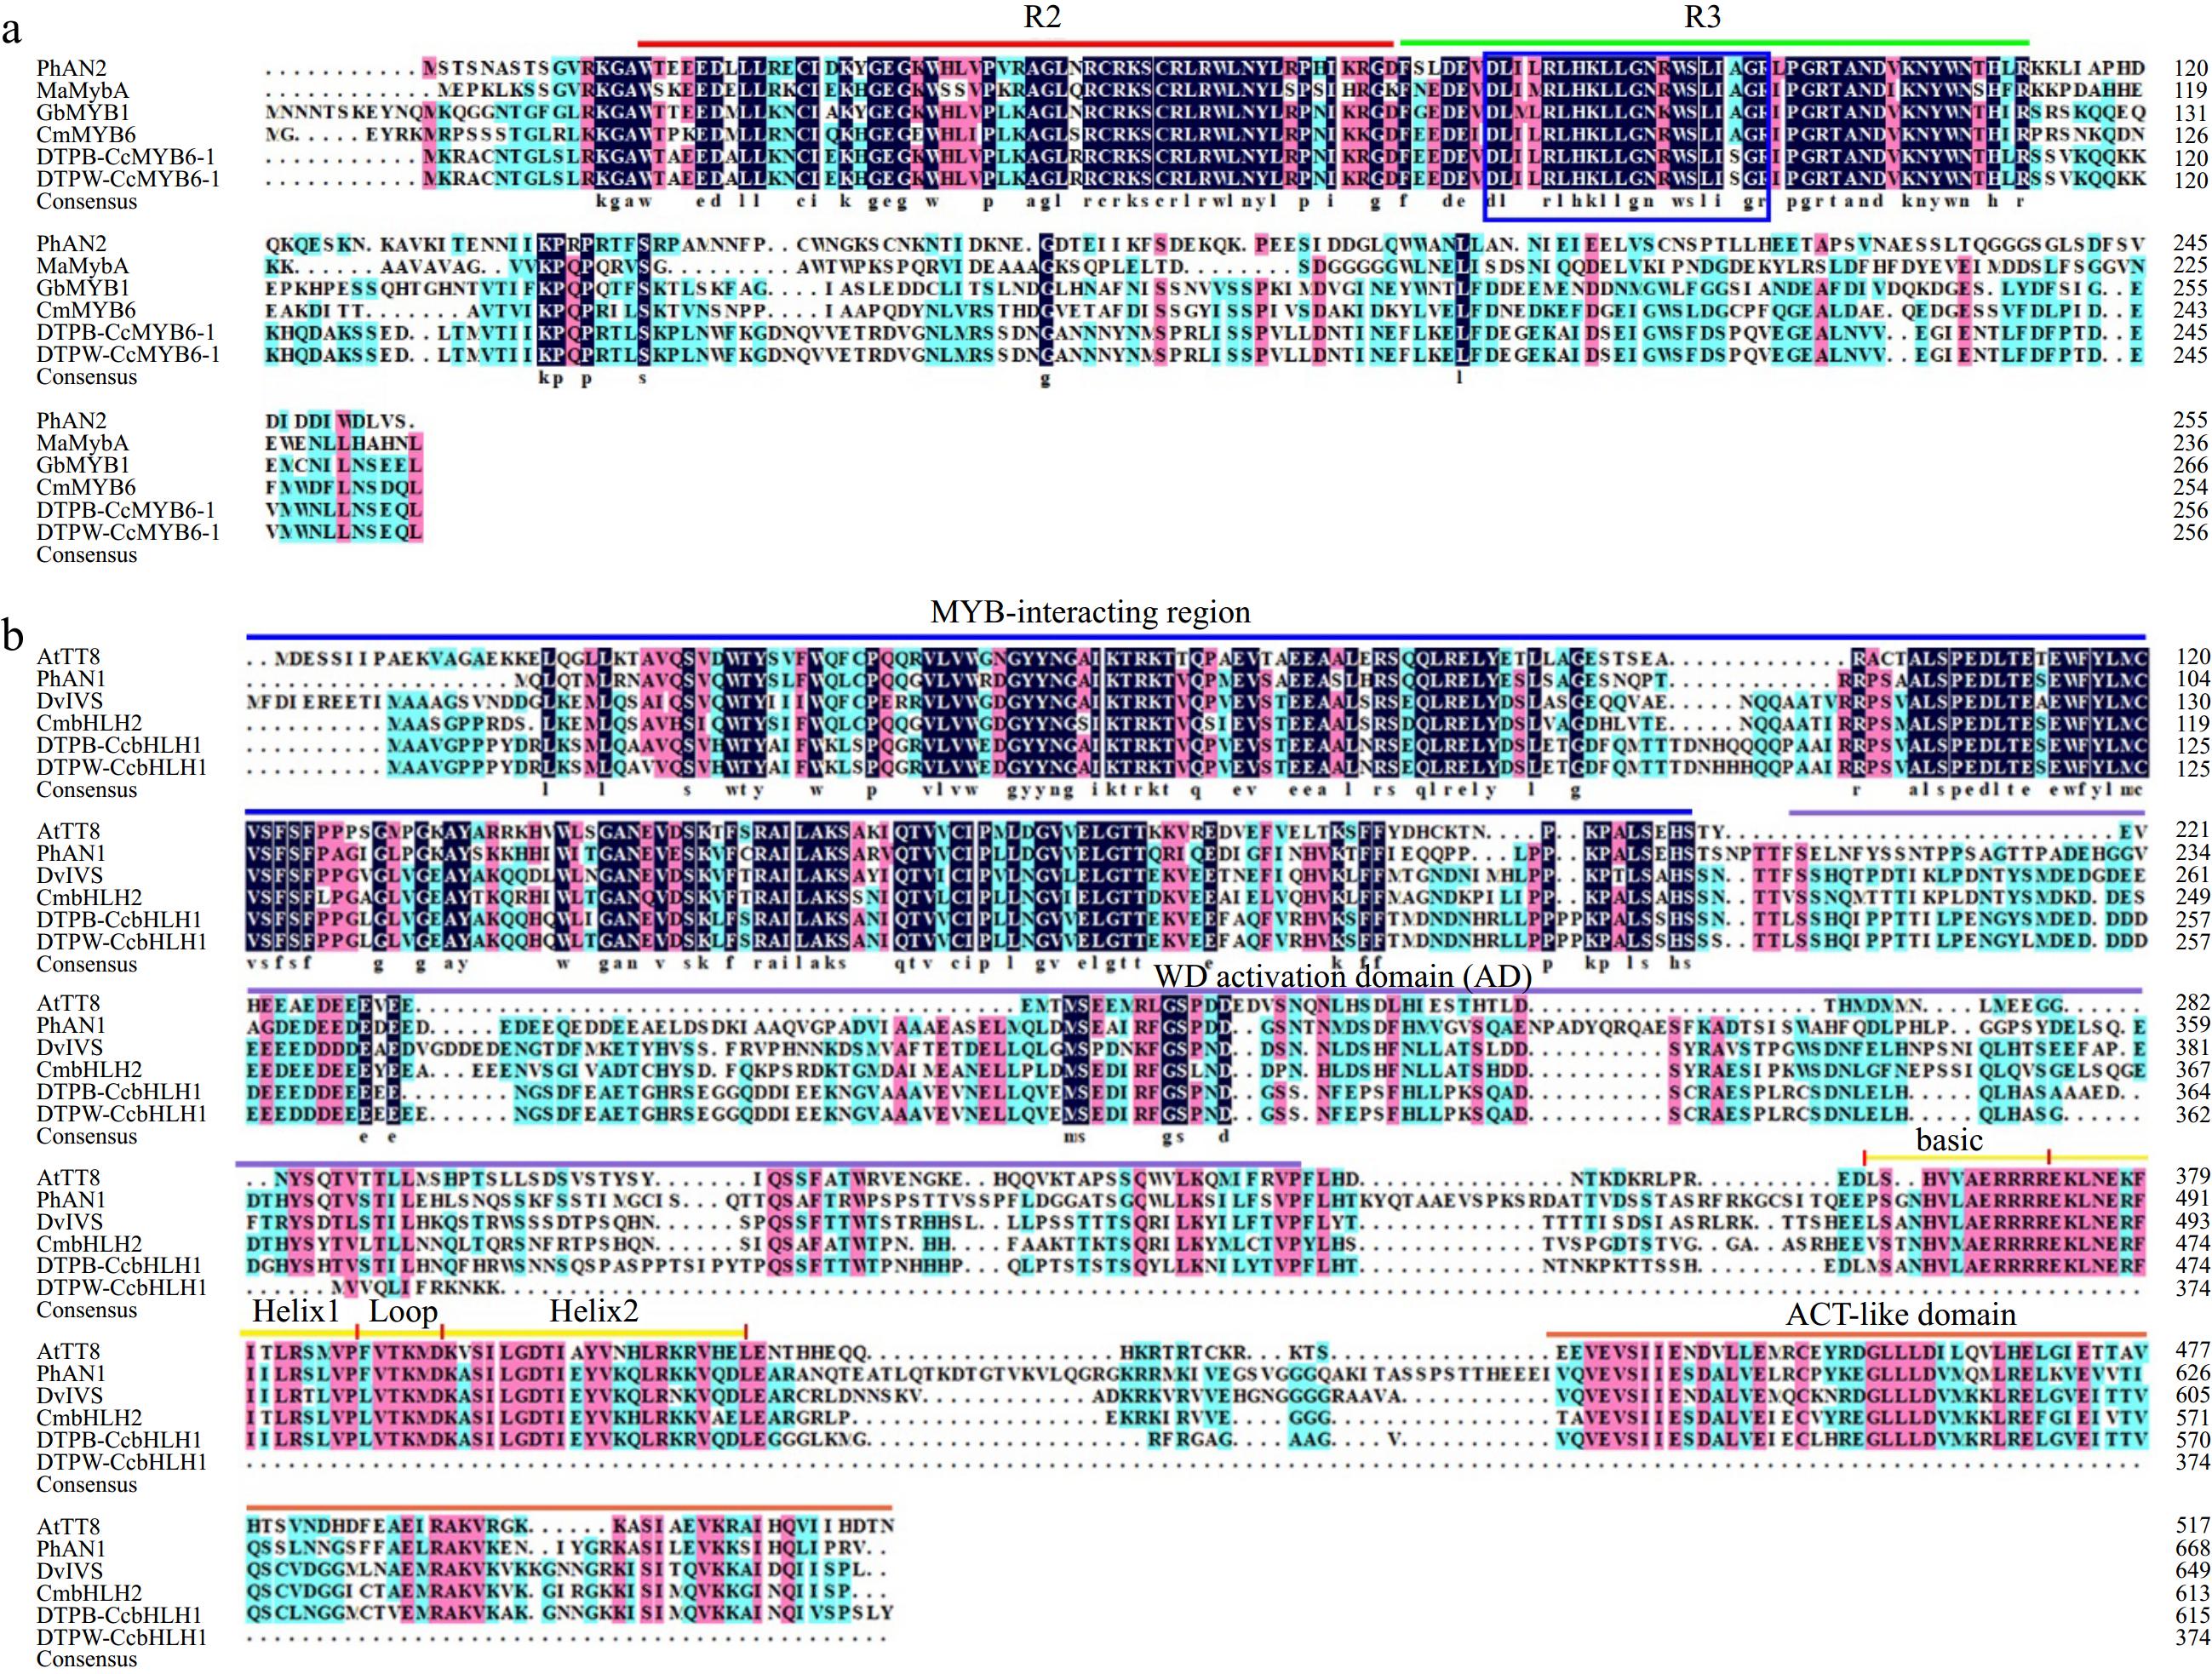
Figure 3.
Amino acid sequence alignment of MYBs and bHLHs regulating anthocyanin biosynthesis in different species. (a) Protein sequence alignment of MYBs with the conserved R2 and R3 domains marked in red and green lines, respectively. The blue rectangle indicated conserved motif of [D/E]LX2[K/R]X3LX6LX3R. PhAN2 (P. × hybrida, AAF66727), MaMybA (Muscari armeniacum, AVD68967), GbMYB1 (Gynura bicolor, BAJ17661), CmMYB6 (Chrysanthemum × morifolium, AKP06190). (b) Protein sequence alignment of bHLHs. The MYB-interacting region, WD activation, bHLH, and ACT-like domains were marked with lines in different colors. AtTT8 (A. thaliana, CAC14865), PhAN1 (P. × hybrida, AAG25927), DvIVS (D. variabilis, BAJ33515), and CmbHLH2 (C. × morifolium, ALR72603).
-
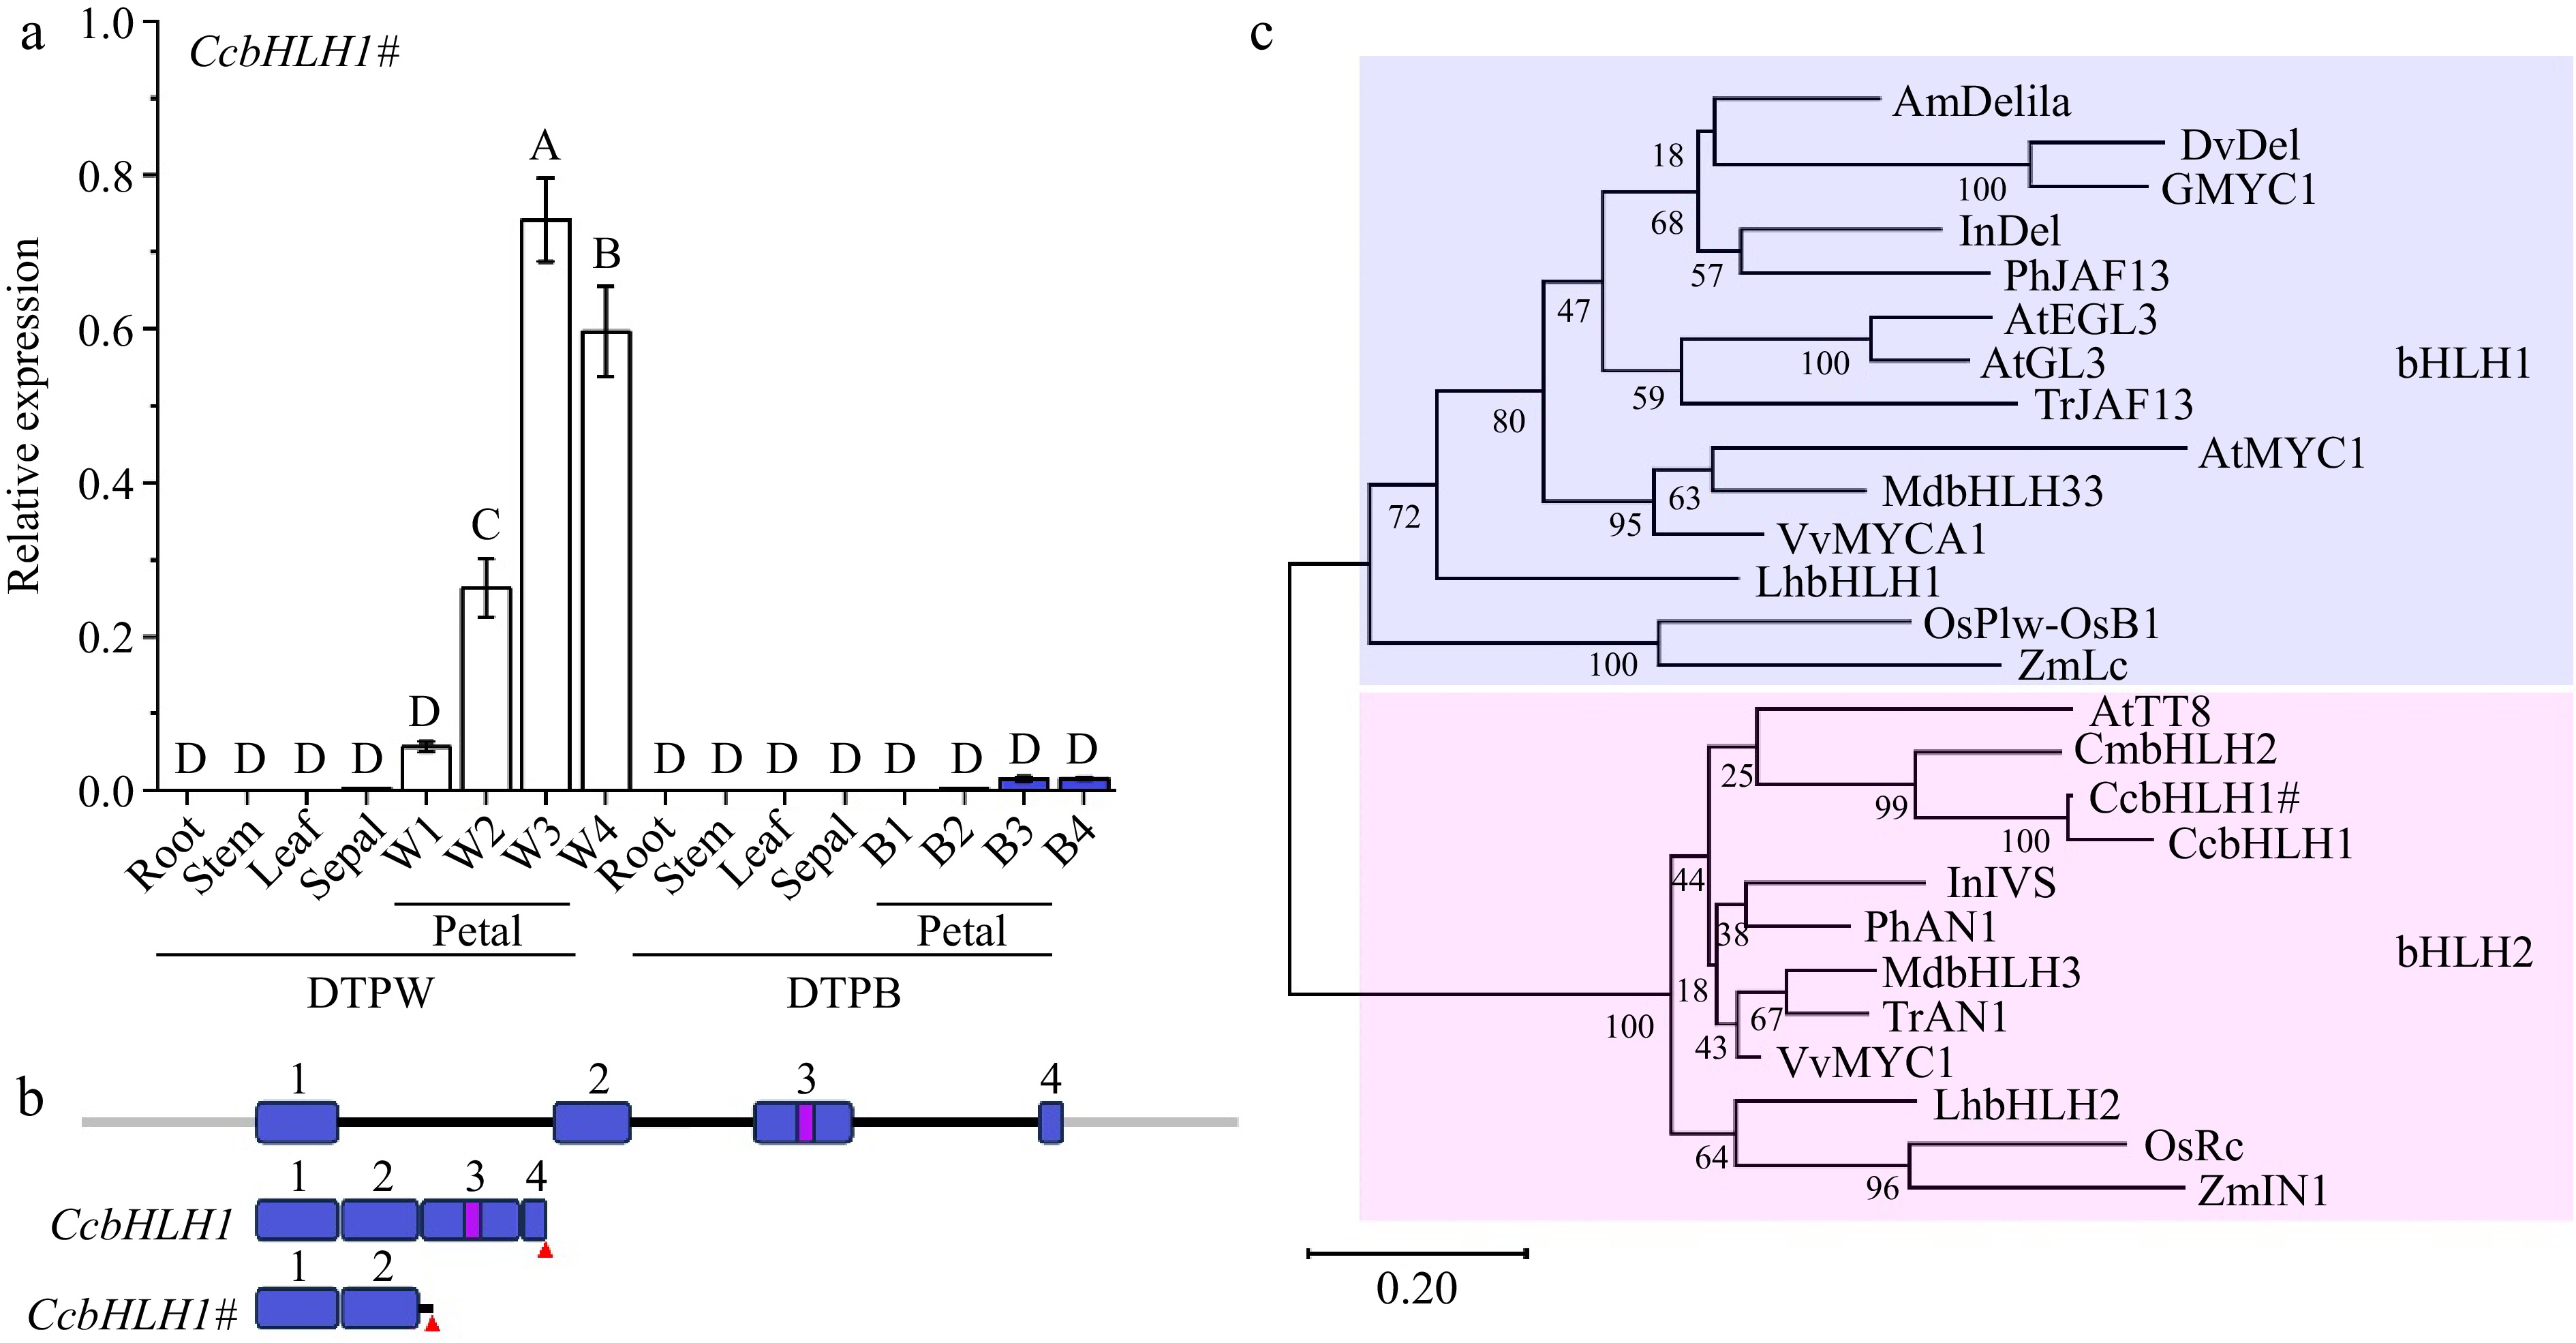
Figure 4.
Molecular and phylogenetic analysis of CcbHLH1 and CcbHLH1#. (a) The spatio and temporal expression patterns of CcbHLH1# in DTPW and DTPB. Error bars were the S.E. of three technical replicates. Different capital letters indicate significant difference at 1% level by Duncan's multiple test. (b) Structure of CcbHLH1 and CcbHLH1# genes. Exons are numbered in blue rectangles, introns are indicated by black lines, the bHLH domain is indicated in a violet rectangle, and the red triangle represents stop codon. (c) Phylogenetic tree of subgroup IIIf bHLHs. AmDelila (A. majus, AAA32663.1), DvDel (D. pinnata, BAJ33516.1), GMYC1 (Gerbera hybrid, CAA07615.1), InDel (I. nil, XP_019171149.1), PhJAF13 (P. × hybrida, AAC39455.1), AtEGL3 (A. thaliana, OAP12509.1), AtGL3 (A. thaliana, NP_680372.1), TrJAF13 (Trifolium repens, AIT76563.1), AtMYC1 (A. thaliana, NP_001154194), MdbHLH3 (Malus domestica, ADL36597.1), MdbHLH33 (M. domestica, ABB84474.1), VvMYCA1 (Vitis vinifera, NP_001267954.1), LhbHLH1 (Lilium hybrida, BAE20057.1), LhbHLH2 (L. hybrida, BAE20058.1), OsPlw-OsB1 (Oryza sativa, BAB64301.1), ZmLc (Zea mays, AAA33504.1), AtTT8 (A. thaliana, Q9FT81), CmbHLH2 (C. × morifolium, ALR72603.1), InIVS (I. nil, XP_019197480.1), PhAN1 (P. × hybrida, AAG25928.1), TrAN1 (T. repens, AIT76559.1), VvMYC1 (V. vinifera, NP_001268182.1), OsRc (O. sativa, ADK36625.1), ZmIN1 (Z. mays, AAB03841.1).
-
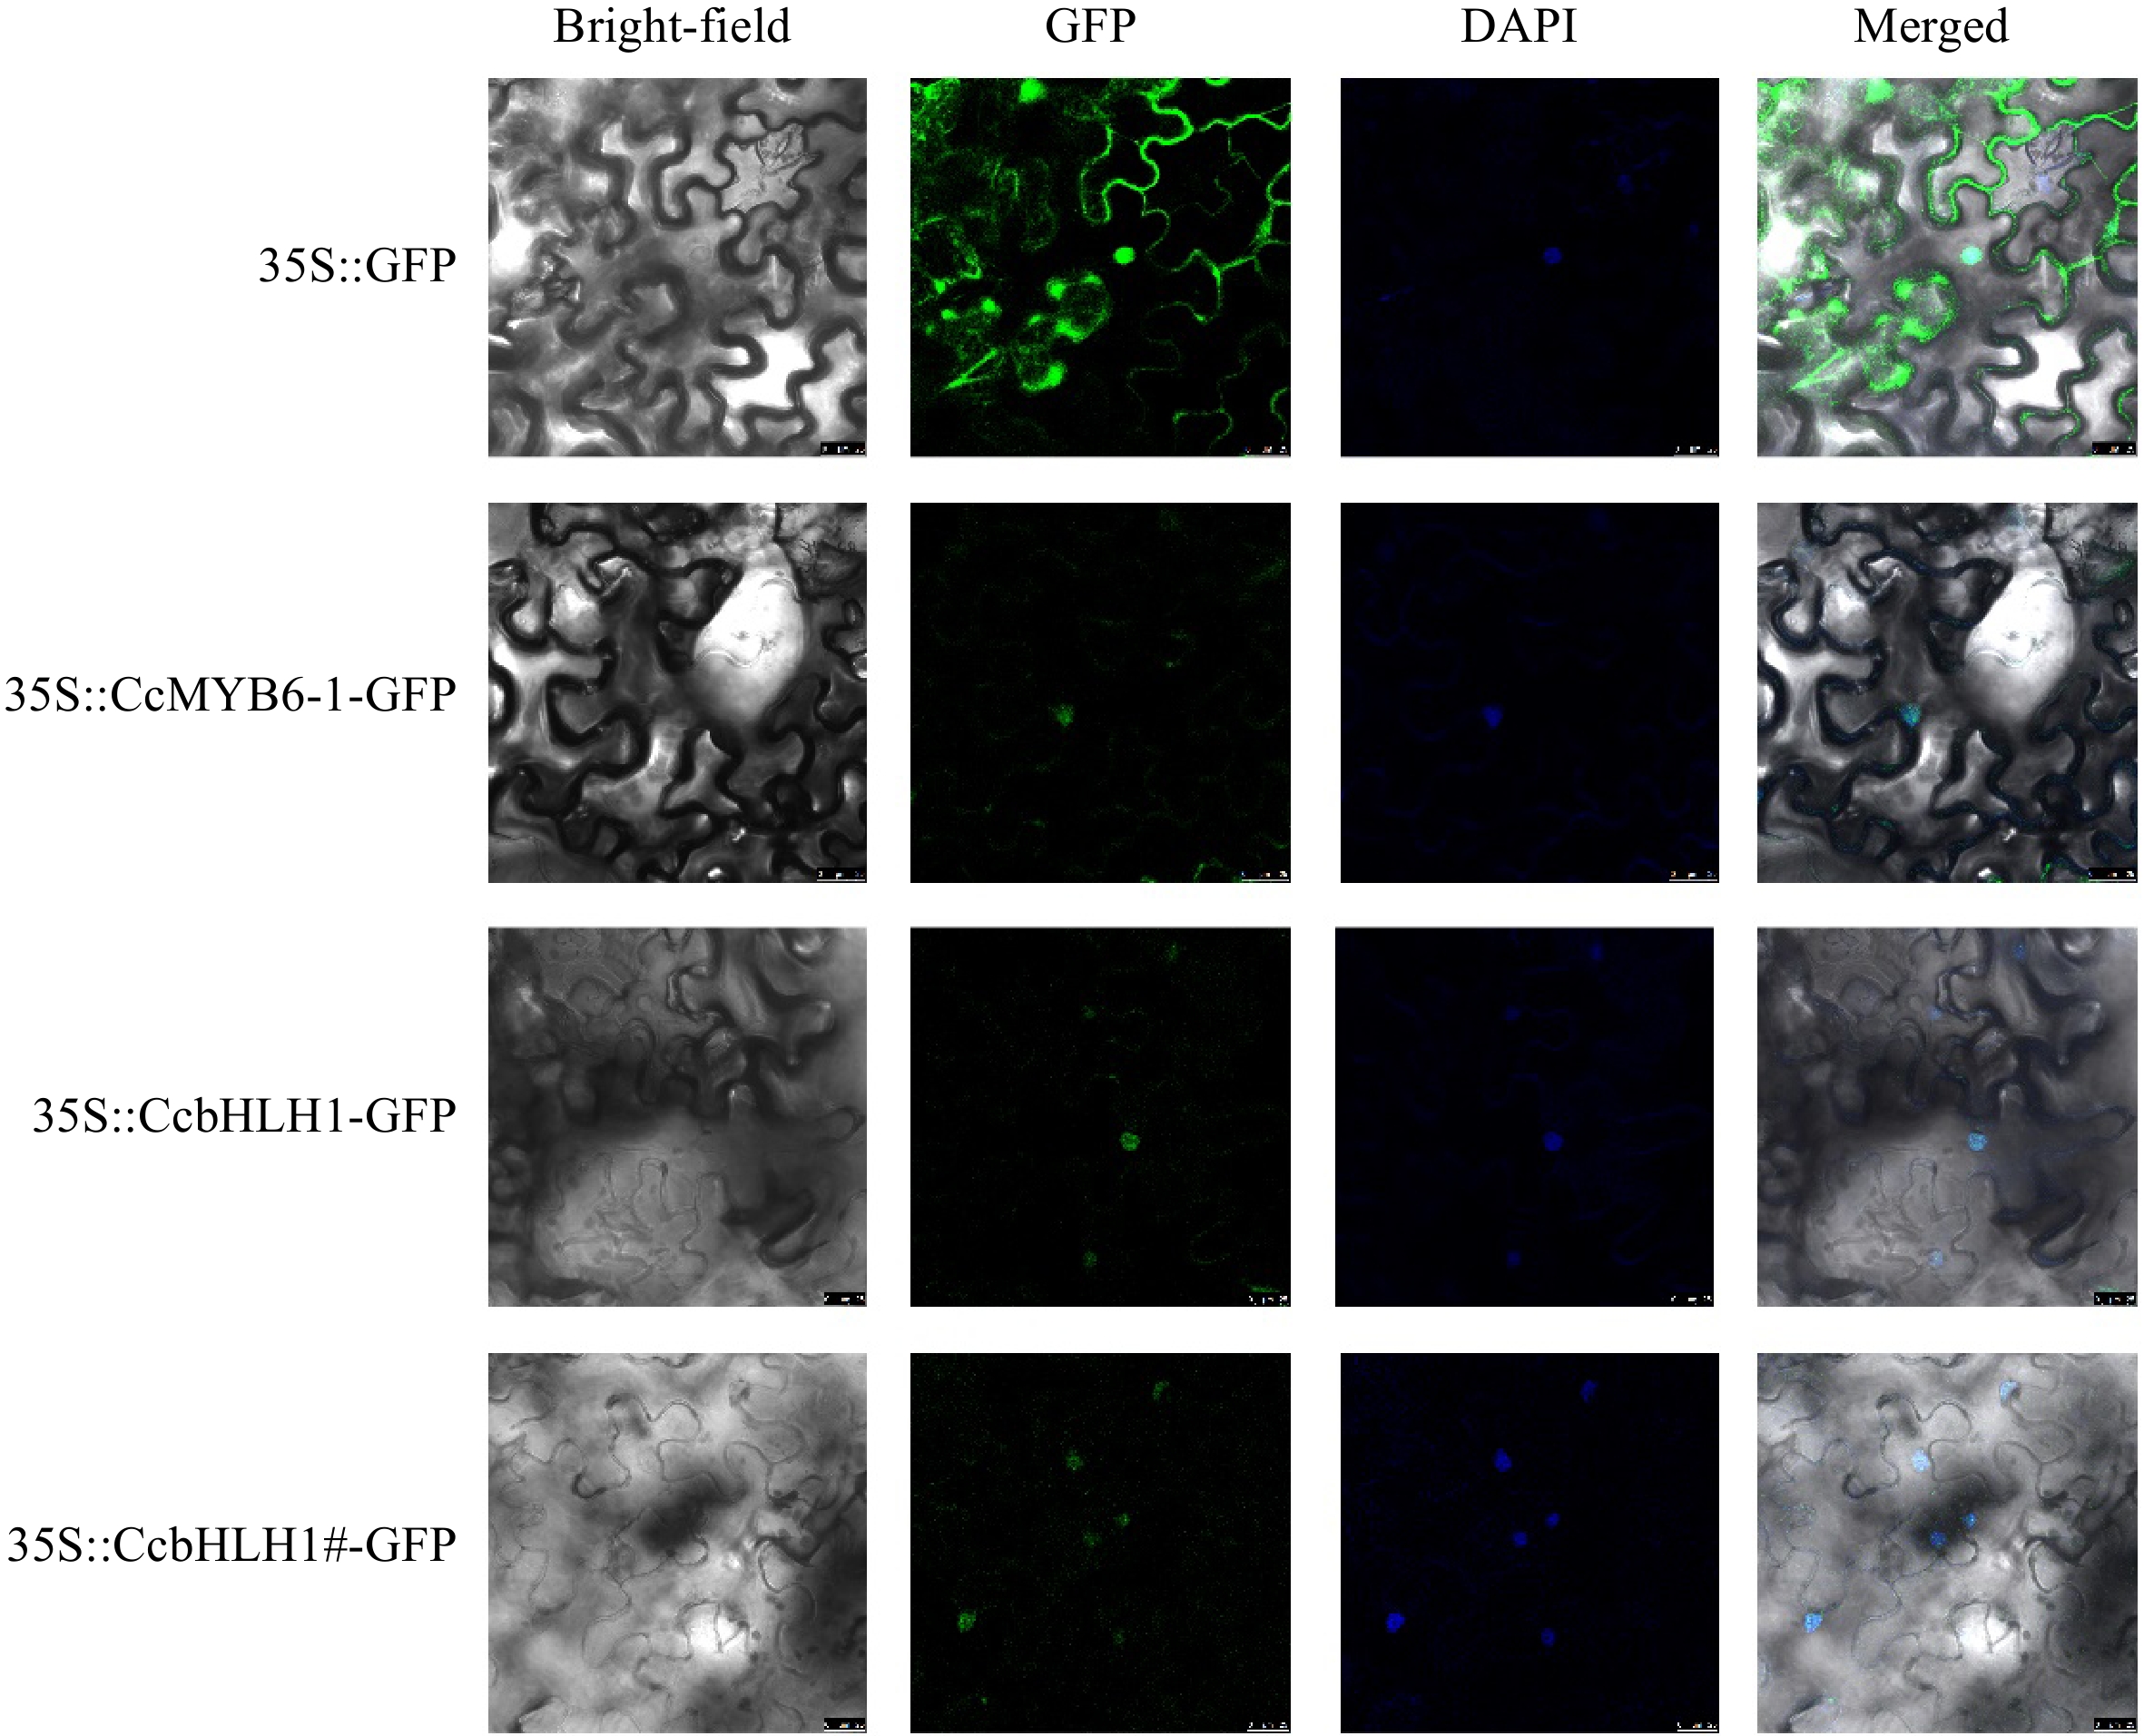
Figure 5.
The subcellular localization analysis of CcMYB6-1, CcbHLH1, and CcbHLH1#. DAPI was used as a nuclear-localized marker. Photos were captured two days after infiltration.
-
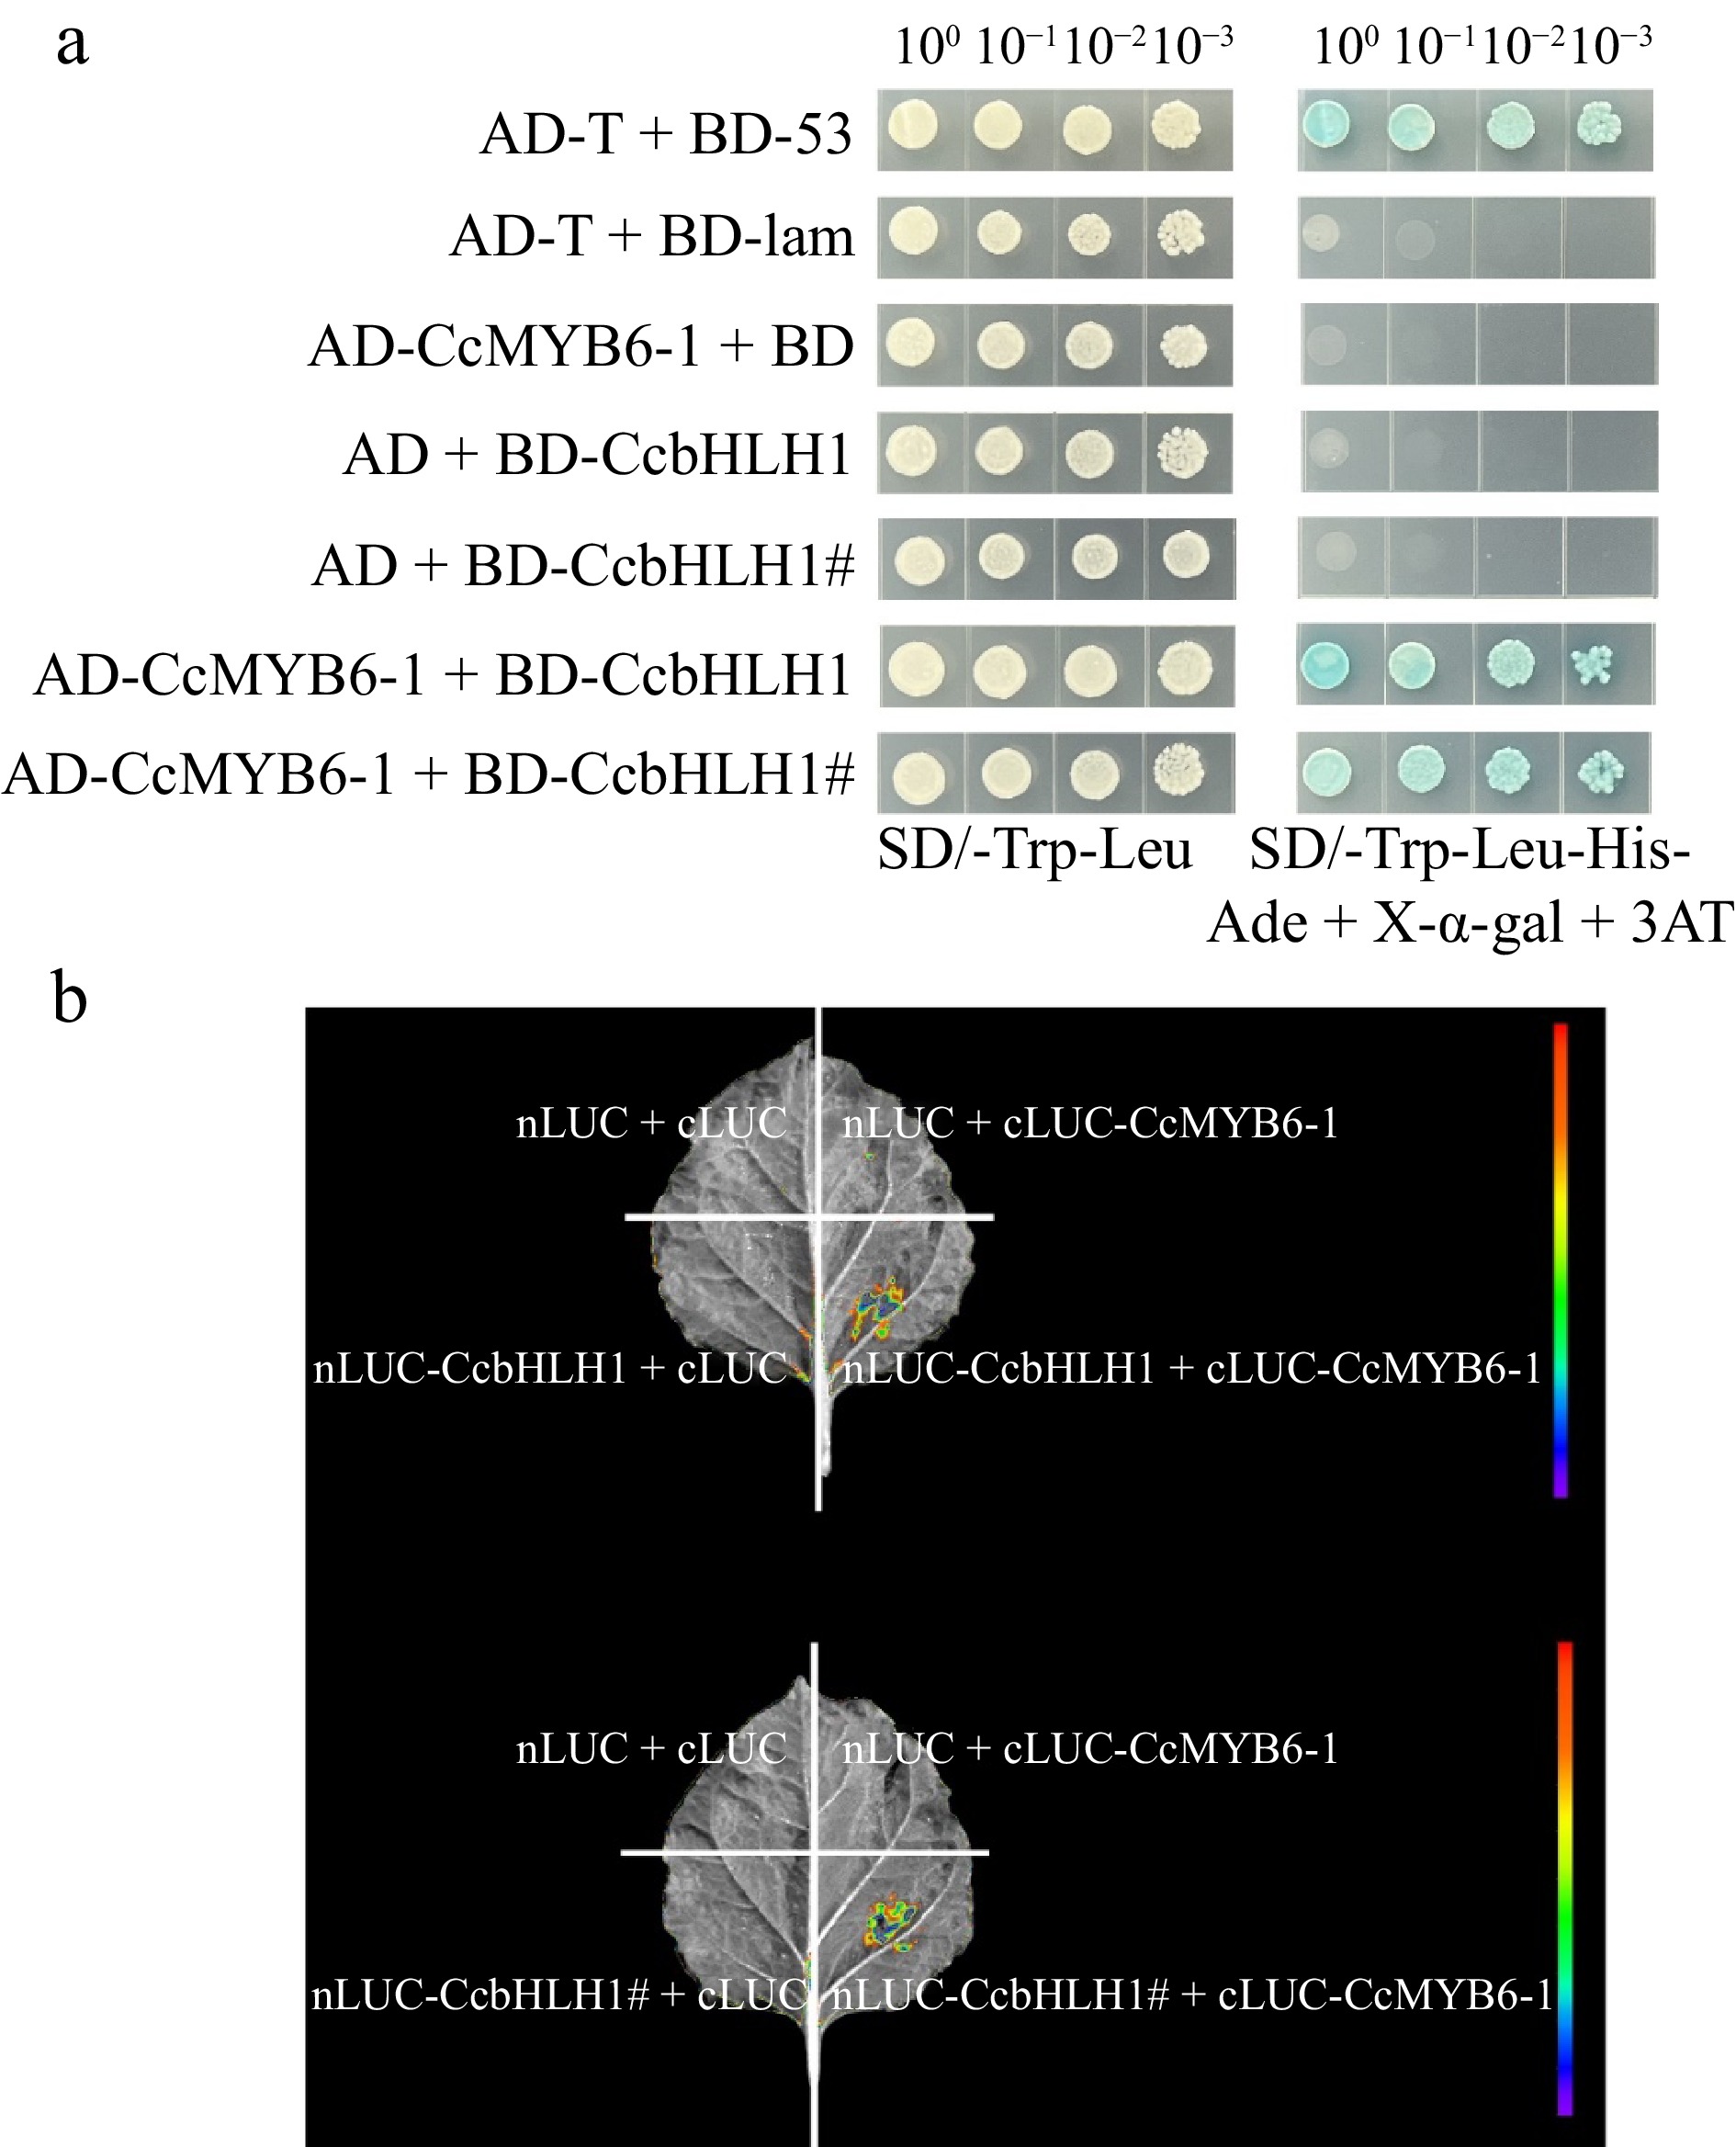
Figure 6.
Protein-protein interaction before and after CcbHLH1 mutation with CcMYB6-1. (a) Y2H strain transformed with targeted plasmids were plated on the SD/-Trp-Leu (left) and SD/-Trp-Leu-His-Ade + X-α-gal + 3AT (right) solid medium. (b) The firefly fluorescence of tobacco leaves injected with different combinations of targeted genes.
-
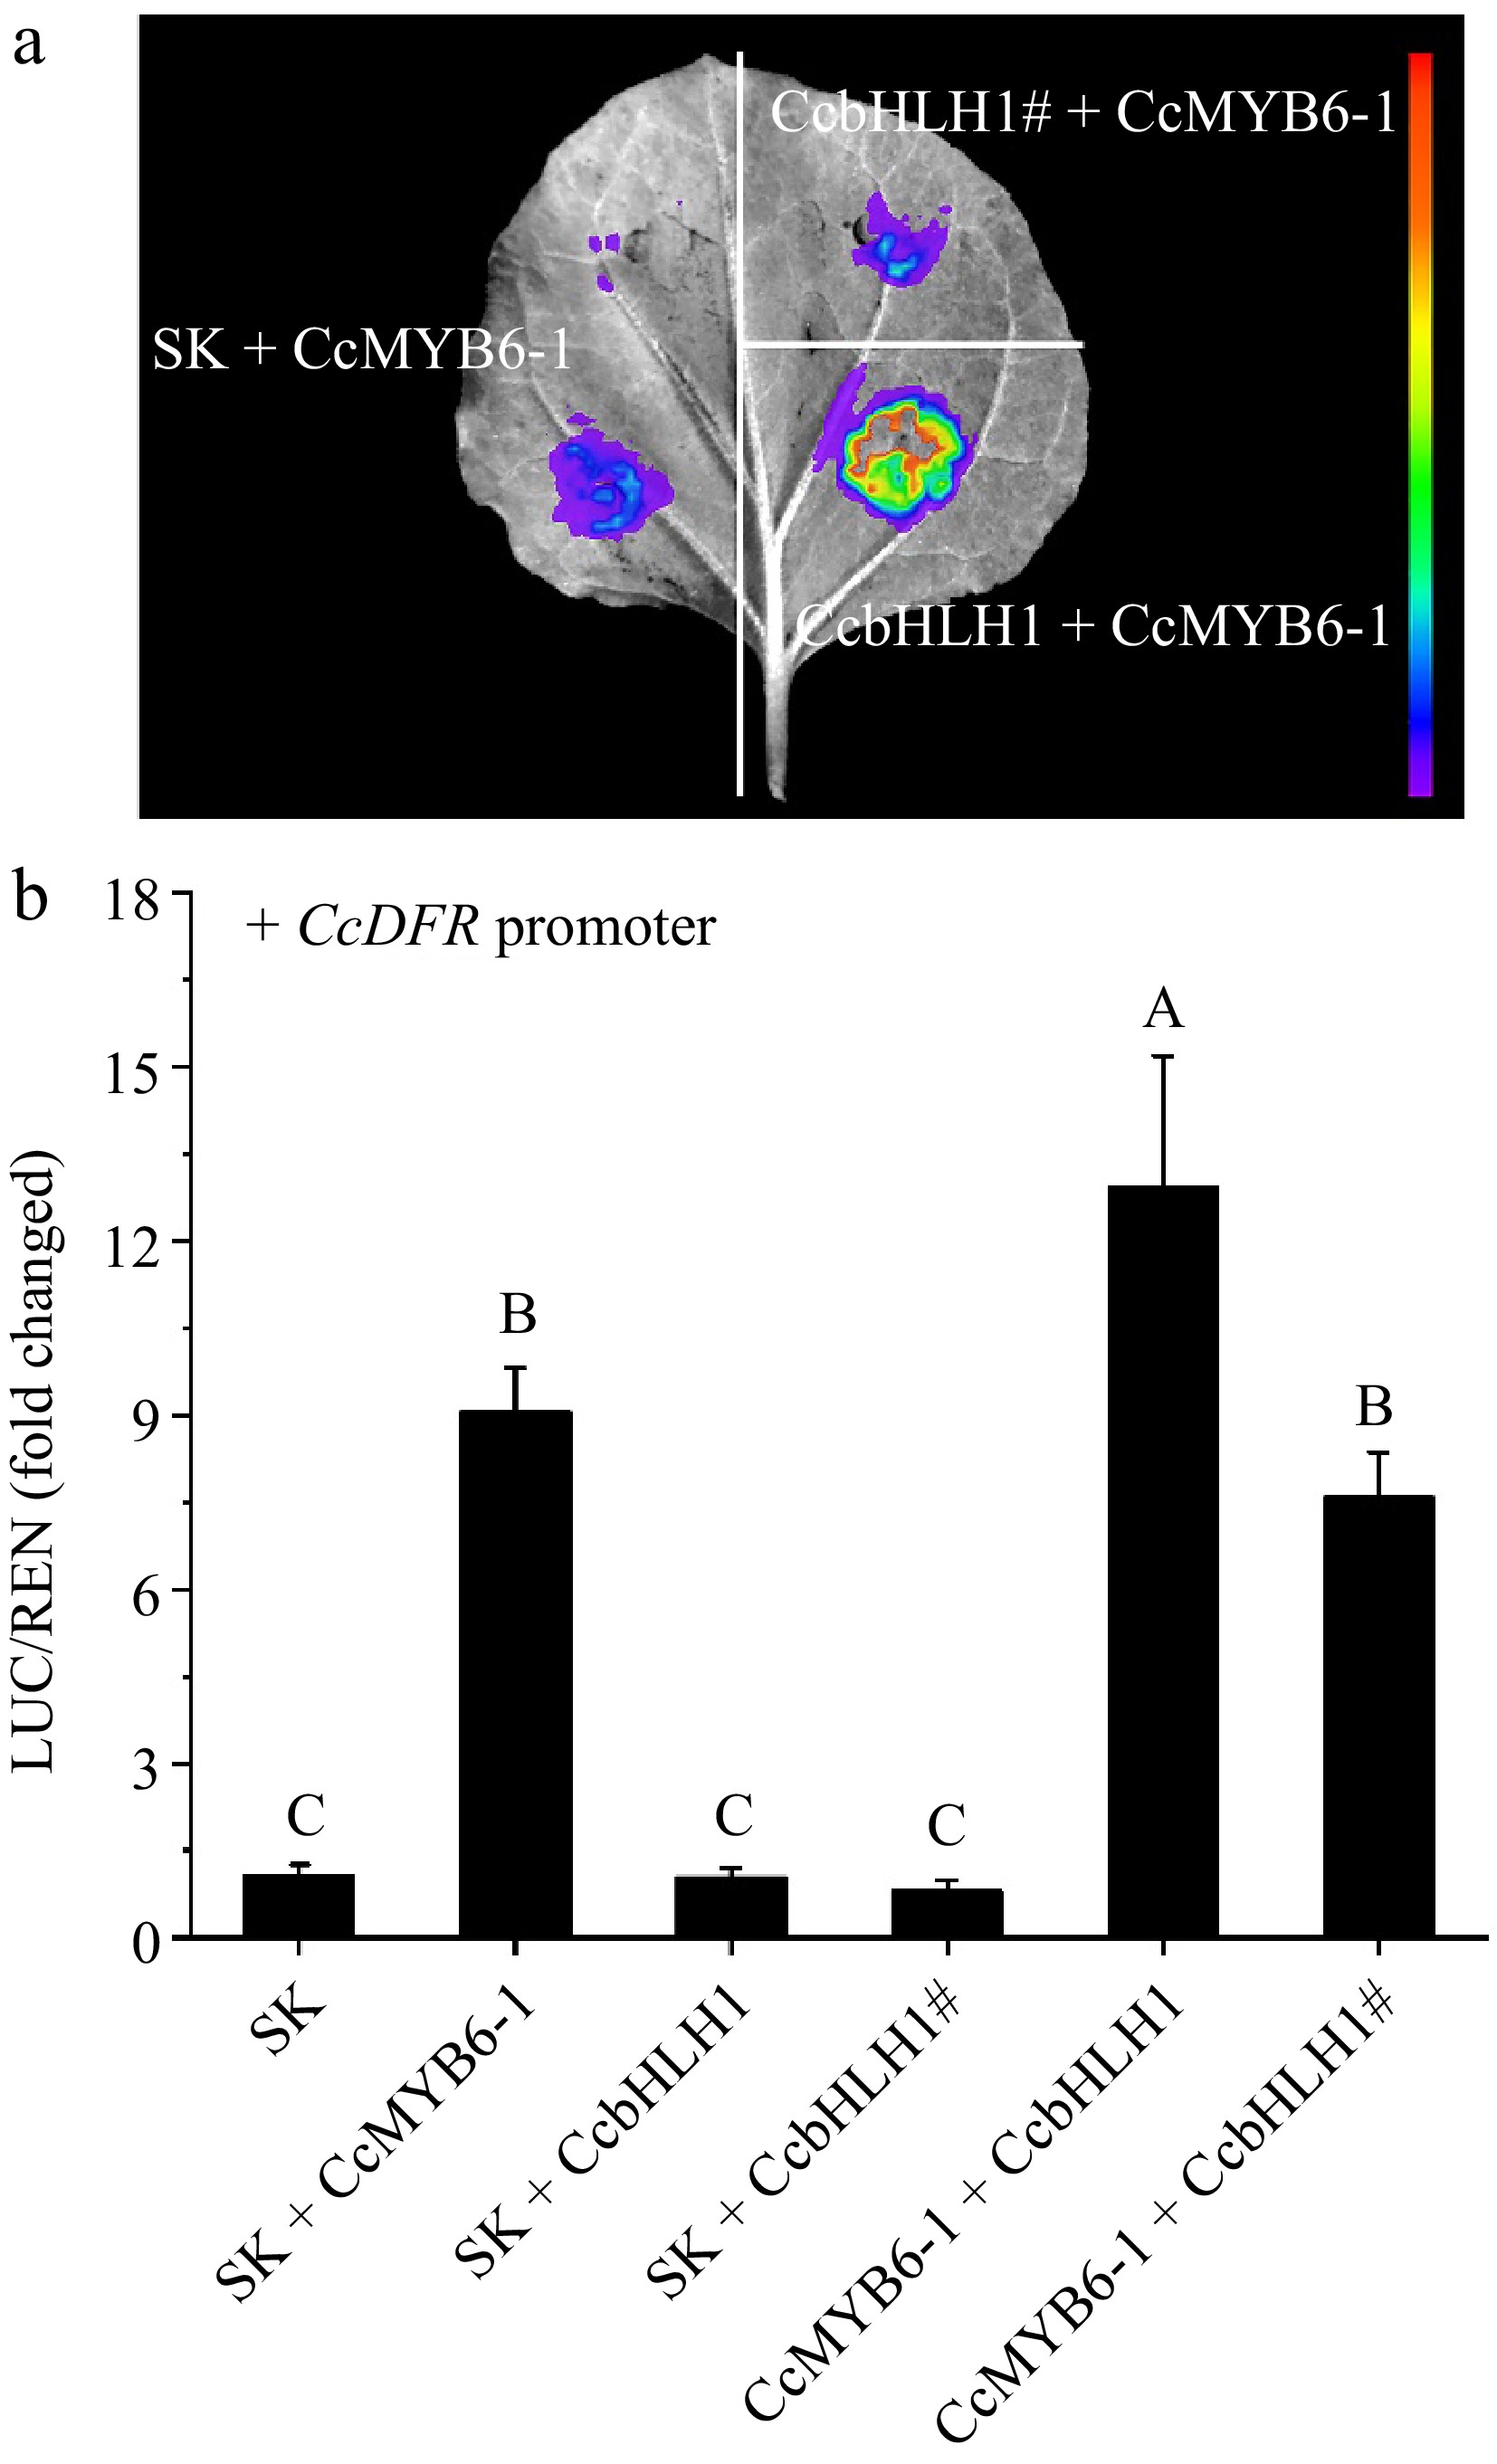
Figure 7.
Changes of trans-activation of CcDFR promoter before and after CcbHLH1 mutation. (a) The firefly fluorescence captured by a molecular imaging system after three days infiltration. (b) In vivo interactions between CcMYB6-1, CcbHLH1, and its mutant CcbHLH1# on the CcDFR promoter. Error bars were the S.E. of three biological replicates with each from at least two individual leaves. Different capital letters indicate significant difference at 1% level by Duncan's multiple test.
-
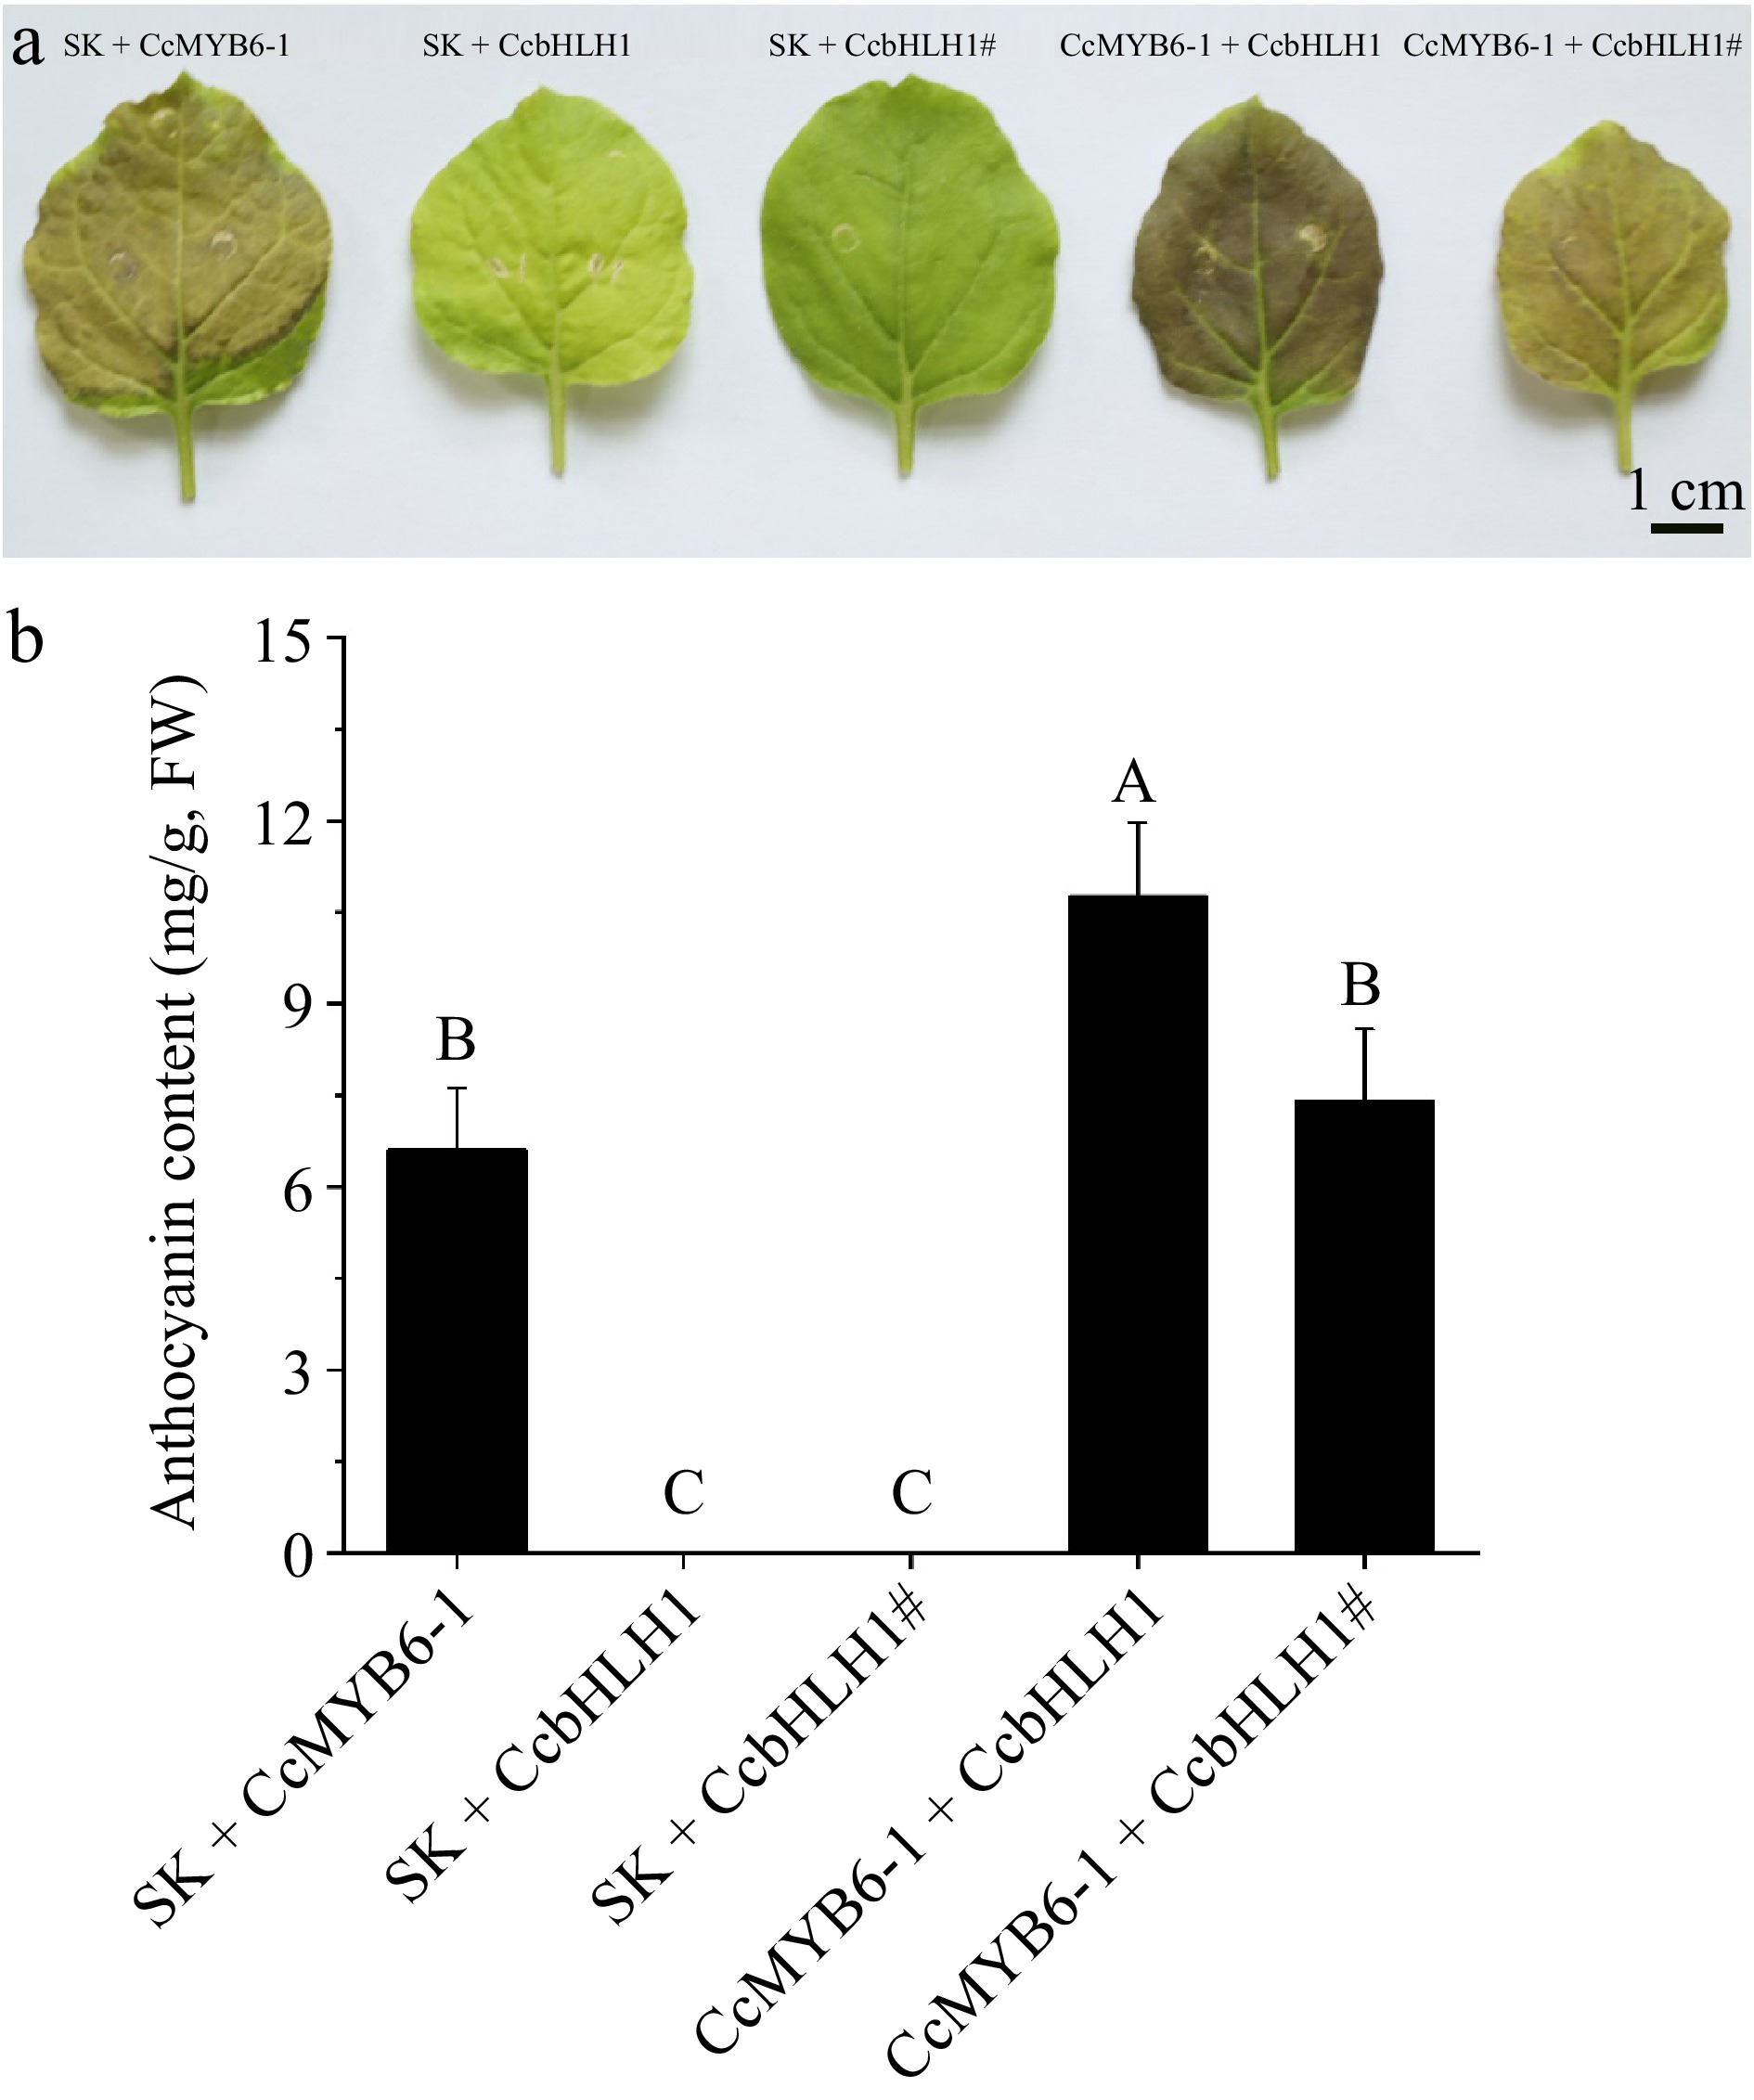
Figure 8.
Transient over-expression in tobacco leaves. (a) Tobacco leaves infiltrated with five different combinations including SK + CcMYB6-1, SK + CcbHLH1, SK + CcbHLH1#, CcMYB6-1 + CcbHLH1, and CcMYB6-1 + CcbHLH1#. The photo was captured 9 d after infiltration. (b) The semi-quantification of anthocyanin accumulating in tobacco leaves. Error bars were the S.E. of four biological replicates with each from at least two individual leaves. Different capital letters indicate significant difference at 1% level by Duncan's multiple test.
Figures
(8)
Tables
(0)