-
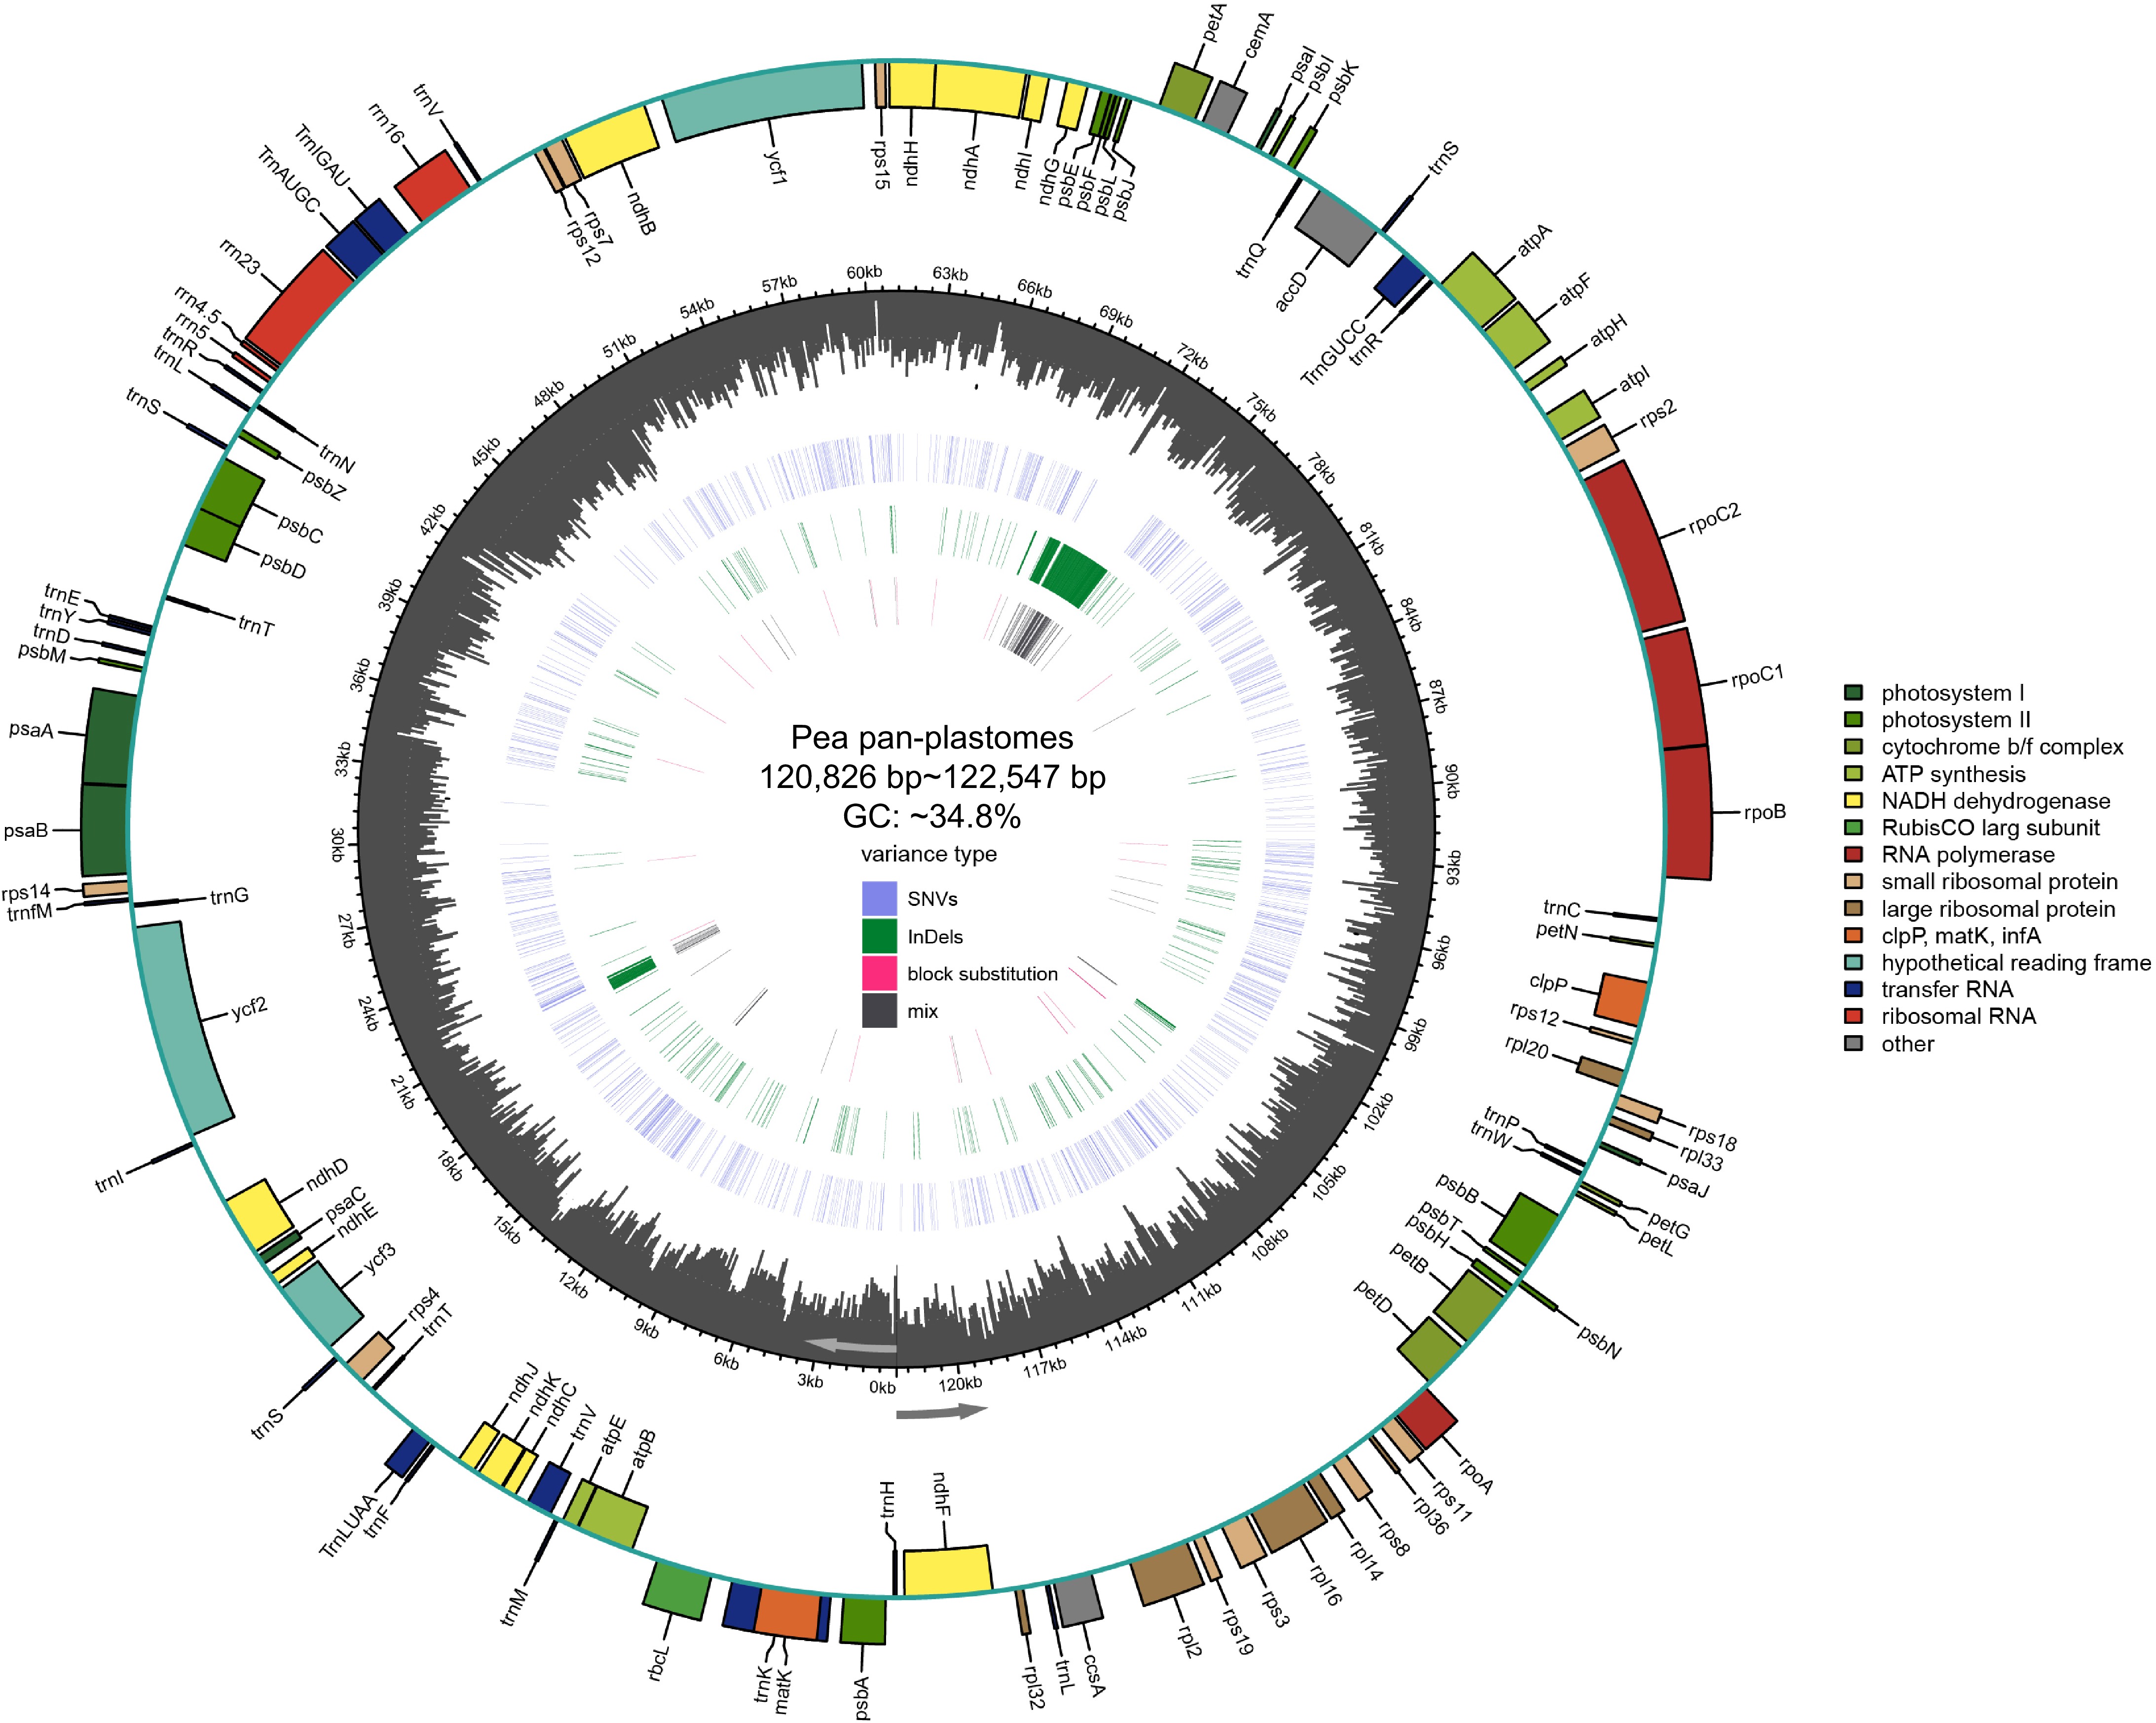
Figure 1.
Pea pan-plastome annotation map. Indicated by arrows, genes listed inside and outside the circle are transcribed clockwise and counterclockwise, respectively. Genes are color-coded by their functional classification. The GC content is displayed as black bars in the second inner circle. SNVs, InDels, block substitutions and mixed variants are represented with purple, green, red, and black lines, respectively. Single nucleotide variants (SNVs), block substitutions (BS, two or more consecutive nucleotide variants), nucleotide insertions or deletions (InDels), and mixed sites (which comprise two or more of the preceding three variants at a particular site) are the four categories into which variants are divided.
-
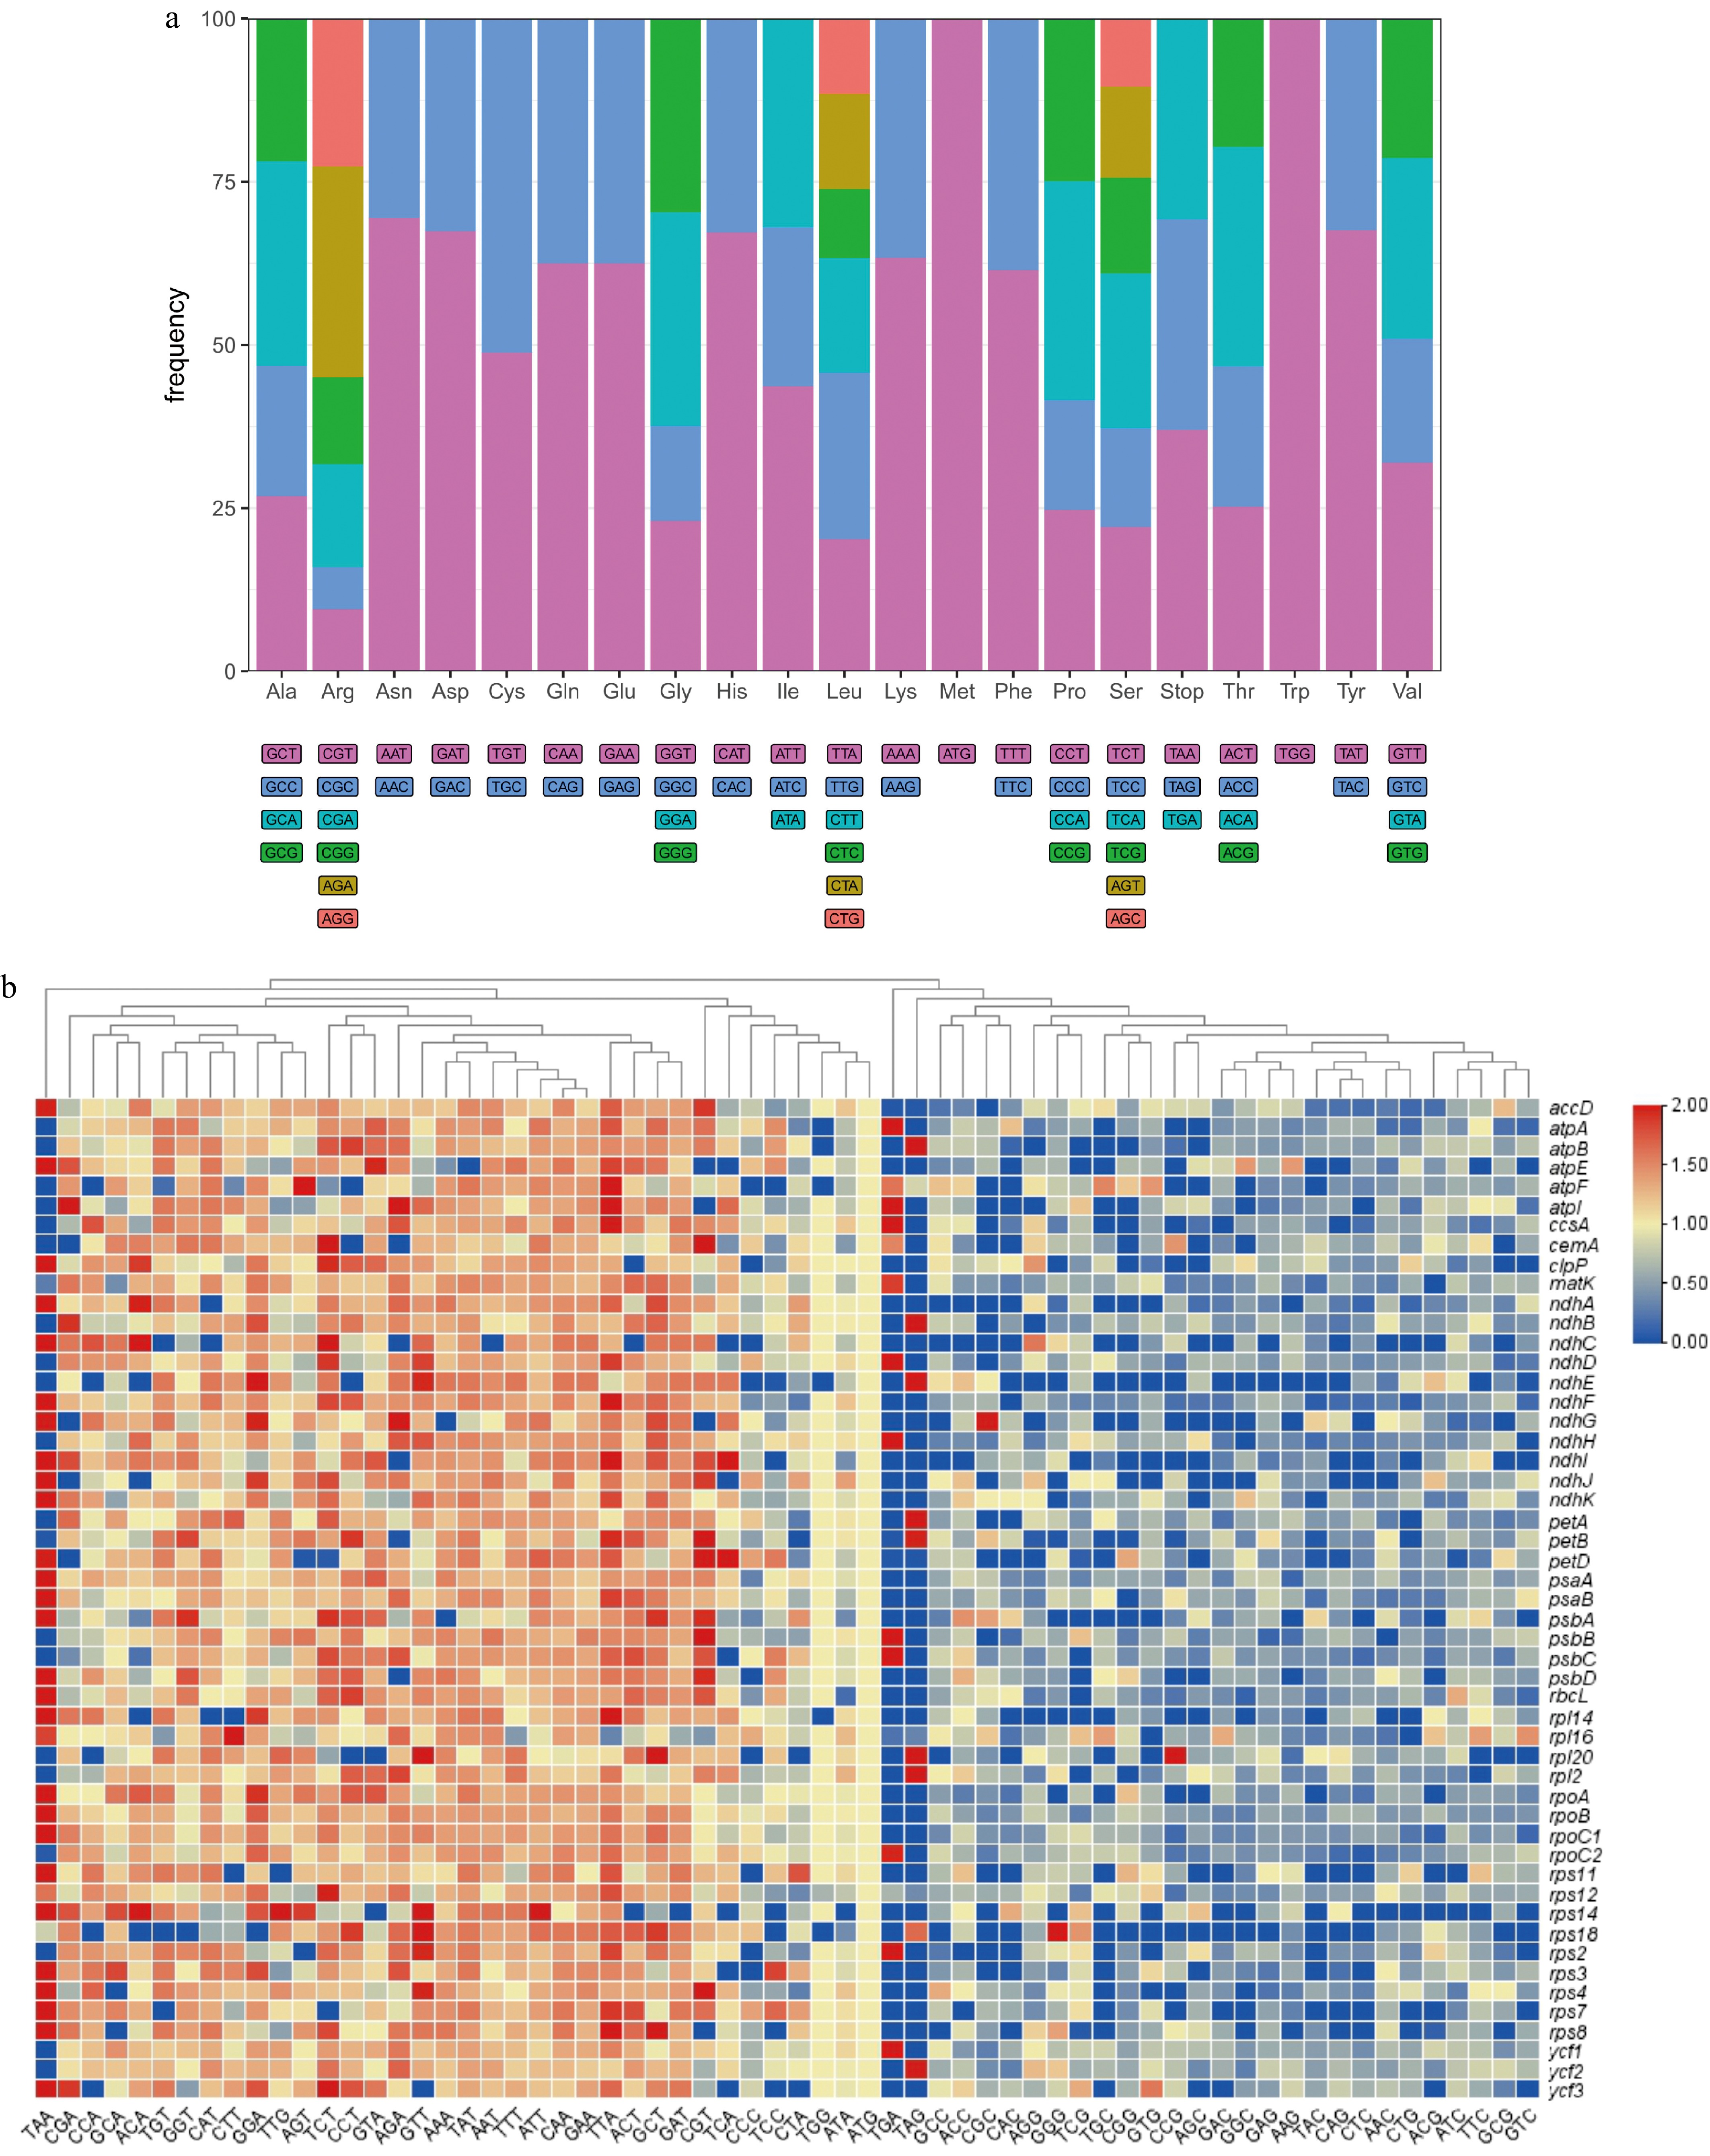
Figure 2.
(a) The overall codon usage frequency in 51 CDSs (length > 300 bp) from the pea pan-plastome. (b) The heatmap of RSCU values in 51 CDSs (length > 300 bp) from the pea pan-plastome. The x-axis represents different codons and the y-axis represents different CDSs. The tree at the top was constructed based on a Neighbor-Joining algorithm.
-
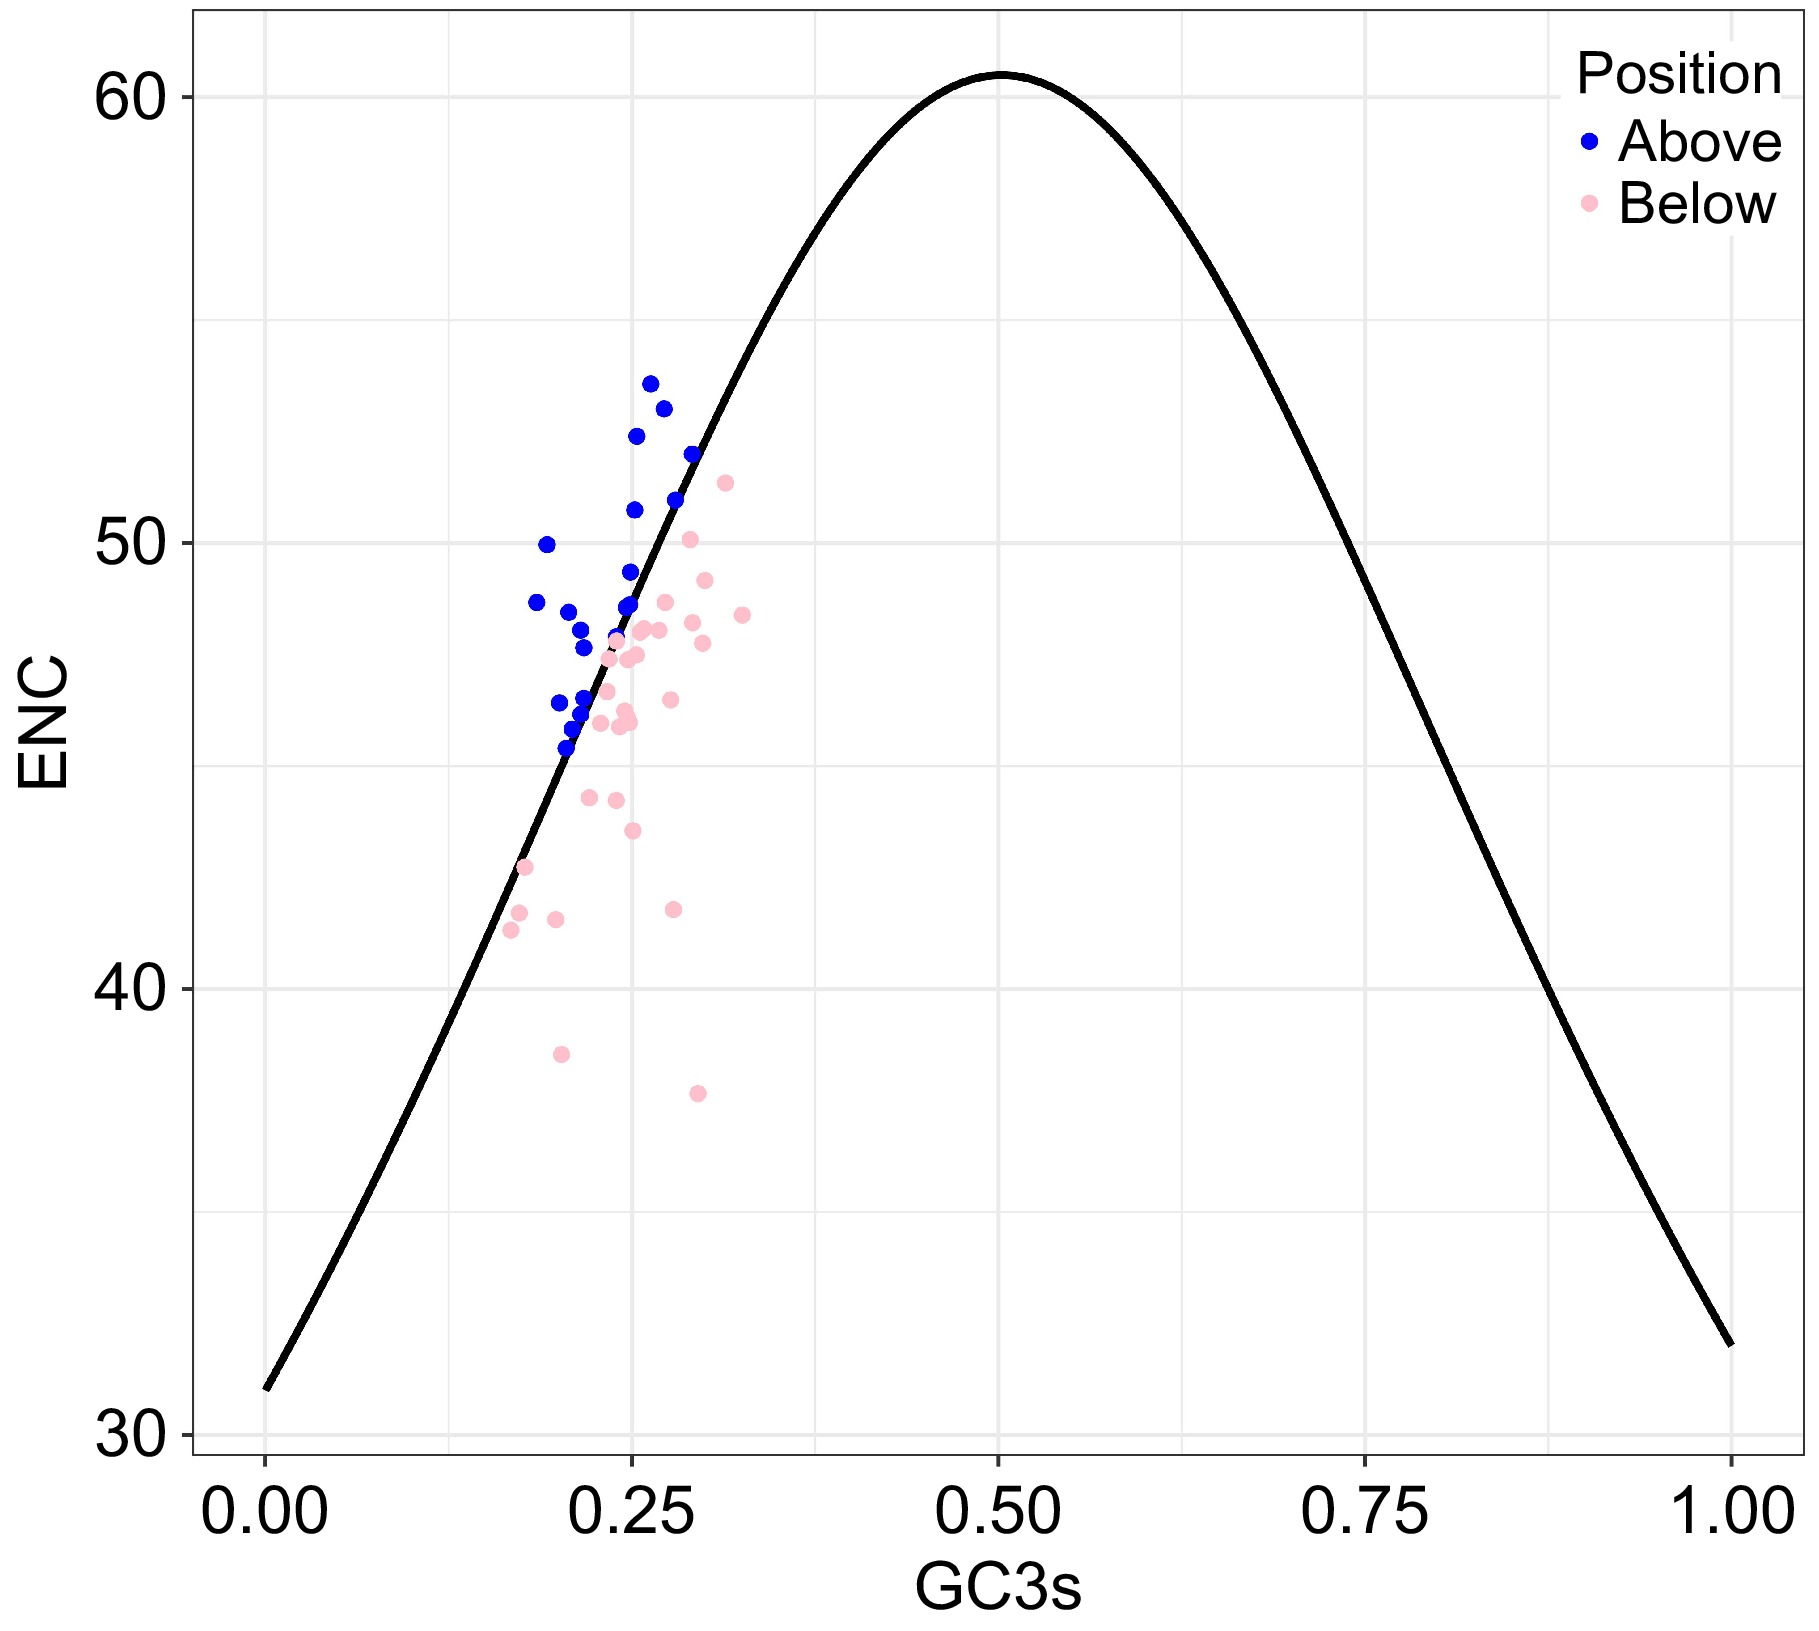
Figure 3.
The ENC-GC3s plot for pea pan-plastome, with GC3s as the x-axis and ENC as the y-axis. The expected ENC values (standard curve) are calculated according to formula: ENC = 2 + GC3s + 29 / [GC3s2 + (1 − GC3s)2].
-
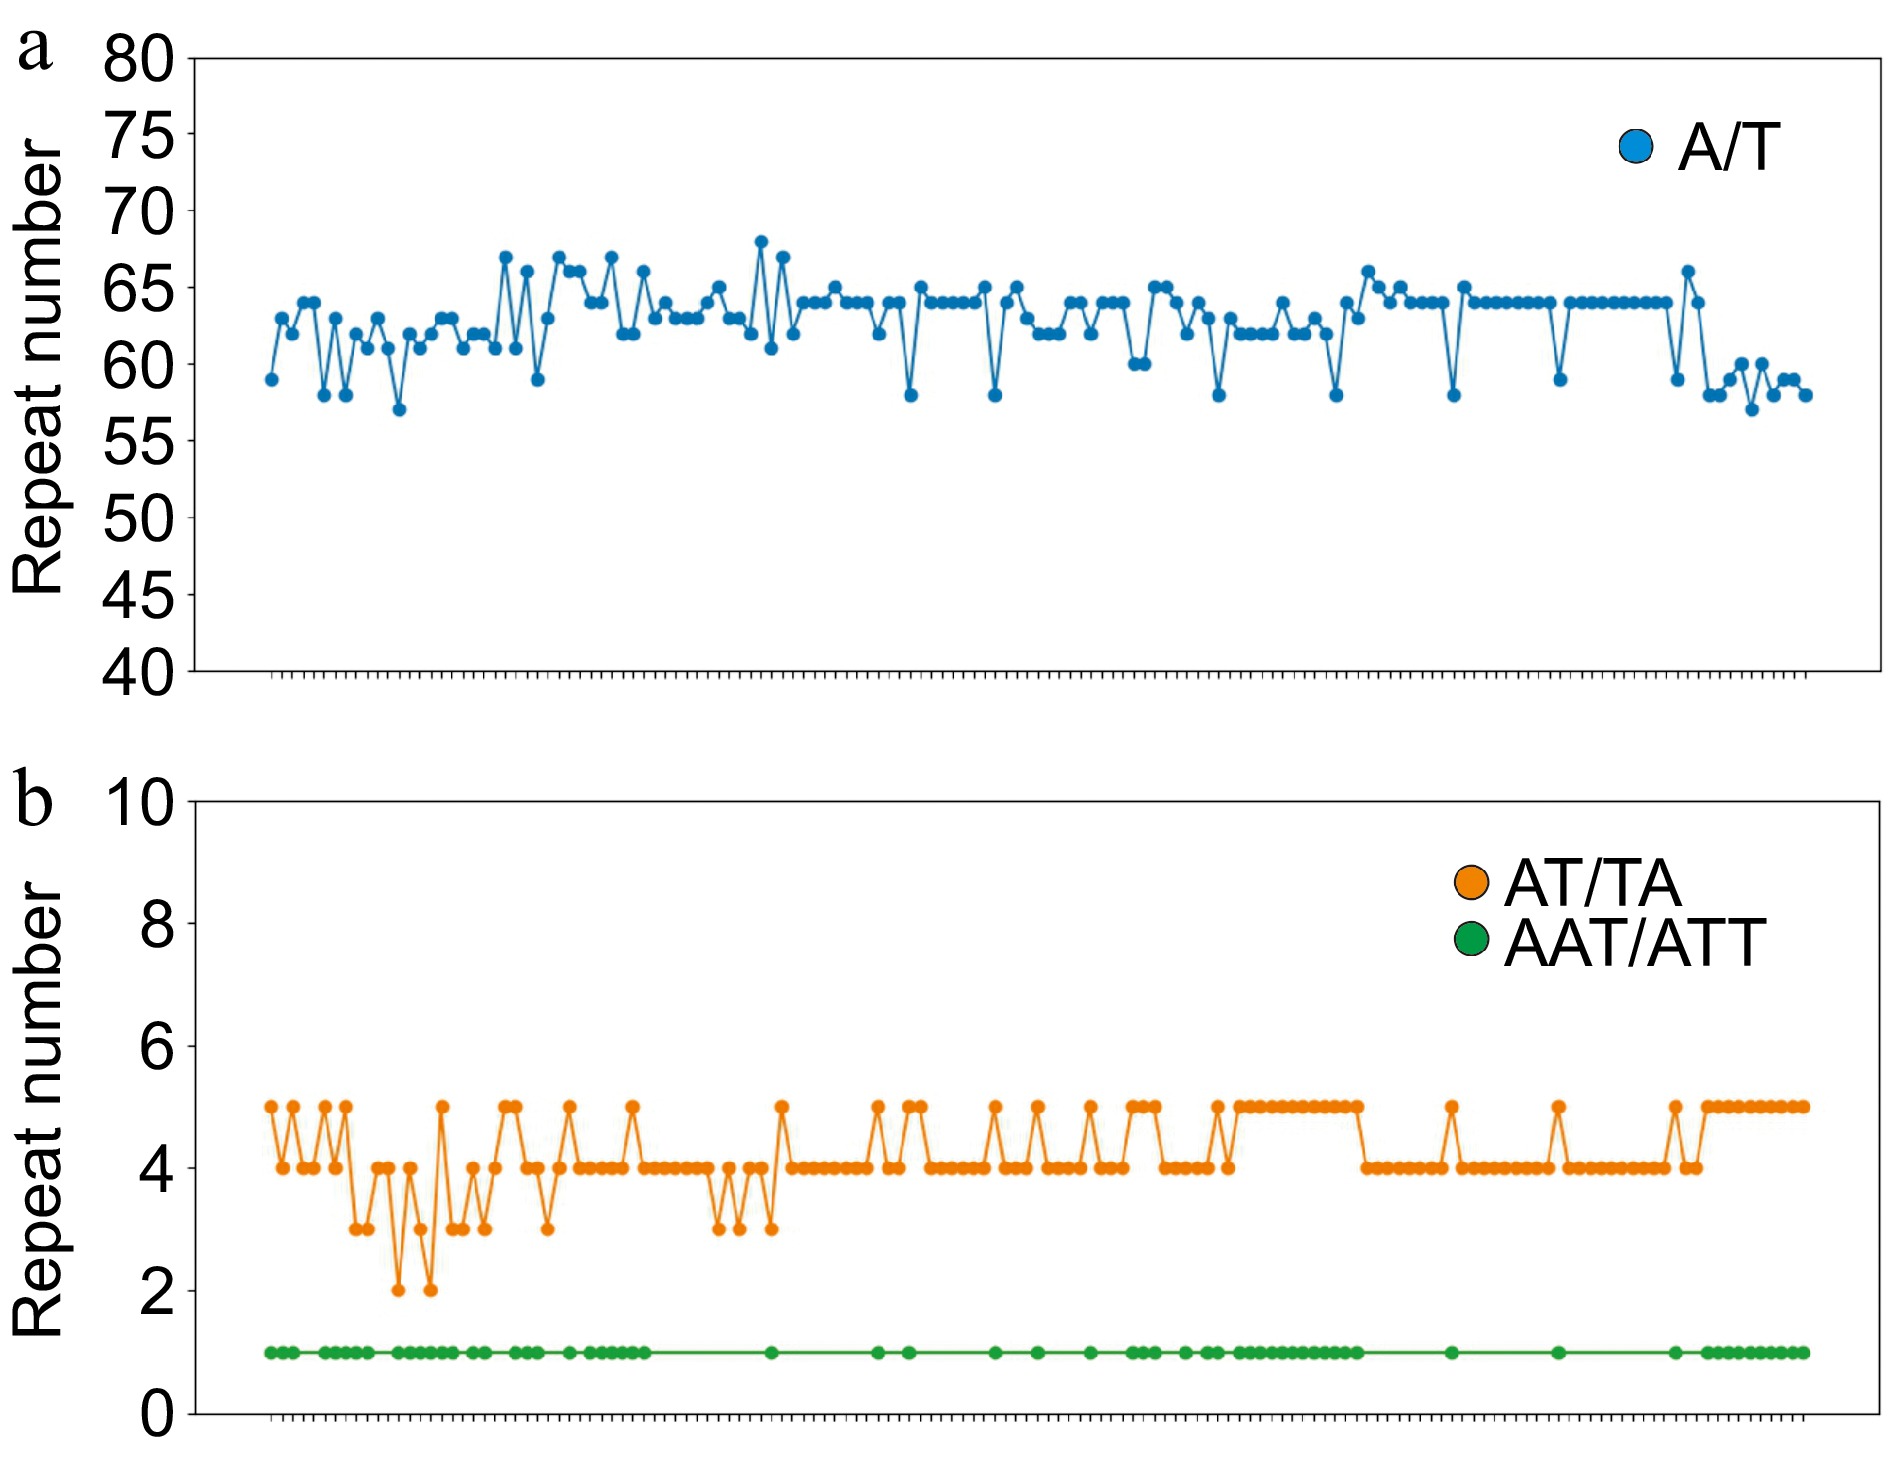
Figure 4.
Simple sequence repeats (SSRs) in the pea pan-plastome. The x-axis represents different samples of pea and the y-axis represents the number of repeats in this sample. (a) The number of A/T repeats in the peapan-plastome. (b) The number of AT/TA and AAT/ATT repeats of pea pan-plastomes.
-
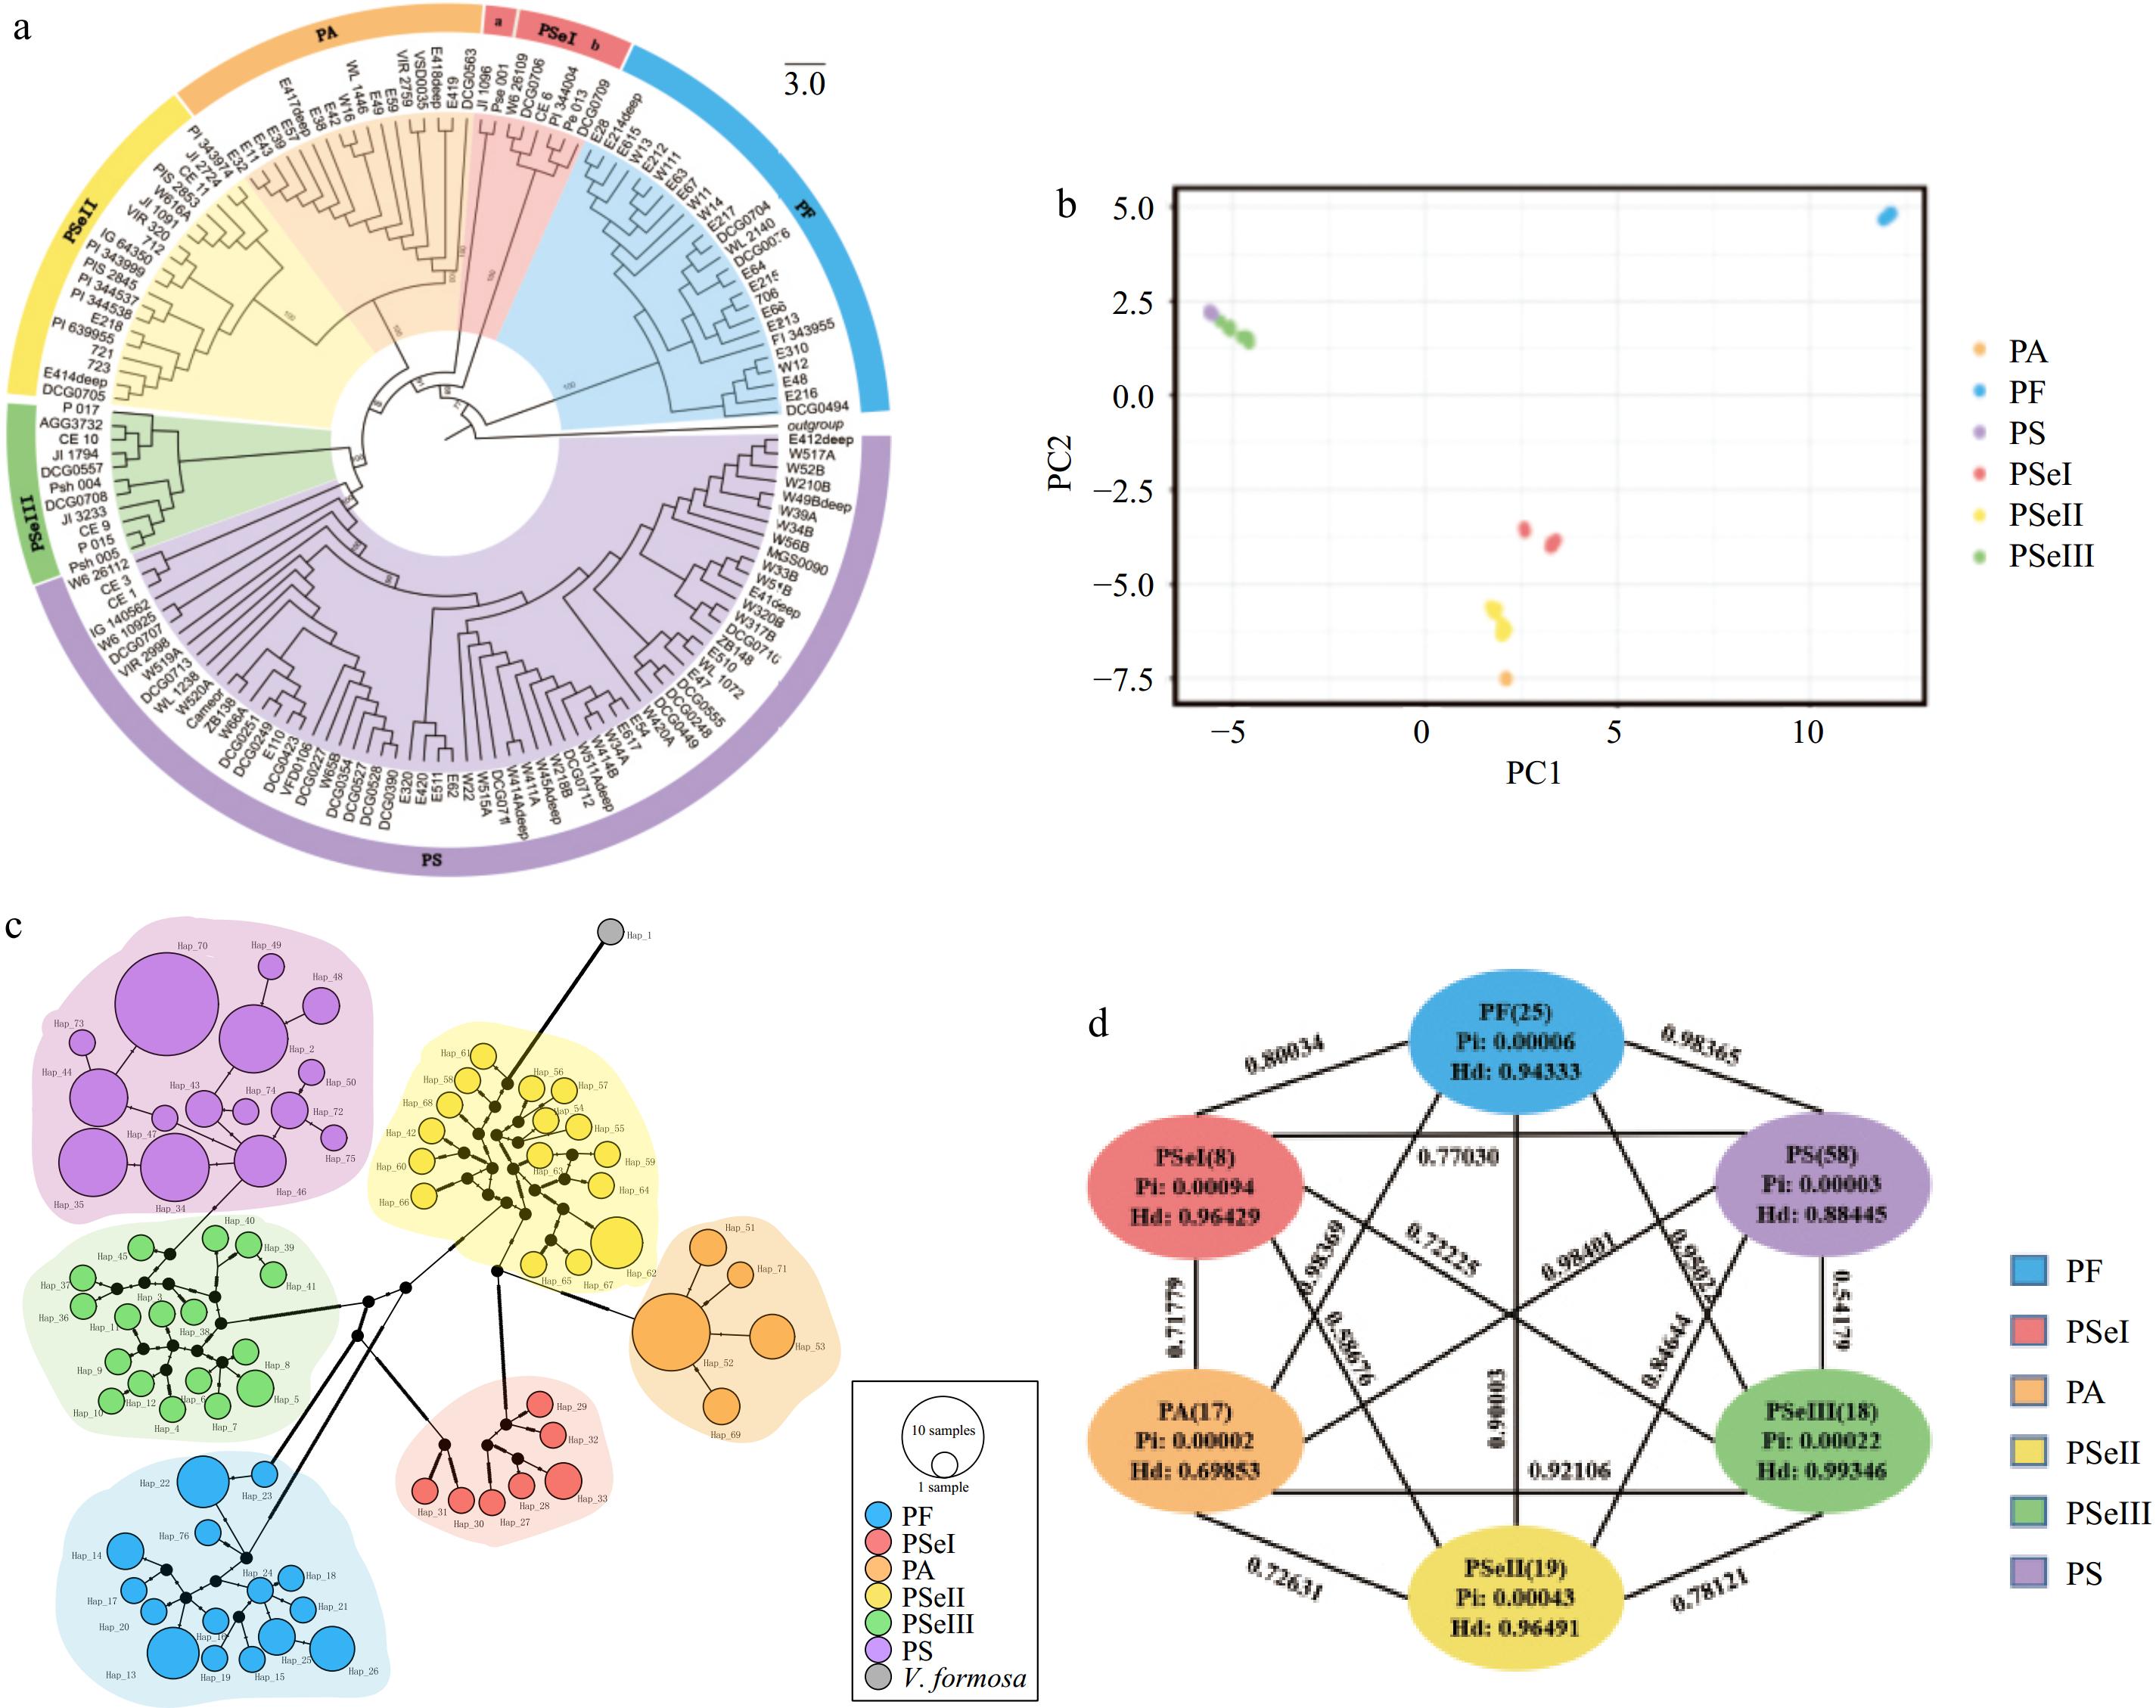
Figure 5.
(a) An ML tree resolved from 145 pea plastomes. (b) PCA analysis showing the first two components. (c) Haplotype network of pea plastomes. The size of each circle is proportional to the number of accessions with the same haplotype. (d) Genetic diversity and differentiation of six clades of peas. Pairwise FST between the corresponding genetic clusters is represented by the numbers above the lines joining two bubbles.
-
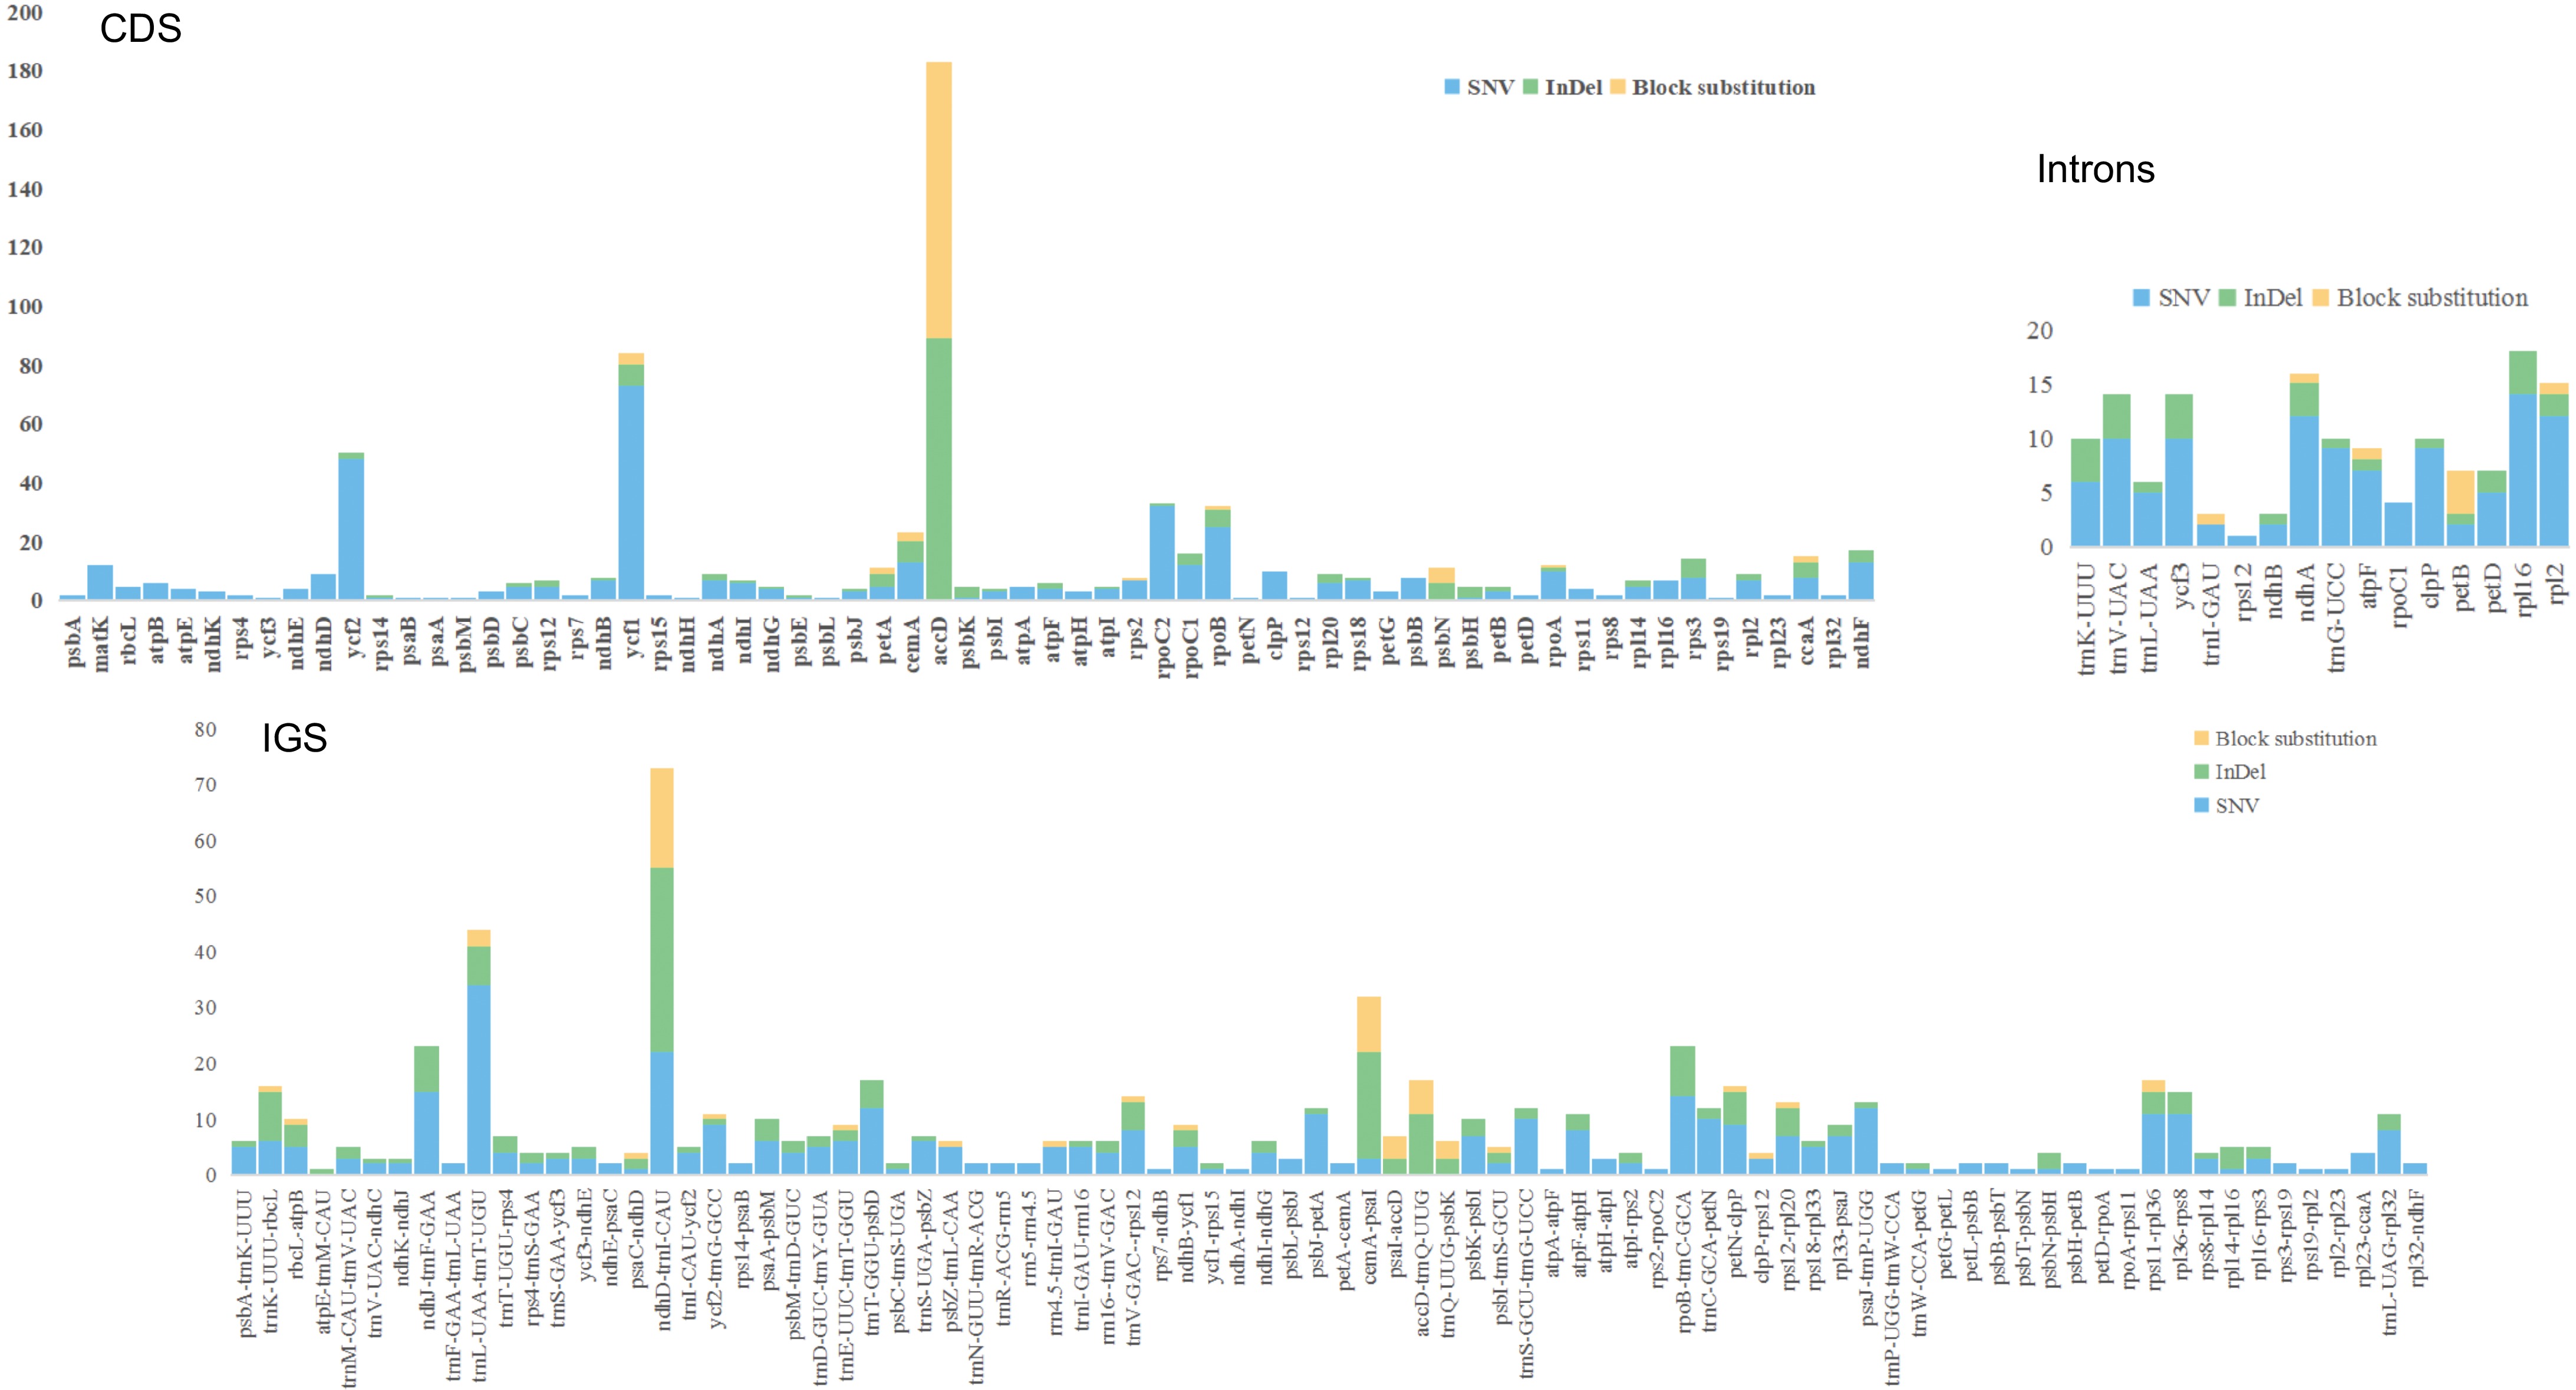
Figure 6.
Variant locations within the pea pan-plastome categorized by genic position (Introns, CDS, and IGS).
-
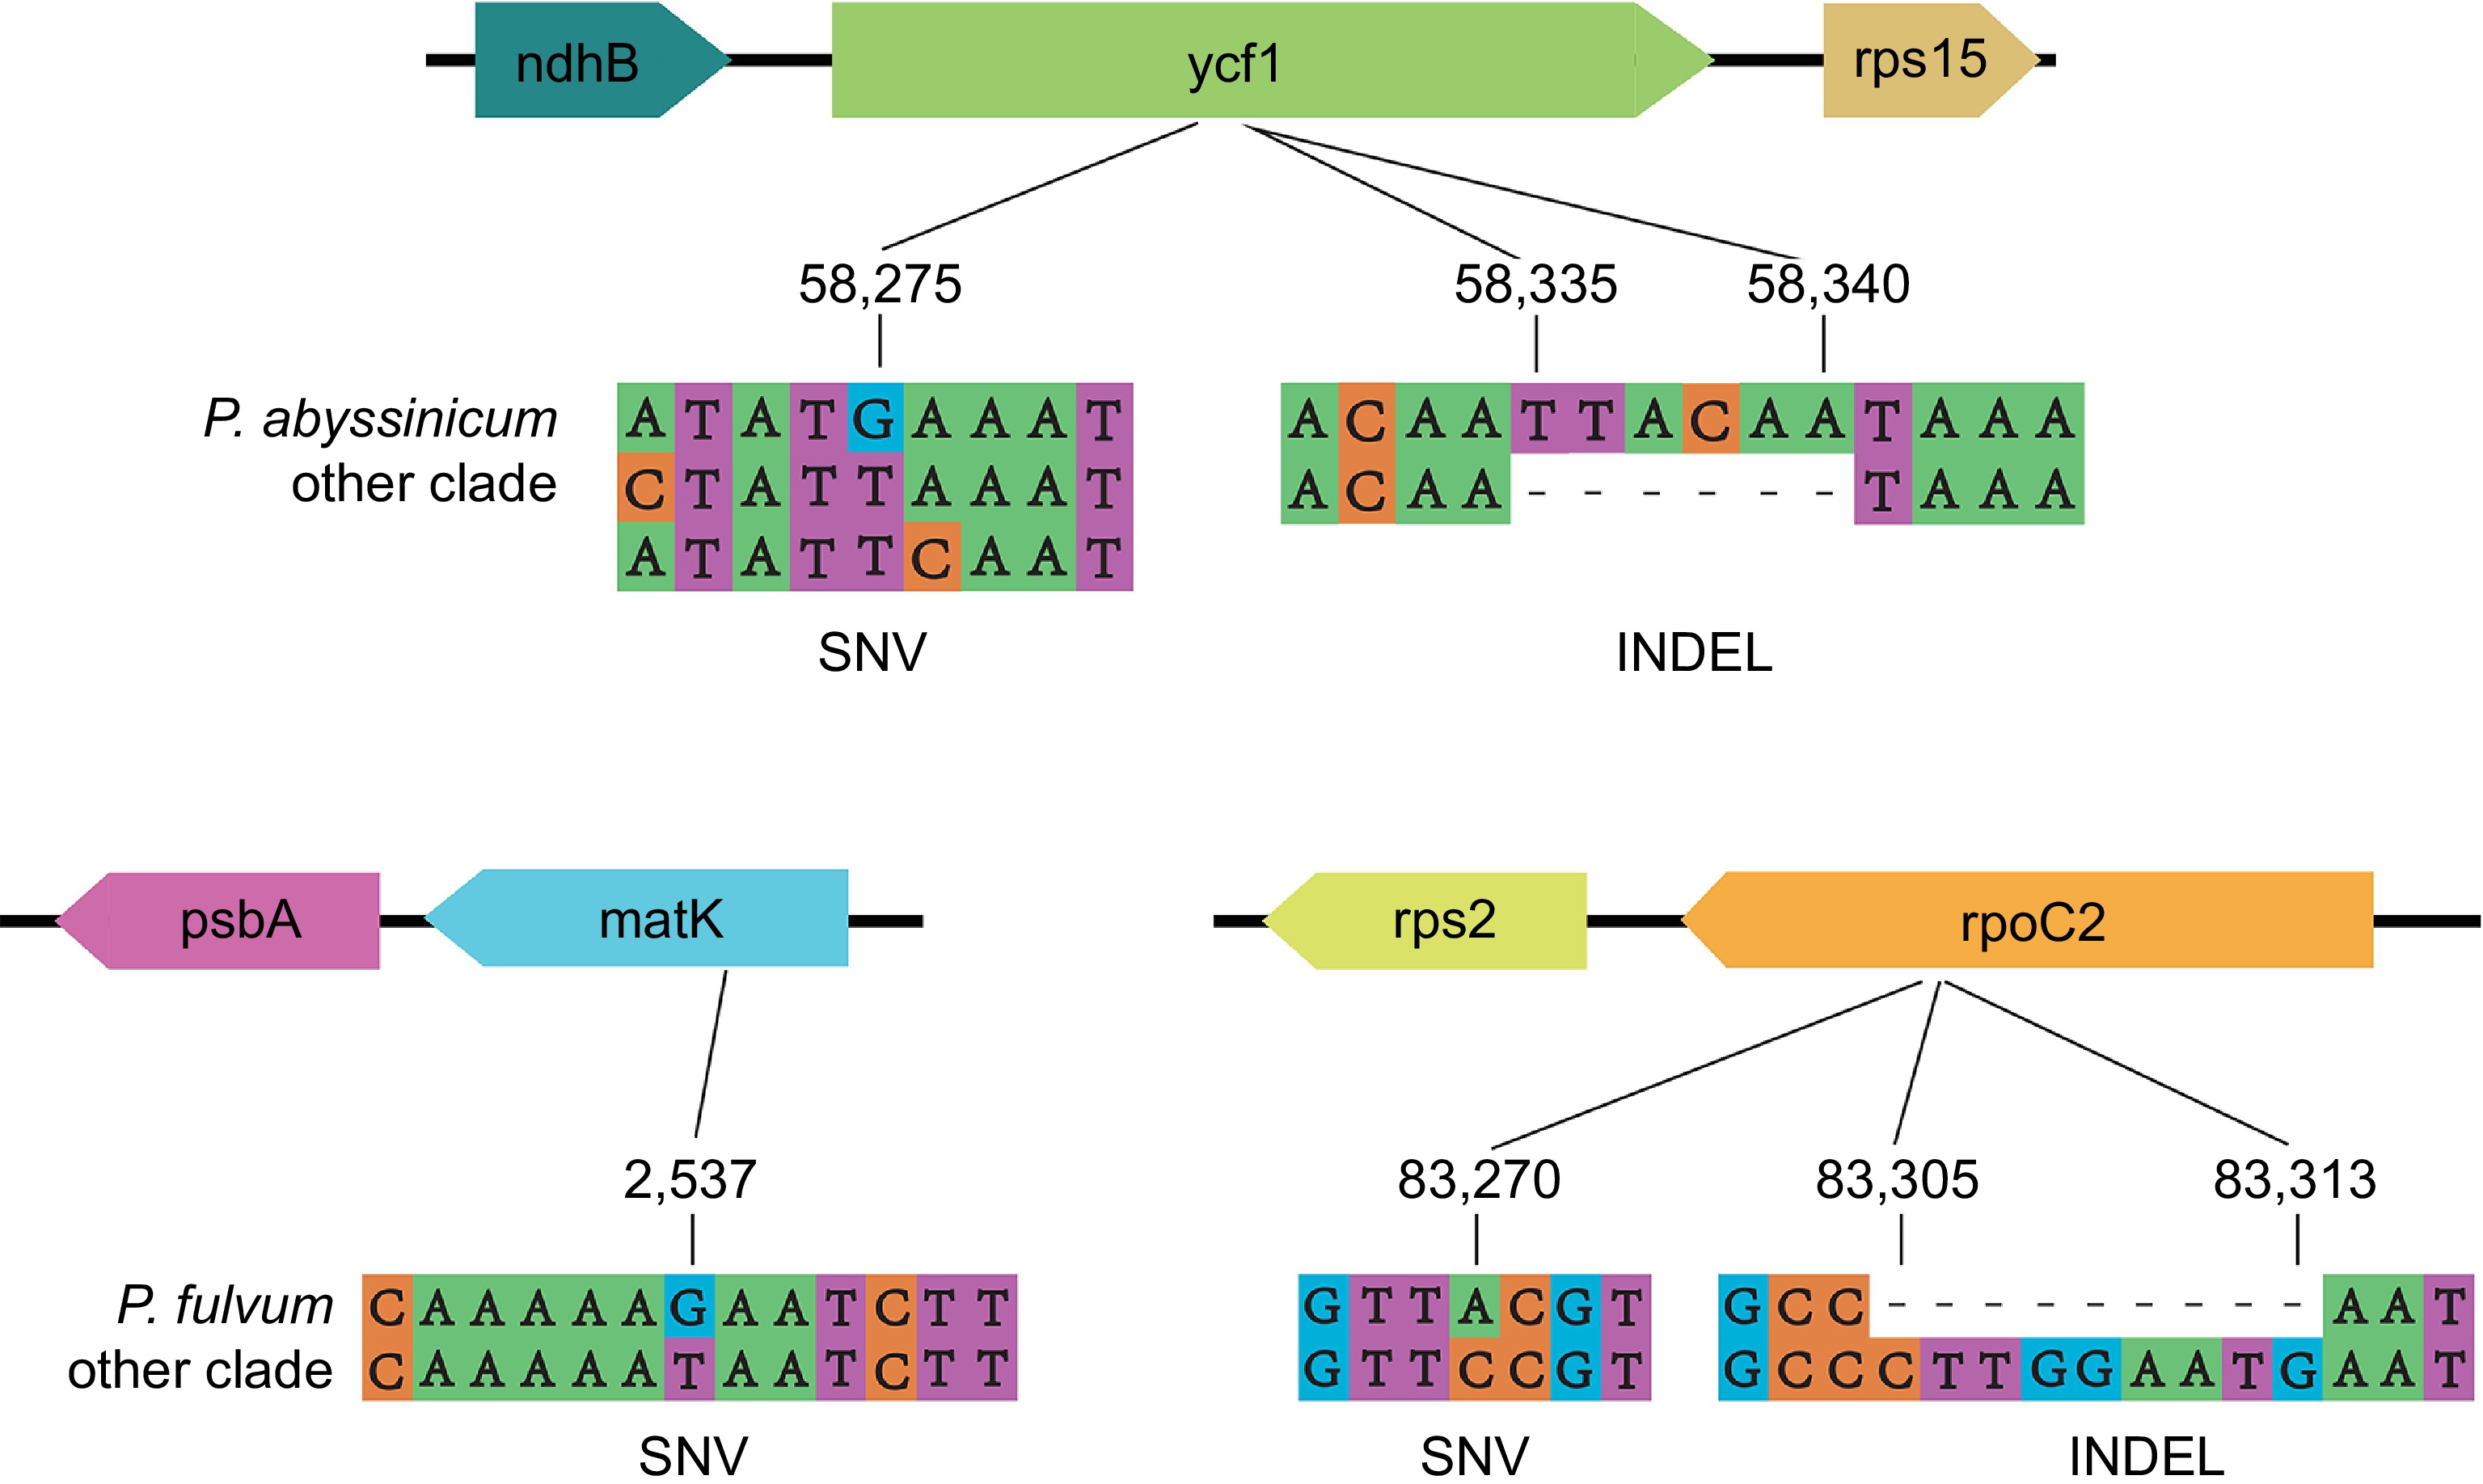
Figure 7.
Examples of variant sites.
-
Variant Total SNV Substitution InDel Mix
(InDel, SNV)Mix
(InDel, SUB)Total 1,576 965 24 426 156 4 CDS 734 445 6 176 103 4 Intron 147 110 8 29 0 0 tRNA 20 15 1 4 0 0 rRNA 11 3 0 6 2 0 IGS 663 392 9 211 51 0 Table 1.
Nucleotide variation in the pan-plastome of peas.
Figures
(7)
Tables
(1)