-

Figure 1.
Analysis of temperature and humidity change in the boar room. (a) Room temperature. (b) Relative humidity.
-
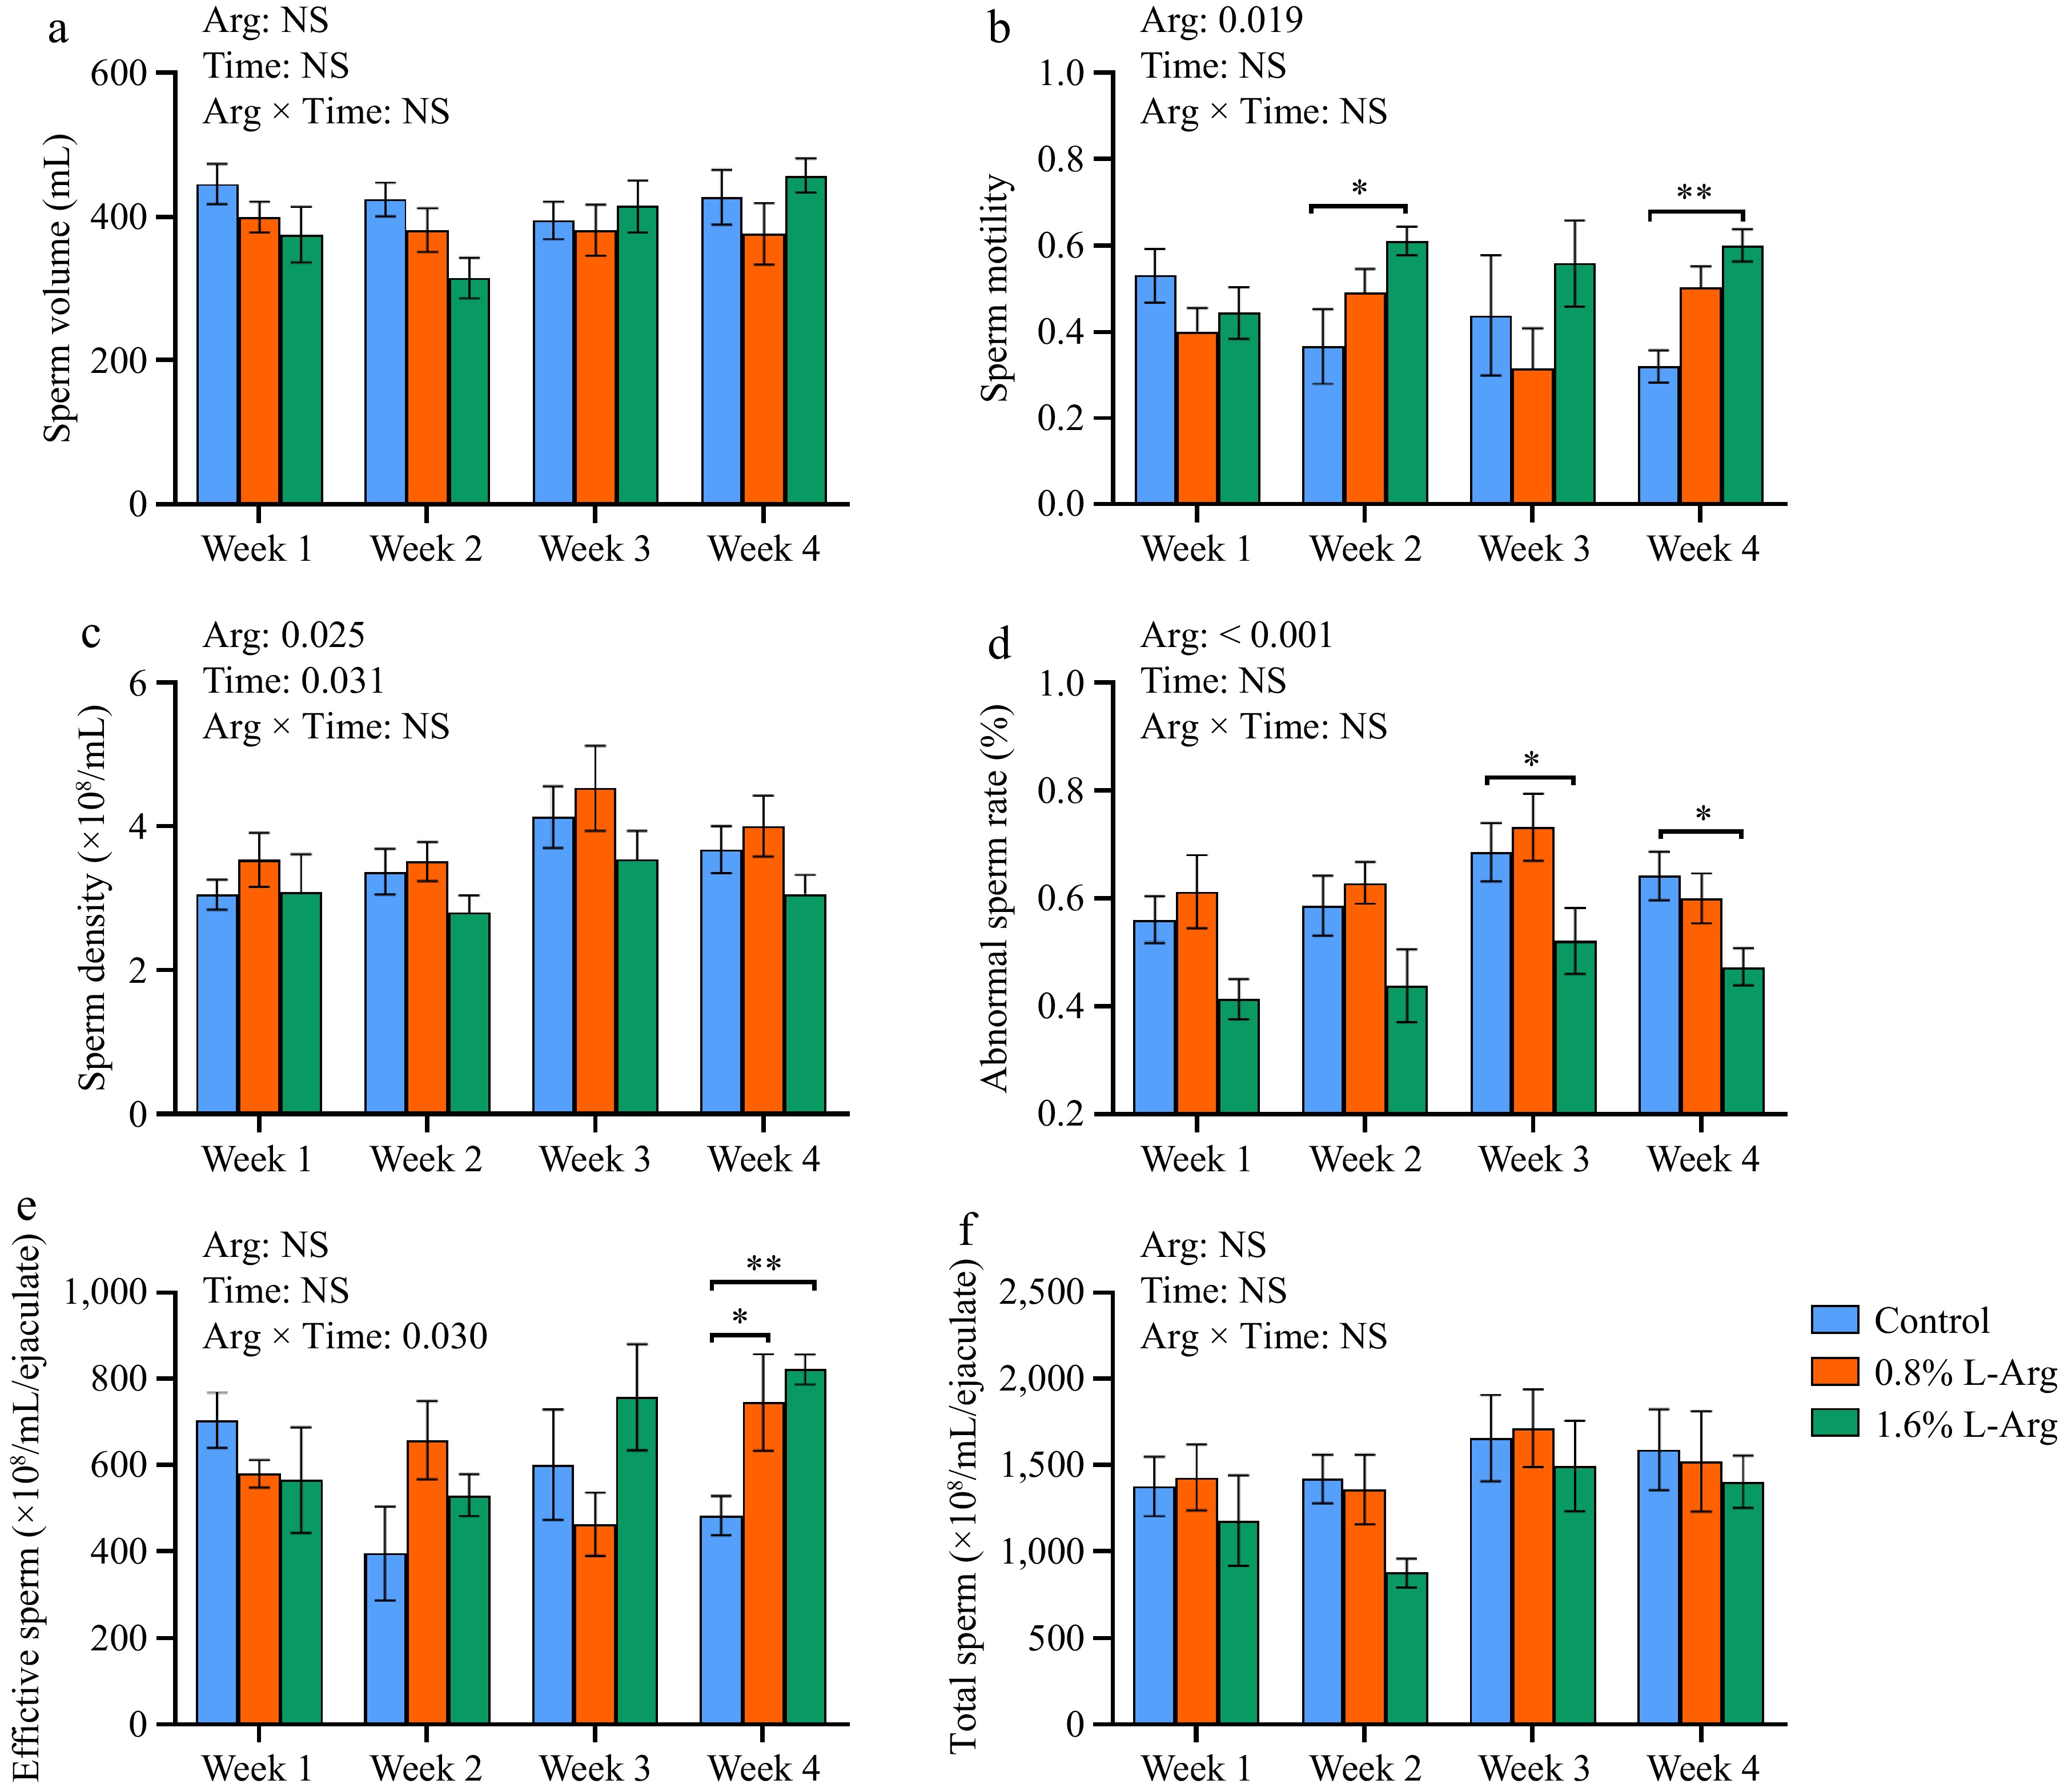
Figure 2.
Effect of dietary L-Arg supplementation on boar semen quality. (a) Semen volume. (b) Sperm motility. (c) Sperm density. (d) Abnormal sperm rate. (e) Effective sperm. (f) Total sperm. *, p < 0.05, **, p < 0.01.
-
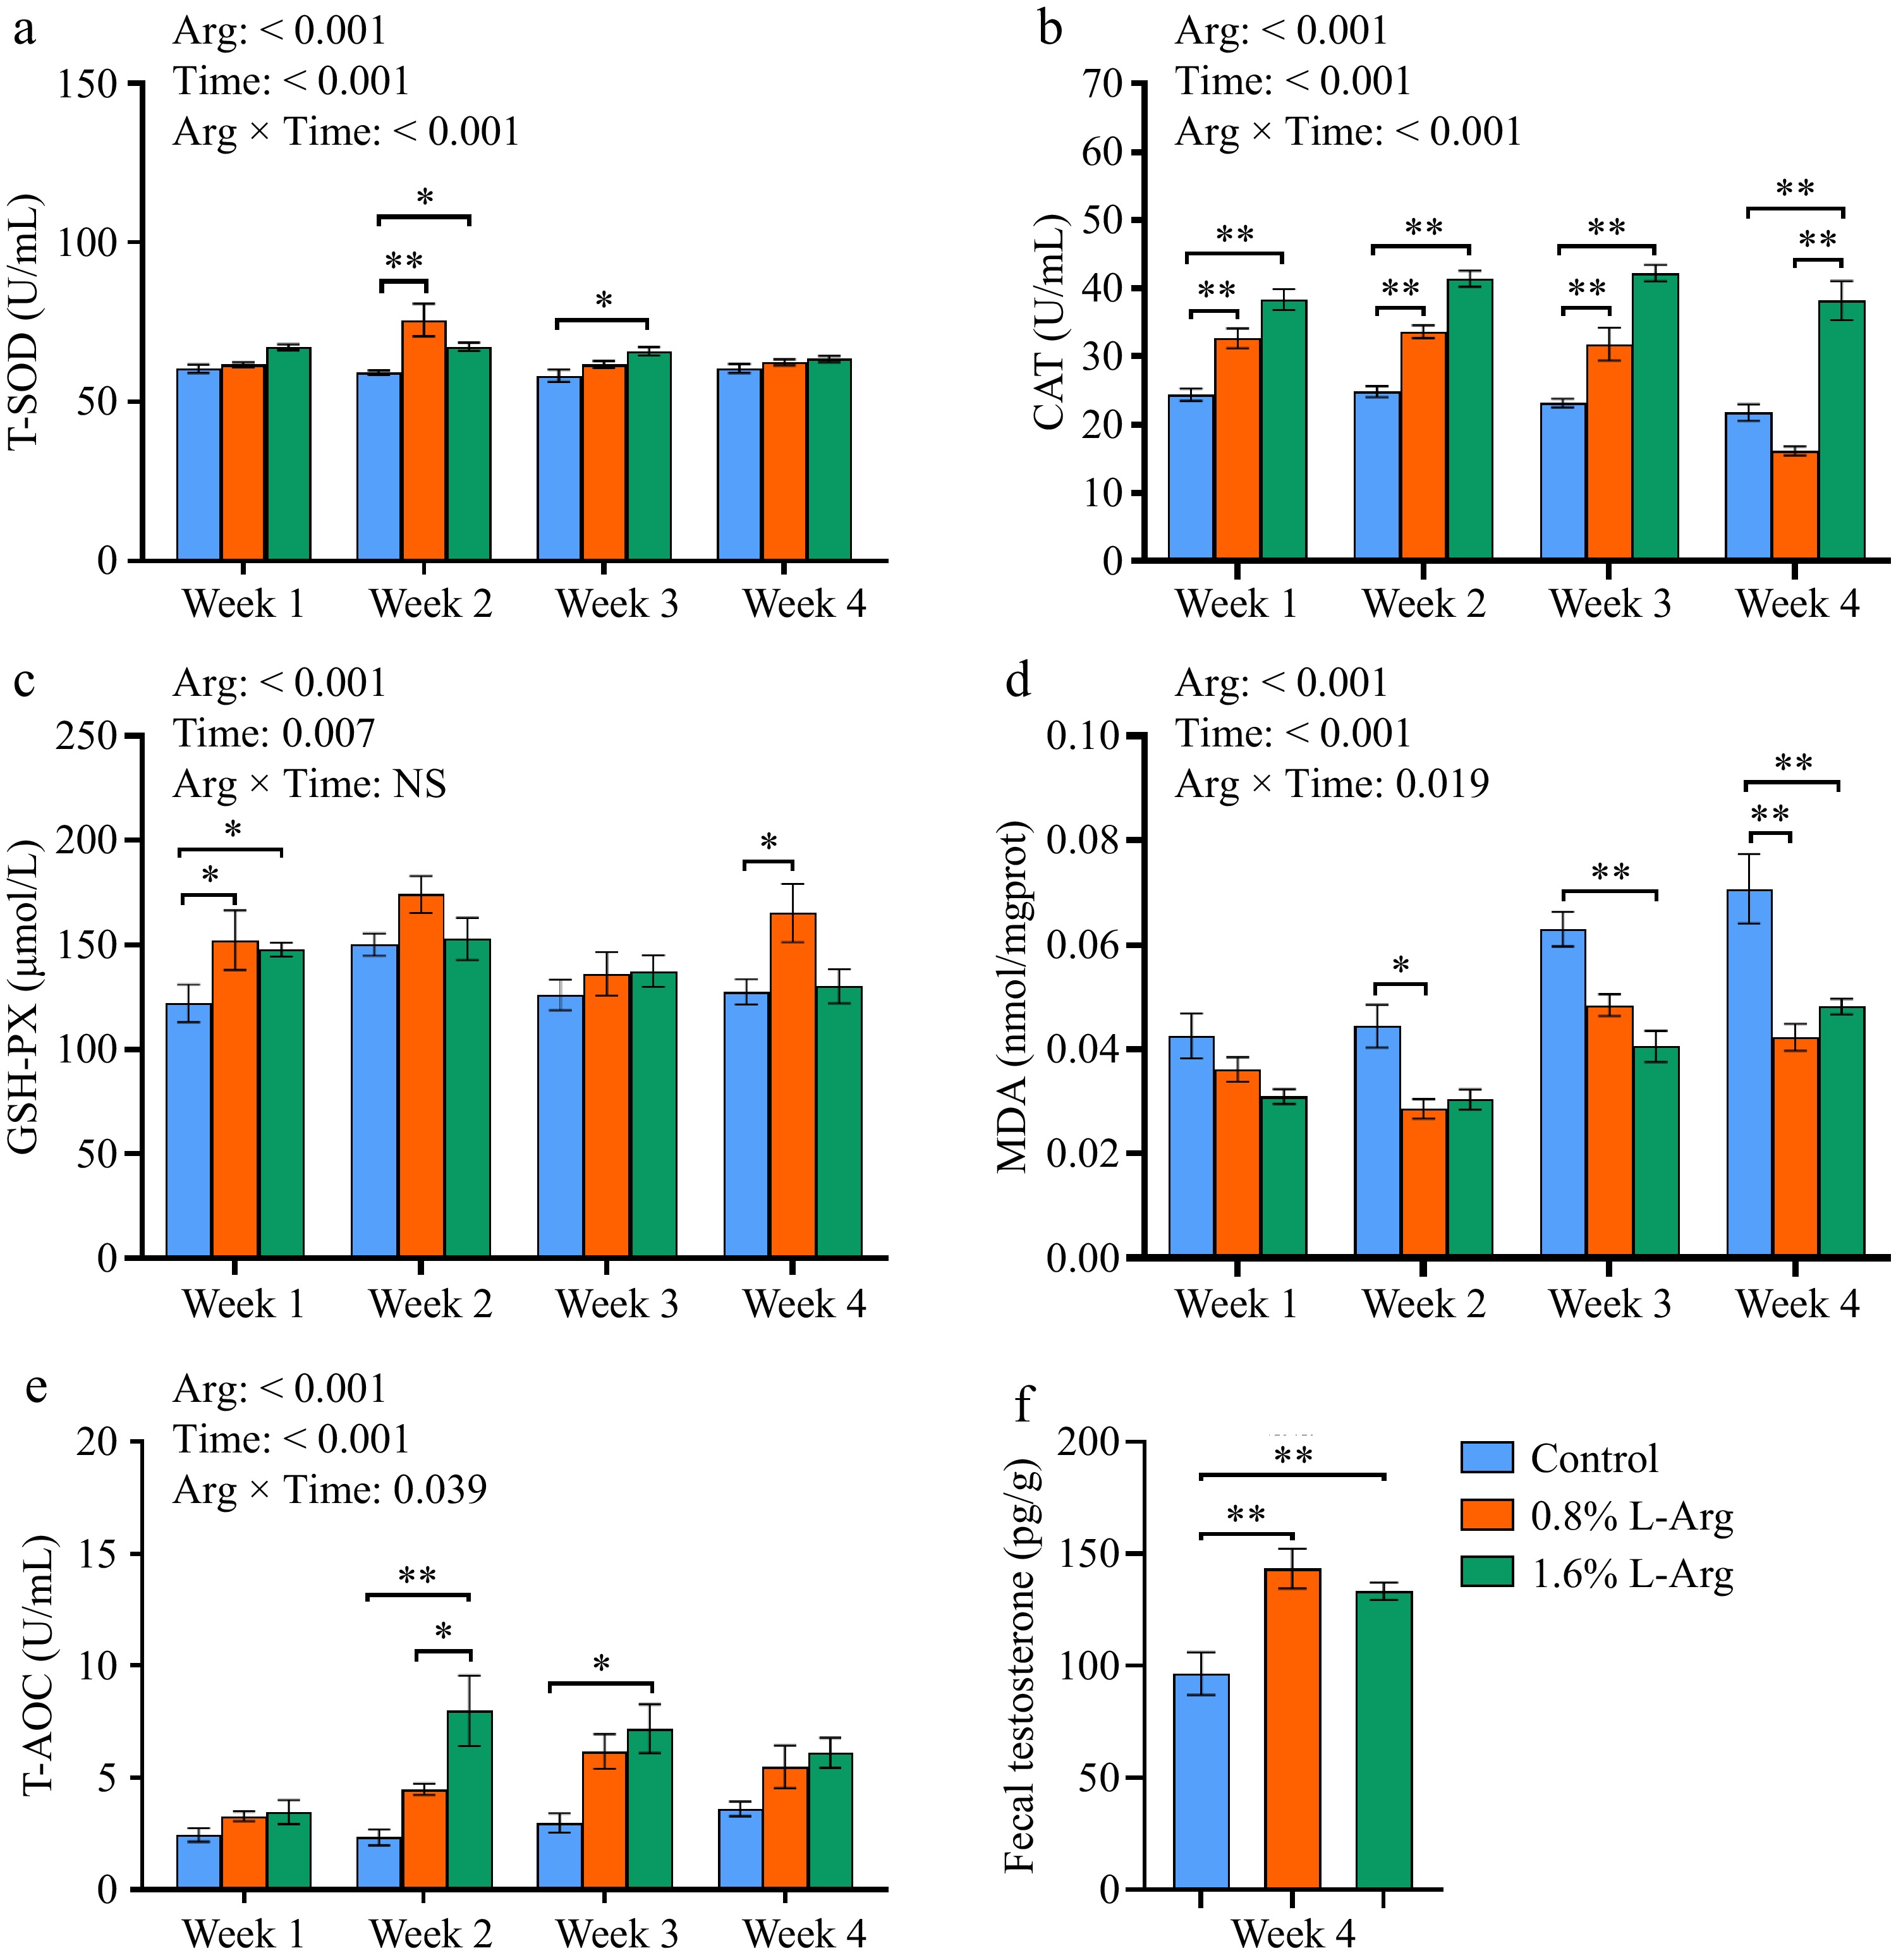
Figure 3.
Effects of dietary supplementation of L-Arg on the antioxidant capacity of semen and fecal testosterone. (a) Levels of T-SOD in seminal plasma. (b) Levels of CAT in seminal plasma. (c) Levels of GSH-PX in seminal plasma. (d) MDA content in sperm. (e) Levels of T-AOC in seminal plasma. (f) Fecal testosterone content at week 4.
-
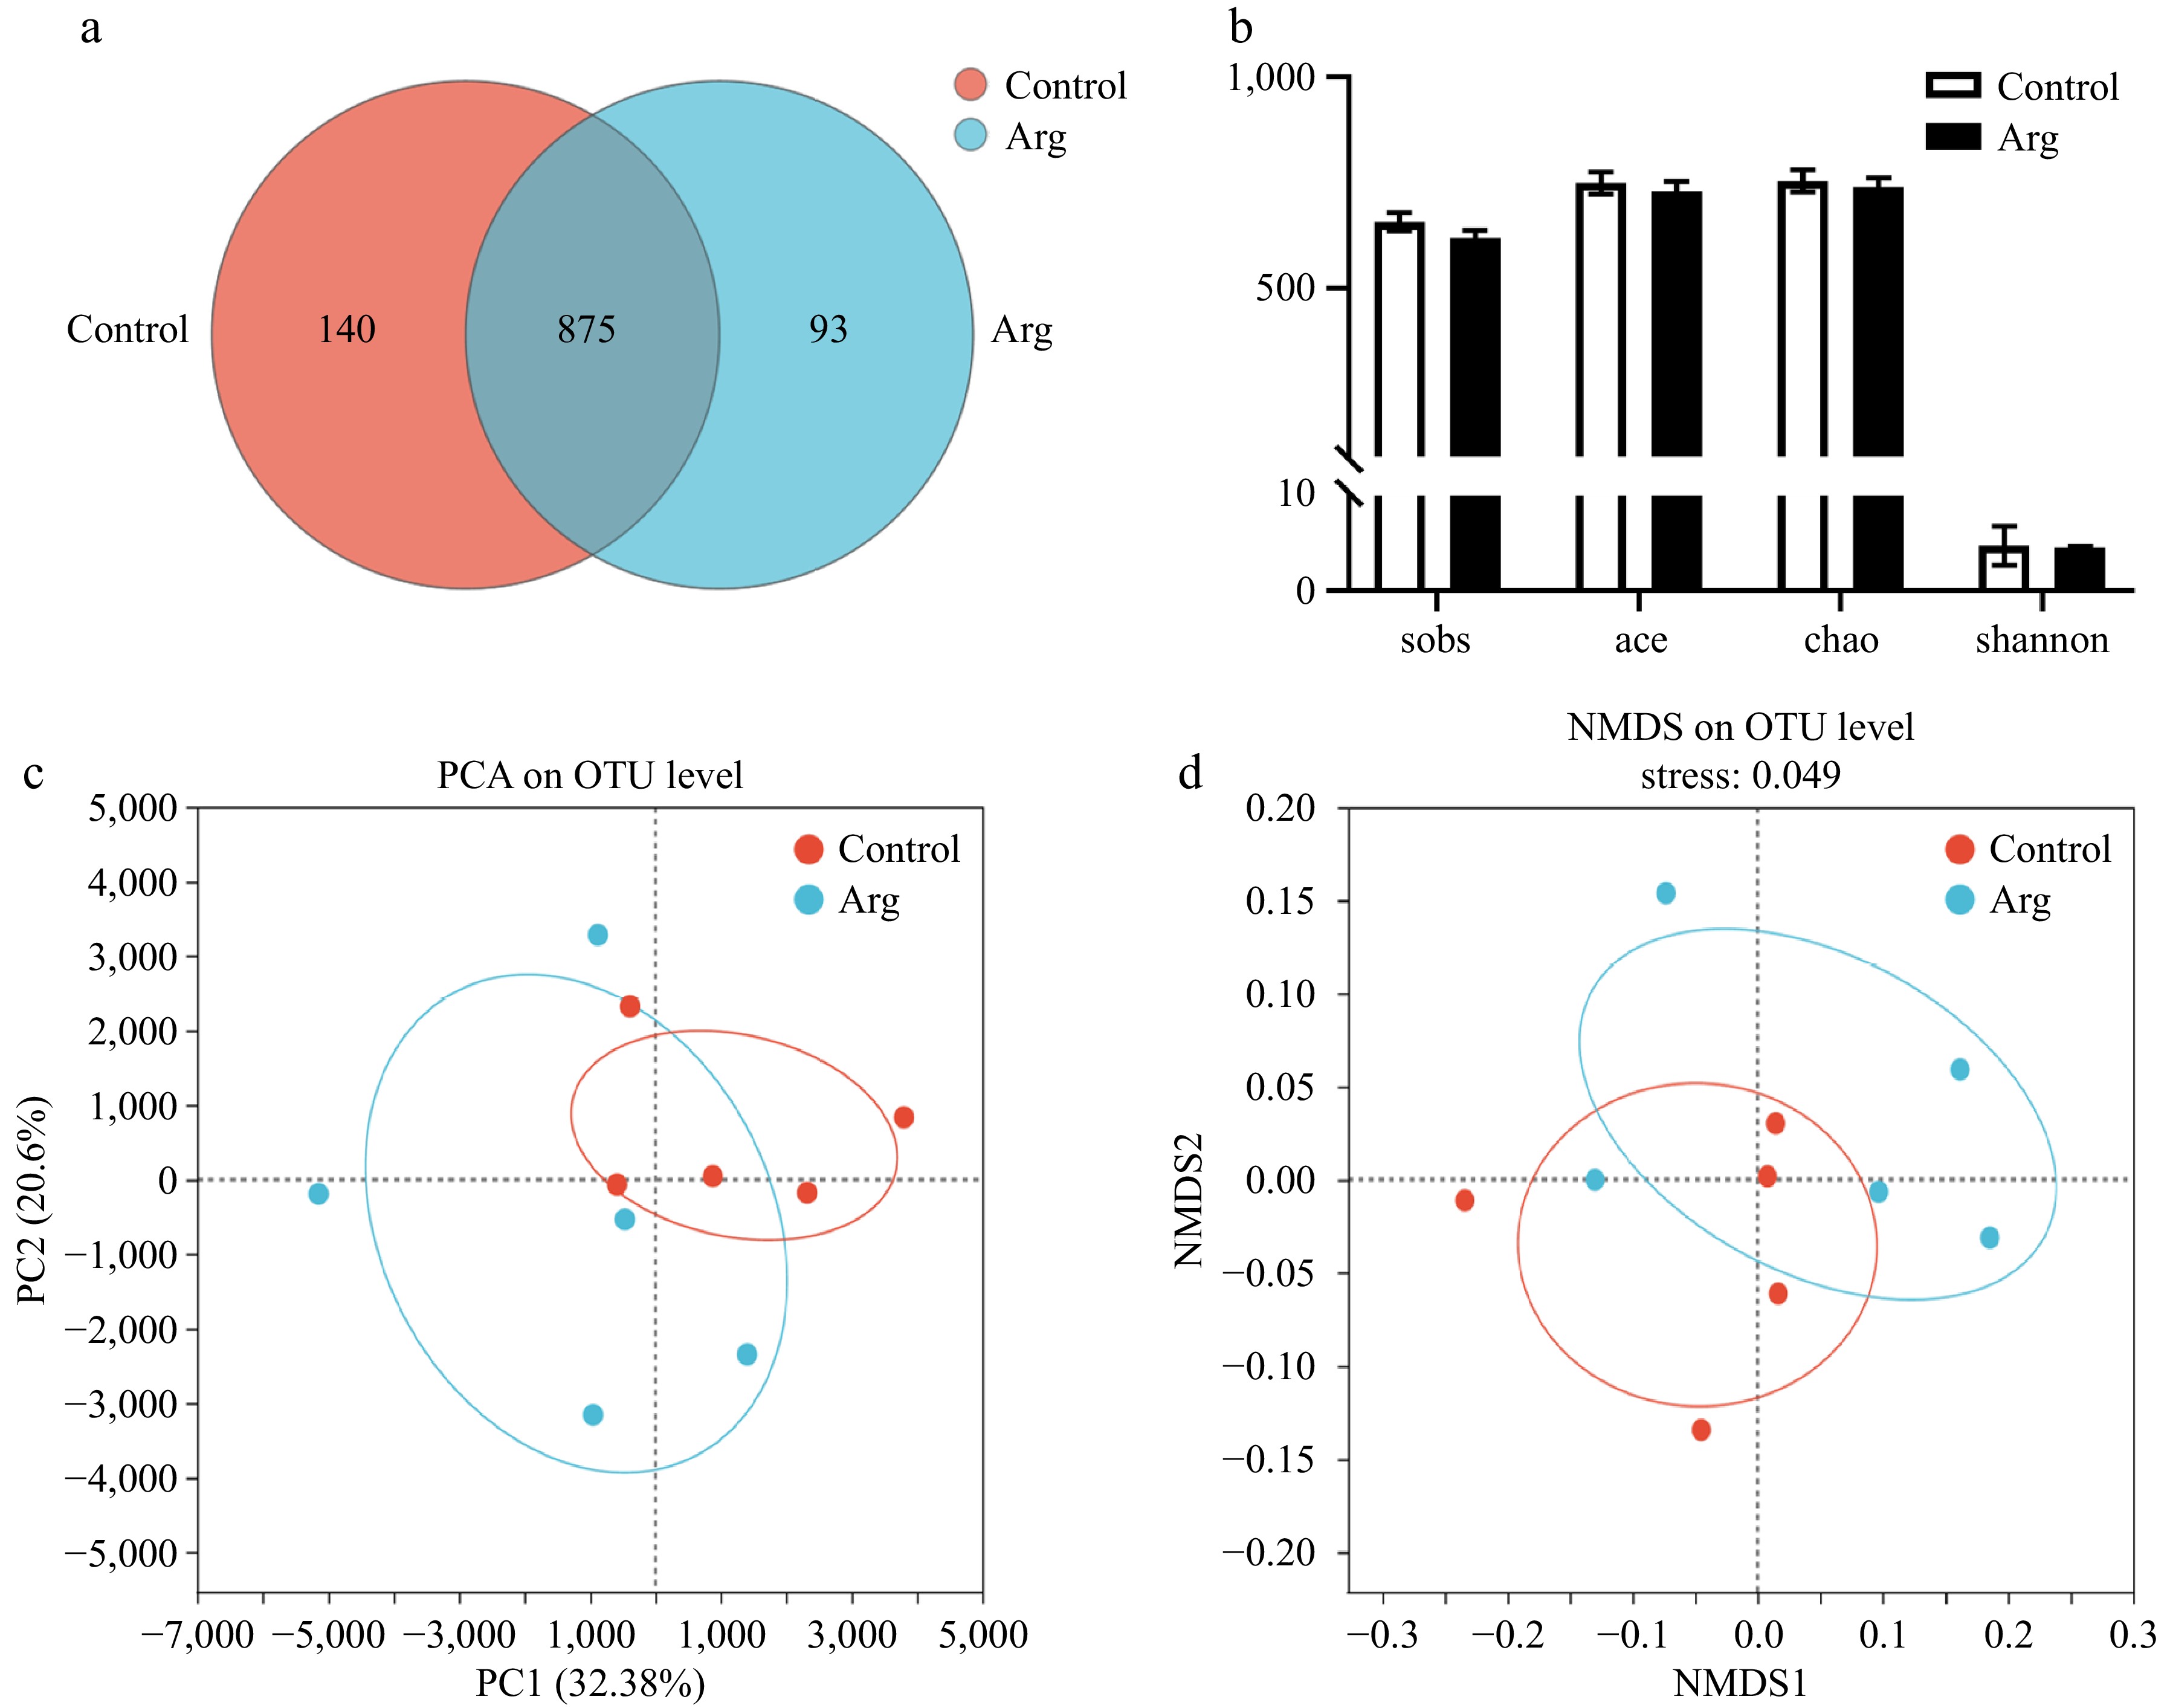
Figure 4.
Analysis of Alpha and Beta diversity of fecal microbiota. (a) Species Venn plot analysis. (b) The sobs index represents the actual observed value of species richness, the ace index represents the species richness, the chao index represents the species richness, and the shannon index represents the species diversity. (c) PCA principal component analysis between two groups. (d) NMDS analysis based on weighted-unifrac distance calculation, stress = 0.049. Control: fecal samples at the third week; Arg: fecal samples from the 1.6% group at the third week.
-
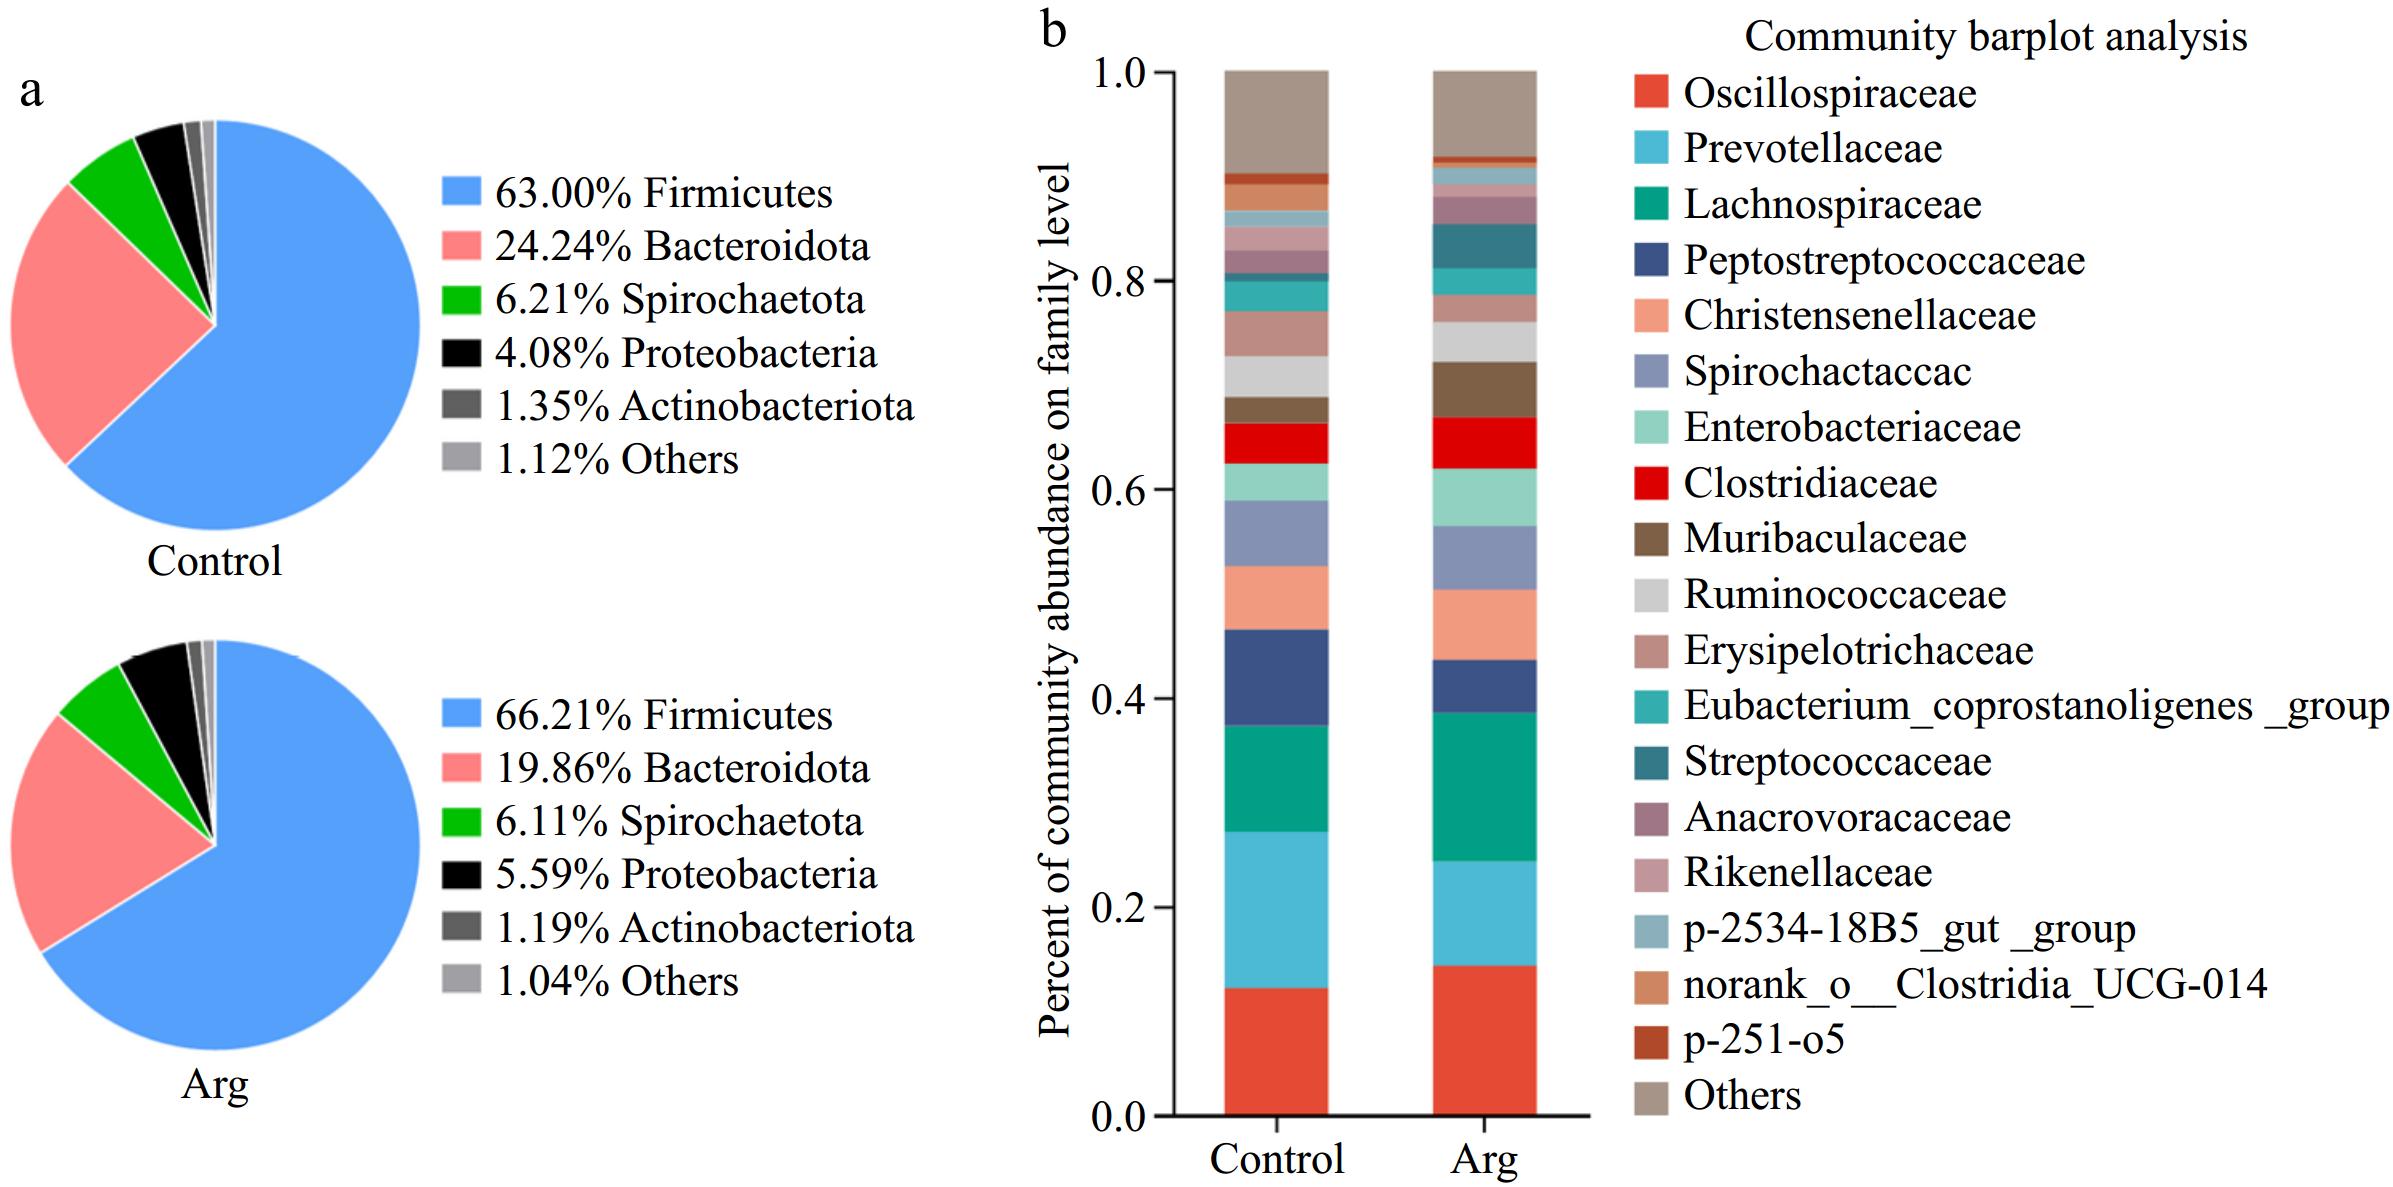
Figure 5.
The composition of the fecal microbiota. (a) Phylum level. (b) Family level.
-
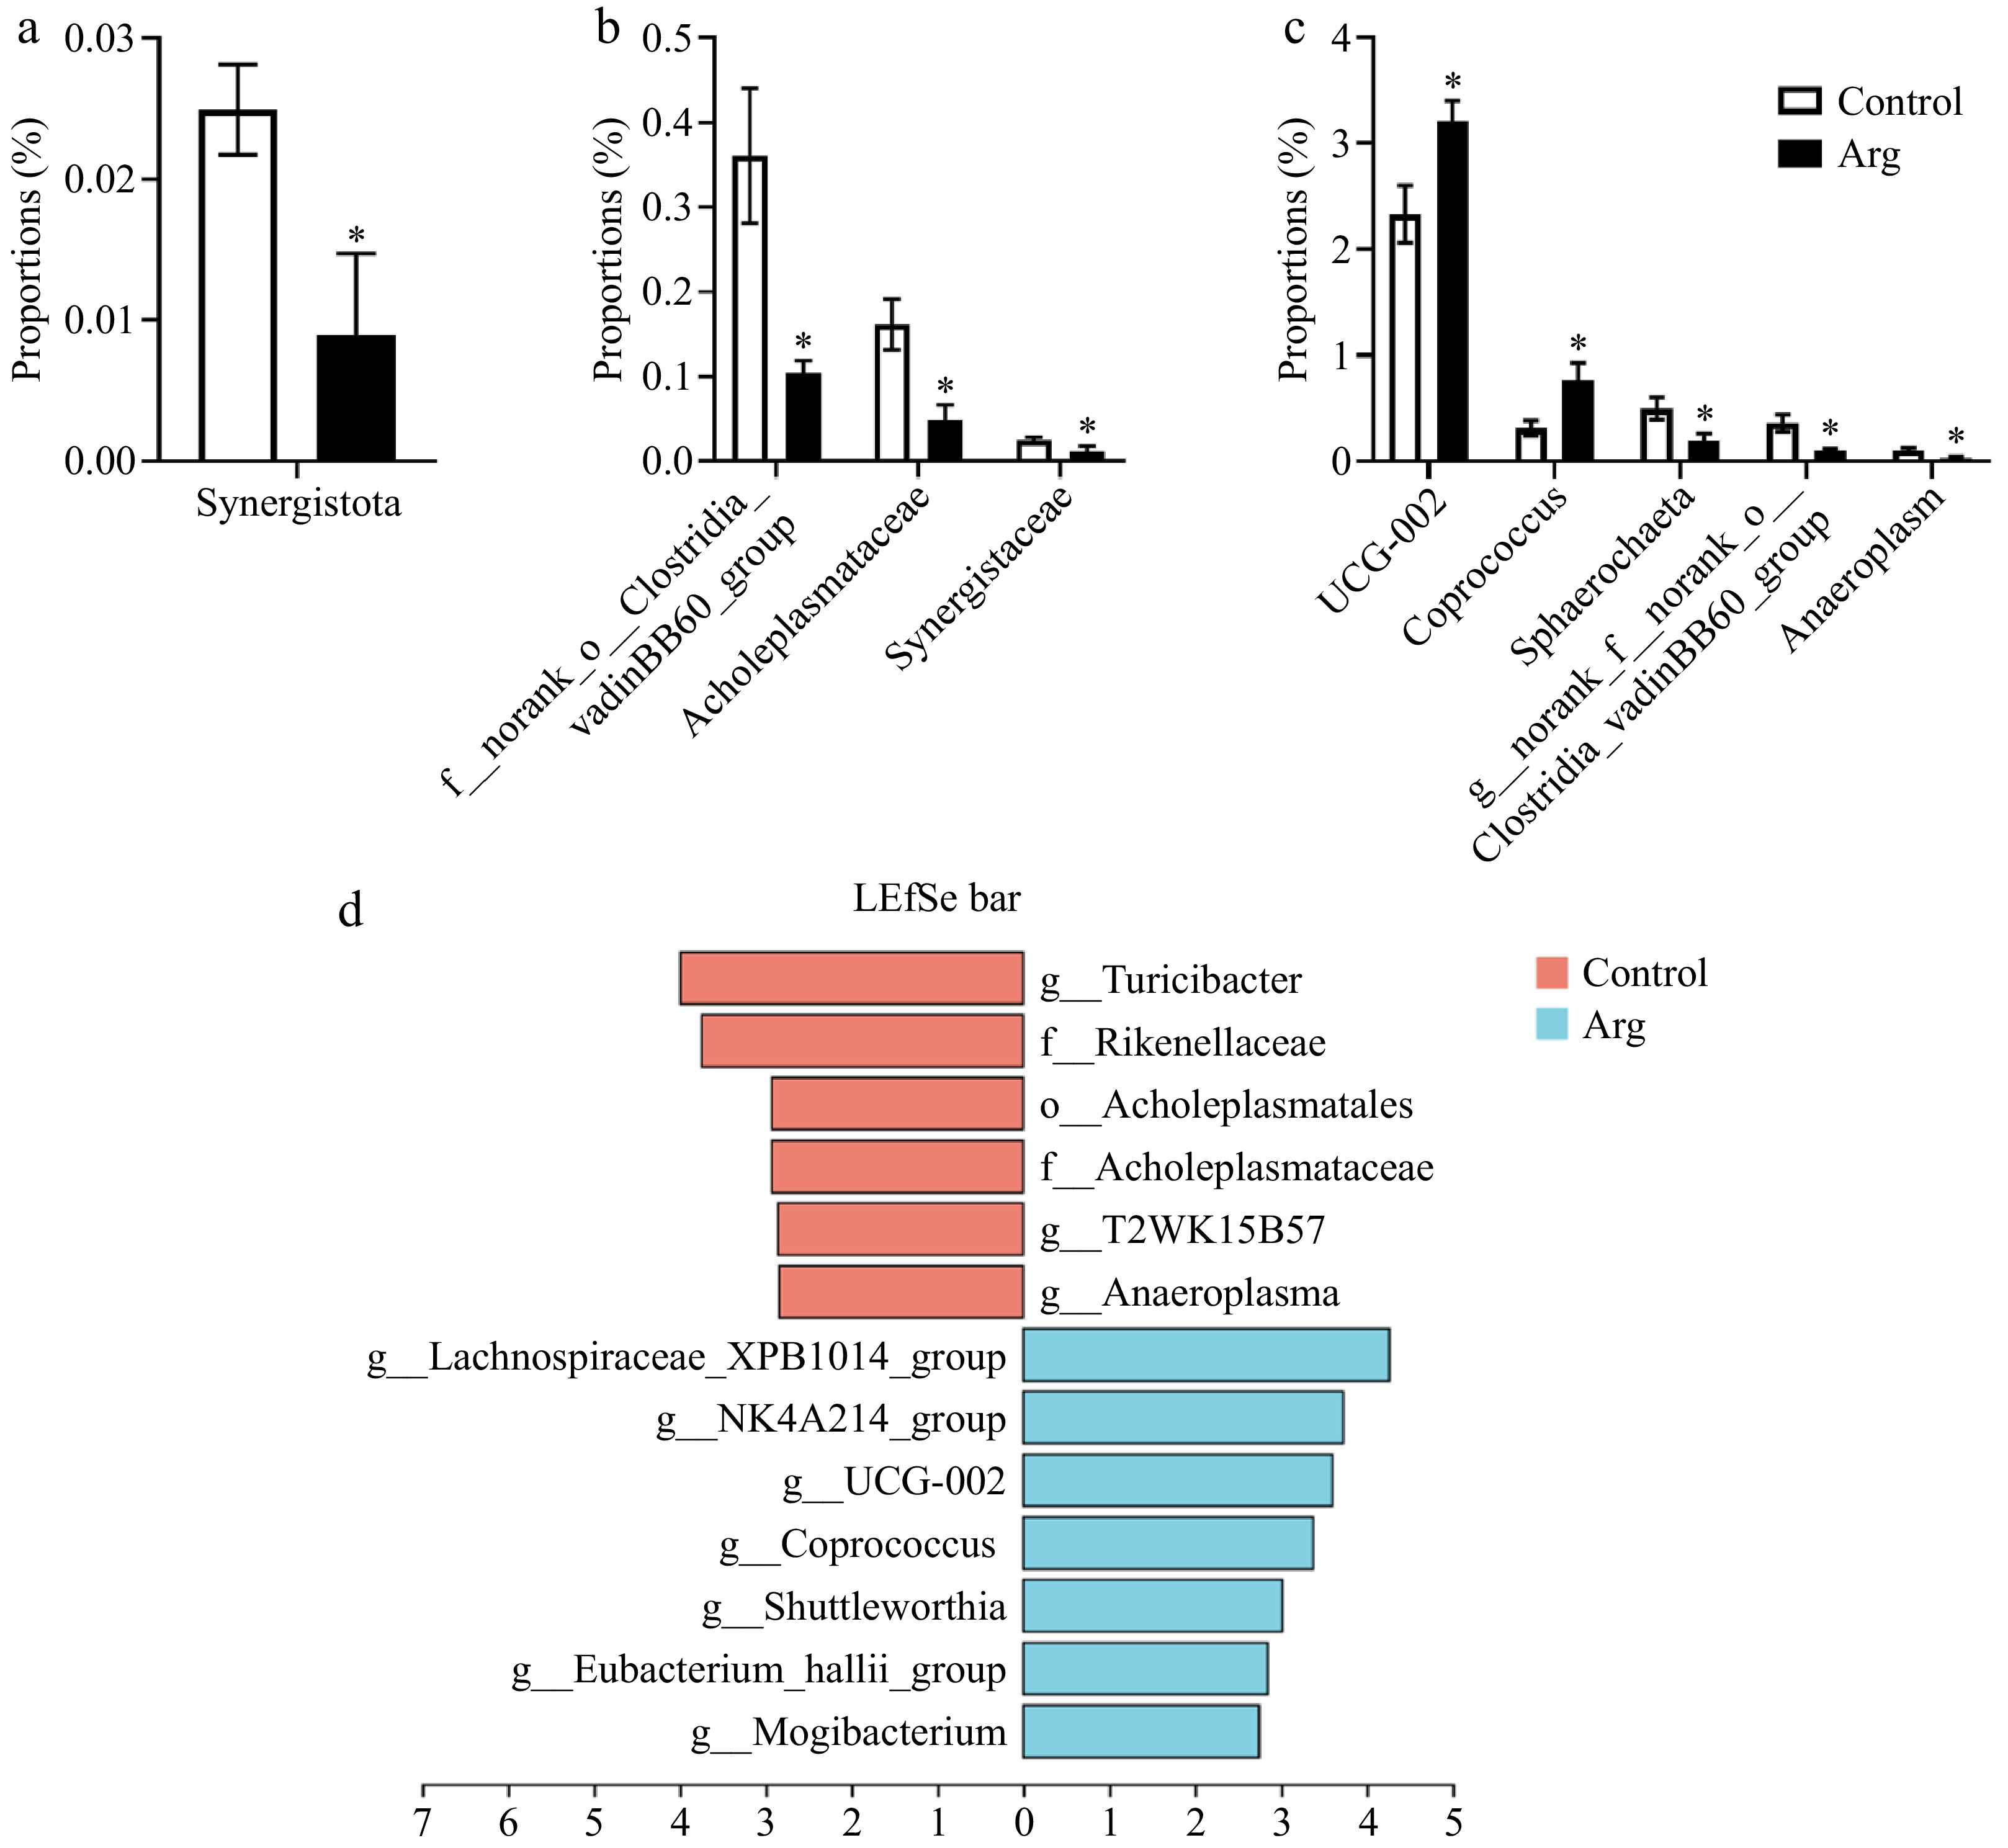
Figure 6.
Analysis of differential microbiota in feces. (a) Species differences at the phylum level. (b) Species differences at the family level. (c) Species differences at the genus level. (d) Lefse multi-level species difference discriminant analysis (LAD > 2, p < 0.05). *, compared with the control group.
-
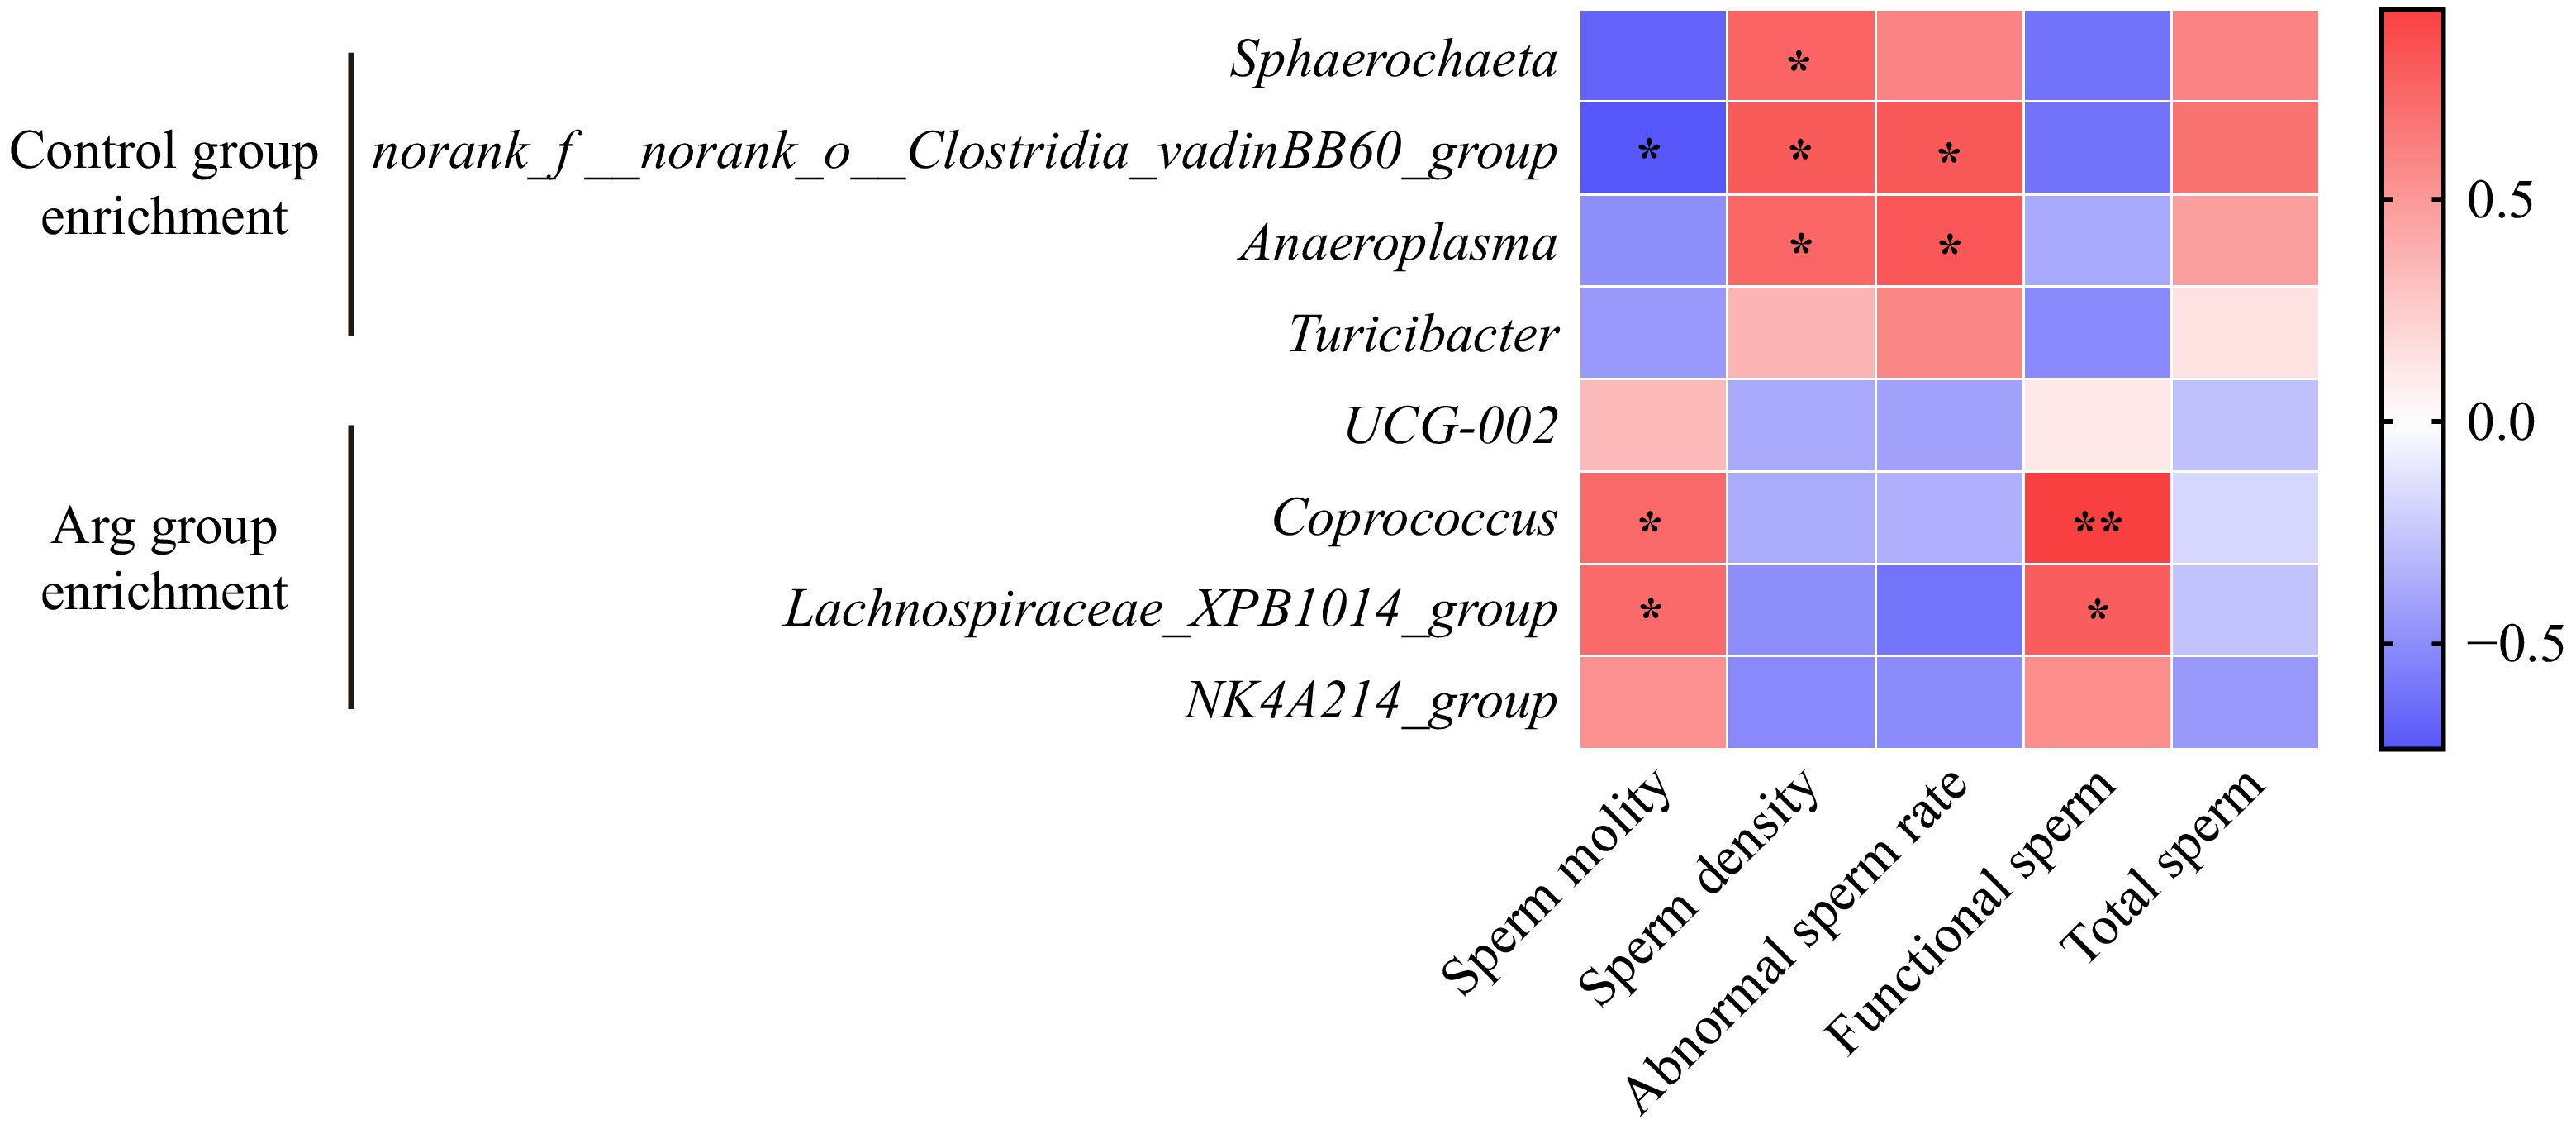
Figure 7.
Correlation analysis of fecal differential microbiota and semen quality indicators. Heat map of the correlation between differential microbiota at the genus level and semen quality indicators. Red represents a positive correlation and blue represents a negative correlation.
-
Item Control 0.8% 1.6% Semen volume (mL) 392.40 ± 27.93 382.40 ± 44.72 377.40 ± 21.22 Sperm motility 0.49 ± 0.02 0.54 ± 0.02 0.54 ± 0.04 Sperm density (× 108/mL) 3.30 ± 0.48 3.60 ± 0.44 4.80 ± 0.97 Abnormal sperm rate (%) 28.20 ± 3.45 30.30 ± 2.64 25.20 ± 4.33 Functional sperm (× 108/mL/ejaculate) 658.10 ± 138.99 714.70 ± 88.28 704.80 ± 81.95 Total sperm
(× 108/mL/ejaculate)1326.40 ± 246.99 1319.40 ± 135.01 1346.00 ± 185.60 Sperm motility is indicated by a grading scale (0.0−1.0), the results are expressed as Mean ± SEM. p > 0.05, n = 5. Table 1.
Semen quality of boar by four successive tests before the experiment.
-
Ingredient Percentage Corn 30.58 Wheat 20.00 Barley 30.00 Soybean meal (43%) 6.97 Sunflower meal 5.79 Fish meal 3.00 Calcium hydrogen phosphate 0.58 Limestone 1.51 Sodium chloride 0.28 Lysine sulfate (70%) 0.49 Threonine (98%) 0.06 Tryptophan (25%) 0.02 Choline chloride (60%) 0.12 Premix* (0.6%) 0.60 Total 100.00 Nutrient levels** Digestive energy (kcal/kg) 3162.00 Crude protein 15.50 Crude fat 2.40 Crude fiber 3.80 Neutral detergent fiber 14.26 Ca 0.90 Total phosphorus 0.56 * Premixes are provided for each kilogram of diet: 5000 IU vitamin A; 1000 IU vitamin D3, 48 mg/kg vitamin E; 2.5 mg/kg vitamin K; 4.8 mg/kg vitamin B2; 3.2 mg/kg vitamin B6; 7.5 mg/kg niacin; 88 mg/kg iron (ferrous sulfate); 20 mg/kg copper (copper sulfate); 90 mg/kg zinc (zinc oxide); 0.3 mg/kg selenium (sodium selenite). ** Nutrient levels are calculated values. Table 2.
Composition and nutrient levels of experimental basic diet (as-dry basis).
-
Control 0.8% L-Arg 1.6% L-Arg Week 1 32.45 ± 0.25 32.18 ± 0.35 31.64 ± 0.28 Week 2 30.45 ± 0.31 30.14 ± 0.39 29.82 ± 0.38 Week 3 31.86 ± 0.36 31.94 ± 0.34 31.28 ± 0.39 Week 4 31.05 ± 0.29 30.50 ± 0.22 30.65 ± 0.22 Scrotal surface temperature, °C, the results are expressed as Mean ± SEM. n = 5. Table 3.
Analysis of scrotal surface temperature changes.
Figures
(7)
Tables
(3)