-

Figure 1.
Effects of dendrobine in hepatic cells. (a) Structure of dendrobine, drawn using ChemDraw; (b) cell viability of LO2 cells, treated with different concentrated of dendrobine (0, 0.5, 1, 2.5, 5, 7.5, 10, 15, and 20 μg·mL−1); (c) colony formation of LO2 cells with different concentrated of dendrobine (0, 1, 5, and 10 μg·mL−1). * p < 0.05, ** p < 0.01 vs control group, n = 3. Dend: dendrobine.
-
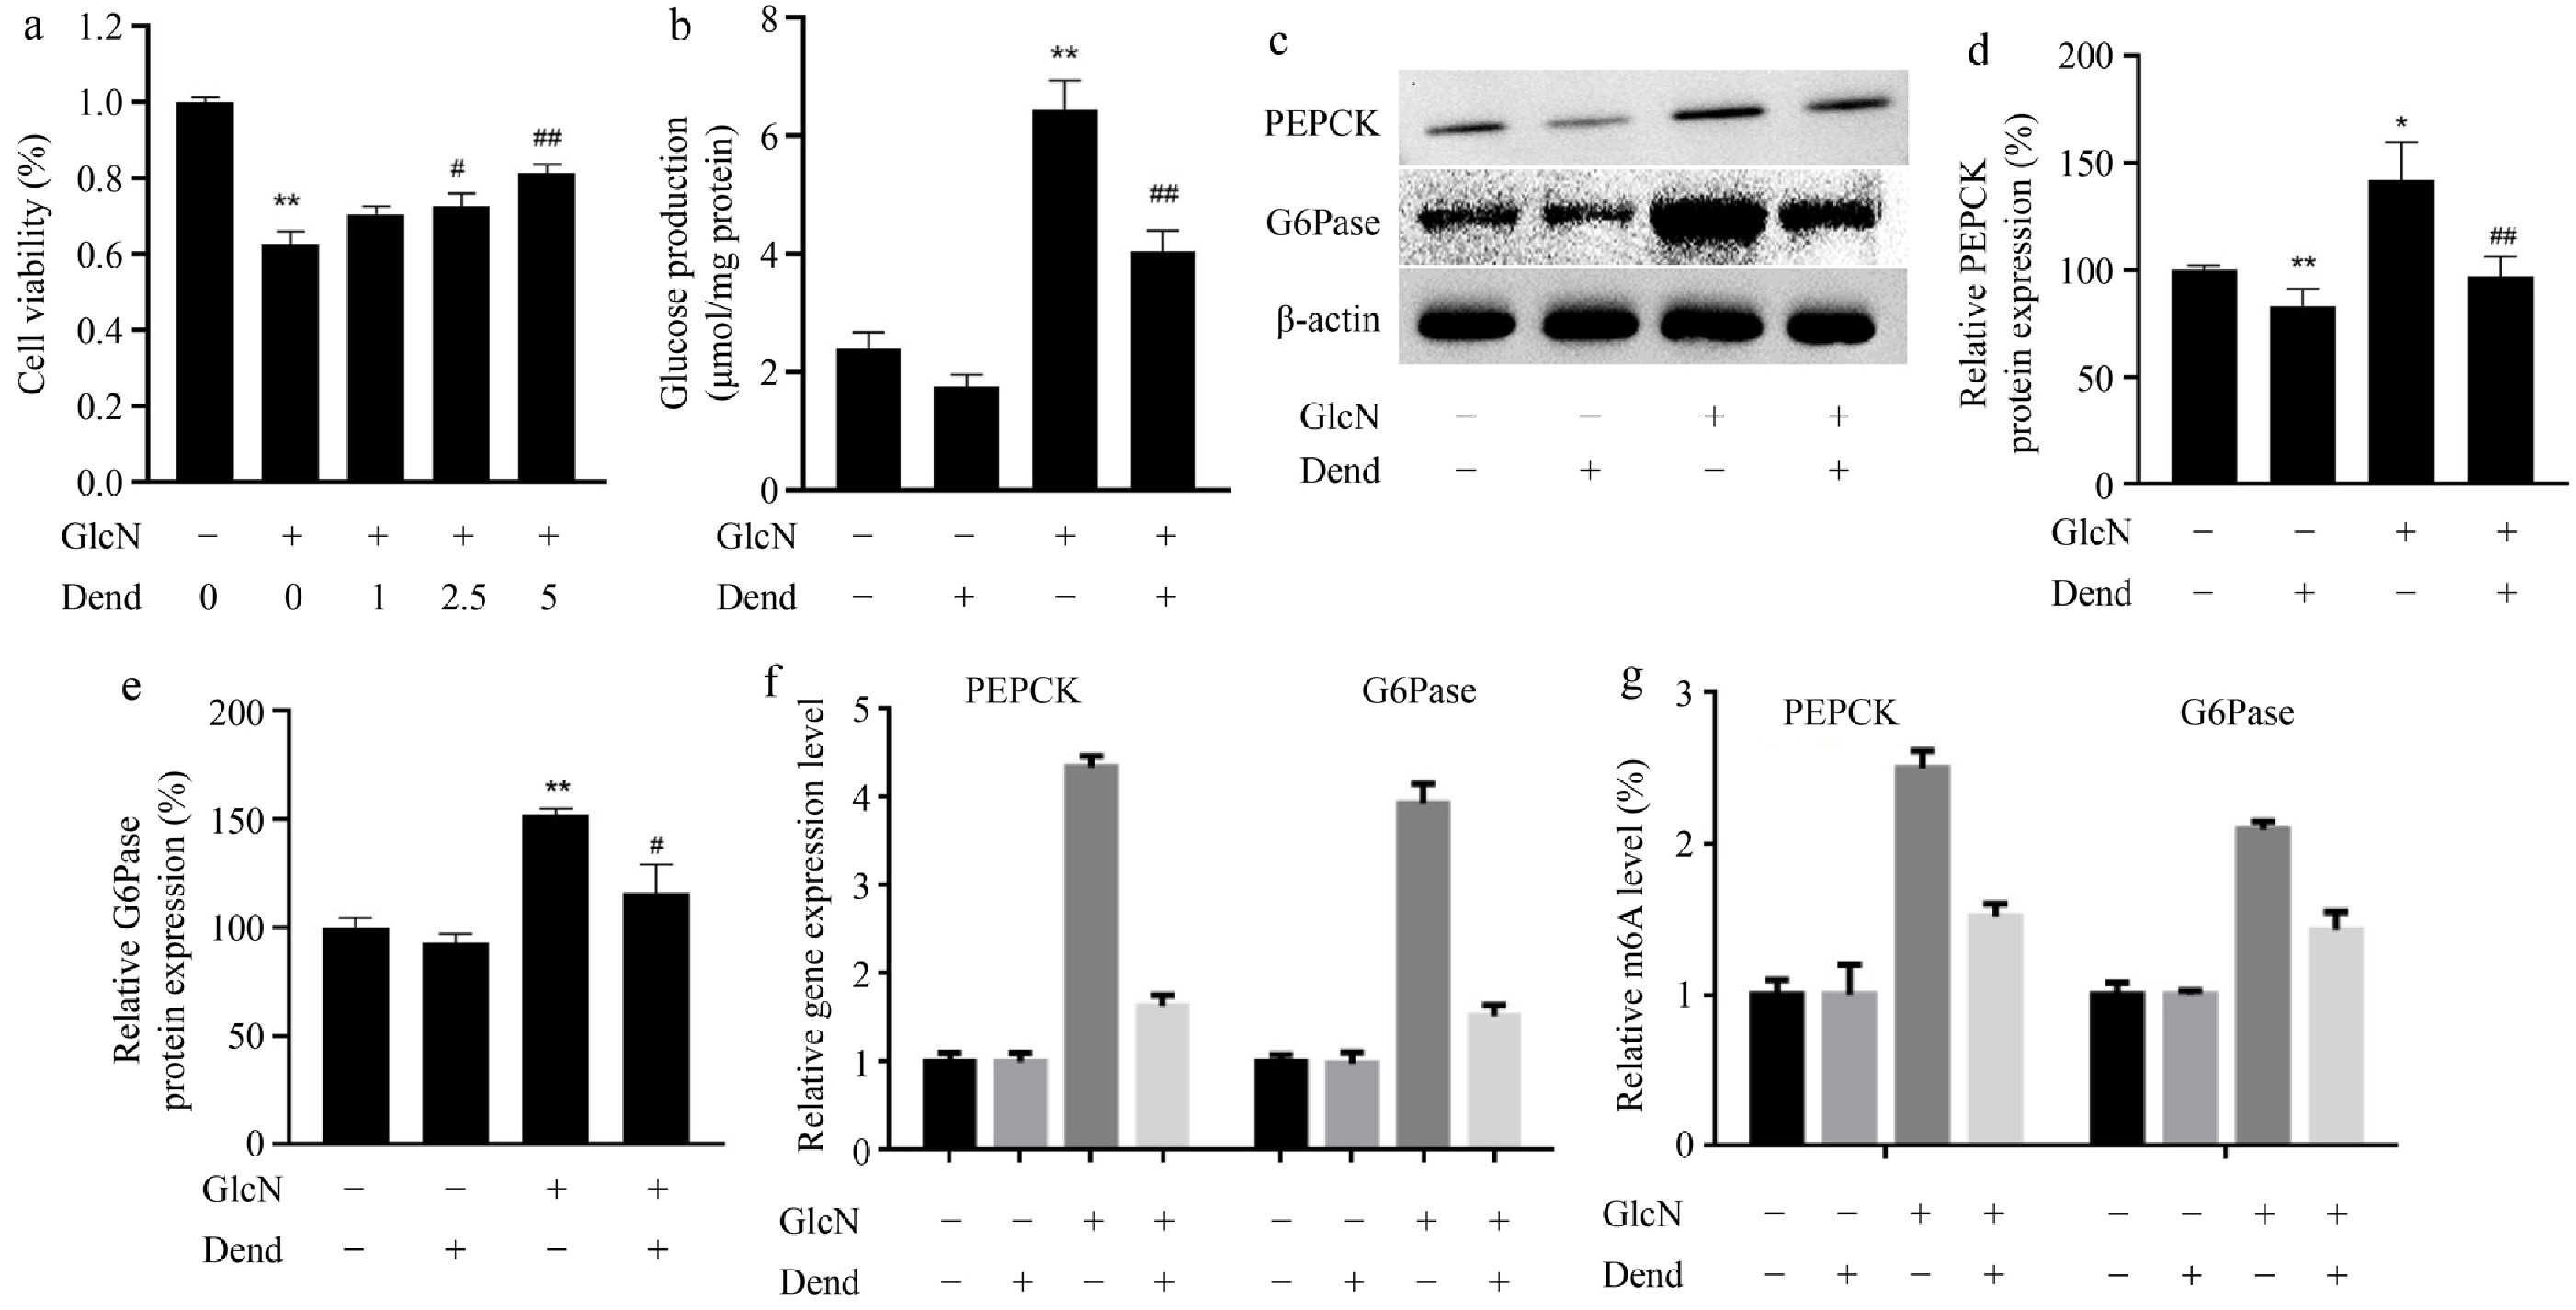
Figure 2.
Effects of dendrobine on glucose production and the key enzymes involved into gluconeogenesis in glucosamine-treated LO2 cells. (a) Viability of LO2 cells, treated with 0, 1, 2.5, and 5 μg·mL−1 dendrobine and 18 mM glucosamine; (b) glucose production of LO2 cells; (c) representative western blot images showing PEPCK and G6Pase; (d), (e) relative values of PEPCK and G6Pase proteins; (f) relative gene expression level; (g) relative values of RNA m6A levels. **, #, ## respectively indicate p < 0.01, p < 0.05, and p < 0.01, n = 3. GlcN: glucosamine; Dend: dendrobine.
-
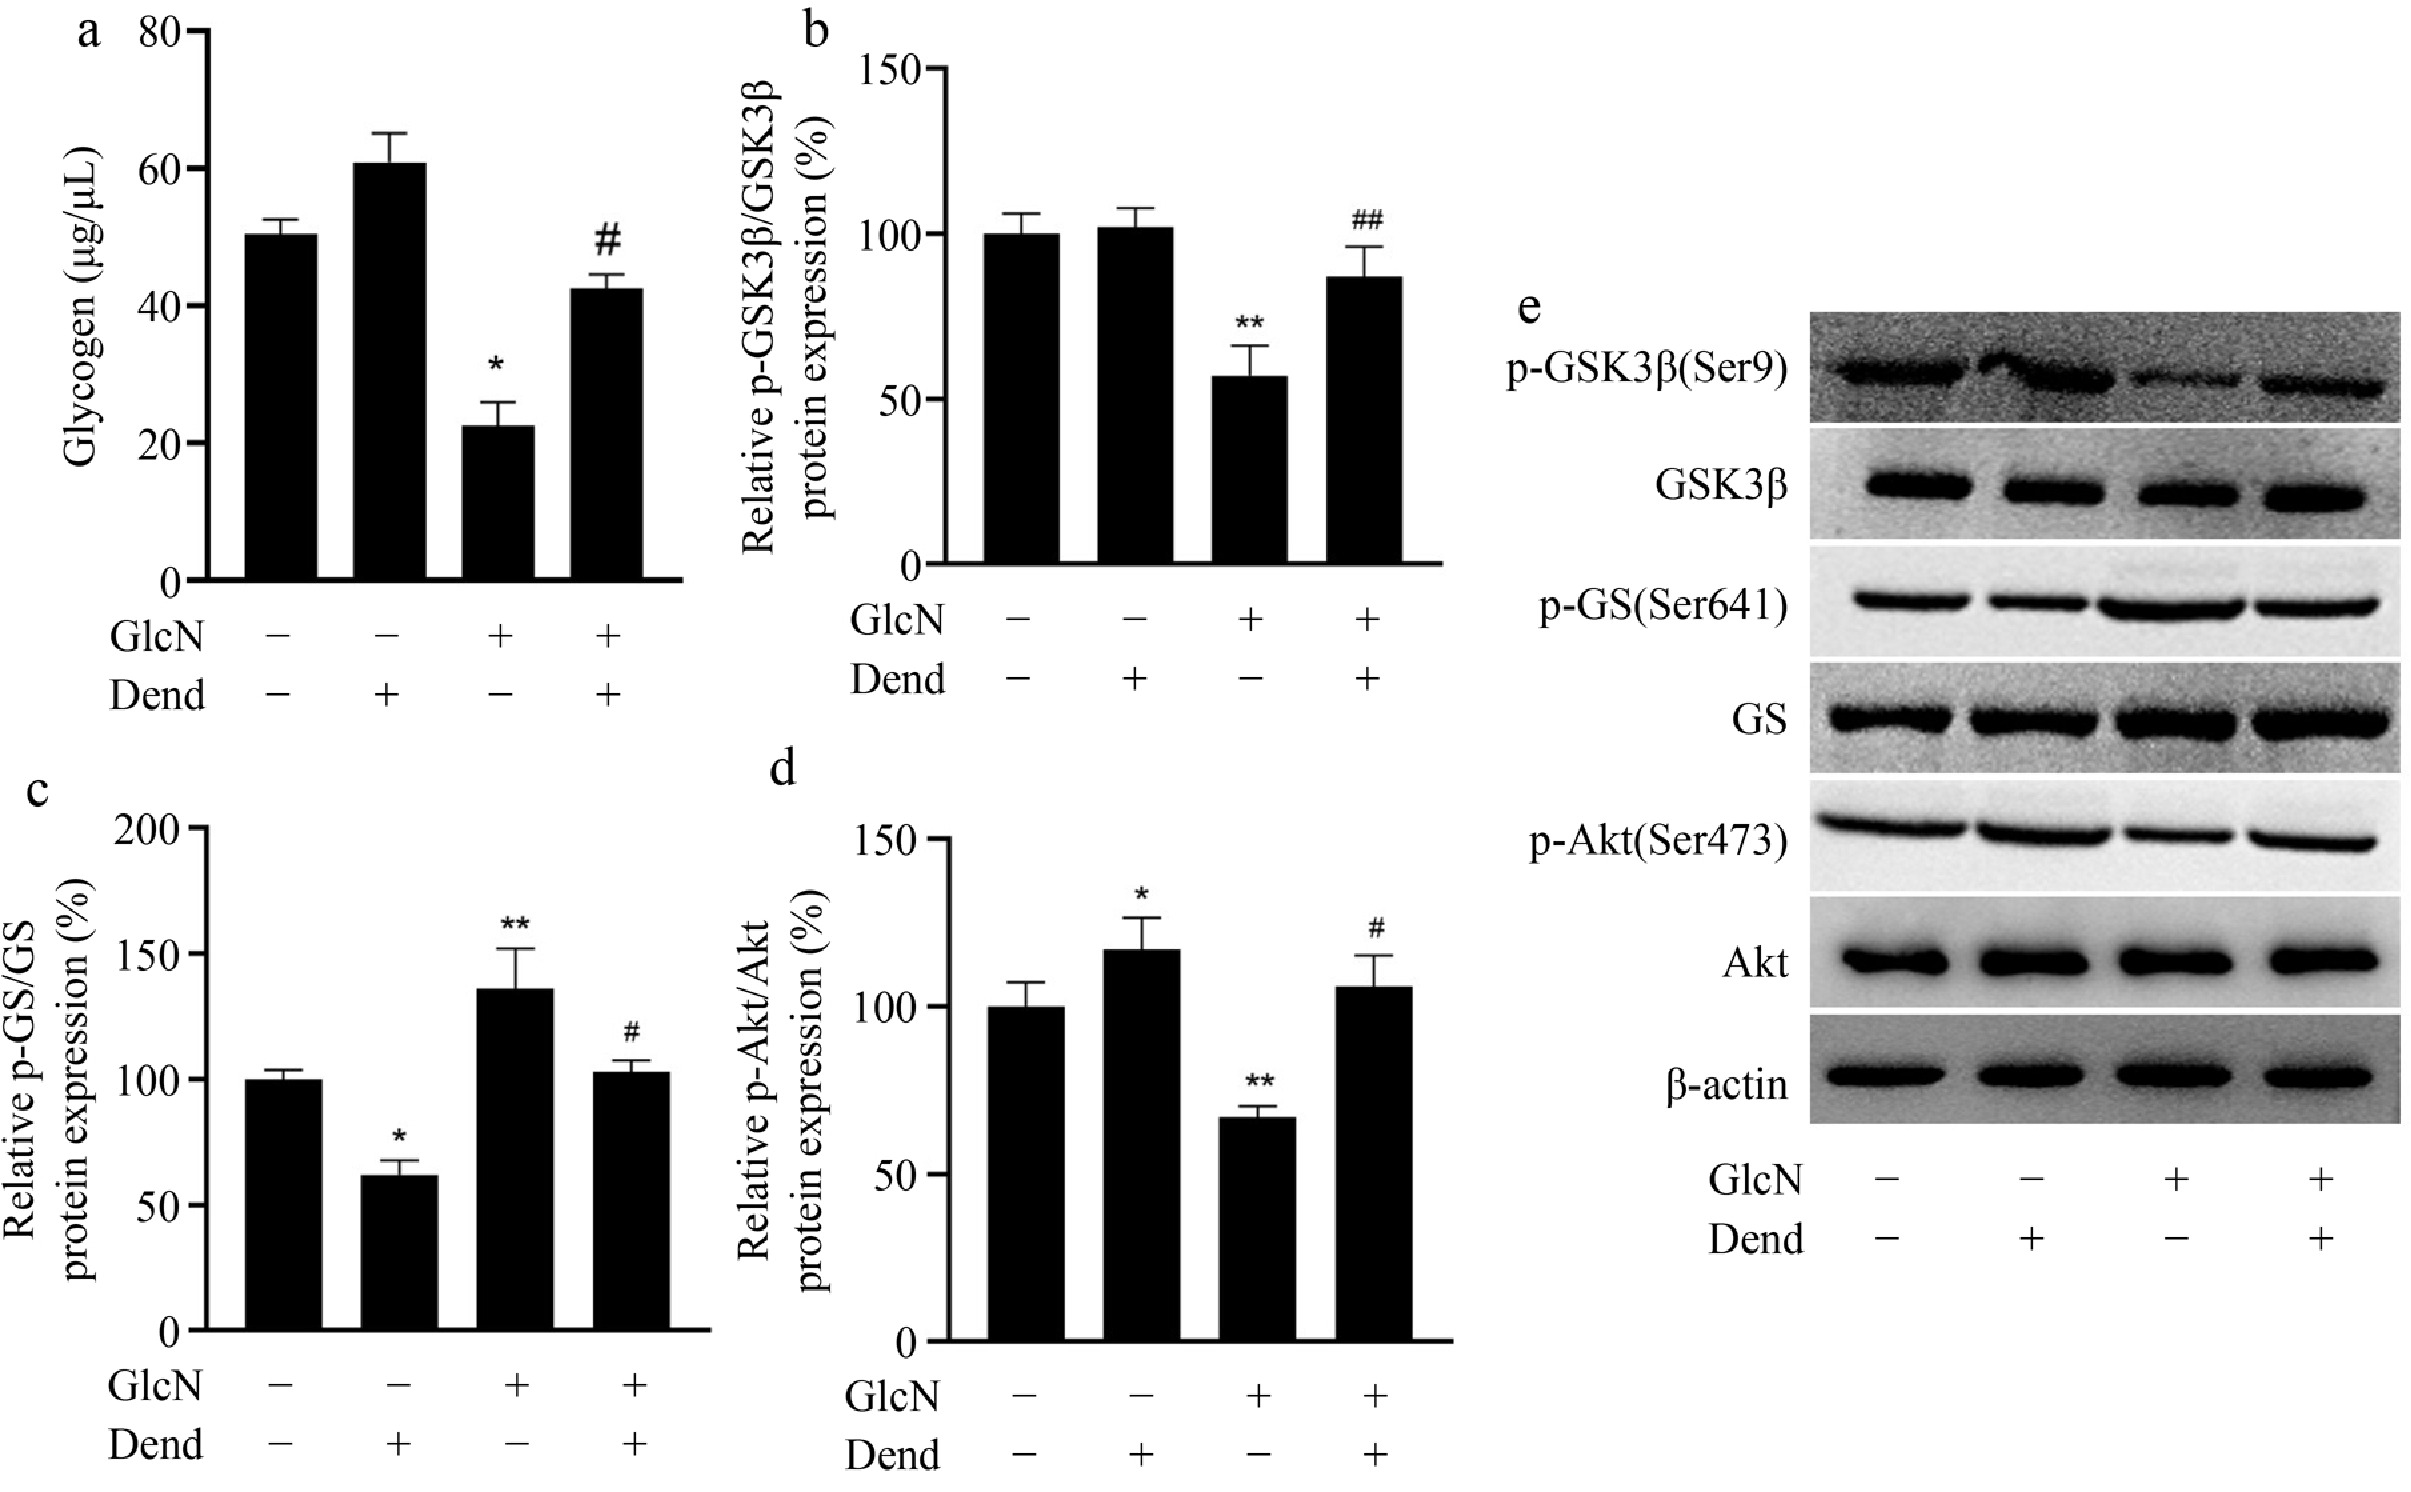
Figure 3.
Regulator function of dendrobine on glycogen content in glucosamine-treated LO2 cells. (a) Glycogen level; (b) phosphorylated GSK3; (c) phosphorylated GS; (d) phosphorylated AKT; (e) western blot image of GSK3, GS, and AKT proteins. **, #, ## respectively indicate p < 0.01, p < 0.05, and p < 0.01, n = 3. GlcN: glucosamine; Dend: dendrobine.
-
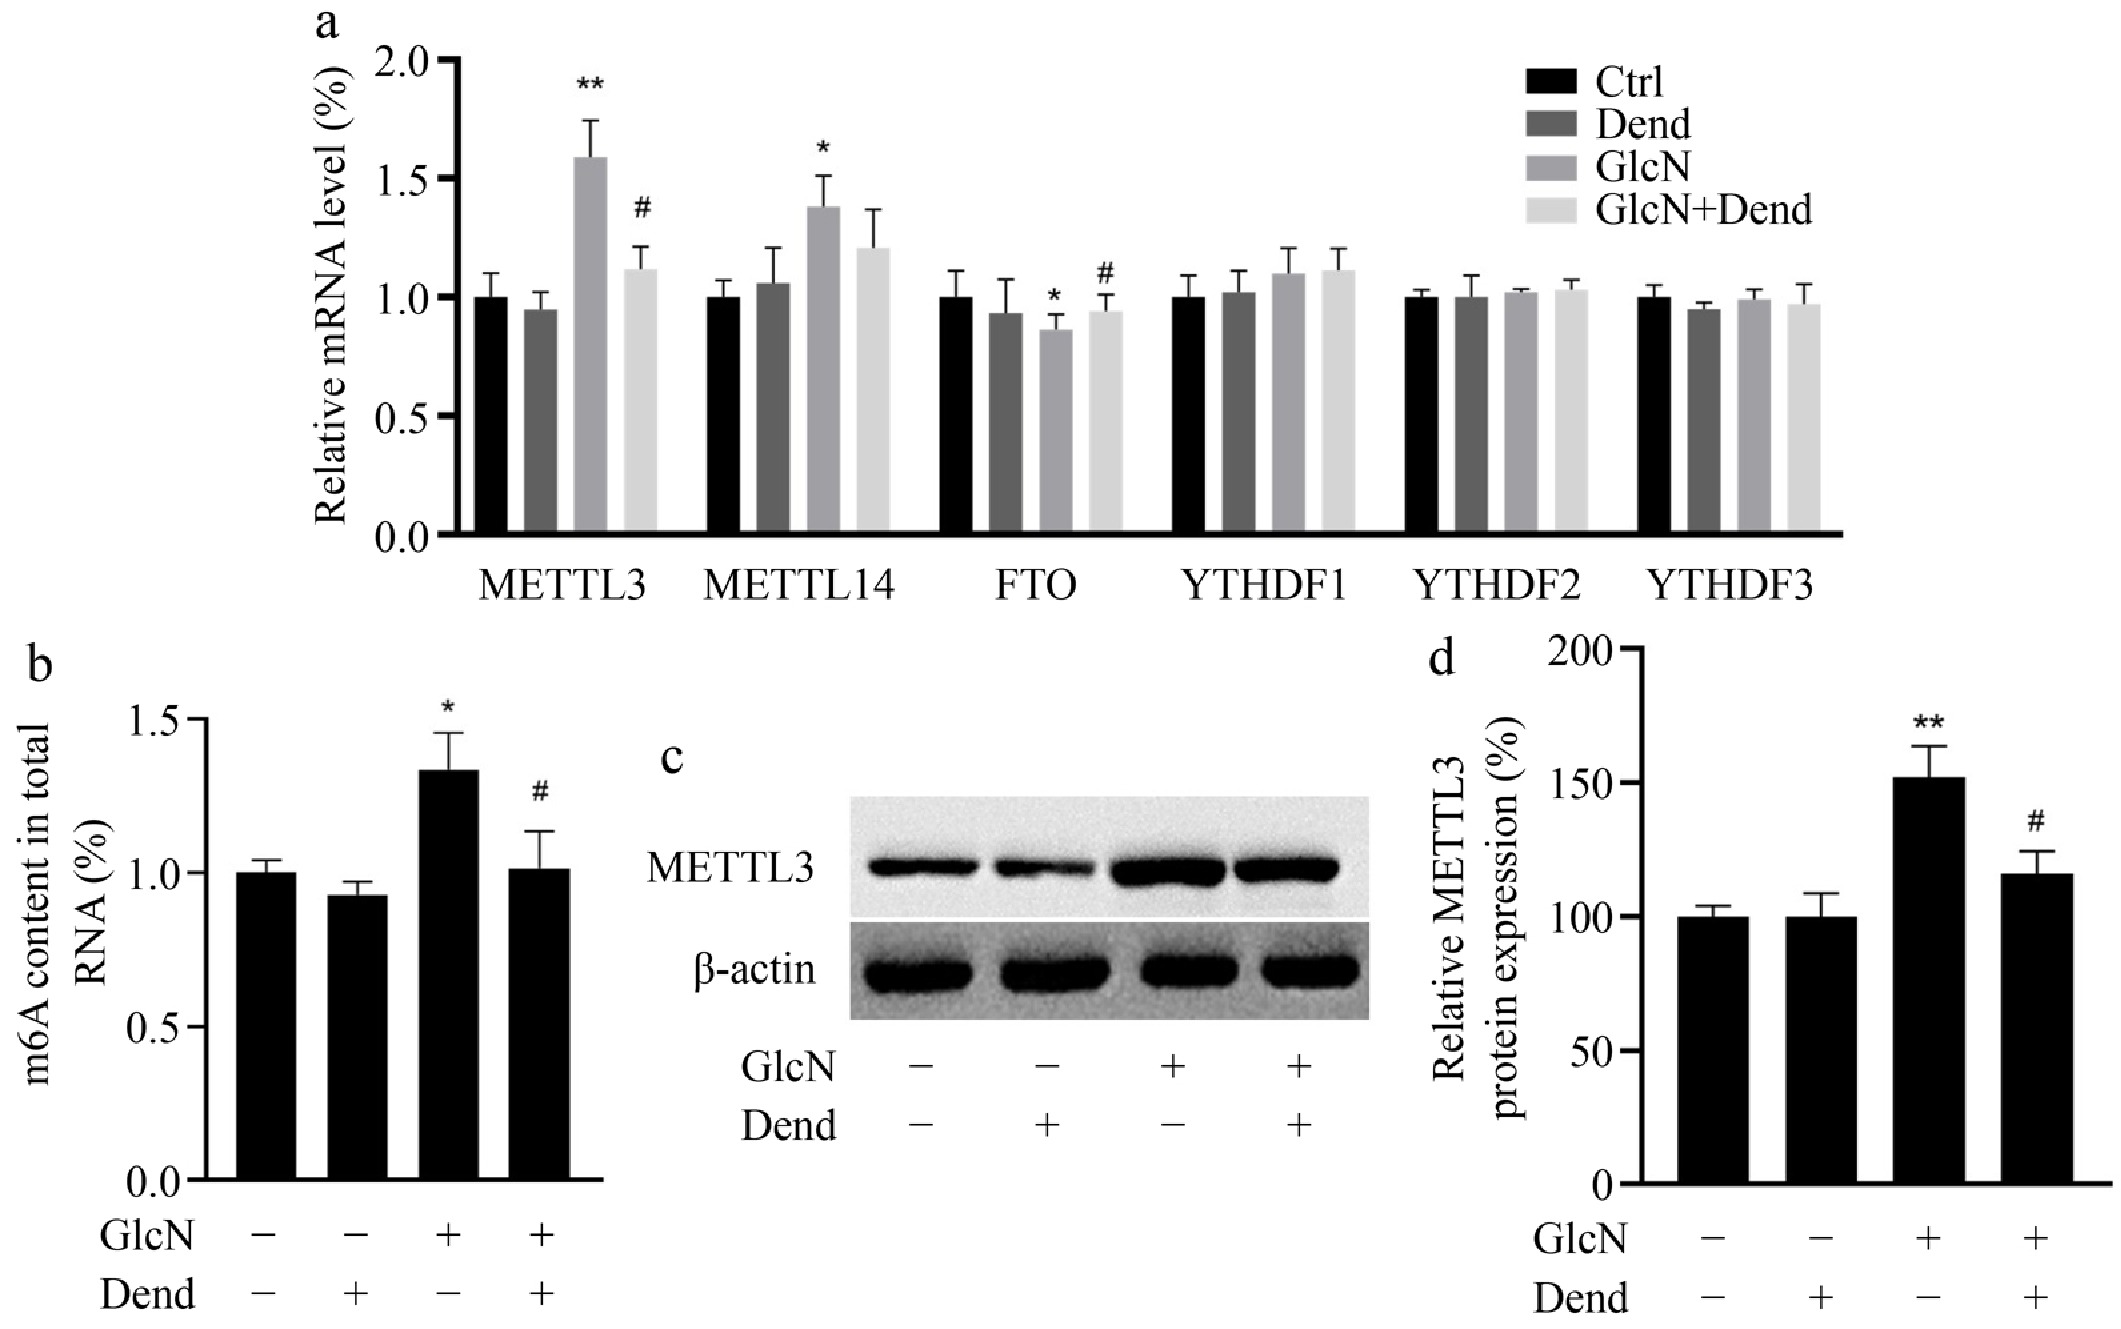
Figure 4.
Effect of dendrobine on the level of m6A modification and its methyltransferase METTL3 in glucosamine-treated LO2 cells. (a) relative level of critical methyltransferase (METTL3 and METTL14), demethylase (FTO), reading proteins (YTHDF1, YTHDF2, and YTHDF3); (b) Level of m6A methylation; (c) western blot image of METTL3; (d) relative value of METTL3 protein. **, #, ## respectively indicate p < 0.01, p < 0.05 and p < 0.01, n = 3. GlcN: glucosamine; Dend: dendrobine.
-
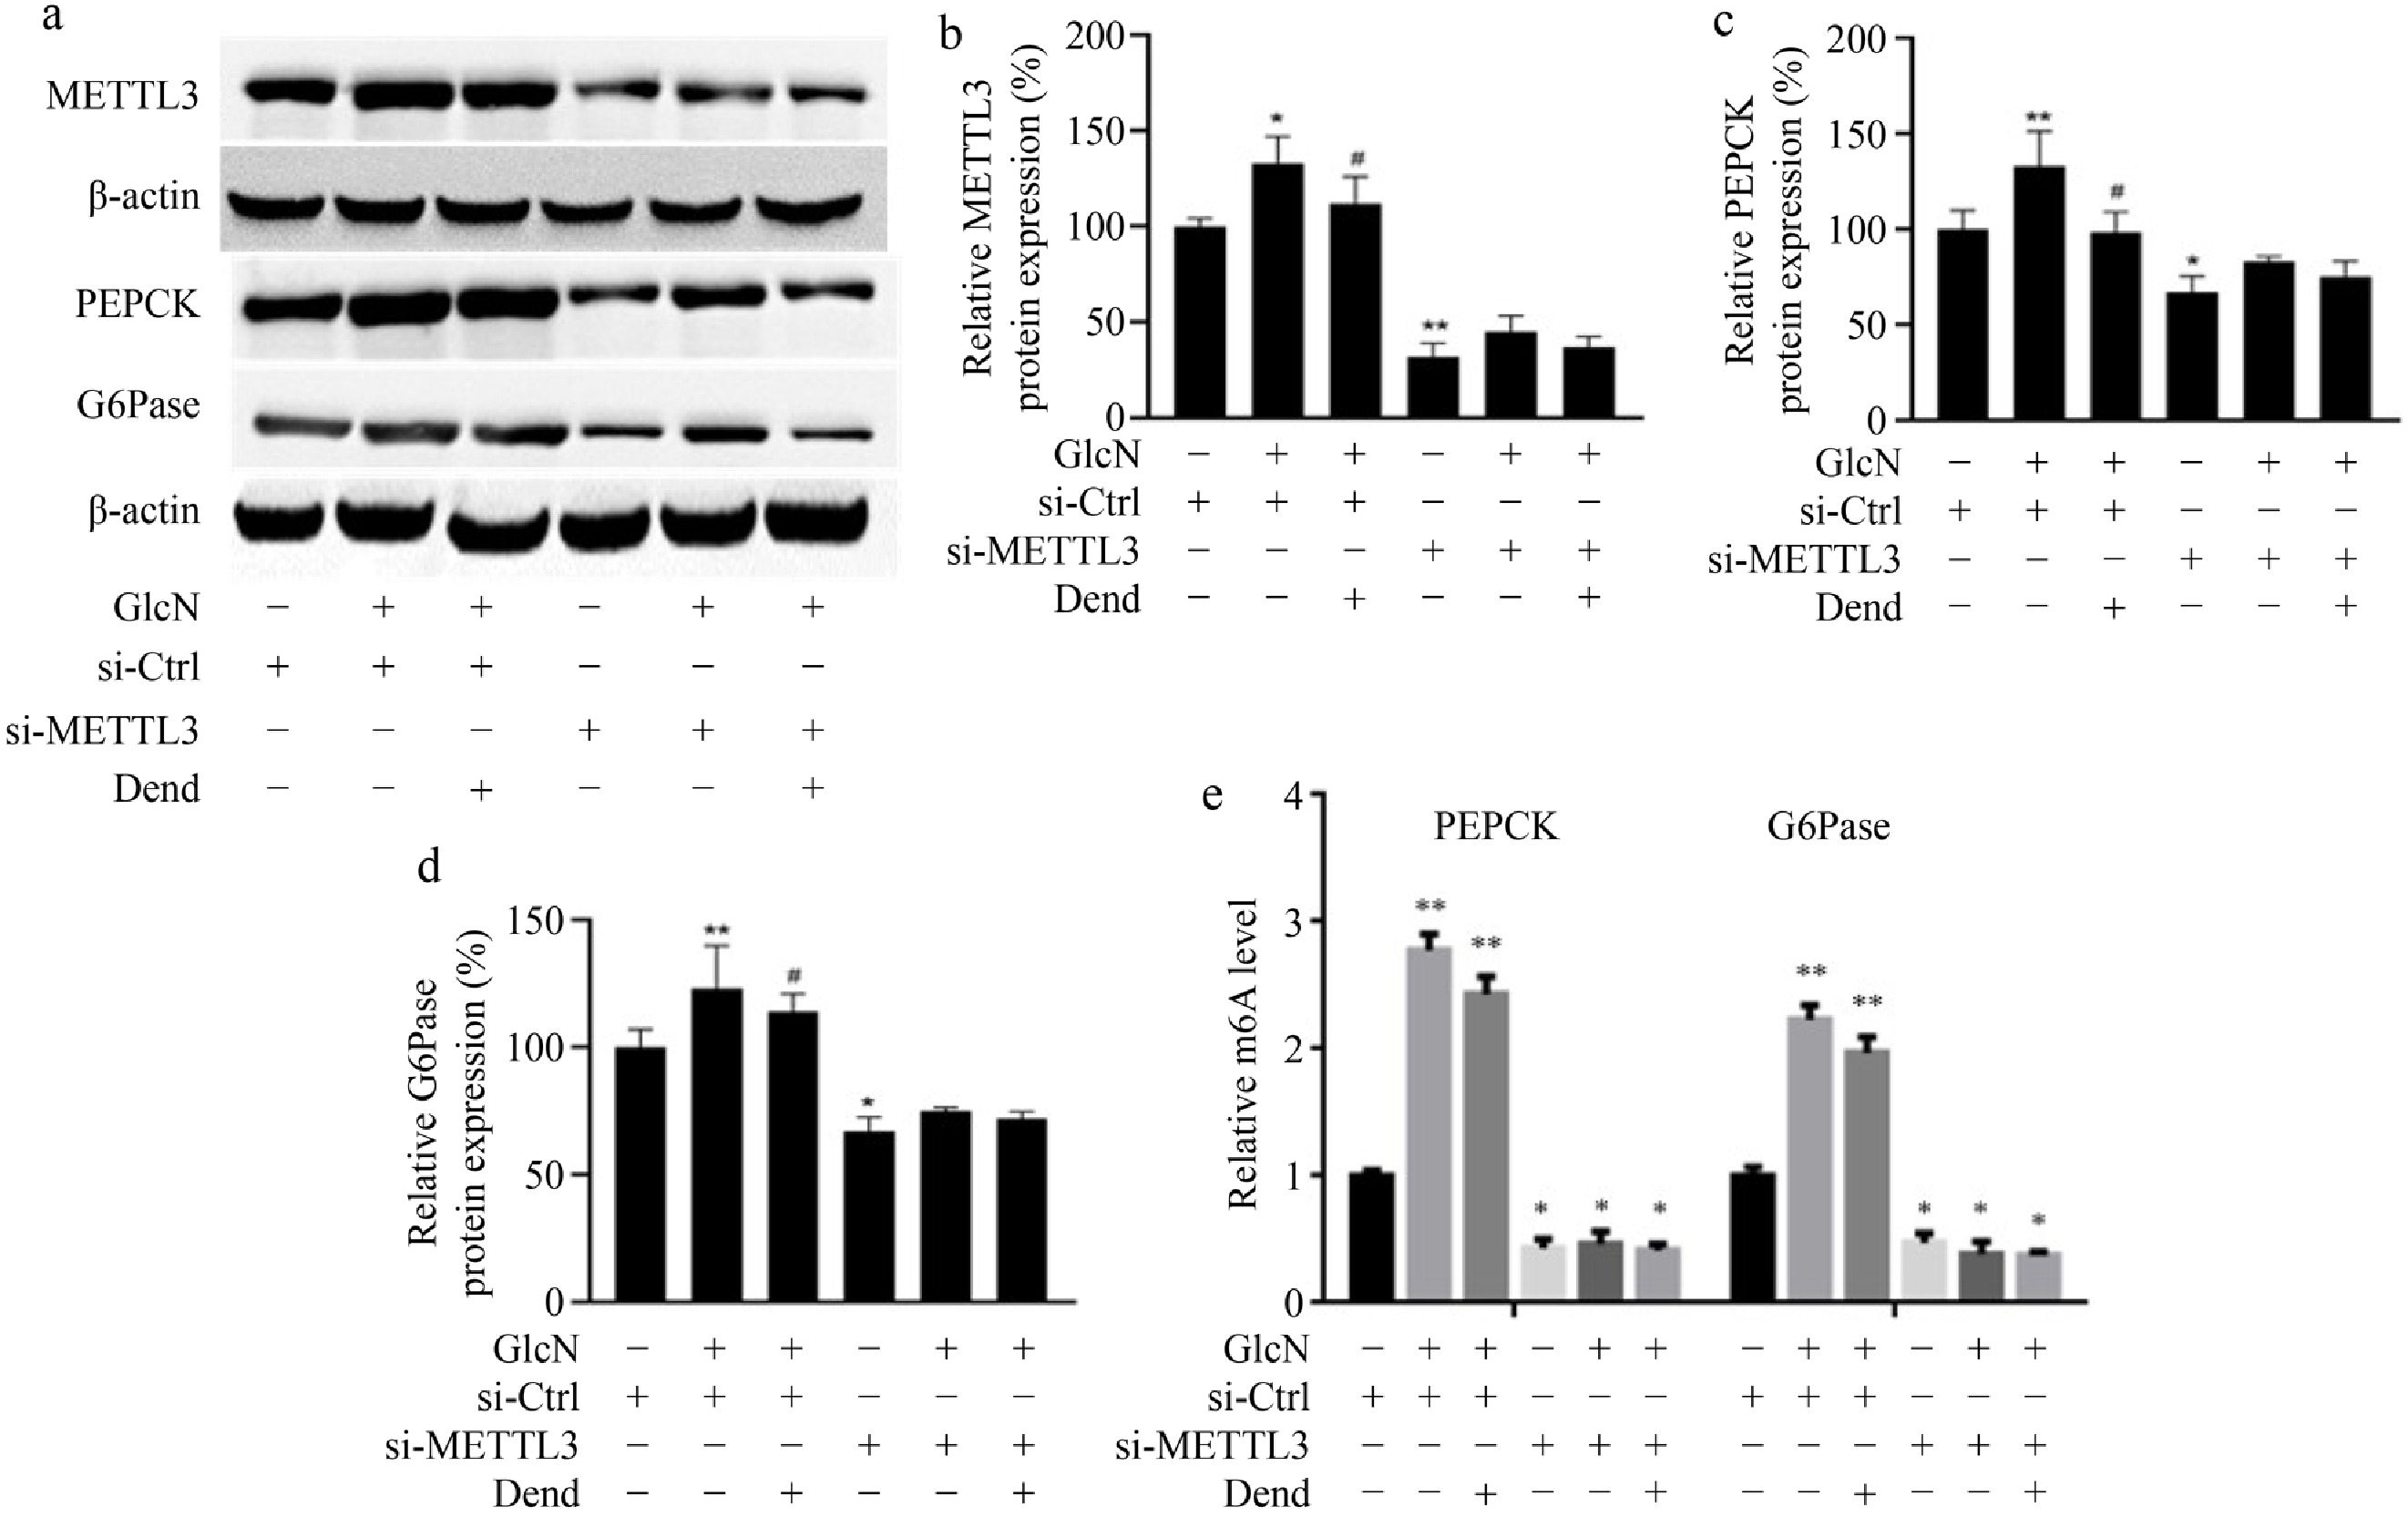
Figure 5.
Effects of downregulated-METTL3 and dendrobine on key enzymes involved into gluconeogenesis in glucosamine-treated LO2 cells. (a) Western blot image of METTL3 , PEPCK, and G6Pase; (b) relative values of METTL3 protein; (c) and (d) relative values of PEPCK and G6Pase proteins. (e) relative values of RNA m6A level. * p < 0.05, ** p < 0.01; # p < 0.05 vs GlcN and si-METTL3 group, n = 3. GlcN: glucosamine; Dend: dendrobine.
-
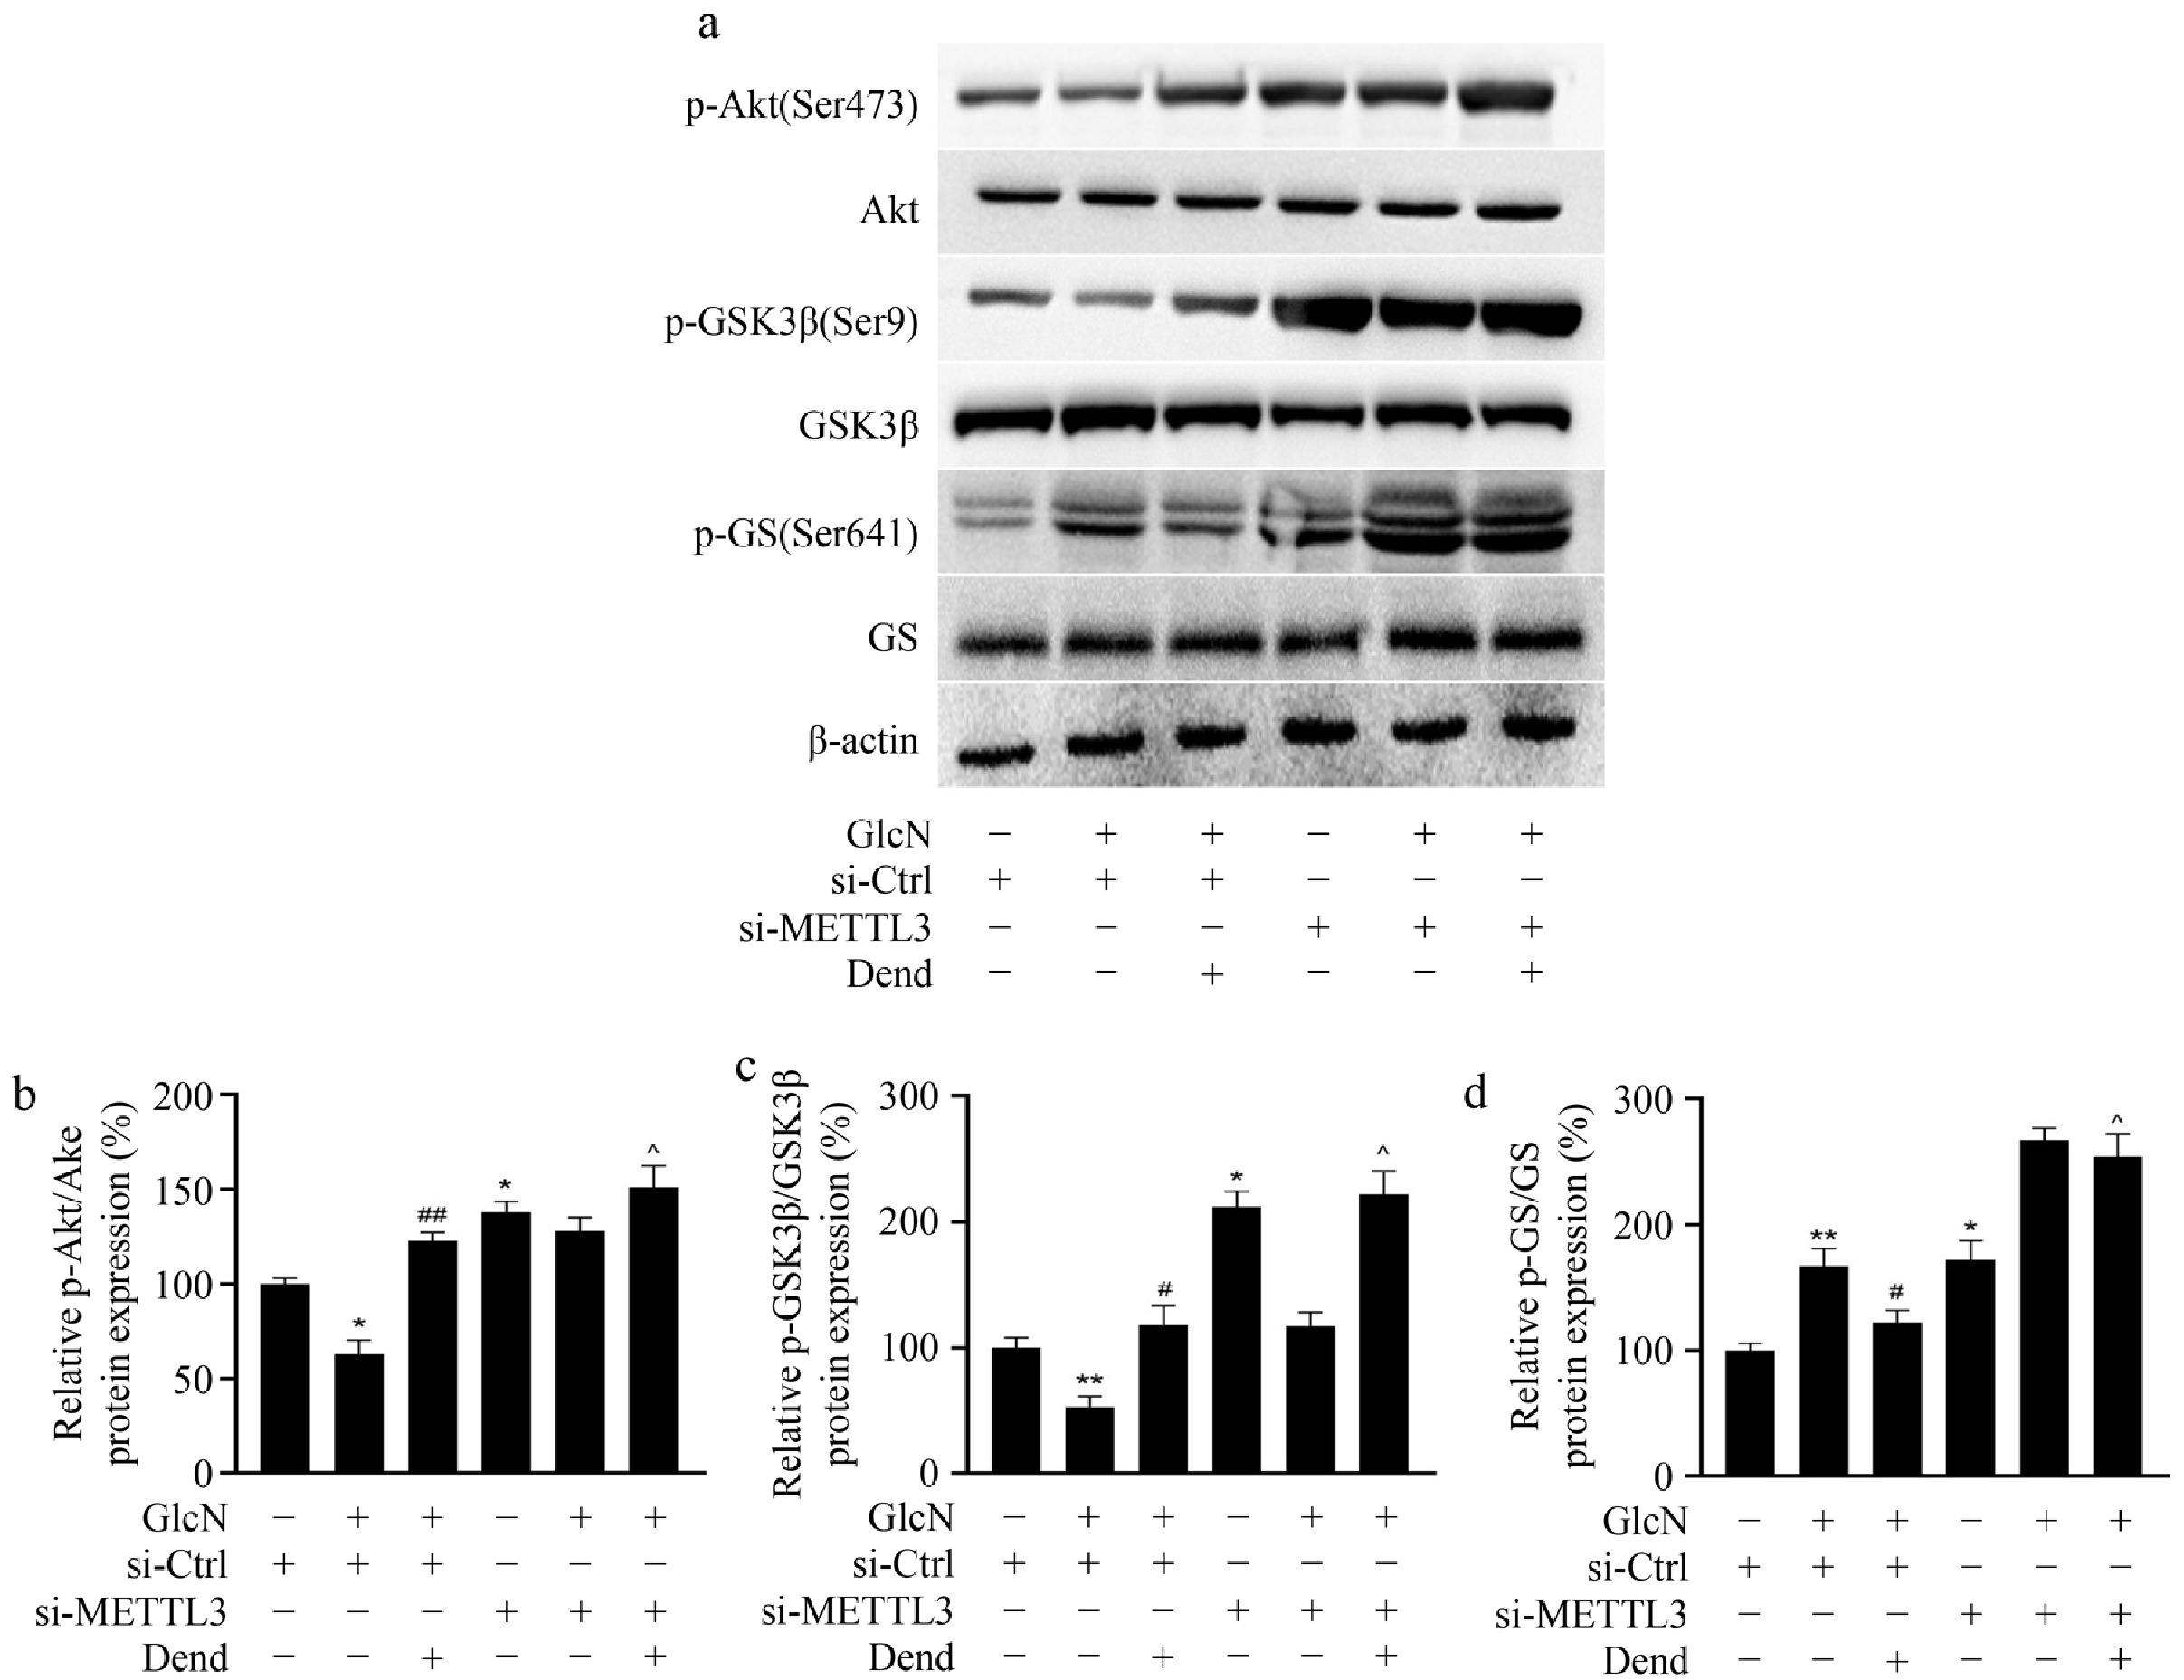
Figure 6.
Effects of downregulated-METTL3 and dendrobine on the key enzymes involved in glycogenesis in glucosamine-treated LO2 cells. (a) Level of GSK3, GS, and AKT proteins; (b)–(d) relative level of GSK3, GS, and AKT proteins. * p < 0.05, ** p < 0.01; # p < 0.05, ## p < 0.01; ^ p < 0.01, n = 3. GlcN: glucosamine; Dend: dendrobine.
Figures
(6)
Tables
(0)