-

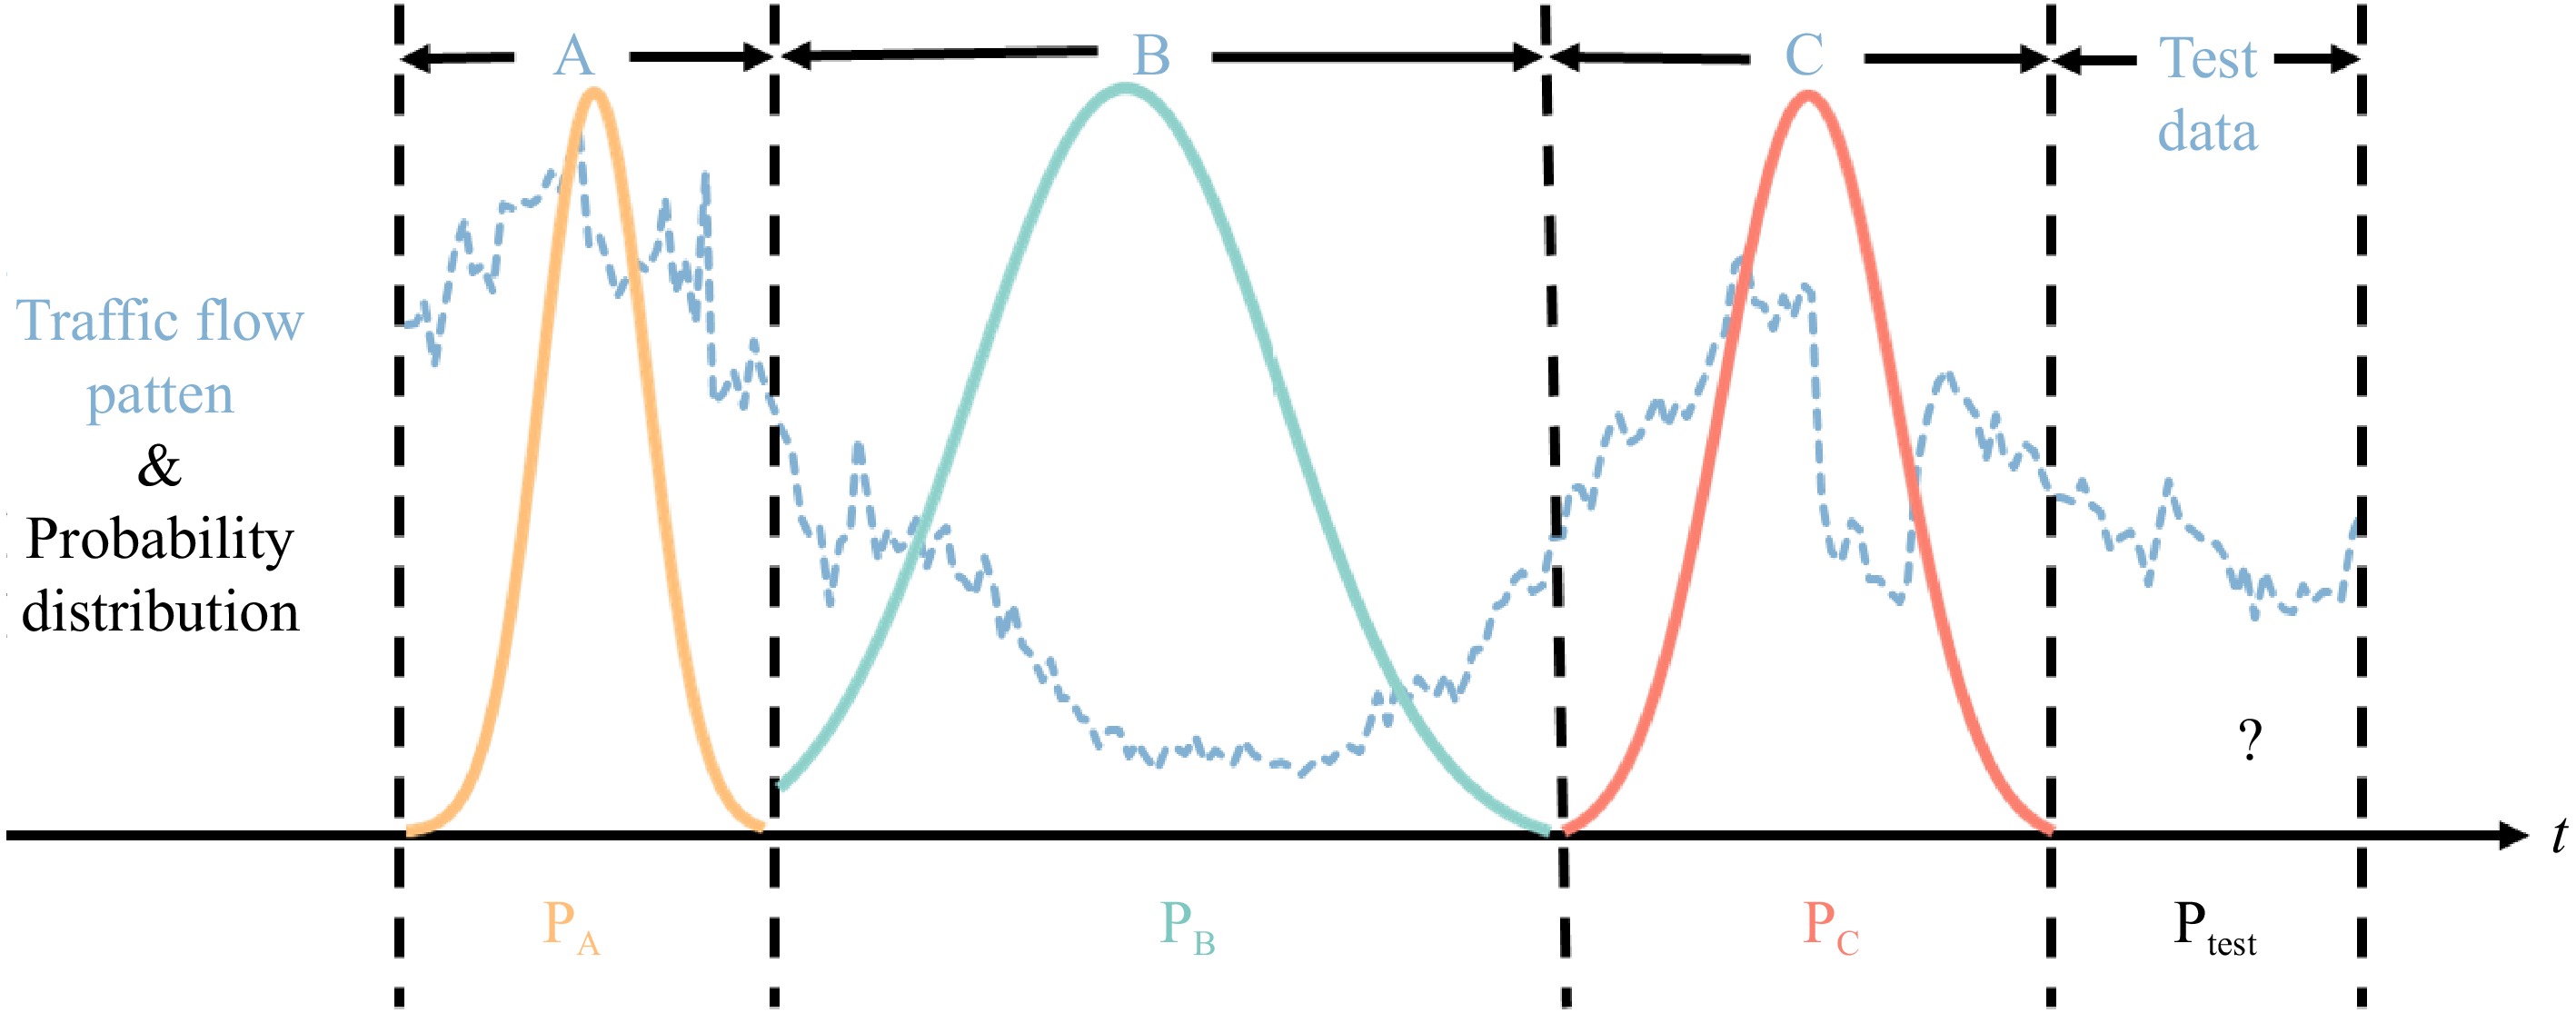
Figure 1.
The probability distribution of traffic flow patterns.
-

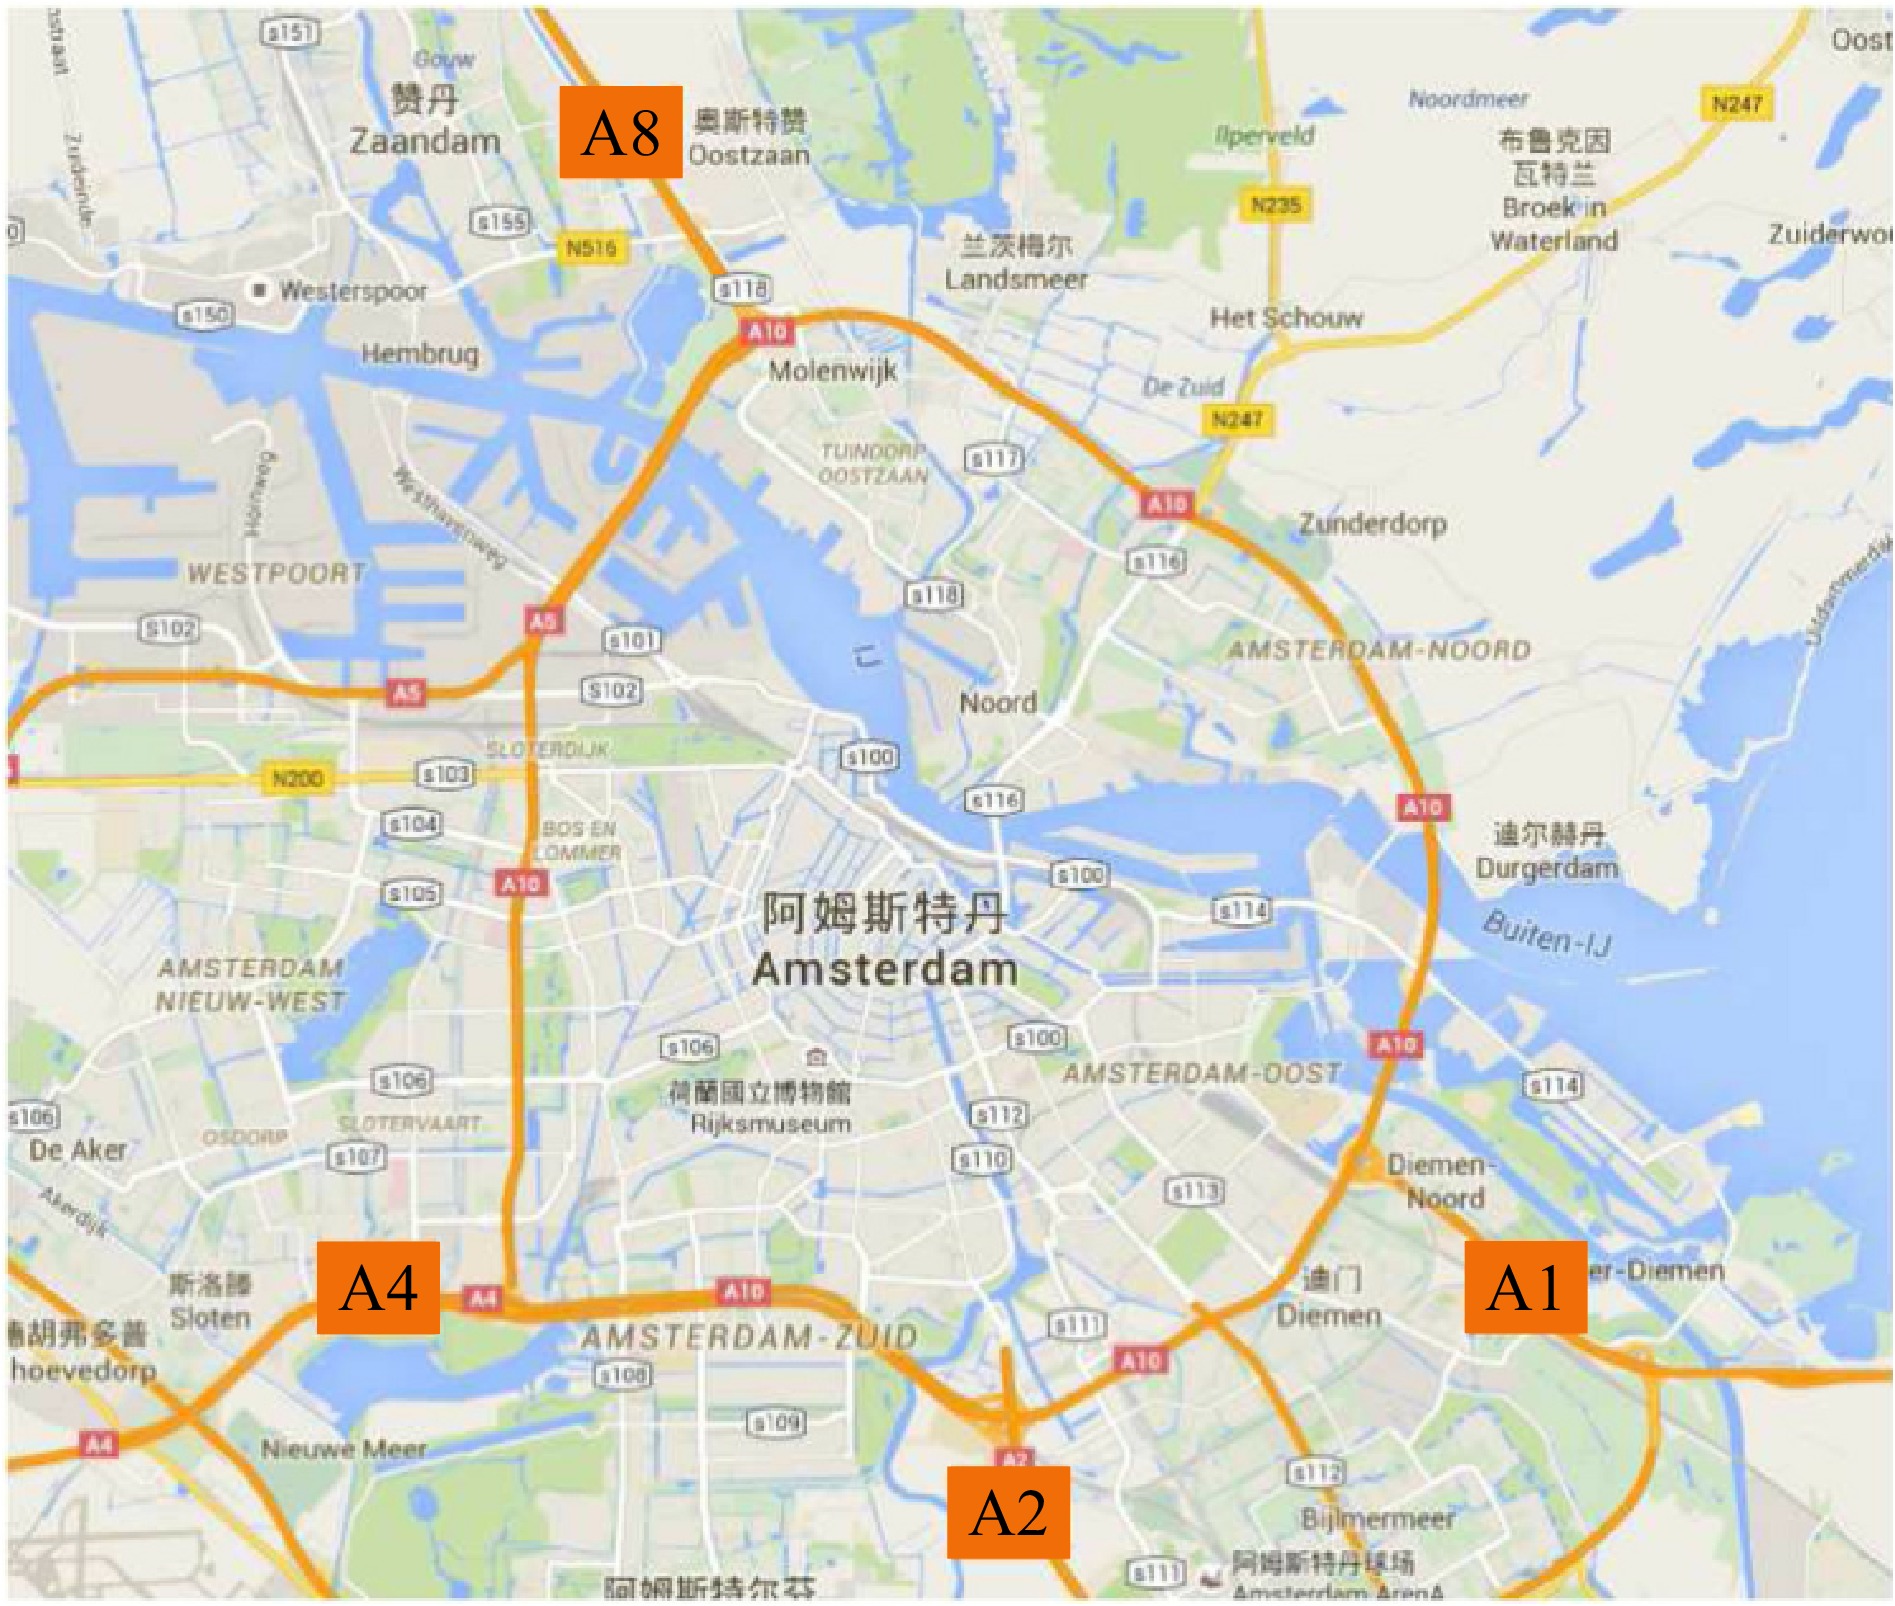
Figure 2.
The four motorways of Amsterdam.
-
Models Criterion A1 A2 A4 A8 HA RMSE (vehs/h) 404.84 348.96 357.85 218.72 MAPE (%) 16.87 15.53 16.72 16.24 KF RMSE (vehs/h) 332.03 239.87 250.51 187.48 MAPE (%) 12.46 10.72 12.62 12.63 ANN RMSE (vehs/h) 299.64 212.95 225.86 166.50 MAPE (%) 12.61 10.89 12.49 12.53 SAE RMSE (vehs/h) 295.43 209.32 226.91 167.01 MAPE (%) 11.92 10.23 11.87 12.03 GSA-ELM RMSE (vehs/h) 287.89 203.04 221.39 163.24 MAPE (%) 11.69 10.25 11.72 12.05 PSOGSA-ELM RMSE (vehs/h) 288.03 204.09 220.52 163.92 MAPE (%) 11.53 10.16 11.67 12.02 LSTM RMSE (vehs/h) 289.56 204.71 224.49 165.13 MAPE (%) 12.38 10.56 11.99 12.48 NiLSTM RMSE (vehs/h) 285.54 203.69 223.72 163.25 MAPE (%) 12.00 10.14 11.57 11.76 $ {\overline{\delta }}_{relax} $ RMSE (vehs/h) 280.54 195.28 220.08 161.69 MAPE (%) 11.48 10.02 11.51 11.54 Table 1.
The comparison of the
$ {\overline{\delta }}_{relax} $ -
Hyperparameter value Value Hidden layers 1 Hidden units 256 Batch size 32 Input length 12 Epochs 200 Table 2.
The hyperparameters for the LSTM, NiLSTM, and
$ {\overline{\delta }}_{relax} $ -
Dataset λ1 λ2 δ1 δ2 c1 c2 A1 0.6 0.4 0.3 10 0 −1 A2 0.8 0.2 30 0.3 5 0 A4 1 0 0.7 30 0 −0.5 A8 0.6 0.4 0.3 15 0 −1 Table 3.
The parameter settings of
$ \mathcal{L} $ $ {\overline{\delta }}_{relax} $
Figures
(2)
Tables
(3)