-
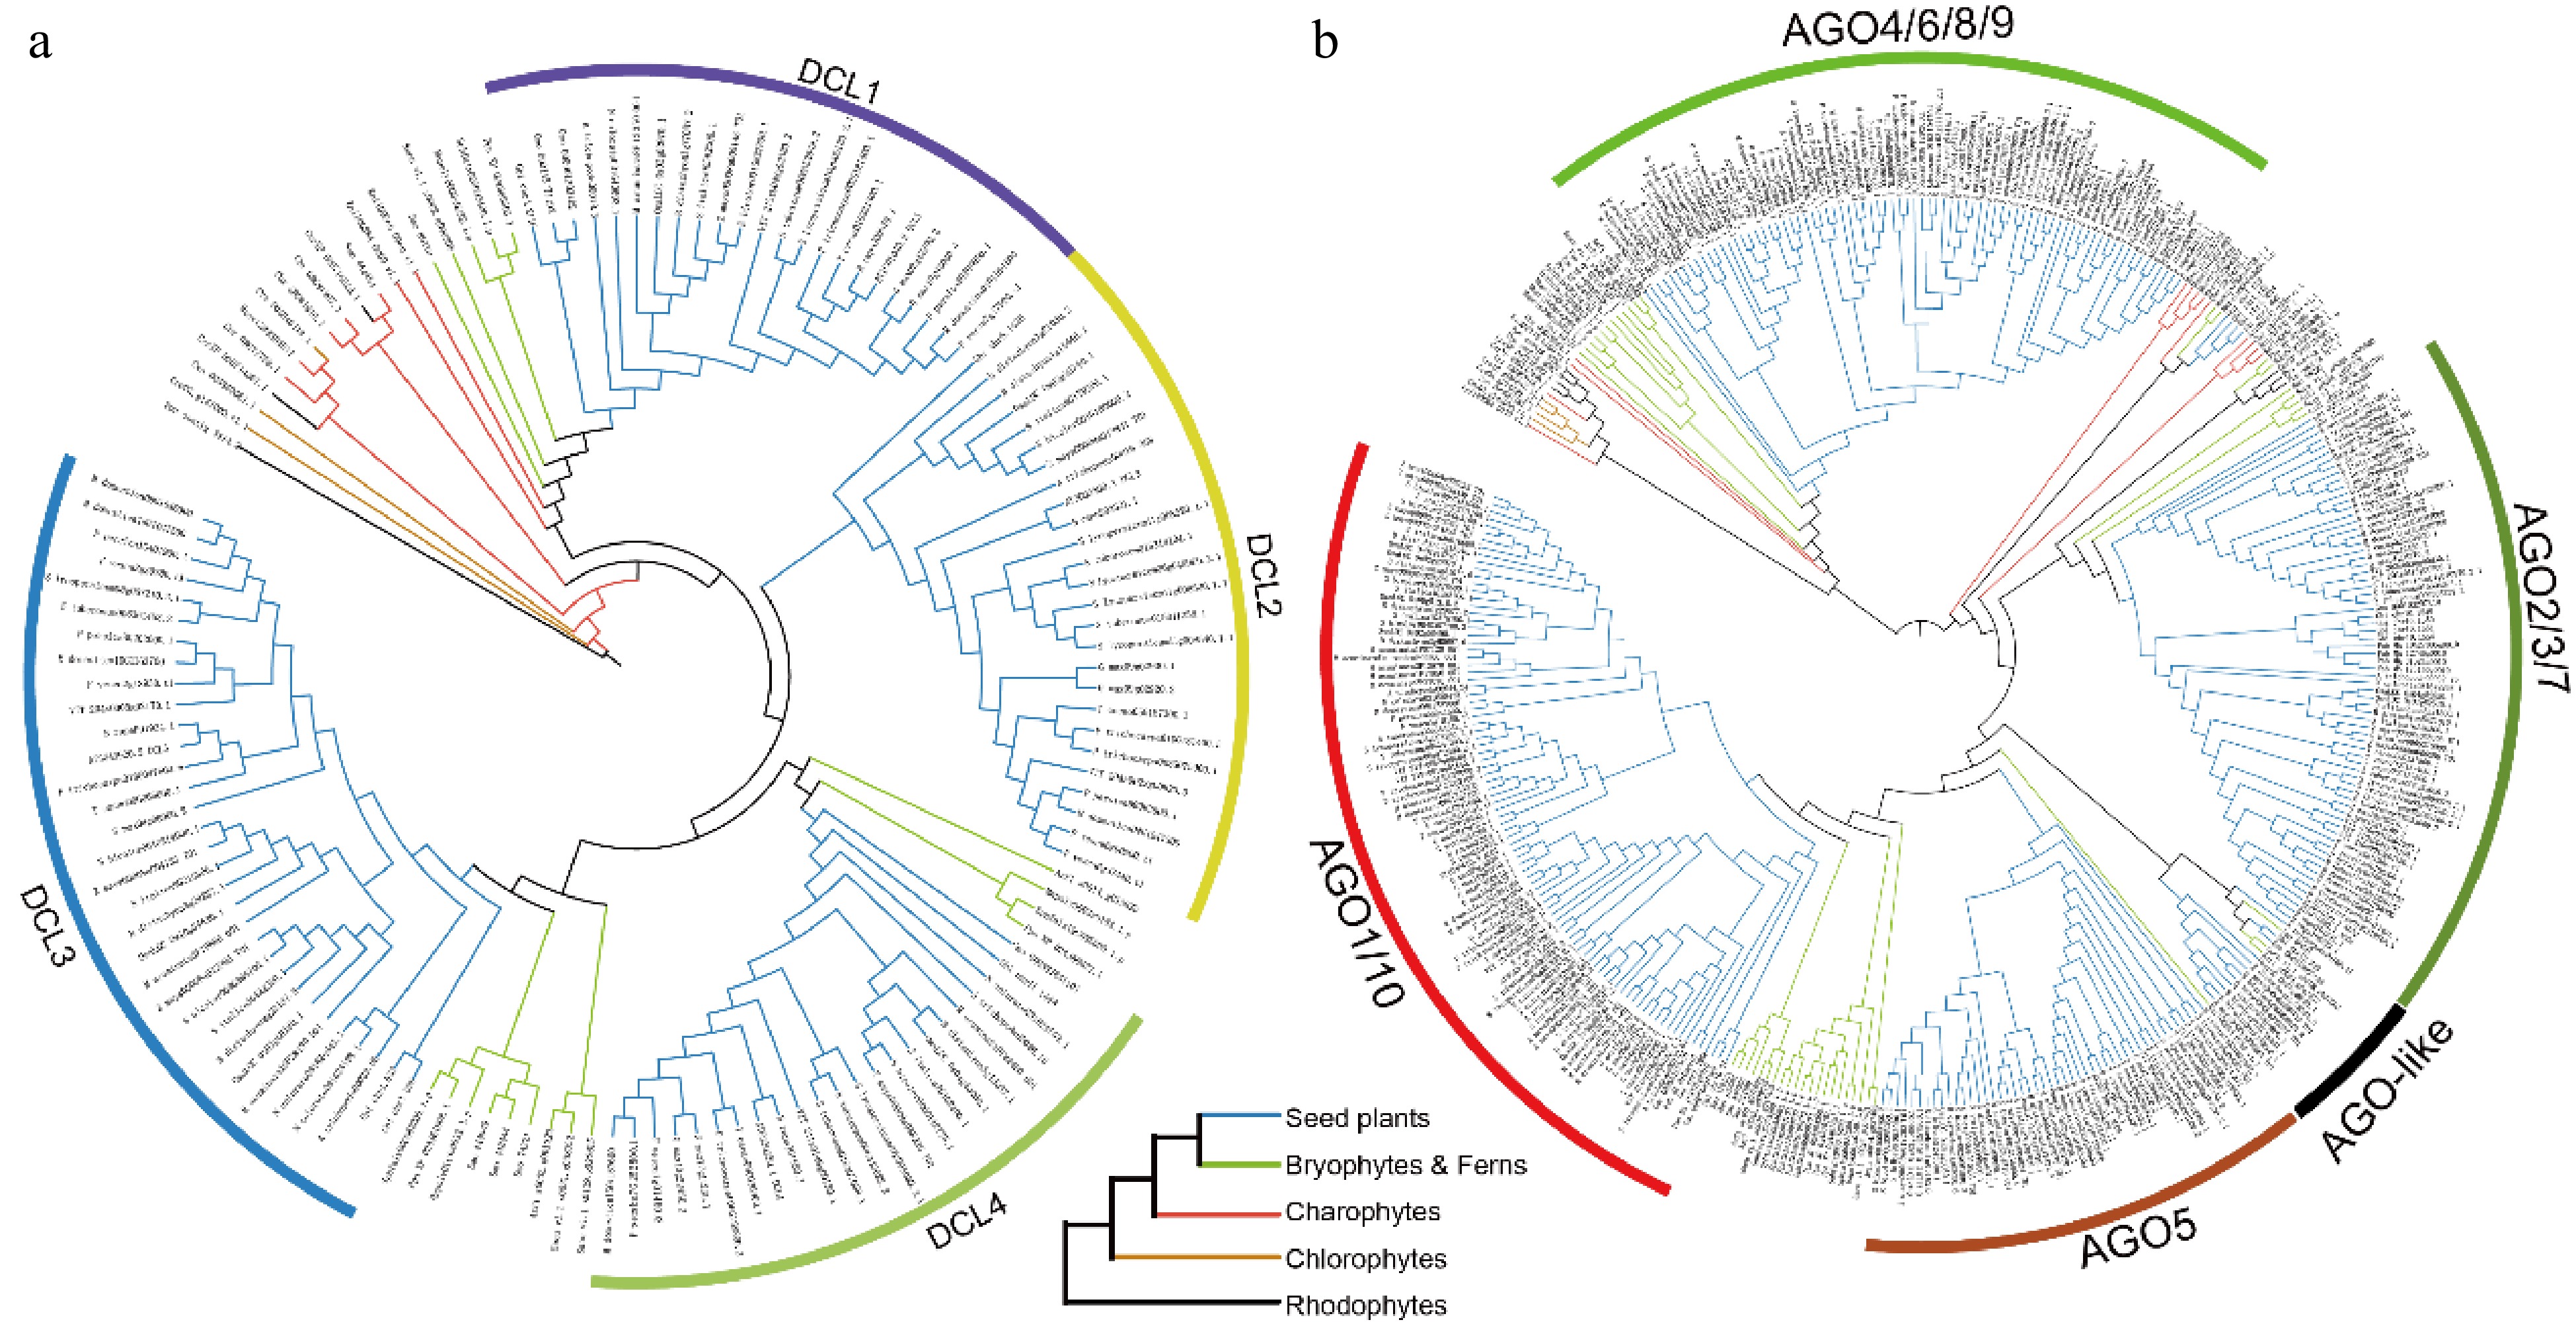
Figure 1.
Phylogenetic trees of the (a) DCL, and (b) AGO gene families across 36 plant species. Branches are color-coded to denote different plant groups: black for rhodophytes, yellow for chlorophytes, red for charophytes, green for ferns and bryophytes, and blue for seed plants.
-
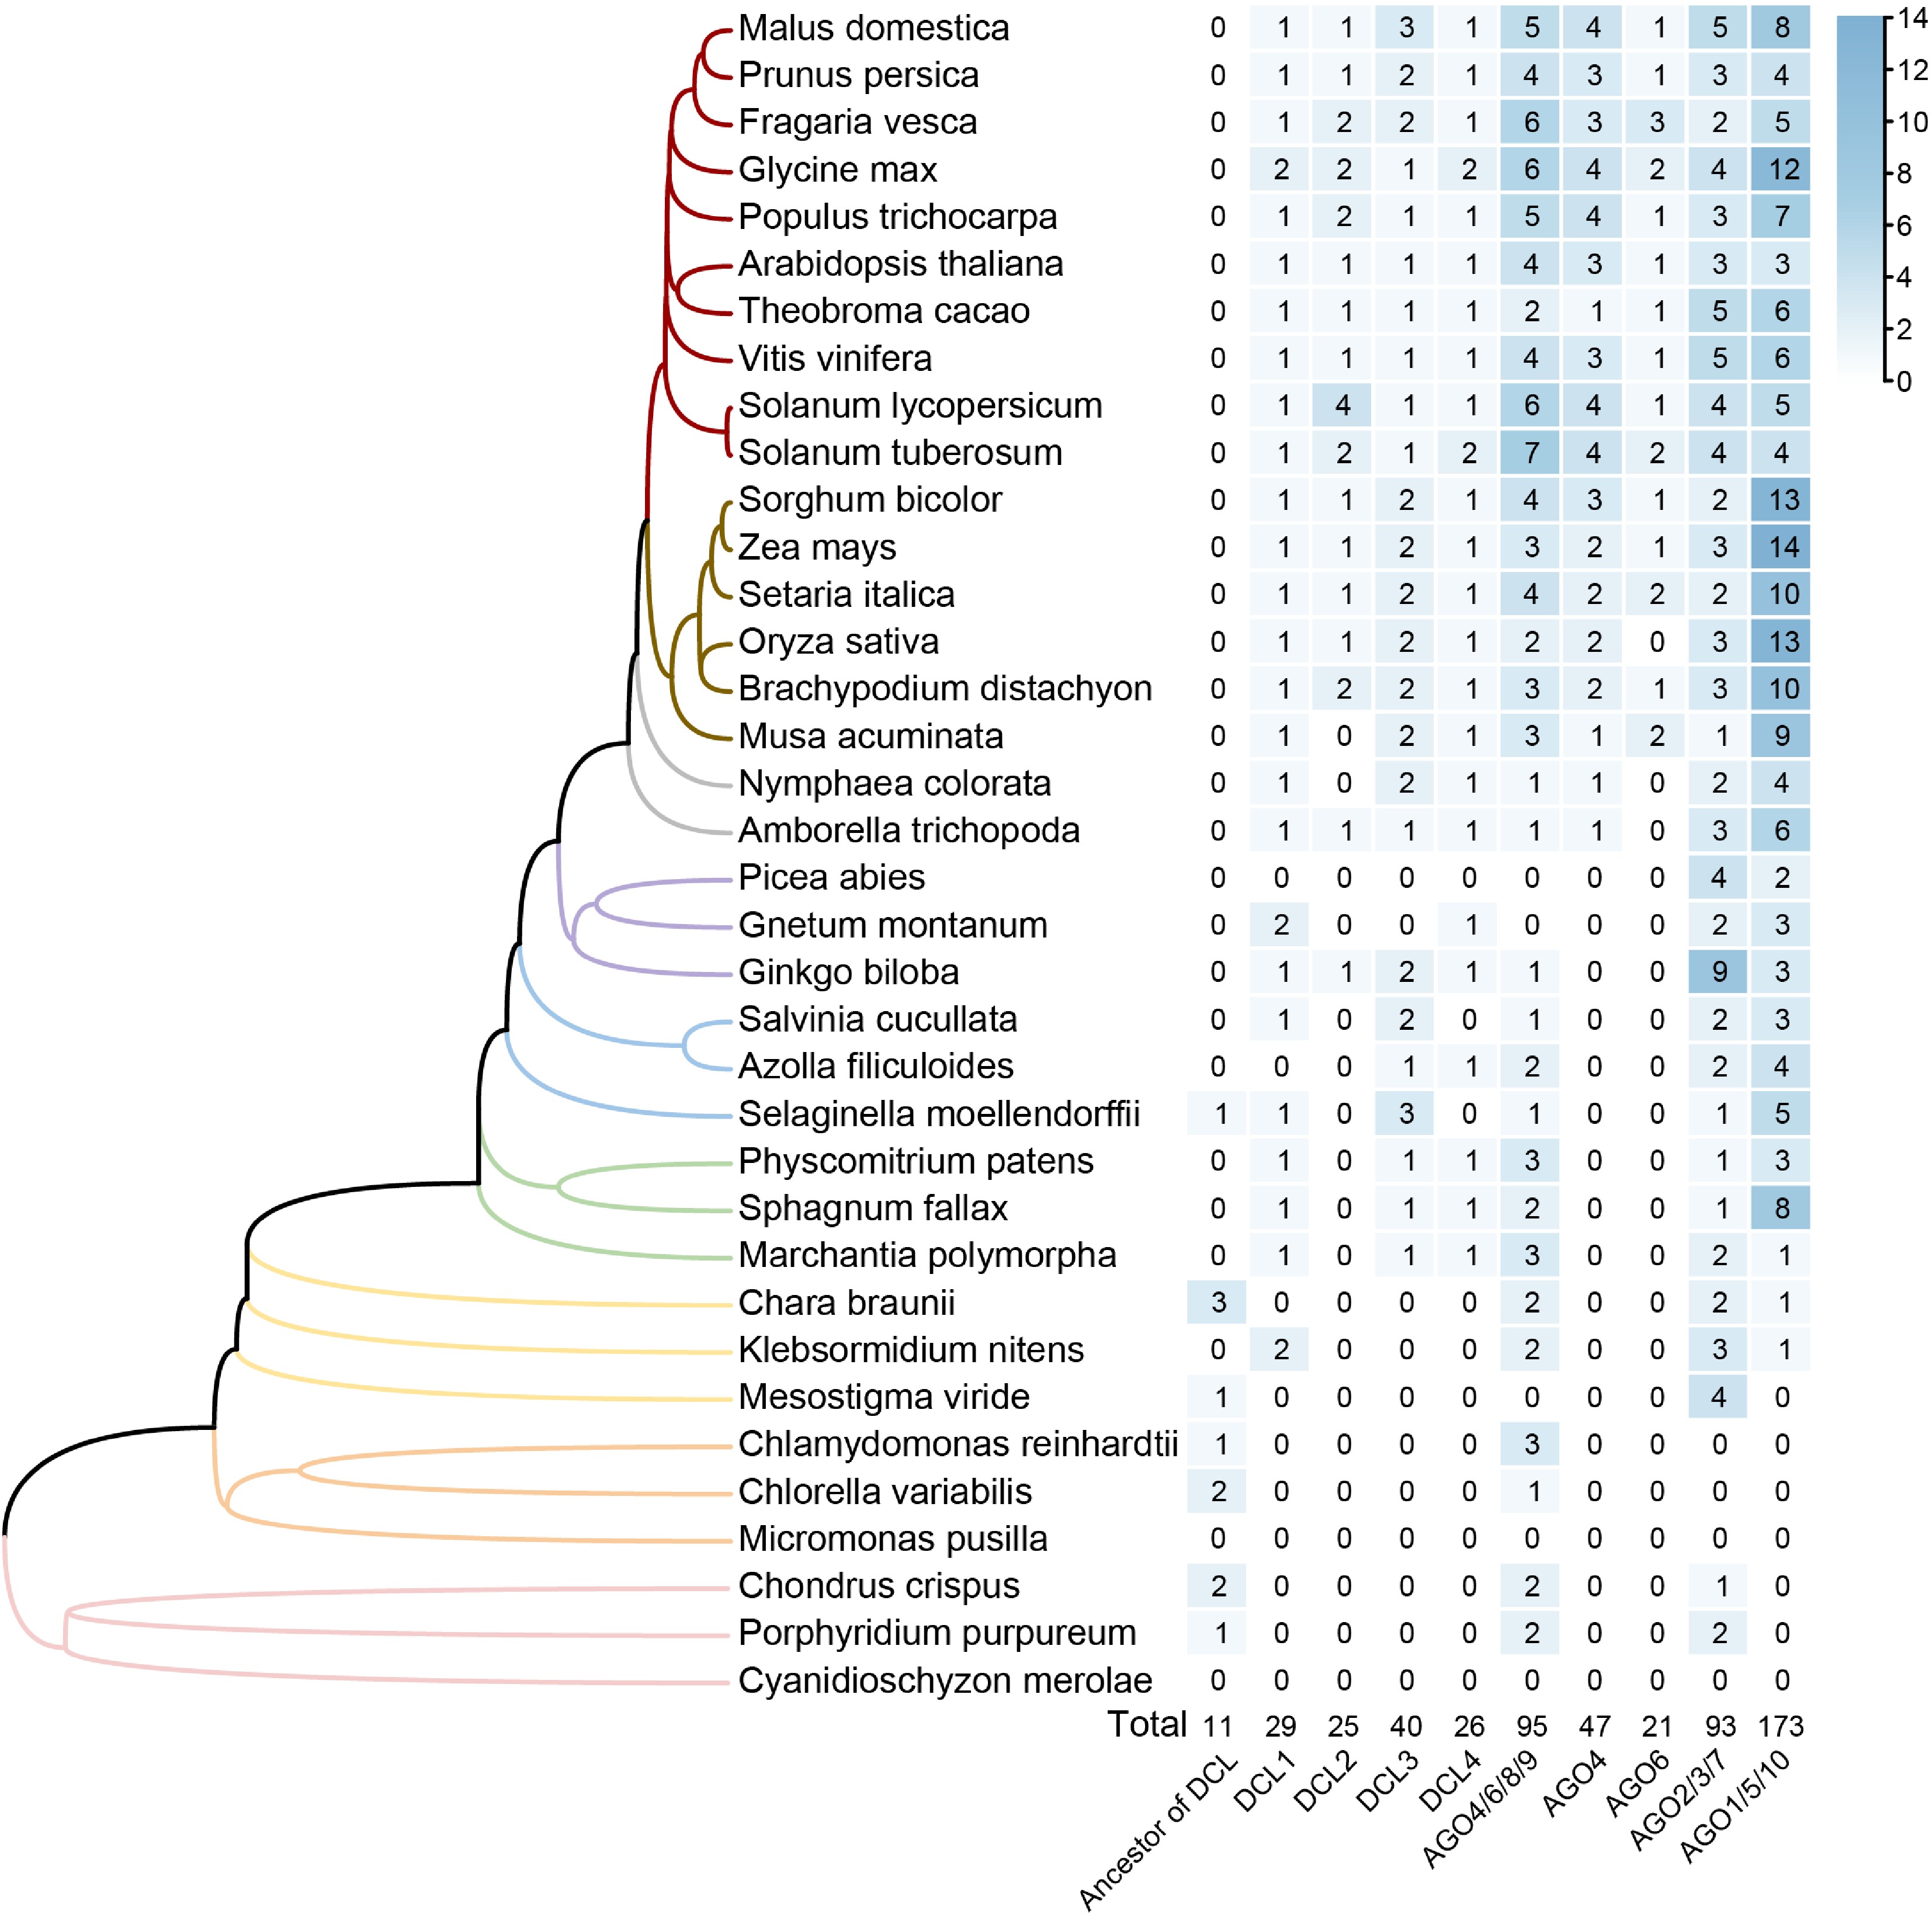
Figure 2.
Phylogenetic distribution and gene copy number analysis of DCL and AGO gene families across 36 plant species. The phylogenetic tree on the left represents the evolutionary relationships of species investigated, with branches colored to represent different groups. The heatmap on the right displays gene copy numbers for each clade of gene family across the species, with higher numbers represented by darker shades. The total counts for each clade across all species are provided at the bottom of the heatmap.
-
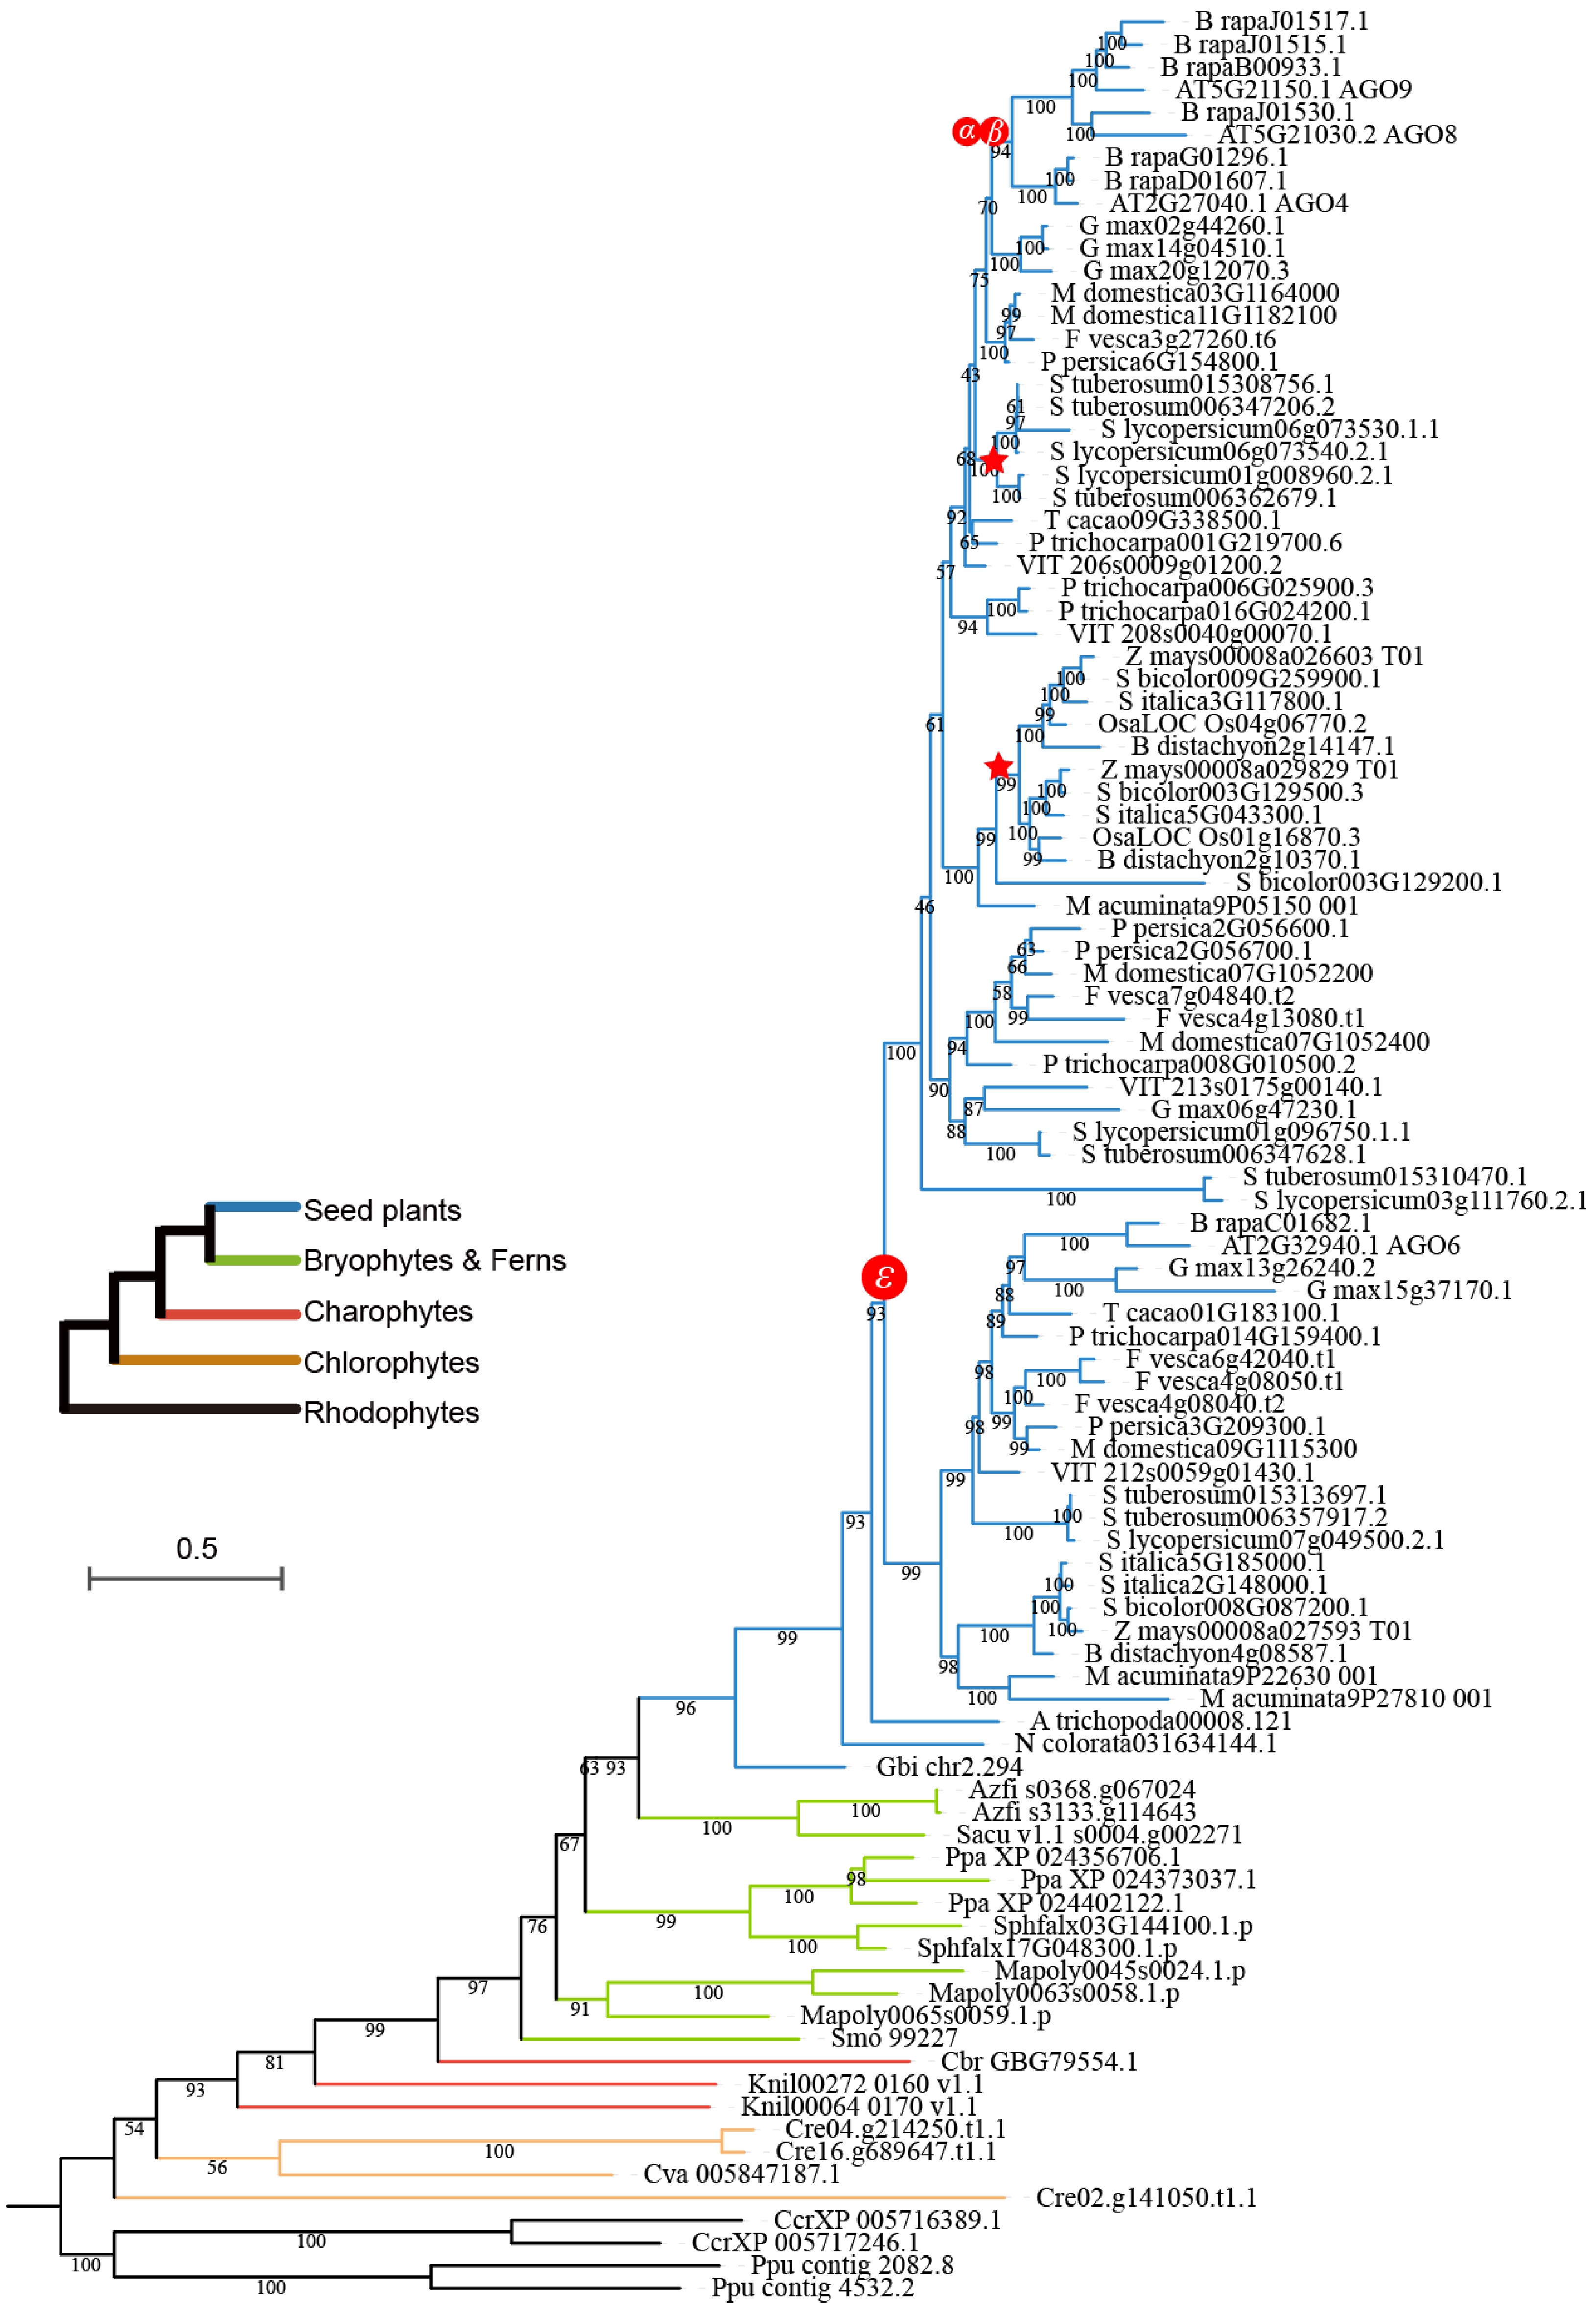
Figure 3.
Phylogeny of the AGO4/6/8/9 clade within the AGO gene family. Different colored branches represent distinct plant groups. The symbols ε, α, and β represent the epsilon angiosperm-wide WGD event, the alpha duplication event, and the beta duplication event, respectively. Red stars along the branches indicate specific whole-genome duplication events.
-
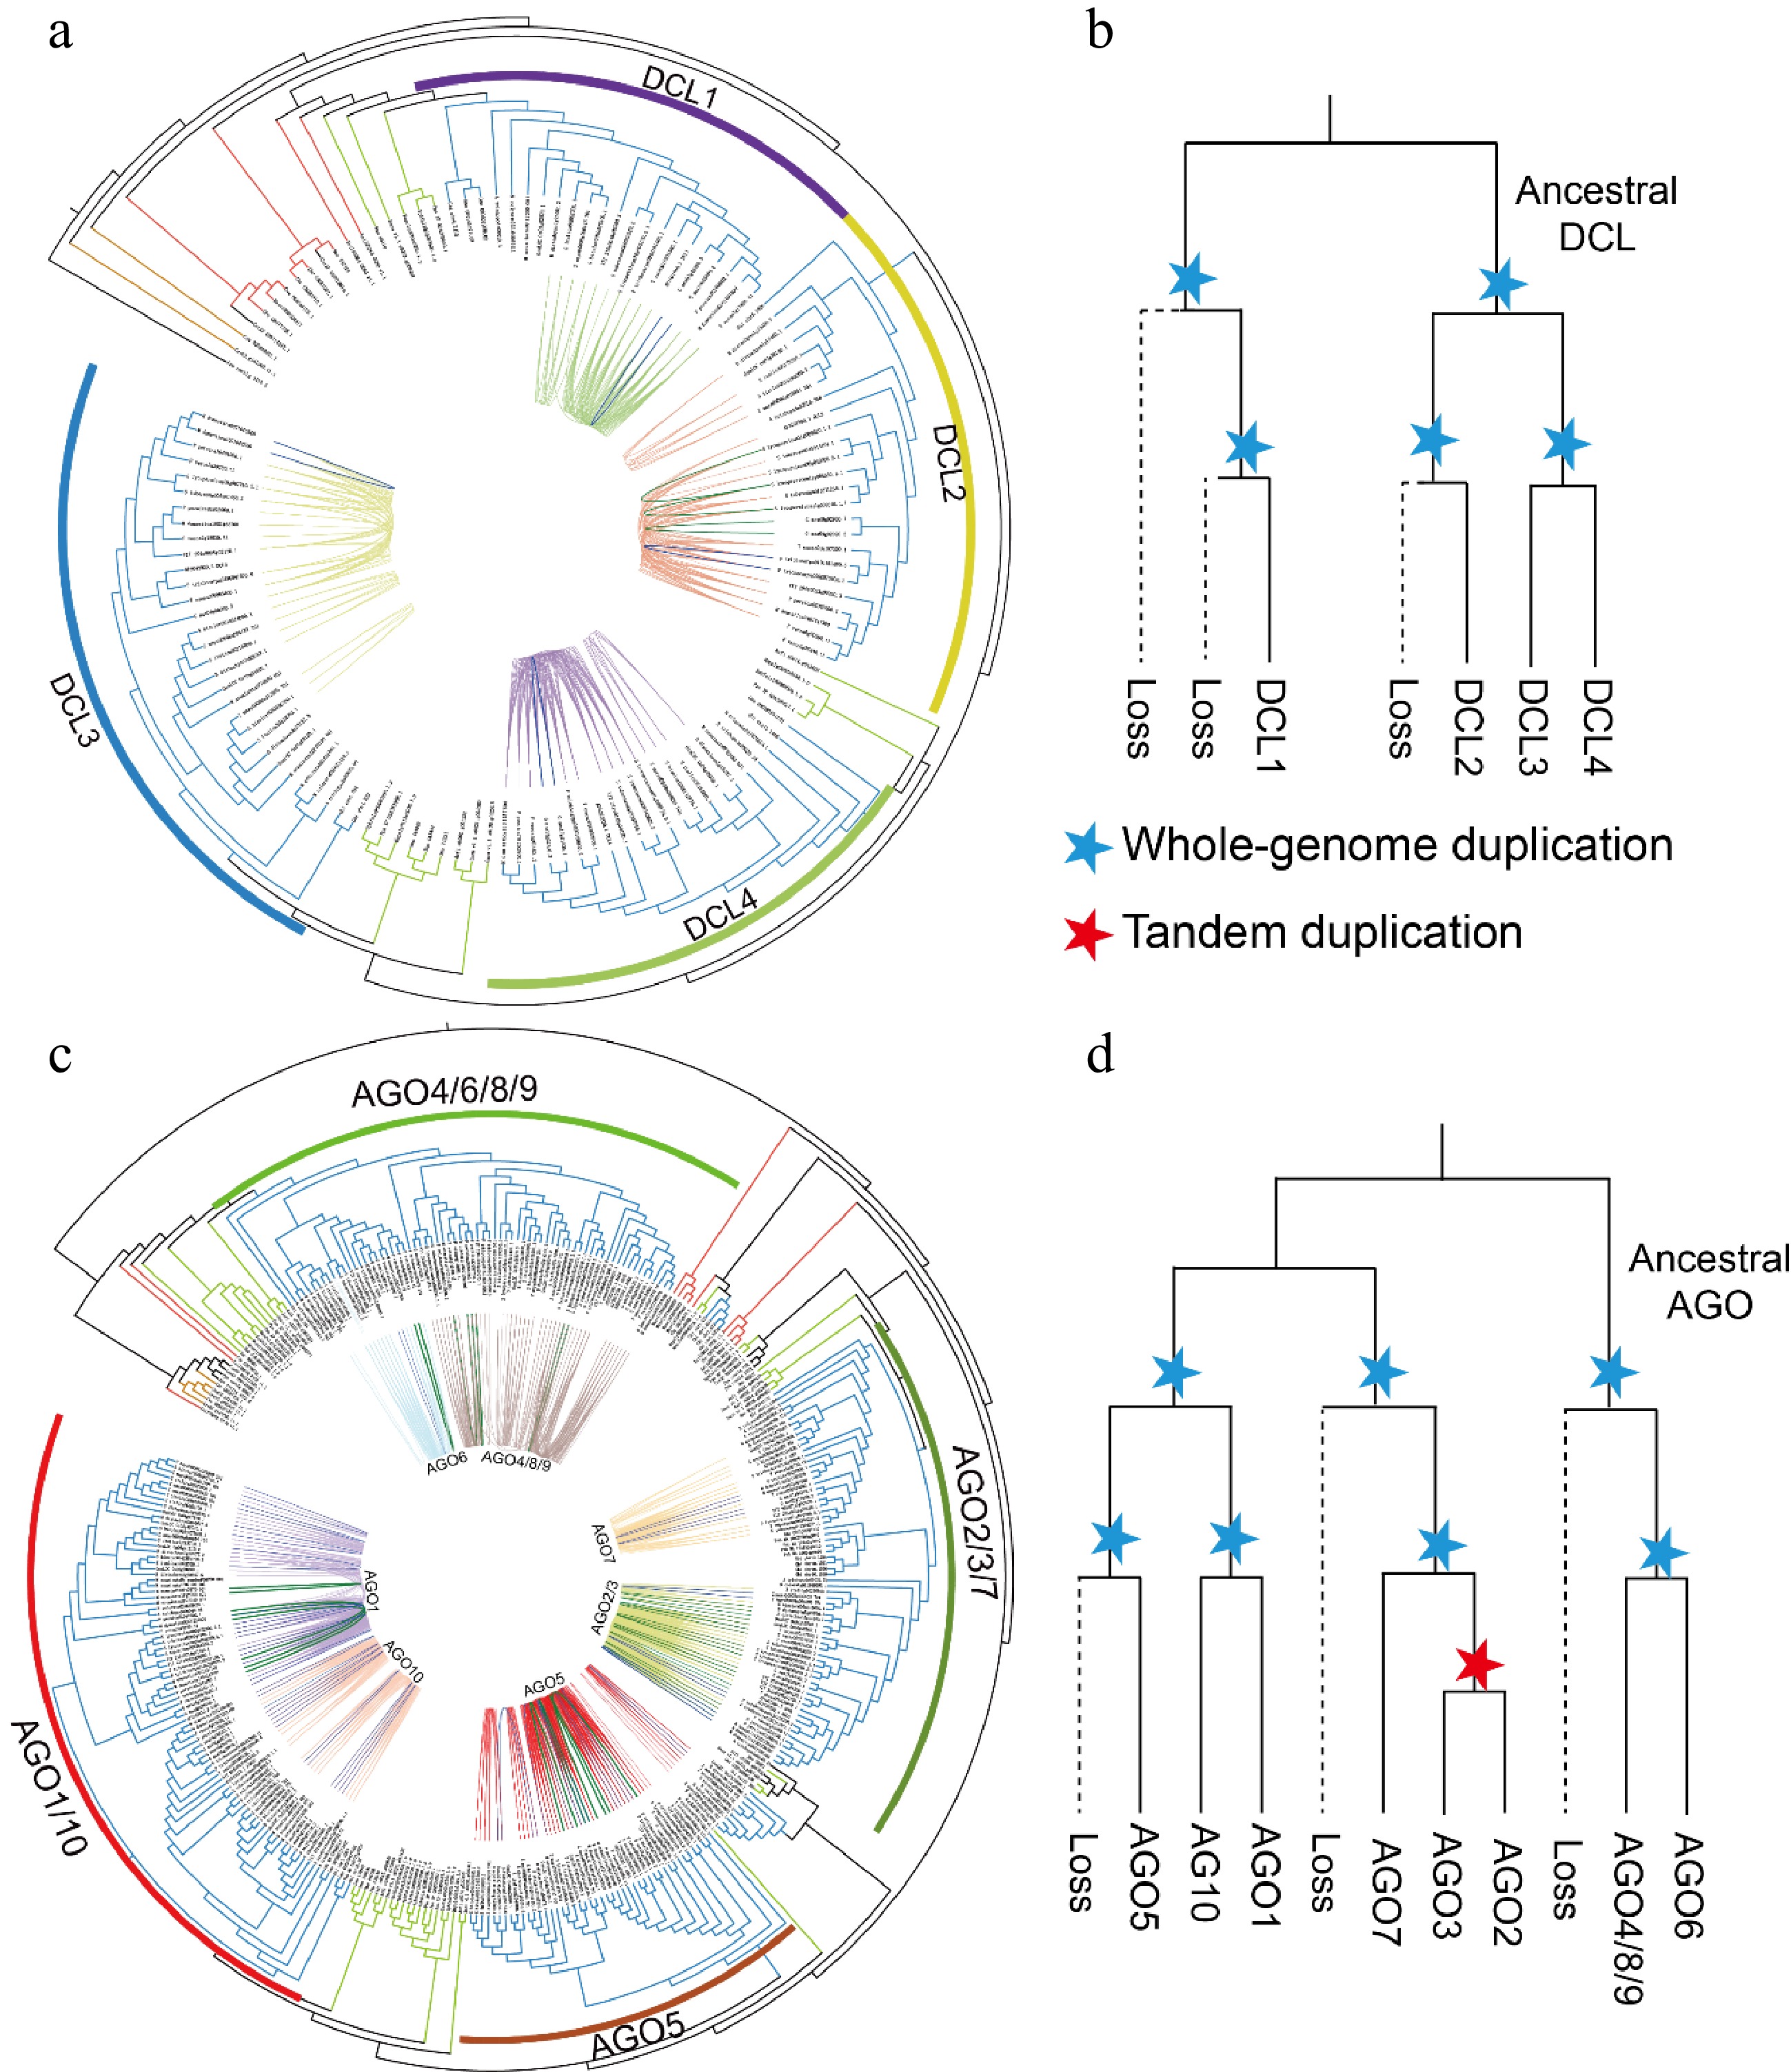
Figure 4.
Phylogenetic analysis and synteny identification of the DCL and AGO genes. (a), (c) Phylogenetic and syntenic relationships of the DCLs and AGOs. The blue and green lines indicate gene pairs resulting from WGD and tandem duplication in the DCLs and AGOs, respectively. (b, d) Schematic representation of the proposed evolutionary histories of the DCL and AGO gene families. The dashed lines indicate gene loss. Blue stars mark either the ancient seed plant-wide or angiosperm-wide genome duplication events. Red stars represent tandem duplication events of genes.
-
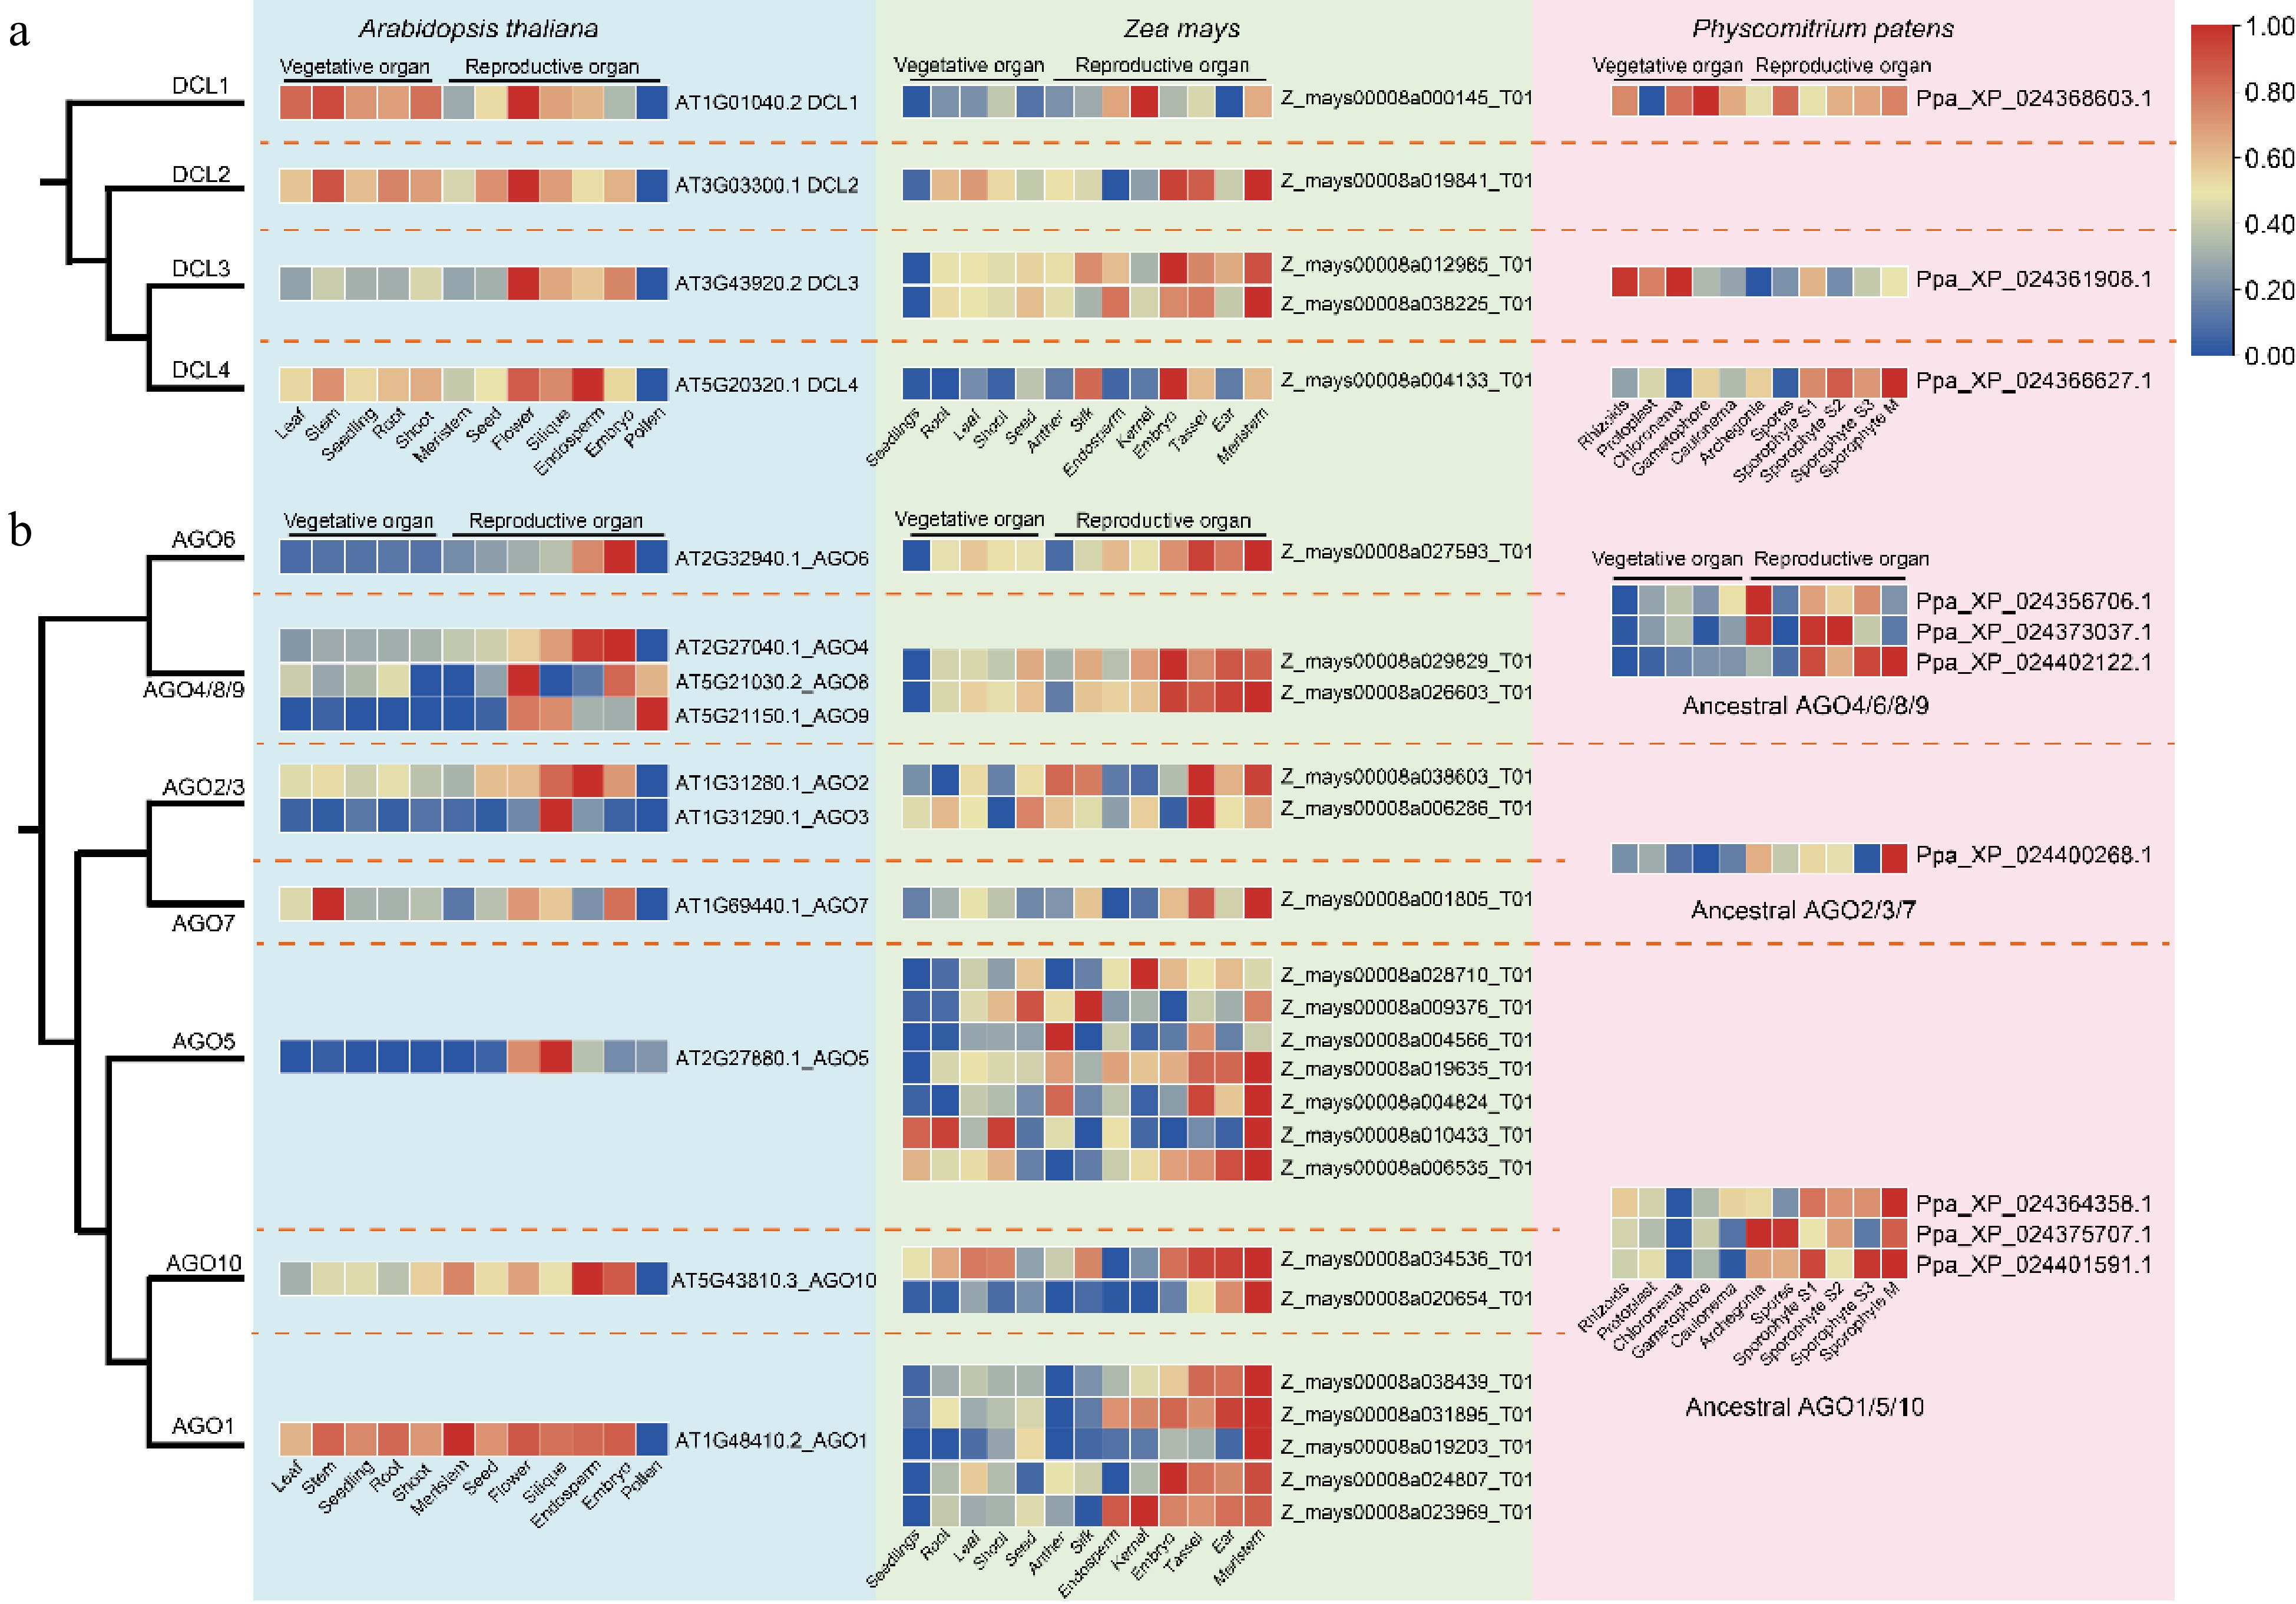
Figure 5.
Expression profiles of DCLs and AGOs in different tissues of A. thaliana, Z. may, and P. patens. (a) Comparative expression profiles of DCL gene family members. (b) Comparative expression profiles of AGO gene family members. Dashed lines demarcate distinct clades, with the heatmap displaying relative expression levels from low (blue) to high (red).
-
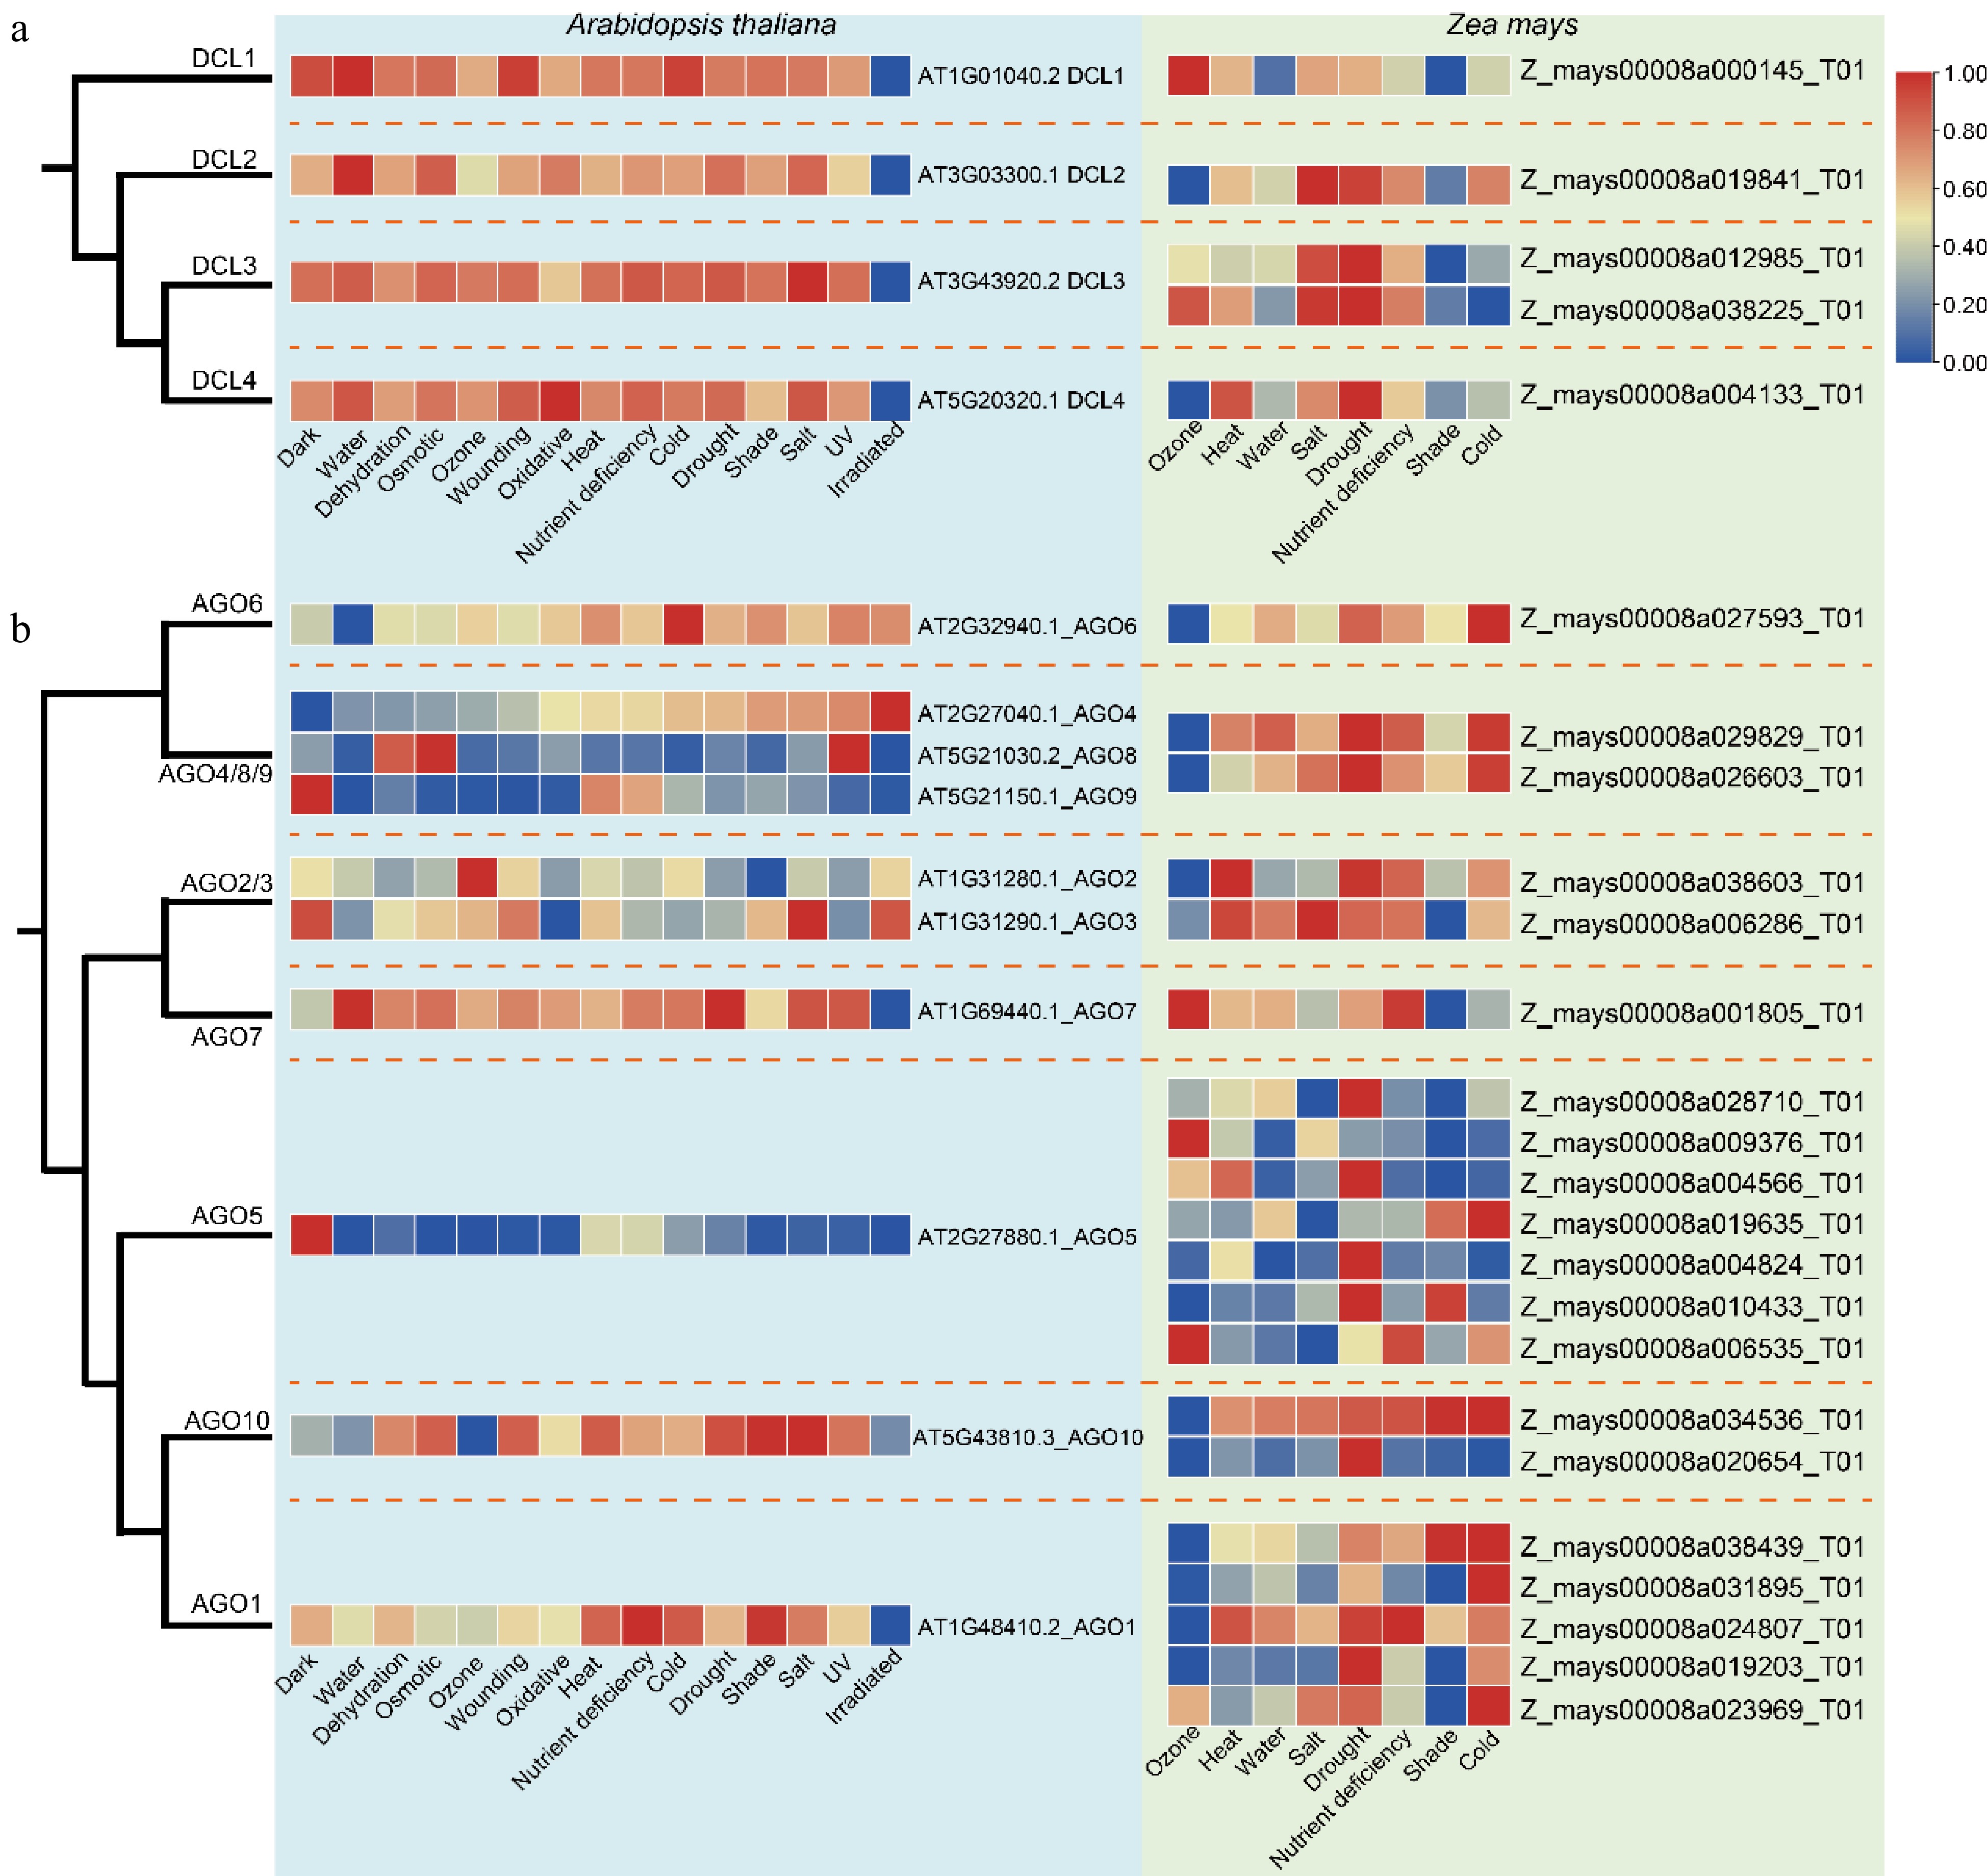
Figure 6.
Expression of the DCLs and AGOs under different stress conditions in A. thaliana and Z. mays. (a) Comparative expression profiles of DCL gene family members. (b) Comparative expression profiles of AGO gene family members. Dashed lines denote distinct clades, with the heatmap displaying relative expression levels from low (blue) to high (red).
Figures
(6)
Tables
(0)