ARTICLE   Open Access    

The origin, evolution, and functional divergence of the Dicer-like (DCL) and Argonaute (AGO) gene families in plants

  • # Authors contributed equally: Li-Yao Su, Shan-Shan Li

More Information
  • Received: 12 September 2024
    Revised: 23 October 2024
    Accepted: 30 October 2024
    Published online: 28 November 2024
    Epigenetics Insights  17 Article number: e003 (2024)  |  Cite this article
  • Dicer-like (DCL) and Argonaute (AGO) proteins play a crucial role in plant epigenetics. However, the evolutionary origins and roles of these gene families in plant adaptation, stress response, and development remain unclear. This study explores the origin and functional evolution of DCLs and AGOs across 36 plant species spanning diverse taxonomic groups. Member identification, phylogenetic analysis, evolutionary trajectory analysis, and functional divergence analysis were conducted. The results show that the DCL and AGO originated in Rhodophytes and underwent two major expansions: during algal terrestrialization and the transition from lower to higher plants. In seed plants, DCLs diversified into four classes following two whole-genome duplication (WGD) events, whereas AGOs diversified into seven classes through two WGD events and one tandem duplication event. Expression analyses in Physcomitrium patens, Zea mays, Arabidopsis thaliana, and Fragaria vesca revealed high expression of these gene families in reproductive tissues, with notably lower expression in pollen. Additionally, the expression of these genes exhibits different responses to various environmental stresses in A. thaliana and Z. mays, highlighting their important roles in adaptation to environmental fluctuations. The present research reveals the functional diversification of DCLs and AGOs and their crucial roles in facilitating terrestrial adaptation and rapid land colonization.
  • Aquaporin’s (AQPs) are small (21–34 kD) channel-forming, water-transporting trans-membrane proteins which are known as membrane intrinsic proteins (MIPs) conspicuously present across all kingdoms of life. In addition to transporting water, plant AQPs act to transport other small molecules including ammonia, carbon dioxide, glycerol, formamide, hydrogen peroxide, nitric acid, and some metalloids such as boron and silicon from the soil to different parts of the plant[1]. AQPs are typically composed of six or fewer transmembrane helices (TMHs) coupled by five loops (A to E) and cytosolic N- and C-termini, which are highly conserved across taxa[2]. Asparagine-Proline-Alanine (NPA) boxes and makeup helices found in loops B (cytosolic) and E (non-cytosolic) fold back into the protein's core to form one of the pore's two primary constrictions, the NPA region[1]. A second filter zone exists at the pore's non-cytosolic end, where it is called the aromatic/arginine (ar/R) constriction. The substrate selectivity of AQPs is controlled by the amino acid residues of the NPA and ar/R filters as well as other elements of the channel[1].

    To date, the AQP gene families have been extensively explored in the model as well as crop plants[39]. In seed plants, AQP distributed into five subfamilies based on subcellular localization and sequence similarities: the plasma membrane intrinsic proteins (PIPs; subgroups PIP1 and PIP2), the tonoplast intrinsic proteins (TIPs; TIP1-TIP5), the nodulin26-like intrinsic proteins (NIPs; NIP1-NIP5), the small basic intrinsic proteins (SIPs; SIP1-SIP2) and the uncategorized intrinsic proteins (XIPs; XIP1-XIP3)[2,10]. Among them, TIPs and PIPs are the most abundant and play a central role in facilitating water transport. SIPs are mostly found in the endoplasmic reticulum (ER)[11], whereas NIPs homologous to GmNod26 are localized in the peribacteroid membrane[12].

    Several studies reported that the activity of AQPs is regulated by various developmental and environmental factors, through which water fluxes are controlled[13]. AQPs are found in all organs such as leaves, roots, stems, flowers, fruits, and seeds[14,15]. According to earlier studies, increased AQP expression in transgenic plants can improve the plants' tolerance to stresses[16,17]. Increased root water flow caused by upregulation of root aquaporin expression may prevent transpiration[18,19]. Overexpression of Tamarix hispida ThPIP2:5 improved osmotic stress tolerance in Arabidopsis and Tamarix plants[20]. Transgenic tomatoes having apple MdPIP1;3 ectopically expressed produced larger fruit and improved drought tolerance[21]. Plants over-expressing heterologous AQPs, on the other hand, showed negative effects on stress tolerance in many cases. Overexpression of GsTIP2;1 from G. soja in Arabidopsis plants exhibited lower resistance against salt and drought stress[22].

    A few recent studies have started to establish a link between AQPs and nanobiology, a research field that has been accelerating in the past decade due to the recognition that many nano-substances including carbon-based materials are valuable in a wide range of agricultural, industrial, and biomedical activities[23]. Carbon nanotubes (CNTs) were found to improve water absorption and retention and thus enhance seed germination in tomatoes[24,25]. Ali et al.[26] reported that Carbon nanoparticles (CTNs) and osmotic stress utilize separate processes for AQP gating. Despite lacking solid evidence, it is assumed that CNTs regulate the aquaporin (AQPs) in the seed coats[26]. Another highly noticed carbon-nano-molecule, the fullerenes, is a group of allotropic forms of carbon consisting of pure carbon atoms[27]. Fullerenes and their derivatives, in particular the water-soluble fullerols [C60(OH)20], are known to be powerful antioxidants, whose biological activity has been reduced to the accumulation of superoxide and hydroxyl[28,29]. Fullerene/fullerols at low concentrations were reported to enhance seed germination, photosynthesis, root growth, fruit yield, and salt tolerance in various plants such as bitter melon and barley[3032]. In contrast, some studies also reported the phytotoxic effect of fullerene/fullerols[33,34]. It remains unknown if exogenous fullerene/fullerol has any impact on the expression or activity of AQPs in the cell.

    Garden pea (P. sativum) is a cool-season crop grown worldwide; depending on the location, planting may occur from winter until early summer. Drought stress in garden pea mainly affects the flowering and pod filling which harm their yield. In the current study, we performed a genome-wide identification and characterization of the AQP genes in garden pea (P. sativum), the fourth largest legume crop worldwide with a large complex genome (~4.5 Gb) that was recently decoded[35]. In particular, we disclose, for the first time to our best knowledge, that the transcriptional regulations of AQPs by osmotic stress in imbibing pea seeds were altered by fullerol supplement, which provides novel insight into the interaction between plant AQPs, osmotic stress, and the carbon nano-substances.

    The whole-genome sequence of garden pea ('Caméor') was retrieved from the URGI Database (https://urgi.versailles.inra.fr/Species/Pisum). Protein sequences of AQPs from two model crops (Rice and Arabidopsis) and five other legumes (Soybean, Chickpea, Common bean, Medicago, and Peanut) were used to identify homologous AQPs from the garden pea genome (Supplemental Table S1). These protein sequences, built as a local database, were then BLASTp searched against the pea genome with an E-value cutoff of 10−5 and hit a score cutoff of 100 to identify AQP orthologs. The putative AQP sequences of pea were additionally validated to confirm the nature of MIP (Supplemental Table S2) and transmembrane helical domains through TMHMM (www.cbs.dtu.dk/services/TMHMM/).

    Further phylogenetic analysis was performed to categorize the AQPs into subfamilies. The pea AQP amino acid sequences, along with those from Medicago, a cool-season model legume phylogenetically close to pea, were aligned through ClustalW2 software (www.ebi.ac.uk/Tools/msa/clustalw2) to assign protein names. The unaligned AQP sequences to Medicago counterparts were once again aligned with the AQP sequences of Arabidopsis, rice, and soybean. Based on the LG model, unrooted phylogenetic trees were generated via MEGA7 and the neighbor-joining method[36], and the specific name of each AQP gene was assigned based on its position in the phylogenetic tree.

    By using the conserved domain database (CDD, www.ncbi.nlm.nih.gov/Structure/cdd/cdd.shtml), the NPA motifs were identified from the pea AQP protein sequences[37]. The software TMHMM (www.cbs. dtu.dk/services/TMHMM/)[38] was used to identify the protein transmembrane domains. To determine whether there were any alterations or total deletion, the transmembrane domains were carefully examined.

    Basic molecular properties including amino acid composition, relative molecular weight (MW), and instability index were investigated through the online tool ProtParam (https://web.expasy.org/protparam/). The isoelectric points (pI) were estimated by sequence Manipulation Suite version 2 (www.bioinformatics.org/sms2)[39]. The subcellular localization of AQP proteins was predicted using Plant-mPLoc[40] and WoLF PSORT (www.genscript.com/wolf-psort.html)[ 41] algorithms.

    The gene structure (intron-exon organization) of AQPs was examined through GSDS ver 2.0[42]. The chromosomal distribution of the AQP genes was illustrated by the software MapInspect (http://mapinspect.software.informer.com) in the form of a physical map.

    To explore the tissue expression patterns of pea AQP genes, existing NGS data from 18 different libraries covering a wide range of tissue, developmental stage, and growth condition of the variety ‘Caméor’ were downloaded from GenBank (www.ncbi.nlm.nih.gov/bioproject/267198). The expression levels of the AQP genes in each tissue and growth stage/condition were represented by the FPKM (Fragments Per Kilobase of transcript per Million fragments mapped) values. Heatmaps of AQPs gene were generated through Morpheus software (https://software.broadinstitute.org/morpheus/#).

    Different solutions, which were water (W), 0.3 M mannitol (M), and fullerol of different concentrations dissolved in 0.3 M mannitol (MF), were used in this study. MF solutions with the fullerol concentration of 10, 50, 100, and 500 mg/L were denoted as MF1, MF2, MF3, and MF4, respectively. Seeds of 'SQ-1', a Chinese landrace accession of a pea, were germinated in two layers of filter paper with 30 mL of each solution in Petri dishes (12 cm in diameter) each solution, and the visual phenotype and radicle lengths of 150 seeds for each treatment were analyzed 72 h after soaking. The radicle lengths were measured using a ruler. Multiple comparisons for each treatment were performed using the SSR-Test method with the software SPSS 20.0 (IBM SPSS Statistics, Armonk, NY, USA).

    Total RNA was extracted from imbibing embryos after 12 h of seed soaking in the W, M, and MF3 solution, respectively, by using Trizol reagent (Invitrogen, Carlsbad, CA, USA). The quality and quantity of the total RNA were measured through electrophoresis on 1% agarose gel and an Agilent 2100 Bioanalyzer respectively (Agilent Technologies, Santa Rosa, USA). The TruSeq RNA Sample Preparation Kit was utilized to construct an RNA-Seq library from 5 µg of total RNA from each sample according to the manufacturer's instruction (Illumina, San Diego, CA, USA). Next-generation sequencing of nine libraries were performed through Novaseq 6000 platform (Illumina, San Diego, CA, USA).

    First of all, by using SeqPrep (https://github.com/jstjohn/SeqPrep) and Sickle (https://github.com/najoshi/sickle) the raw RNA-Seq reads were filtered and trimmed with default parameters. After filtering, high-quality reads were mapped onto the pea reference genome (https://urgi.versailles.inra.fr/Species/Pisum) by using TopHat (V2.1.0)[43]. Using Cufflinks, the number of mapped reads from each sample was determined and normalised to FPKM for each predicted transcript (v2.2.1). Pairwise comparisons were made between W vs M and W vs M+F treatments. The DEGs with a fold change ≥ 1.5 and false discovery rate (FDR) adjusted p-values ≤ 0.05 were identified by using Cuffdiff[44].

    qPCR was performed by using TOROGGreen® qPCR Master Mix (Toroivd, Shanghai, China) on a qTOWER®3 Real-Time PCR detection system (Analytik Jena, Germany). The reactions were performed at 95 °C for 60 s, followed by 42 cycles of 95 °C for 10 s and 60 °C for 30 s. Quantification of relative expression level was achieved by normalization against the transcripts of the housekeeping genes β-tubulin according to Kreplak et al.[35]. The primer sequences for reference and target genes used are listed in Supplemental Table S3.

    The homology-based analysis identifies 41 putative AQPs in the garden pea genome. Among them, all but two genes (Psat0s3550g0040.1, Psat0s2987g0040.1) encode full-length aquaporin-like sequences (Table 1). The conserved protein domain analysis later validated all of the expected AQPs (Supplemental Table S2). To systematically classify these genes and elucidate their relationship with the AQPs from other plants' a phylogenetic tree was created. It clearly showed that the AQPs from pea and its close relative M. truncatula formed four distinct clusters, which represented the different subfamilies of AQPs i.e. TIPs, PIPs, NIPs, and SIPs (Fig. 1a). However, out of the 41 identified pea AQPs, 4 AQPs couldn't be tightly aligned with the Medicago AQPs and thus were put to a new phylogenetic tree constructed with AQPs from rice, Arabidopsis, and soybean. This additional analysis assigned one of the 4 AQPs to the XIP subfamily and the rest three to the TIP or NIP subfamilies (Fig. 1b). Therefore, it is concluded that the 41 PsAQPs comprise 11 PsTIPs, 15 PsNIPs, 9 PsPIPs, 5 PsSIPs, and 1 PsXIP (Table 2). The PsPIPs formed two major subgroups namely PIP1s and PIP2s, which comprise three and six members, respectively (Table 1). The PsTIPs formed two major subgroups TIPs 1 (PsTIP1-1, PsTIP1-3, PsTIP1-4, PsTIP1-7) and TIPs 2 (PsTIP2-1, PsTIP2-2, PsTIP2-3, PsTIP2-6) each having four members (Table 2). Detailed information such as gene/protein names, accession numbers, the length of deduced polypeptides, and protein structural features are presented in Tables 1 & 2

    Table 1.  Description and distribution of aquaporin genes identified in the garden pea genome.
    Chromosome
    S. NoGene NameGene IDGene length
    (bp)
    LocationStartEndTranscription length (bp)CDS length
    (bp)
    Protein length
    (aa)
    1PsPIP1-1Psat5g128840.32507chr5LG3231,127,859231,130,365675675225
    2PsPIP1-2Psat2g034560.11963chr2LG149,355,95849,357,920870870290
    3PsPIP1-4Psat2g182480.11211chr2LG1421,647,518421,648,728864864288
    4PsPIP2-1Psat6g183960.13314chr6LG2369,699,084369,702,397864864288
    5PsPIP2-2-1Psat4g051960.11223chr4LG486,037,44686,038,668585585195
    6PsPIP2-2-2Psat5g279360.22556chr5LG3543,477,849543,480,4042555789263
    7PsPIP2-3Psat7g228600.22331chr7LG7458,647,213458,649,5432330672224
    8PsPIP2-4Psat3g045080.11786chr3LG5100,017,377100,019,162864864288
    9PsPIP2-5Psat0s3550g0040.11709scaffold0355020,92922,63711911191397
    10PsTIP1-1Psat3g040640.12021chr3LG589,426,47389,428,493753753251
    11PsTIP1-3Psat3g184440.12003chr3LG5393,920,756393,922,758759759253
    12PsTIP1-4Psat7g219600.12083chr7LG7441,691,937441,694,019759759253
    13PsTIP1-7Psat6g236600.11880chr6LG2471,659,417471,661,296762762254
    14PsTIP2-1Psat1g005320.11598chr1LG67,864,8107,866,407750750250
    15PsTIP2-2Psat4g198360.11868chr4LG4407,970,525407,972,392750750250
    16PsTIP2-3Psat1g118120.12665chr1LG6230,725,833230,728,497768768256
    17PsTIP2-6Psat2g177040.11658chr2LG1416,640,482416,642,139750750250
    18PsTIP3-2Psat6g054400.11332chr6LG254,878,00354,879,334780780260
    19PsTIP4-1Psat6g037720.21689chr6LG230,753,62430,755,3121688624208
    20PsTIP5-1Psat7g157600.11695chr7LG7299,716,873299,718,567762762254
    21PsNIP1-1Psat1g195040.21864chr1LG6346,593,853346,595,7161863645215
    22PsNIP1-3Psat1g195800.11200chr1LG6347,120,121347,121,335819819273
    23PsNIP1-5Psat7g067480.12365chr7LG7109,420,633109,422,997828828276
    24PsNIP1-6Psat7g067360.12250chr7LG7109,270,462109,272,711813813271
    25PsNIP1-7Psat1g193240.11452chr1LG6344,622,606344,624,057831831277
    26PsNIP2-1-2Psat3g197520.1669chr3LG5420,092,382420,093,050345345115
    27PsNIP2-2-2Psat3g197560.1716chr3LG5420,103,168420,103,883486486162
    28PsNIP3-1Psat2g072000.11414chr2LG1133,902,470133,903,883798798266
    29PsNIP4-1Psat7g126440.11849chr7LG7209,087,362209,089,210828828276
    30PsNIP4-2Psat5g230920.11436chr5LG3463,340,575463,342,010825825275
    31PsNIP5-1Psat6g190560.11563chr6LG2383,057,323383,058,885867867289
    32PsNIP6-1Psat5g304760.45093chr5LG3573,714,868573,719,9605092486162
    33PsNIP6-2Psat7g036680.12186chr7LG761,445,34161,447,134762762254
    34PsNIP6-3Psat7g259640.12339chr7LG7488,047,315488,049,653918918306
    35PsNIP7-1Psat6g134160.24050chr6LG2260,615,019260,619,06840491509503
    36PsSIP1-1Psat3g091120.13513chr3LG5187,012,329187,015,841738738246
    37PsSIP1-2Psat1g096840.13609chr1LG6167,126,599167,130,207744744248
    38PsSIP1-3Psat7g203280.12069chr7LG7401,302,247401,304,315720720240
    39PsSIP2-1-1Psat0s2987g0040.1706scaffold02987177,538178,243621621207
    40PsSIP2-1-2Psat3g082760.13135chr3LG5173,720,100173,723,234720720240
    41PsXIP2-1Psat7g178080.12077chr7LG7335,167,251335,169,327942942314
    bp: base pair, aa: amino acid.
     | Show Table
    DownLoad: CSV
    Figure 1.  Phylogenetic analysis of the identified AQPs from pea genome. (a) The pea AQPs proteins aligned with those from the cool-season legume Medicago truncatual. (b) The four un-assigned pea AQPs in (a) (denoted as NA) were further aligned with the AQPs of rice, soybean, and Arabidopsis by using the Clustal W program implemented in MEGA 7 software. The nomenclature of PsAQPs was based on homology with the identified aquaporins that were clustered together.
    Table 2.  Protein information, conserved amino acid residues, trans-membrane domains, selectivity filter, and predicted subcellular localization of the 39 full-length pea aquaporins.
    S. NoAQPsGeneLengthTMHNPANPAar/R selectivity filterpIWoLF PSORTPlant-mPLoc
    LBLEH2H5LE1LE2
    Plasma membrane intrinsic proteins (PIPs)
    1PsPIP1-1Psat5g128840.32254NPA0F0008.11PlasPlas
    2PsPIP1-2Psat2g034560.12902NPANPAFHTR9.31PlasPlas
    3PsPIP1-4Psat2g182480.12886NPANPAFHTR9.29PlasPlas
    4PsPIP2-1Psat6g183960.12886NPANPAFHT08.74PlasPlas
    5PsPIP2-2-1Psat4g051960.1195300FHTR8.88PlasPlas
    6PsPIP2-2-2Psat5g279360.22635NPANPAFHTR5.71PlasPlas
    7PsPIP2-3Psat7g228600.22244NPA0FF006.92PlasPlas
    8PsPIP2-4Psat3g045080.12886NPANPAFHTR8.29PlasPlas
    Tonoplast intrinsic proteins (TIPs)
    1PsTIP1-1Psat3g040640.12517NPANPAHIAV6.34PlasVacu
    2PsTIP1-3Psat3g184440.12536NPANPAHIAV5.02Plas/VacuVacu
    3PsTIP1-4Psat7g219600.12537NPANPAHIAV4.72VacuVacu
    4PsTIP1-7Psat6g236600.12546NPANPAHIAV5.48Plas/VacuVacu
    5PsTIP2-1Psat1g005320.12506NPANPAHIGR8.08VacuVacu
    6PsTIP2-2Psat4g198360.12506NPANPAHIGR5.94Plas/VacuVacu
    7PsTIP2-3Psat1g118120.12566NPANPAHIAL6.86Plas/VacuVacu
    8PsTIP2-6Psat2g177040.12506NPANPAHIGR4.93VacuVacu
    9PsTIP3-2Psat6g054400.12606NPANPAHIAR7.27Plas/VacuVacu
    10PsTIP4-1Psat6g037720.22086NPANPAHIAR6.29Vac/ plasVacu
    11PsTIP5-1Psat7g157600.12547NPANPANVGC8.2Vacu /plasVacu/Plas
    Nodulin-26 like intrisic proteins (NIPs)
    1PsNIP1-1Psat1g195040.22155NPA0WVF06.71PlasPlas
    2PsNIP1-3Psat1g195800.12735NPANPVWVAR6.77PlasPlas
    3PsNIP1-5Psat7g067480.12766NPANPVWVAN8.98PlasPlas
    4PsNIP1-6Psat7g067360.12716NPANPAWVAR8.65Plas/VacuPlas
    5PsNIP1-7Psat1g193240.12776NPANPAWIAR6.5Plas/VacuPlas
    6PsNIP2-1-2Psat3g197520.11152NPAOG0009.64PlasPlas
    7PsNIP2-2-2Psat3g197560.116230NPA0SGR6.51PlasPlas
    8PsNIP3-1Psat2g072000.12665NPANPASIAR8.59Plas/VacuPlas
    9PsNIP4-1Psat7g126440.12766NPANPAWVAR6.67PlasPlas
    10PsNIP4-2Psat5g230920.12756NPANPAWLAR7.01PlasPlas
    11PsNIP5-1Psat6g190560.12895NPSNPVAIGR7.1PlasPlas
    12PsNIP6-1Psat5g304760.41622NPA0I0009.03PlasPlas
    13PsNIP6-2Psat7g036680.1254000G0005.27ChloPlas/Nucl
    14PsNIP6-3Psat7g259640.13066NPANPVTIGR8.32PlasPlas
    15PsNIP7-1Psat6g134160.25030NLK0WGQR8.5VacuChlo/Nucl
    Small basic intrinsic proteins (SIPs)
    1PsSIP1-1Psat3g091120.12466NPTNPAVLPN9.54PlasPlas/Vacu
    2PsSIP1-2Psat1g096840.12485NTPNPAIVPL9.24VacuPlas/Vacu
    3PsSIP1-3Psat7g203280.12406NPSNPANLPN10.32ChloPlas
    4PsSIP2-1-2Psat3g082760.12404NPLNPAYLGS10.28PlasPlas
    Uncharacterized X intrinsic proteins (XIPs)
    1PsXIP2-1Psat7g178080.13146SPVNPAVVRM7.89PlasPlas
    Length: protein length (aa); pI: Isoelectric point; Trans-membrane helicase (TMH) represents for the numbers of Trans-membrane helices predicted by TMHMM Server v.2.0 tool; WoLF PSORT and Plant-mPLoc: best possible cellualr localization predicted by the WoLF PSORT and Plant-mPLoc tool, respectively (Chlo Chloroplast, Plas Plasma membrane, Vacu Vacuolar membrane, Nucl Nucleus); LB: Loop B, L: Loop E; NPA: Asparagine-Proline-Alanine; H2 represents for Helix 2, H5 represents for Helix 5, LE1 represents for Loop E1, LE2 represents for Loop E2, Ar/R represents for Aromatic/Arginine.
     | Show Table
    DownLoad: CSV

    To understand the genome distribution of the 41 PsAQPs, we mapped these genes onto the seven chromosomes of a pea to retrieve their physical locations (Fig. 2). The greatest number (10) of AQPs were found on chromosome 7, whereas the least (2) on chromosome 4 (Fig. 2 and Table 1). Chromosomes 1 and 6 each contain six aquaporin genes, whereas chromosomes 2, 3, and 5 carry four, seven, and four aquaporin genes, respectively (Fig. 2). The trend of clustered distribution of AQPs was seen on specific chromosomes, particularly near the end of chromosome 7.

    Figure 2.  Chromosomal localization of the 41 PsAQPs on the seven chromosomes of pea. Chr1-7 represents the chromosomes 1 to 7. The numbers on the right of each chromosome show the physical map positions of the AQP genes (Mbp). Blue, green, orange, brown, and black colors represent TIPs, NIPs, PIPs, SIPs, and XIP, respectively.

    The 39 full-length PsAQP proteins have a length of amino acid ranging from 115 to 503 (Table 1) and Isoelectric point (pI) values ranging from 4.72 to 10.35 (Table 2). As a structural signature, transmembrane domains were predicted to exist in all PsAQPs, with the number in individual AQPs varying from 2 to 6. By subfamilies, TIPs harbor the greatest number of TM domains in total, followed by PIPs, NIPs, SIPs, and XIP (Table 2). Exon-intron structure analysis showed that most PsAQPs (16/39) having two introns, while ten members had three, seven members had four, and five members had only one intron (Fig. 3). Overall, PsAQPs exhibited a complex structure with varying intron numbers, positions, and lengths.

    Figure 3.  The exon-intron structures of the AQP genes in pea. Upstream/downstream region, exon, and intron are represented by a blue box, yellow box, and grey line, respectively.

    As aforementioned, generally highly conserved two NPA motifs generate an electrostatic repulsion of protons in AQPs to form the water channel, which is essential for the transport of substrate molecules[15]. In order to comprehend the potential physiological function and substrate specificity of pea aquaporins, NPA motifs (LB, LE) and residues at the ar/R selectivity filter (H2, H5, LE1, and LE2) were examined. (Table 2). We found that all PsTIPs and most PsPIPs had two conserved NPA motifs except for PsPIP1-1, PsPIP2-2-1, and PsPIP2-3, each having a single NPA motif. Among PsNIPs, PsNIP1-6, PsNIP1-6, PsNIP1-7, PsNIP3-1, PsNIP4-1 and PSNIP4-2 had two NPA domains, while PsNIP1-1, PsNIP2-1-2, PsNIP2-2-2 and PsNIP6-1 each had a single NPA motif. In the PsNIP sub-family, the first NPA motif showed an Alanine (A) to Valine (V) substitution in three PsNIPs (PsNIP1-3, PsNIP1-5, and PsNIP6-3) (Table 2). Furthermore, the NPA domains of all members of the XIP and SIP subfamilies were different. The second NPA motif was conserved in PsSIP aquaporins, however, all of the first NPA motifs had Alanine (A) replaced by Leucine (L) (PsSIP2-1-1, PsSIP2-1-2) or Threonine (T) (PsSIP1-1). In comparison to other subfamilies, this motif variation distinguishes water and solute-transporting aquaporins[45].

    Compared to NPA motifs, the ar/R positions were more variable and the amino acid composition appeared to be subfamily-dependent. The majority of PsPIPs had phenylalanine at H2, histidine at H5, threonine at LE1, and arginine at LE2 selective filter (Table 2). All of the PsTIP1 members had a Histidine-Isoleucine-Alanine-Valine structure at this position, while all PsTIP2 members but PsTIP2-3 harbored Histidine-Isoleucine-Glycine-Arginine. Similarly, PsNIPs, PsSIPs and PsXIP also showed subgroup-specific variation in ar/R selectivity filter (Table 2). Each of these substitutions partly determines the function of transporting water[46].

    Sequence-based subcellular localization analysis using WoLF PSORT predicted that all PsPIPs localized in the plasma membrane, which is consistent with their subfamily classification (Table 2). Around half (5/11) of the PsTIPs (PsTIP1-4, PsTIP2-1, PsTIP2-6, PsTIP4-1, and PsTIP5-1) were predicted to localize within vacuoles. However, several TIP members (PsTIP1-1, PsTIP1-3, PsTIP1-7, PsTIP2-2, PsTIP2-3 and PsTIP3-2) were predicted to localize in plasma membranes. We then further investigated their localizations by using another software (Plant-mPLoc, Table 2), which predicted that all the PsTIPs localize within vacuoles, thus supporting that they are tonoplast related. An overwhelming majority of PsNIPs (14/15) and PsXIP were predicted to be found only in plasma membranes., which was also expected (Table 2). Collectively, the versatility in subcellular localization of the pea AQPs is implicative of their distinct roles in controlling water and/or solute transport in the context of plant cell compartmentation.

    Tissue expression patterns of genes are indicative of their functions. Since there were rich resources of RNA-Seq data from various types of pea tissues in the public database, they were used for the extraction of expression information of PsAQP genes as represented by FPKM values. A heat map was generated to show the expression patterns of PsAQP genes in 18 different tissues/stages and their responses to nitrate levels (Fig. 4). According to the heat map, PsPIP1-2, PsPIP2-3 were highly expressed in root and nodule G (Low-nitrate), whereas PsTIP1-4, PsTIP2-6, and PsNIP1-7 were only expressed in roots in comparison to other tissues. The result also demonstrated that PsPIP1-1 and PsNIP3-1 expressed more abundantly in leaf, tendril, and peduncle, whereas PsPIP2-2-2 and PsTIP1-1 showed high to moderate expressions in all the samples except for a few. Interestingly, PsTIP1-1 expression in many green tissues seemed to be oppressed by low-nitrate. In contrast, some AQPs such as PsTIP1-3, PsTIP1-7, PsTIP5-1, PsNIP1-5, PsNIP4-1, PsNIP5-1, and PsSIP2-1-1 showed higher expression only in the flower tissue. There were interesting developmental stage-dependent regulations of some AQPs in seeds (Fig. 4). For example, PsPIP2-1, PsPIP2-2-1, PsNIP1-6, PsSIP1-1, and PsSIP1-2 were more abundantly expressed in the Seed_12 dap (days after pollination;) tissue than in the Seed_5 dai (days after imbibition) tissue; reversely, PsPIP2-2-2, PsPIP2-4, PsTIP2-3, and PsTIP3-2 showed higher expression in seed_5 dai in compare to seed_12 dap tissues (Fig. 4). The AQP genes may have particular functional roles in the growth and development of the pea based on their tissue-specific expression.

    Figure 4.  Heatmap analysis of the expression of pea AQP gene expressions in different tissues using RNA-seq data (PRJNA267198). Normalized expression of aquaporins in terms of reads per kilobase of transcript per million mapped reads (RPKM) showing higher levels of PIPs, NIPs, TIPs SIPs, and XIP expression across the different tissues analyzed. (Stage A represents 7-8 nodes; stage B represents the start of flowering; stage D represents germination, 5 d after imbibition; stage E represents 12 d after pollination; stage F represents 8 d after sowing; stage G represents 18 d after sowing, LN: Low-nitrate; HN: High-nitrate.

    Expressions of plant AQPs in vegetative tissues under normal and stressed conditions have been extensively studied[15]; however, little is known about the transcriptional regulation of AQP genes in seeds/embryos. To provide insights into this specific area, wet-bench RNA-Seq was performed on the germinating embryo samples isolated from water (W)-imbibed seeds and those treated with mannitol (M, an osmotic reagent), mannitol, and mannitol plus fullerol (F, a nano-antioxidant). The phenotypic evaluation showed that M treatment had a substantial inhibitory effect on radicle growth, whereas the supplement of F significantly mitigated this inhibition at all concentrations, in particular, 100 mg/mL in MF3, which increased the radicle length by ~33% as compared to that under solely M treatment (Fig. 5). The expression values of PsAQP genes were removed from the RNA-Seq data, and pairwise comparisons were made within the Group 1: W vs M, and Group 2: W vs MF3, where a total of ten and nince AQPs were identified as differentially expressed genes (DEGs), respectively (Fig. 6). In Group 1, six DEGs were up-regulated and four DEGs down-regulated, whereas in Group 2, six DEGs were up-regulated and three DEGs down-regulated. Four genes viz. PsPIPs2-5, PsNIP6-3, PsTIP2-3, and PsTIP3-2 were found to be similarly regulated by M or MF3 treatment (Fig. 6), indicating that their regulation by osmotic stress couldn't be mitigated by fullerol. Three genes, all being PsNIPs (1-1, 2-1-2, and 4-2), were up-regulated only under mannitol treatment without fullerol, suggesting that their perturbations by osmotic stress were migrated by the antioxidant activities. In contrast, four other genes namely PsTIP2-2, PsTIP4-1, PsNIP1-5, and PsSIP1-3 were only regulated under mannitol treatment when fullerol was present.

    Figure 5.  The visual phenotype and radicle length of pea seeds treated with water (W), 0.3 M mannitol (M), and fullerol of different concentrations dissolved in 0.3 M mannitol (MF). MF1, MF2, MF3, and MF4 indicated fullerol dissolved in 0.3 M mannitol at the concentration of 10, 50, 100, and 500 mg/L, respectively. (a) One hundred and fifty grains of pea seeds each were used for phenotype analysis at 72 h after treatment. Radicle lengths were measured using a ruler in three replicates R1, R2, and R3 in all the treatments. (b) Multiple comparison results determined using the SSR-Test method were shown with lowercase letters to indicate statistical significance (P < 0.05).
    Figure 6.  Venn diagram showing the shared and unique differentially expressed PsAQP genes in imbibing seeds under control (W), Mannitol (M) and Mannitol + Fullerol (MF3) treatments. Up-regulation (UG): PsPIP2-5, PsNIP1-1, PsNIP2-1-2, PsNIP4-2, PsNIP6-3, PsNIP1-5, PsTIP2-2, PsTIP4-1, PsSIP1-3, PsXIP2-1; Down-regulation (DG): PsTIP2-3, PsTIP3-2, PsNIP1-7, PsNIP5-1, PsXIP2-1.

    As a validation of the RNA-Seq data, eight genes showing differential expressions in imbibing seeds under M or M + F treatments were selected for qRT-PCR analysis, which was PsTIP4-1, PsTIP2-2, PsTIP2-3, PsTIP3-2, PsPIP2-5, PsXIP2-1, PsNIP6-3 and PsNIP1-5 shown in Fig 6, the expression modes of all the selected genes but PsXIP2-1 were well consistent between the RNA-Seq and the qRT-PCR data. PsXIP2-1, exhibiting slightly decreased expression under M treatment according to RNA-Seq, was found to be up-regulated under the same treatment by qRT-PCR (Fig. 7). This gene was therefore removed from further discussions.

    Figure 7.  The expression patterns of seven PsAQPs in imbibing seeds as revealed by RNA-Seq and qRT-PCR. The seeds were sampled after 12 h soaking in three different solutions, namely water (W), 0.3 M mannitol (M), and 100 mg/L fullerol dissolved in 0.3 M mannitol (MF3) solution. Error bars are standard errors calculated from three replicates.

    This study used the recently available garden pea genome to perform genome-wide identification of AQPs[35] to help understand their functions in plant growth and development. A total of 39 putative full-length AQPs were found in the garden pea genome, which is very similar to the number of AQPs identified in many other diploid legume crops such as 40 AQPs genes in pigeon pea, chickpea, common bean[7,47,48], and 44 AQPs in Medicago[49]. On the other hand, the number of AQP genes in pea is greater compared to diploid species like rice (34)[4], Arabidopsis thaliana (35)[3], and 32 and 36 in peanut A and B genomes, respectively[8]. Phylogenetic analysis assigned the pea AQPs into all five subfamilies known in plants, whereas the presence of only one XIP in this species seems less than the number in other diploid legumes which have two each in common bean and Medicago[5,48,49]. The functions of the XIP-type AQP will be of particular interest to explore in the future.

    The observed exon-intron structures in pea AQPs were found to be conserved and their phylogenetic distribution often correlated with these structures. Similar exon-intron patterns were seen in PIPs and TIPs subfamily of Arabidopsis, soybean, and tomato[3,6,50]. The two conserved NPA motifs and the four amino acids forming the ar/R SF mostly regulate solute specificity and transport of the substrate across AQPs[47,51]. According to our analysis, all the members of each AQP subfamilies in garden pea showed mostly conserved NPA motifs and a similar ar/R selective filter. Interestingly, most PsPIPs carry double NPA in LB and LE and a hydrophilic ar/R SF (F/H/T/R) as observed in three legumes i.e., common bean[48], soybean[5] chickpea[7], showing their affinity for water transport. All the TIPs of garden pea have double NPA in LB and LE and wide variation at selectivity filters. Most PsTIP1s (1-1, 1-3, 1-4, and 1-7) were found with H-I-A-V ar/R selectivity filter similar to other species such as Medicago, Arachis, and common bean, that are reported to transport water and other small molecules like boron, hydrogen peroxide, urea, and ammonia[52]. Compared with related species, the TIPs residues in the ar/R selectivity filter were very similar to those in common bean[48], Medicago[49], and Arachis[8]. In the present study, the NIPs, NIP1s (1-3, 1-5, 1-6, and1-7), and NIP2-2-2 genes have G-S-G-R selectivity. Interestingly, NIP2s with a G-S-G-R selectivity filter plays an important role in silicon influx (Si) in many plant species such as Soybean and Arachis[6,8]. It was reported that Si accumulation protects plants against various types of biotic and abiotic stresses[53].

    The subcellular localization investigation suggested that most of the PsAQPs were localized to the plasma membrane or vacuolar membrane. The members of the PsPIPs, PsNIPs, and PsXIP subfamilies were mostly located in the plasma membrane, whereas members of the PsTIPs subfamily were often predicted to localize in the vacuolar membrane. Similar situations were reported in many other legumes such as common bean, soybean, and chickpea[5,7,48]. Apart from that, PsSIPs subfamily were predicted to localize to the plasma membrane or vacuolar membrane, and some AQPs were likely to localize in broader subcellular positions such as the nucleus, cytosol, and chloroplast, which indicates that AQPs may be involved in various molecular transport functions.

    AQPs have versatile physiological functions in various plant organs. Analysis of RNA-Seq data showed a moderate to high expression of the PsPIPs in either root or green tissues except for PsPIP2-4, indicating their affinity to water transport. In several other species such as Arachis[8], common bean[48], and Medicago[49], PIPs also were reported to show high expressions and were considered to play an important role to maintain root and leaf hydraulics. Also interestingly, PsTIP2-3 and PsTIP3-2 showed high expressions exclusively in seeds at 5 d after imbibition, indicating their specific roles in seed germination. Earlier, a similar expression pattern for TIP3s was reported in Arabidopsis during the initial phase of seed germination and seed maturation[54], soybean[6], canola[55], and Medicago[49], suggesting that the main role of TIP3s in regulating seed development is conserved across species.

    Carbon nanoparticles such as fullerol have a wide range of potential applications as well as safety concerns in agriculture. Fullerol has been linked to plant protection from oxidative stress by influencing ROS accumulation and activating the antioxidant system in response to drought[56]. The current study revealed that fullerol at an adequate concentration (100 mg/L), had favorable effects on osmotic stress alleviation. In this study, the radical growth of germinating seeds was repressed by the mannitol treatment, and many similar observations have been found in previous studies[57]. Furthermore, mannitol induces ROS accumulation in plants, causing oxidative stress[58]. Our work further validated that the radical growth of germinating seeds were increased during fullerol treatment. Fullerol increased the length of roots and barley seeds, according to Panova et al.[32]. Fullerol resulted in ROS detoxification in seedlings subjected to water stress[32].

    Through transcriptomic profiling and qRT-PCR, several PsAQPs that responded to osmotic stress by mannitol and a combination of mannitol and fullerol were identified. Most of these differentially expressed AQPs belonged to the TIP and NIP subfamilies. (PsTIP2-2, PsTIP2-3, and PsTIP 3-2) showed higher expression by mannitol treatment, which is consistent with the fact that many TIPs in other species such as GmTIP2;3 and Eucalyptus grandis TIP2 (EgTIP2) also showed elevated expressions under osmotic stress[54,59]. The maturation of the vacuolar apparatus is known to be aided by the TIPs, which also enable the best possible water absorption throughout the growth of embryos and the germination of seeds[60]. Here, the higher expression of PsTIP (2-2, 2-3, and 3-2) might help combat water deficiency in imbibing seeds due to osmotic stress. The cellular signals triggering such transcriptional regulation seem to be independent of the antioxidant system because the addition of fullerol didn’t remove such regulation. On the other hand, the mannitol-induced regulation of most PsNIPs were eliminated when fullerol was added, suggesting either a response of these NIPs to the antioxidant signals or being due to the mitigated cellular stress. Based on our experimental data and previous knowledge, we propose that the fullerol-induced up- or down-regulation of specific AQPs belonging to different subfamilies and locating in different subcellular compartments, work coordinatedly with each other, to maintain the water balance and strengthen the tolerance to osmotic stress in germinating pea seeds through reduction of ROS accumulation and enhancement of antioxidant enzyme levels. Uncategorized X intrinsic proteins (XIPs) Aquaporins are multifunctional channels that are accessible to water, metalloids, and ROS.[32,56]. Due likely to PCR bias, the expression data of PsXIP2-1 from qRT-PCR and RNA-Seq analyses didn’t match well, hampering the drawing of a solid conclusion about this gene. Further studies are required to verify and more deeply dissect the functions of each of these PsAQPs in osmotic stress tolerance.

    A total of 39 full-length AQP genes belonging to five sub-families were identified from the pea genome and characterized for their sequences, phylogenetic relationships, gene structures, subcellular localization, and expression profiles. The number of AQP genes in pea is similar to that in related diploid legume species. The RNA-seq data revealed that PsTIP (2-3, 3-2) showed high expression in seeds for 5 d after imbibition, indicating their possible role during the initial phase of seed germination. Furthermore, gene expression profiles displayed that higher expression of PsTIP (2-3, 3-2) in germinating seeds might help maintain water balance under osmotic stress to confer tolerance. Our results suggests that the biological functions of fullerol in plant cells are exerted partly through the interaction with AQPs.

    Under Bio project ID PRJNA793376 at the National Center for Biotechnology Information, raw data of sequencing read has been submitted. The accession numbers for the RNA-seq raw data are stored in GenBank and are mentioned in Supplemental Table S4.

    This study is supported by the National Key Research & Development Program of China (2022YFE0198000) and the Key Research Program of Zhejiang Province (2021C02041).

  • Pei Xu is the Editorial Board member of journal Vegetable Research. He was blinded from reviewing or making decisions on the manuscript. The article was subject to the journal's standard procedures, with peer-review handled independently of this Editorial Board member and his research group.

  • Supplementary Table S1 Genome data used in this study.
    Supplementary Table S2 Source of gene expression data.
    Supplementary Fig. S1 The ML tree of DCLs identified with 1KP transcriptomic data. Branches are color-coded to denote different plant groups: black for rhodophytes, yellow for chlorophytes, red for charophytes, green for ferns and bryophytes, and blue for seed plants.
    Supplementary Fig. S2 The ML tree of AGOs identified with 1KP transcriptomic data. Branches are color-coded to denote different plant groups: black for rhodophytes, yellow for chlorophytes, red for charophytes, green for ferns and bryophytes, and blue for seed plants.
    Supplementary Fig. S3 RNase III domain alignment of four groups of DCL proteins.
    Supplementary Fig. S4 MID domain alignment of three groups of AGOs.
    Supplementary Fig. S5 PAZ domain alignment of three groups of AGOs.
    Supplementary Fig. S6 Expression of DCLs and AGOs in different tissues of F. vesca. (A) Comparative expression profiles of DCL gene family members. (B) Comparative expression profiles of AGO gene family members. Dashed lines demarcate distinct clades, with the heatmap displaying relative expression levels from low (blue) to high (red).
  • [1]

    Liu P, Liu R, Xu Y, Zhang C, Niu Q, et al. 2023. DNA cytosine methylation dynamics and functional roles in horticultural crops. Horticulture Research 10:d170

    doi: 10.1093/hr/uhad170

    CrossRef   Google Scholar

    [2]

    Paudel L, Kerr S, Prentis P, Tanurdžić M, Papanicolaou A, et al. 2022. Horticultural innovation by viral-induced gene regulation of carotenogenesis. Horticulture Research 9:uhab008

    doi: 10.1093/hr/uhab008

    CrossRef   Google Scholar

    [3]

    Shi M, Wang C, Wang P, Yun F, Liu Z, et al. 2023. Role of methylation in vernalization and photoperiod pathway: a potential flowering regulator? Horticulture Research 10:uhad17

    doi: 10.1093/hr/uhad174

    CrossRef   Google Scholar

    [4]

    Cuerda-Gil D, Slotkin RK. 2016. Non-canonical RNA-directed DNA methylation. Nature Plants 2:16163

    doi: 10.1038/nplants.2016.163

    CrossRef   Google Scholar

    [5]

    Margis R, Fusaro AF, Smith NA, Curtin SJ, Watson JM, et al. 2006. The evolution and diversification of Dicers in plants. FEBS Letters 580:2442−50

    doi: 10.1016/j.febslet.2006.03.072

    CrossRef   Google Scholar

    [6]

    Kurihara Y, Watanabe Y. 2004. Arabidopsis micro-RNA biogenesis through Dicer-like 1 protein functions. Proceedings of the National Academy of Sciences of the United States of America 101:12753−58

    doi: 10.1073/pnas.0403115101

    CrossRef   Google Scholar

    [7]

    Jia J, Ji R, Li Z, Yu Y, Nakano M, et al. 2020. Soybean DICER-LIKE2 regulates seed coat color via production of primary 22-nucleotide small interfering RNAs from long inverted repeats. The Plant Cell 32:3662−73

    doi: 10.1105/tpc.20.00562

    CrossRef   Google Scholar

    [8]

    Taochy C, Gursanscky NR, Cao J, Fletcher SJ, Dressel U, et al. 2017. A genetic screen for impaired systemic rnai highlights the crucial role of DICER-LIKE 2. Plant Physiology 175:1424−1437

    doi: 10.1104/pp.17.01181

    CrossRef   Google Scholar

    [9]

    Wu YY, Hou BH, Lee WC, Lu SH, Yang CJ, et al. 2017. DCL2- and RDR6-dependent transitive silencing of SMXL4 and SMXL5 in Arabidopsis dcl4 mutants causes defective phloem transport and carbohydrate over-accumulation. The Plant Journal 90:1064−78

    doi: 10.1111/tpj.13528

    CrossRef   Google Scholar

    [10]

    Matzke MA, Mosher RA. 2014. RNA-directed DNA methylation: an epigenetic pathway of increasing complexity. Nature Reviews Genetics 15:394−408

    doi: 10.1038/nrg3683

    CrossRef   Google Scholar

    [11]

    Wang Q, Xue Y, Zhang L, Zhong Z, Feng S, et al. 2021. Mechanism of siRNA production by a plant Dicer-RNA complex in dicing-competent conformation. Science 374:1152−57

    doi: 10.1126/science.abl4546

    CrossRef   Google Scholar

    [12]

    Liu Y, Teng C, Xia R, Meyers BC. 2020. PhasiRNAs in plants: their biogenesis, genic sources, and roles in stress responses, development, and reproduction. The Plant Cell 32:3059−80

    doi: 10.1105/tpc.20.00335

    CrossRef   Google Scholar

    [13]

    Teng C, Zhang H, Hammond R, Huang K, Meyers BC, Walbot V. 2020. Dicer-like 5 deficiency confers temperature-sensitive male sterility in maize. Nature Communications 11:2912

    doi: 10.1038/s41467-020-16634-6

    CrossRef   Google Scholar

    [14]

    Carbonell A, Carrington JC. 2015. Antiviral roles of plant ARGONAUTES. Current Opinion in Plant Biology 27:111−17

    doi: 10.1016/j.pbi.2015.06.013

    CrossRef   Google Scholar

    [15]

    Fang X, Qi Y. 2016. RNAi in plants: an argonaute-centered view. The Plant Cell 28:272−85

    doi: 10.1105/tpc.15.00920

    CrossRef   Google Scholar

    [16]

    Li Z, Li W, Guo M, Liu S, Liu L, et al. 2022. Origin, evolution and diversification of plant ARGONAUTE proteins. The Plant Journal 109:1086−97

    doi: 10.1111/tpj.15615

    CrossRef   Google Scholar

    [17]

    Zhang H, Xia R, Meyers BC, Walbot V. 2015. Evolution, functions, and mysteries of plant ARGONAUTE proteins. Current Opinion in Plant Biology 27:84−90

    doi: 10.1016/j.pbi.2015.06.011

    CrossRef   Google Scholar

    [18]

    Garcia-Ruiz H, Carbonell A, Hoyer JS, Fahlgren N, Gilbert KB, et al. 2015. Roles and programming of arabidopsis argonaute proteins during Turnip mosaic virus infection. PLOS Pathogens 11:e1004755

    doi: 10.1371/journal.ppat.1004755

    CrossRef   Google Scholar

    [19]

    Wang XB, Jovel J, Udomporn P, Wang Y, Wu Q, et al. 2011. The 21-Nucleotide, but not 22-nucleotide, viral secondary small interfering rnas direct potent antiviral defense by two cooperative argonautes in Arabidopsis thaliana. The Plant Cell 23:1625−38

    doi: 10.1105/tpc.110.082305

    CrossRef   Google Scholar

    [20]

    Brosseau C, Moffett P. 2015. Functional and genetic analysis identify a role for arabidopsis argonaute5 in antiviral RNA silencing. The Plant Cell 27:1742−54

    doi: 10.1105/tpc.15.00264

    CrossRef   Google Scholar

    [21]

    Tucker MR, Okada T, Hu Y, Scholefield A, Taylor JM, et al. 2012. Somatic small RNA pathways promote the mitotic events of megagametogenesis during female reproductive development in Arabidopsis. Development 139:1399−404

    doi: 10.1242/dev.075390

    CrossRef   Google Scholar

    [22]

    Yu Y, Ji L, Le BH, Zhai J, Chen J, et al. 2021. Correction: ARGONAUTE10 promotes the degradation of miR165/6 through the SDN1 and SDN2 exonucleases in Arabidopsis. PLOS Biology 19:e3001120

    doi: 10.1371/journal.pbio.3001120

    CrossRef   Google Scholar

    [23]

    Zhu H, Hu F, Wang R, Zhou X, Sze SH, et al. 2011. Arabidopsis argonaute10 specifically sequesters MIR166/165 to regulate shoot apical meristem development. Cell 145:242−56

    doi: 10.1016/j.cell.2011.03.024

    CrossRef   Google Scholar

    [24]

    Gao M, Wei W, Li MM, Wu YS, Ba Z, et al. 2014. Ago2 facilitates Rad51 recruitment and DNA double-strand break repair by homologous recombination. Cell Research 24:532−41

    doi: 10.1038/cr.2014.36

    CrossRef   Google Scholar

    [25]

    Schuck J, Gursinsky T, Pantaleo V, Burgyán J, Behrens SE. 2013. AGO/RISC-mediated antiviral RNA silencing in a plant in vitro system. Nucleic Acids Research 41:5090−103

    doi: 10.1093/nar/gkt193

    CrossRef   Google Scholar

    [26]

    Zhang X, Zhao H, Gao S, Wang WC, Katiyar-Agarwal S, et al. 2011. Arabidopsis Argonaute 2 regulates innate immunity via miRNA393-mediated silencing of a golgi-localized SNARE gene, MEMB12. Molecular Cell 42:356−66

    doi: 10.1016/j.molcel.2011.04.010

    CrossRef   Google Scholar

    [27]

    Zhang Z, Liu X, Guo X, Wang XJ, Zhang X. 2016. Arabidopsis AGO3 predominantly recruits 24-nt small RNAs to regulate epigenetic silencing. Nature Plants 2:16049

    doi: 10.1038/nplants.2016.49

    CrossRef   Google Scholar

    [28]

    Howell MD, Fahlgren N, Chapman EJ, Cumbie JS, Sullivan CM, et al. 2007. Genome-wide analysis of the RNA-DEPENDENT RNA POLYMERASE6/DICER-LIKE4 pathway in Arabidopsis reveals dependency on miRNA- and tasiRNA-directed targeting. The Plant Cell 19:926−42

    doi: 10.1105/tpc.107.050062

    CrossRef   Google Scholar

    [29]

    Duan CG, Zhang H, Tang K, Zhu X, Qian W, et al. 2014. Specific but interdependent functions for Arabidopsis AGO4 and AGO6 in RNA-directed DNA methylation. The EMBO Journal 34:581−92

    doi: 10.15252/embj.201489453

    CrossRef   Google Scholar

    [30]

    Olmedo-Monfil V, Durán-Figueroa N, Arteaga-Vázquez M, Demesa-Arévalo E, Autran D, et al. 2010. Control of female gamete formation by a small RNA pathway in Arabidopsis. Nature 464:628−32

    doi: 10.1038/nature08828

    CrossRef   Google Scholar

    [31]

    Zheng X, Zhu J, Kapoor A, Zhu JK. 2007. Role of Arabidopsis AGO6 in siRNA accumulation, DNA methylation and transcriptional gene silencing. The EMBO Journal 26:1691−701

    doi: 10.1038/sj.emboj.7601603

    CrossRef   Google Scholar

    [32]

    Hernández-Lagana E, Rodríguez-Leal D, Lúa J, Vielle-Calzada J. 2016. A multigenic network of argonaute4 clade members controls early megaspore formation in Arabidopsis. Genetics 204:1045−56

    doi: 10.1534/genetics.116.188151

    CrossRef   Google Scholar

    [33]

    Bélanger S, Zhan J, Meyers BC. 2023. Phylogenetic analyses of seven protein families refine the evolution of small RNA pathways in green plants. Plant Physiology 192:1183−203

    doi: 10.1093/plphys/kiad141

    CrossRef   Google Scholar

    [34]

    Wang S, Liang H, Xu Y, Li L, Wang H, et al. 2021. Genome-wide analyses across Viridiplantae reveal the origin and diversification of small RNA pathway-related genes. Communications Biology 4:412

    doi: 10.1038/s42003-021-01933-5

    CrossRef   Google Scholar

    [35]

    Li S, Wei L, Gao Q, Xu M, Wang Y, et al. 2024. Molecular and phylogenetic evidence of parallel expansion of anion channels in plants. Plant Physiology 194:2533−48

    doi: 10.1093/plphys/kiad687

    CrossRef   Google Scholar

    [36]

    Su L, Zhang T, Yang B, Dong T, Liu X, et al. 2023. Different evolutionary patterns of TIR1/AFBs and AUX/IAAs and their implications for the morphogenesis of land plants. BMC Plant Biology 23:265

    doi: 10.1186/s12870-023-04253-4

    CrossRef   Google Scholar

    [37]

    Wu Y, Wen J, Xia Y, Zhang L, Du H. 2022. Evolution and functional diversification of R2R3-MYB transcription factors in plants. Horticulture Research 9:uhac058

    doi: 10.1093/hr/uhac058

    CrossRef   Google Scholar

    [38]

    Nishiyama T, Sakayama H, de Vries J, Buschmann H, Saint-Marcoux D, et al. 2018. The chara genome: secondary complexity and implications for plant terrestrialization. Cell 174:448−64

    doi: 10.1016/j.cell.2018.06.033

    CrossRef   Google Scholar

    [39]

    Rensing SA. 2018. Great moments in evolution: the conquest of land by plants. Current Opinion in Plant Biology 42:49−54

    doi: 10.1016/j.pbi.2018.02.006

    CrossRef   Google Scholar

    [40]

    Alaba S, Piszczalka P, Pietrykowska H, Pacak AM, Sierocka I, et al. 2015. The liverwort Pellia endiviifolia shares microtranscriptomic traits that are common to green algae and land plants. New Phytologist 206:352−67

    doi: 10.1111/nph.13220

    CrossRef   Google Scholar

    [41]

    Axtell MJ, Snyder JA, Bartel DP. 2007. Common functions for diverse small RNAs of land plants. The Plant Cell 19:1750−69

    doi: 10.1105/tpc.107.051706

    CrossRef   Google Scholar

    [42]

    Fattash I, Voß B, Reski R, Hess WR, Frank W. 2007. Evidence for the rapid expansion of microRNA-mediated regulation in early land plant evolution. BMC Plant Biology 7:13

    doi: 10.1186/1471-2229-7-13

    CrossRef   Google Scholar

    [43]

    Lin PC, Lu CW, Shen BN, Lee GZ, Bowman JL, et al. 2016. Identification of miRNAs and their targets in the liverwort Marchantia polymorpha by integrating RNA-Seq and degradome analyses. Plant and Cell Physiology 57:339−58

    doi: 10.1093/pcp/pcw020

    CrossRef   Google Scholar

    [44]

    Dong Q, Hu B, Zhang C. 2022. MicroRNAs and their roles in plant development. Frontiers in Plant Science 13:824240

    doi: 10.3389/fpls.2022.824240

    CrossRef   Google Scholar

    [45]

    Zhan J, Meyers BC. 2023. Plant Small RNAs: Their biogenesis, regulatory roles, and functions. Annual Review of Plant Biology 74:21−51

    doi: 10.1146/annurev-arplant-070122-035226

    CrossRef   Google Scholar

    [46]

    Conant GC, Birchler JA, Pires JC. 2014. Dosage, duplication, and diploidization: clarifying the interplay of multiple models for duplicate gene evolution over time. Current Opinion in Plant Biology 19:91−98

    doi: 10.1016/j.pbi.2014.05.008

    CrossRef   Google Scholar

    [47]

    Liu S, Liu Y, Yang X, Tong C, Edwards D, et al. 2014. The Brassica oleracea genome reveals the asymmetrical evolution of polyploid genomes. Nature Communications 5:3930

    doi: 10.1038/ncomms4930

    CrossRef   Google Scholar

    [48]

    Panchy N, Lehti-Shiu M, Shiu SH. 2016. Evolution of gene duplication in plants. Plant Physiology 171:2294−316

    doi: 10.1104/pp.16.00523

    CrossRef   Google Scholar

    [49]

    He S, Feng X. 2022. DNA methylation dynamics during germline development. Journal of Integrative Plant Biology 64:2240−51

    doi: 10.1111/jipb.13422

    CrossRef   Google Scholar

    [50]

    Melnyk CW, Molnar A, Bassett A, Baulcombe DC. 2011. Mobile 24 nt small RNAs direct transcriptional gene silencing in the root meristems of Arabidopsis thaliana. Current Biology 21:1678−83

    doi: 10.1016/j.cub.2011.08.065

    CrossRef   Google Scholar

    [51]

    Nielsen CPS, Arribas-Hernández L, Han L, Reichel M, Woessmann J, et al. 2024. Evidence for an RNAi-independent role of Arabidopsis DICER-LIKE2 in growth inhibition and basal antiviral resistance. The Plant Cell 36:2289−309

    doi: 10.1093/plcell/koae067

    CrossRef   Google Scholar

    [52]

    Parent JS, Bouteiller N, Elmayan T, Vaucheret H. 2015. Respective contributions of Arabidopsis DCL2 and DCL4 to RNA silencing. The Plant Journal 81:223−32

    doi: 10.1111/tpj.12720

    CrossRef   Google Scholar

    [53]

    Wu H, Li B, Iwakawa HO, Pan Y, Tang X, et al. 2020. Plant 22-nt siRNAs mediate translational repression and stress adaptation. Nature 581:89−93

    doi: 10.1038/s41586-020-2231-y

    CrossRef   Google Scholar

    [54]

    Havecker ER, Wallbridge LM, Hardcastle TJ, Bush MS, Kelly KA, et al. 2010. The Arabidopsis RNA-directed dna methylation argonautes functionally diverge based on their expression and interaction with target loci. The Plant Cell 22:321−34

    doi: 10.1105/tpc.109.072199

    CrossRef   Google Scholar

    [55]

    Ortiz-Vasquez Q, León-Martínez G, Barragán-Rosillo C, González-Orozco E, Deans S, et al. 2023. Genomic methylation patterns in pre-meiotic gynoecia of wild-type and RdDM mutants of Arabidopsis. Frontiers in Plant Science 14:1123211

    doi: 10.3389/fpls.2023.1123211

    CrossRef   Google Scholar

    [56]

    He F, Xu C, Fu X, Shen Y, Guo L, et al. 2018. The MicroRNA390/TRANS-ACTING SHORT INTERFERING RNA3 module mediates lateral root growth under salt stress via the auxin pathway. Plant Physiology 177:775−91

    doi: 10.1104/pp.17.01559

    CrossRef   Google Scholar

    [57]

    Yin W, Xiao Y, Niu M, Meng W, Li L, et al. 2020. ARGONAUTE2 enhances grain length and salt tolerance by activating BIG GRAIN3 to modulate cytokinin distribution in rice. The Plant Cell 32:2292−306

    doi: 10.1105/tpc.19.00542

    CrossRef   Google Scholar

    [58]

    Birchler JA, Yang H. 2022. The multiple fates of gene duplications: Deletion, hypofunctionalization, subfunctionalization, neofunctionalization, dosage balance constraints, and neutral variation. The Plant Cell 34:2466−74

    doi: 10.1093/plcell/koac076

    CrossRef   Google Scholar

    [59]

    Paysan-Lafosse T, Blum M, Chuguransky S, Grego T, Pinto BL, et al. 2023. InterPro in 2022. Nucleic Acids Research 51:D418−D427

    doi: 10.1093/nar/gkac993

    CrossRef   Google Scholar

    [60]

    Price MN, Dehal PS, Arkin AP. 2010. FastTree 2 - approximately maximum-likelihood trees for large alignments. PLoS One 5:e9490

    doi: 10.1371/journal.pone.0009490

    CrossRef   Google Scholar

    [61]

    Minh BQ, Schmidt HA, Chernomor O, Schrempf D, Woodhams MD, et al. 2020. IQ-TREE 2: new models and efficient methods for phylogenetic inference in the genomic era. Molecular Biology and Evolution 37:1530−34

    doi: 10.1093/molbev/msaa015

    CrossRef   Google Scholar

    [62]

    Tang H, Bowers JE, Wang X, Ming R, Alam M, et al. 2008. Synteny and collinearity in plant genomes. Science 320:486−88

    doi: 10.1126/science.1153917

    CrossRef   Google Scholar

    [63]

    Chen C, Chen H, Zhang Y, Thomas HR, Frank MH, et al. 2020. TBtools: an integrative toolkit developed for interactive analyses of big biological data. Molecular Plant 13:1194−202

    doi: 10.1016/j.molp.2020.06.009

    CrossRef   Google Scholar

  • Cite this article

    Su LY, Li SS, Liu H, Cheng ZM, Xiong AS. 2024. The origin, evolution, and functional divergence of the Dicer-like (DCL) and Argonaute (AGO) gene families in plants. Epigenetics Insights 17: e003 doi: 10.48130/epi-0024-0005
    Su LY, Li SS, Liu H, Cheng ZM, Xiong AS. 2024. The origin, evolution, and functional divergence of the Dicer-like (DCL) and Argonaute (AGO) gene families in plants. Epigenetics Insights 17: e003 doi: 10.48130/epi-0024-0005

Figures(6)

Article Metrics

Article views(980) PDF downloads(214)

ARTICLE   Open Access    

The origin, evolution, and functional divergence of the Dicer-like (DCL) and Argonaute (AGO) gene families in plants

Epigenetics Insights  17 Article number: e003  (2024)  |  Cite this article

Abstract: Dicer-like (DCL) and Argonaute (AGO) proteins play a crucial role in plant epigenetics. However, the evolutionary origins and roles of these gene families in plant adaptation, stress response, and development remain unclear. This study explores the origin and functional evolution of DCLs and AGOs across 36 plant species spanning diverse taxonomic groups. Member identification, phylogenetic analysis, evolutionary trajectory analysis, and functional divergence analysis were conducted. The results show that the DCL and AGO originated in Rhodophytes and underwent two major expansions: during algal terrestrialization and the transition from lower to higher plants. In seed plants, DCLs diversified into four classes following two whole-genome duplication (WGD) events, whereas AGOs diversified into seven classes through two WGD events and one tandem duplication event. Expression analyses in Physcomitrium patens, Zea mays, Arabidopsis thaliana, and Fragaria vesca revealed high expression of these gene families in reproductive tissues, with notably lower expression in pollen. Additionally, the expression of these genes exhibits different responses to various environmental stresses in A. thaliana and Z. mays, highlighting their important roles in adaptation to environmental fluctuations. The present research reveals the functional diversification of DCLs and AGOs and their crucial roles in facilitating terrestrial adaptation and rapid land colonization.

    • Epigenetics refers to heritable changes in gene expression that do not alter the DNA sequence but affect gene activity, such as DNA methylation, histone modifications, and non-coding RNAs. In plants, the dicer-like (DCL) and argonaute (AGO) gene families not only participate in non-coding RNA production and function but also in RNA-directed DNA methylation (RdDM)[13]. RNA interference (RNAi) is a critical biological process that involves both post-transcriptional gene silencing (PTGS) and transcriptional gene silencing (TGS) mediated by small RNAs. This process begins with the generation of small RNAs, which are then incorporated into the RNA-induced silencing complex (RISC). The generation of mature small RNAs (sRNAs) is primarily facilitated by DCL proteins, whereas the AGO proteins play a pivotal role as carriers, guiding sRNAs to recognize and base-pair with target mRNA sequences, ultimately regulating gene expression[2]. Beyond transcriptional and post-transcriptional silencing, DNA methylation represents another critical regulatory mechanism in various plant growth and developmental processes[1,3]. RdDM, often referred to as the canonical RdDM pathway, is a widespread epigenetic regulatory mechanism in plants. Both canonical and non-canonical RdDM pathways heavily rely on the functions of DCLs and AGOs[4].

      DCLs function as molecular factories for processing plants small RNAs (sRNAs), serving highly conserved roles across plant biology. These proteins typically contain several domains, including DExD, Helicase-C, DUF283, PAZ, RNase III, and dsRNA-binding, all belonging to the ribonuclease III family[5]. The Arabidopsis thaliana (A. thaliana) genome contains four DCL genes, designated as DCL1 through DCL4, each playing a unique role in RNA silencing and plant physiological responses. For example, DCL1 is primarily responsible for the biogenesis of microRNAs, indirectly affecting normal plant development and environmental adaptation[6]. DCL2 mainly produces small interfering RNAs (siRNAs), which are crucial for plant defense mechanisms and developmental processes[79]. DCL3 is predominantly involved in the synthesis of 24-nucleotide siRNAs and is essential for the RdDM pathway, maintenance of genomic stability, regulation of gene expression, and responses to environmental stimuli[10,11]. DCL4 produces 21-nucleotide siRNAs, which play key roles in post-transcriptional gene silencing, especially in antiviral defense mechanisms[12]. Additionally, DCL5 (previously known as DCL3b) is found in monocots; it enhances the activity of DCL3 and plays a specialized role in reproductive processes[13].

      In plants, the AGO family genes interact with sRNAs to form RISC, which act as specific regulators of gene expression across various biological processes. AGO proteins modulate gene expression through several mechanisms including transcript cleavage, suppression of PTGS, and influencing DNA methylation through RdDM, along with other specialized functions[14,15]. The AGO family exhibits significant evolutionary diversity and can be categorized into three main phylogenetic groups: AGO1/5/10, AGO2/3/7, and AGO4/6/8/9[16,17]. AGO1 is a widely expressed member that plays a central role in multiple sRNA-mediated silencing pathways, especially those associated with PTGS[18,19]. The function of AGO5 is less well understood but it is thought to be involved in gene silencing during viral infections[20,21]. AGO10 selectively binds to 21-nt siRNAs and is involved in transcriptional gene silencing pathways[22,23]. AGO2 is recognized for its role in defense against viruses, it also binds to 21-nt siRNAs to participate in PTGS[2426]. AGO3 and AGO7, despite being phylogenetically close to AGO2, display functional divergence—AGO3 binds to 24-nt siRNAs and primarily participates in RdDM to maintain genomic and transposon stability[27], whereas AGO7 interacts with miR390 to trigger the production of trans-acting siRNAs from TAS3 transcripts[28]. AGO4, a core component of the RdDM pathway, guides 24-nt siRNAs to DNA sites to promote DNA methylation, thereby silencing their target genes[1]. AGO6 shares functional similarities with AGO4, often acting as its functional complement. Additionally, AGO9 has been shown to also participate in RdDM[2931]. The specific roles of AGO8 and its associated siRNAs remain unclear. However, AGO8, along with its paralogs AGO4, AGO6, and AGO9, is crucial for early megaspore formation[30,32].

      Although extensive research has detailed the evolution and function of DCLs and AGOs in plants, most studies have focused on their classification and diversity, with less attention given to their potential functional divergence during evolution[33,34]. In the present study, the distribution, evolution, and expansion of DCLs and AGOs were examined across a wide range of species. By constructing phylogenetic trees, their possible evolutionary trajectories within angiosperms were inferred. Their expression profiles were further analyzed in various tissues and under different stress conditions to explore the potential functions of these two gene families. The findings significantly advance the understanding of the functional evolution of DCLs and AGOs in angiosperms, and offer valuable insights that could inform future breeding strategies aimed at developing improved plant varieties.

    • To investigate the origins and evolutionary histories of DCL and AGO genes in plants, this study used Arabidopsis DCL and AGO genes as seed sequences. BLAST software was employed to identify homologous sequences in 36 plant species, spanning groups such as rhodophytes, chlorophytes, charophytes, bryophytes, ferns, gymnosperms, basal angiosperms, monocots, and eudicots. Additional validation with InterProScan confirmed the presence of requisite domains in the identified sequences. This screening process resulted in the identification of 113 DCLs and 334 AGOs across the 36 species.

      To delineate the evolutionary relationships among the DCL and AGO genes, phylogenetic trees were constructed using the maximum likelihood method. The phylogenetic analysis of DCLs revealed two main branches, which can be further divided into four clades (Fig. 1a). This tree suggests that the DCL genes originated in rhodophytes and remained relatively stable in chlorophytes and charophytes. Notably, a significant expansion of DCLs occurred in bryophytes, marked by the emergence of the DCL1, DCL3, and DCL4 clades, with seed plants exhibiting widespread representation across all four clades. The AGO gene family tree consists of three main branches and seven clades (Fig. 1b), with phylogenetic evidence indicating that the ancestors of the AGO4/6/8/9 and AGO2/3/7 groups were present in algae. These genes underwent further expansion in bryophytes and ferns and fully evolved in seed plants. Taken together, these results highlight a largely consistent evolutionary history for DCLs and AGOs, suggesting synchronous evolution among these gene families. Additionally, the identification of DCL and AGO members were expanded using transcriptome-based gene annotations from the 1KP database, which covers over 1,000 plant species (Supplementary Figs S1 & S2). The results from this broader analysis are consistent with those derived from the initial 36 species. Based on sequence homology and phylogenetic insights, the origins and evolutionary trajectories of the DCL and AGO gene families across various plant lineages have been inferred, providing a comprehensive overview of their development through evolutionary history.
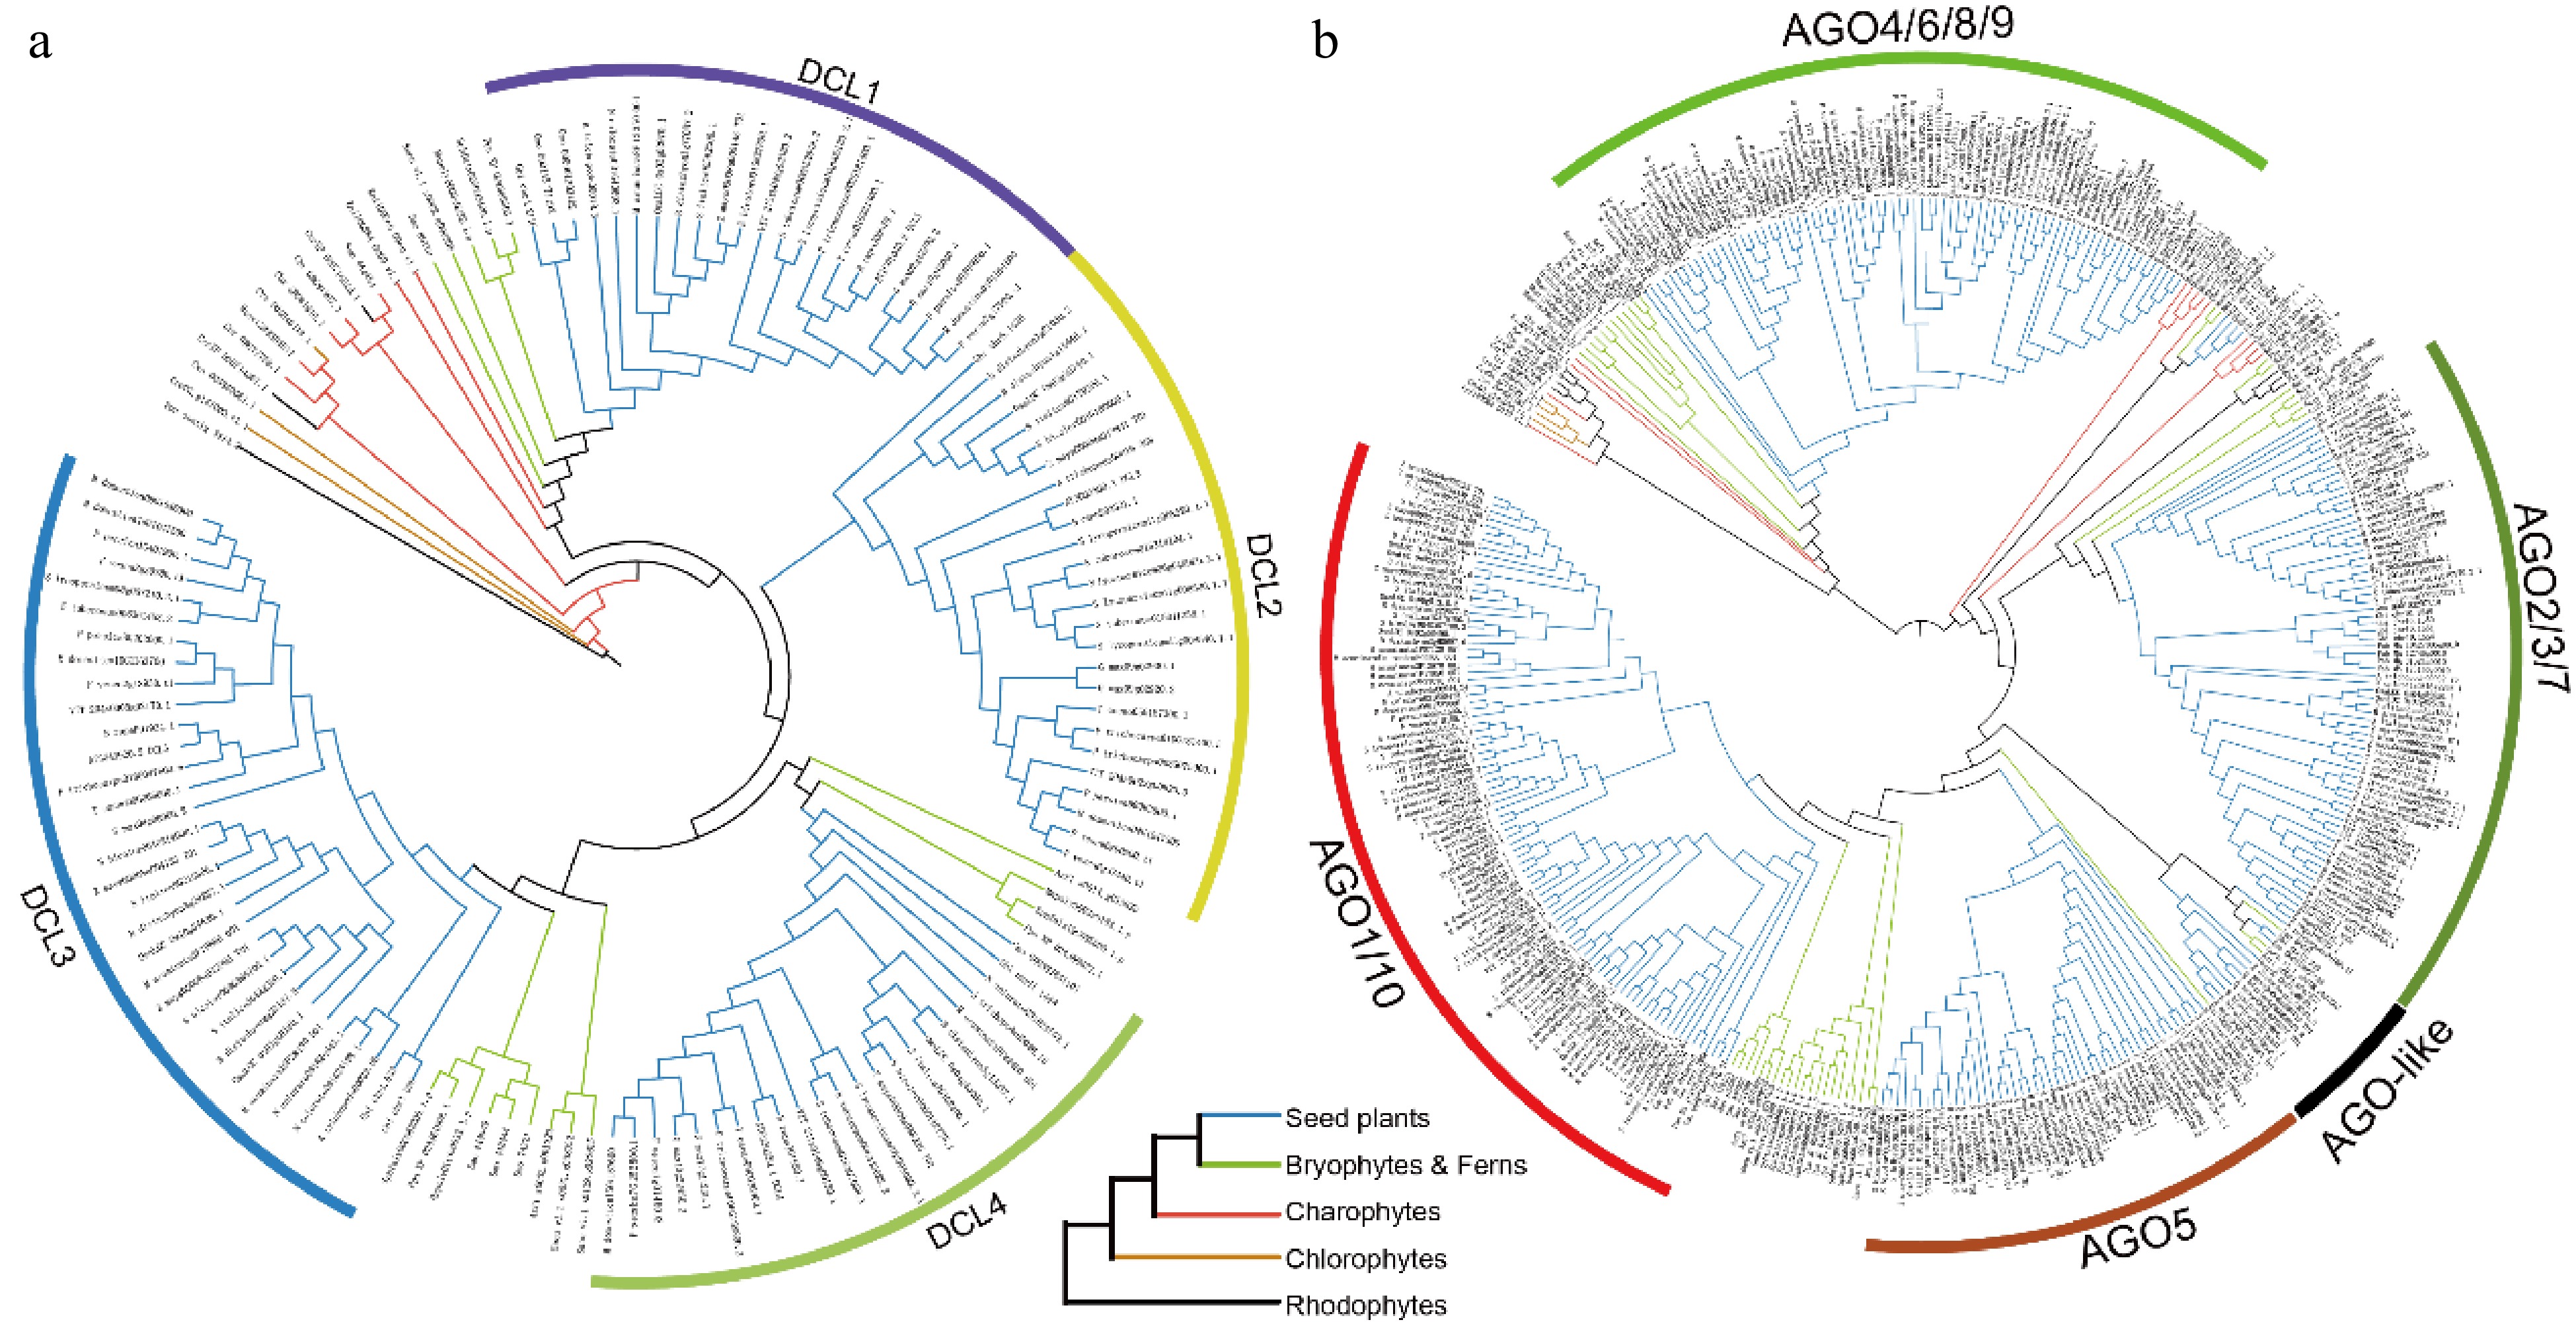
      Figure 1. 

      Phylogenetic trees of the (a) DCL, and (b) AGO gene families across 36 plant species. Branches are color-coded to denote different plant groups: black for rhodophytes, yellow for chlorophytes, red for charophytes, green for ferns and bryophytes, and blue for seed plants.

      Multiple sequence alignments of sRNA-related functional domains in DCLs and AGOs were performed. Overall, the RNase III domains of DCLs in all four branches are highly conserved at both the C- and N-termini. Additionally, there are variations among the RNase III domains between different branches, with those in higher plants being more conserved (Supplementary Fig. S3). This conservation may reflect adaptations to diverse environmental pressures through more sophisticated RNA regulatory mechanisms, leading to the synthesis of a wider variety of sRNAs. Furthermore, we aligned the MID and PAZ domains of AGOs across different branches. Members of the AGO2/3/7 and AGO4/6/8/9 branches have largely lost the MID domain, and those that retain it show less conservation. In contrast, the AGO1/5/10 branch retains a highly conserved MID domain (Supplementary Fig. S4). Similarly, the PAZ domain shows significant differences among branches, with high conservation in the AGO1/5/10 branch, including in lower plants, while the other two branches exhibit lower conservation (Supplementary Fig. S5). Highly conserved MID and PAZ domains are typically associated with fundamental miRNA processing, whereas less conserved domains may relate to specific functional requirements and adaptive changes.

      In plants, the copy number of DCL genes does not appreciably vary across different evolutionary branches (Fig. 2), ranging from 25 to 40 across the four groups and predominantly existing as single-copy genes throughout plant evolution. The primary factor influencing this gene copy number variation among different plants is attributed to whole-genome duplication (WGD) events during specific evolutionary processes. By contrast, the copy number of AGO genes exhibit considerable variation across branches. Specifically, the major clades of AGO4/6/8/9, AGO2/3/7, and AGO1/5/10 contain 95, 93, and 173 genes, respectively (Fig. 2). The number of AGO genes notably exceeds that of DCL genes and shows diversification into more clades, suggesting that the AGO genes are more frequently retained during duplication events. Additionally, AGO4 and AGO6, which encode key enzymes in plant methylation through siRNA processing were analyzed separately (Fig. 2). Results show that AGO4 is prevalent in basal angiosperms, whereas AGO6 is restricted to monocots and dicots. Based on these findings, it is hypothesized that the evolution of AGO4 and AGO6 may be linked to significant shifts in reproductive strategies and the development of floral organs during the transition from gymnosperms to angiosperms. Given the unique and critical roles of AGO4 and AGO6 in methylation processes, the expansion and loss of these genes was investigated within the AGO4/6/8/9 clade across 36 species (Fig. 3). Phylogenetic analysis reveals that these genes exist as single copies in algae, ferns, gymnosperms, and basal angiosperms. Following the ε duplication event, both AGO4 and AGO6 were retained in embryophytes. Unlike AGO6, which did not undergo significant expansion after its formation, AGO4 experienced multiple duplication events. In the Brassicaceae, the α and β duplication events led to the emergence of AGO8 and AGO9. Similarly, duplication events in crops such as potatoes, tomatoes, and monocots also contributed to the expansion of AGO4.
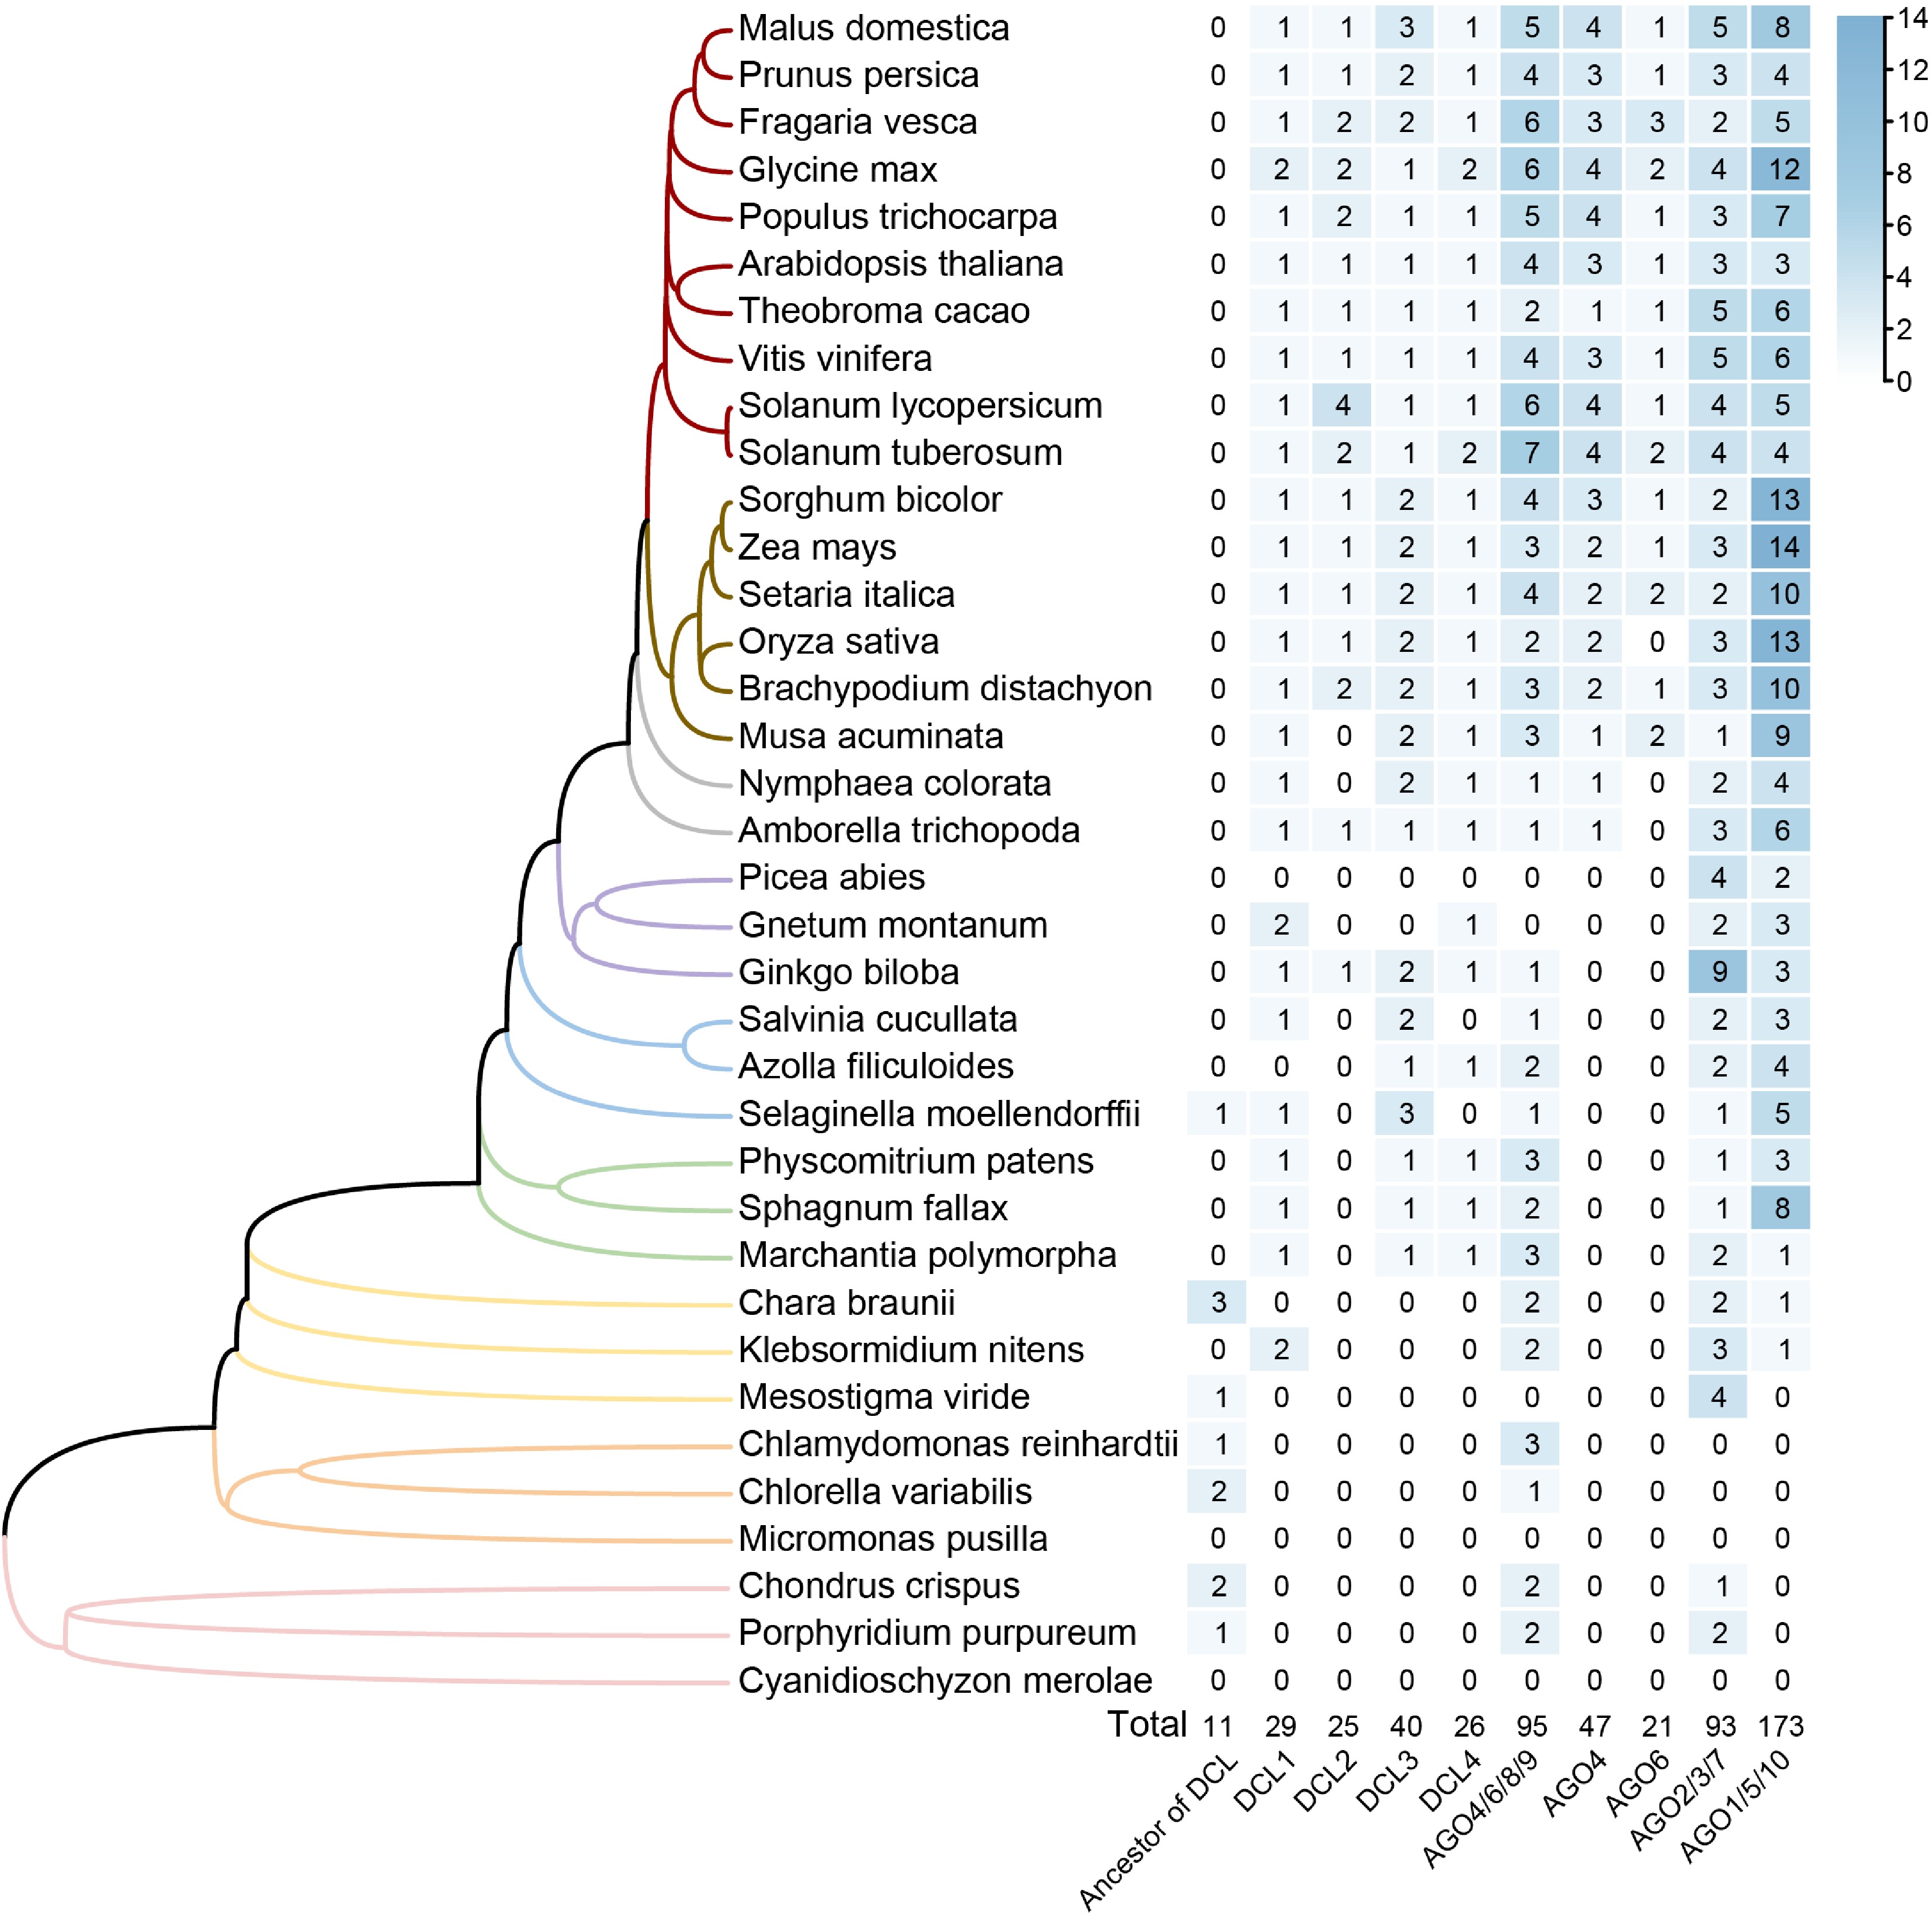
      Figure 2. 

      Phylogenetic distribution and gene copy number analysis of DCL and AGO gene families across 36 plant species. The phylogenetic tree on the left represents the evolutionary relationships of species investigated, with branches colored to represent different groups. The heatmap on the right displays gene copy numbers for each clade of gene family across the species, with higher numbers represented by darker shades. The total counts for each clade across all species are provided at the bottom of the heatmap.
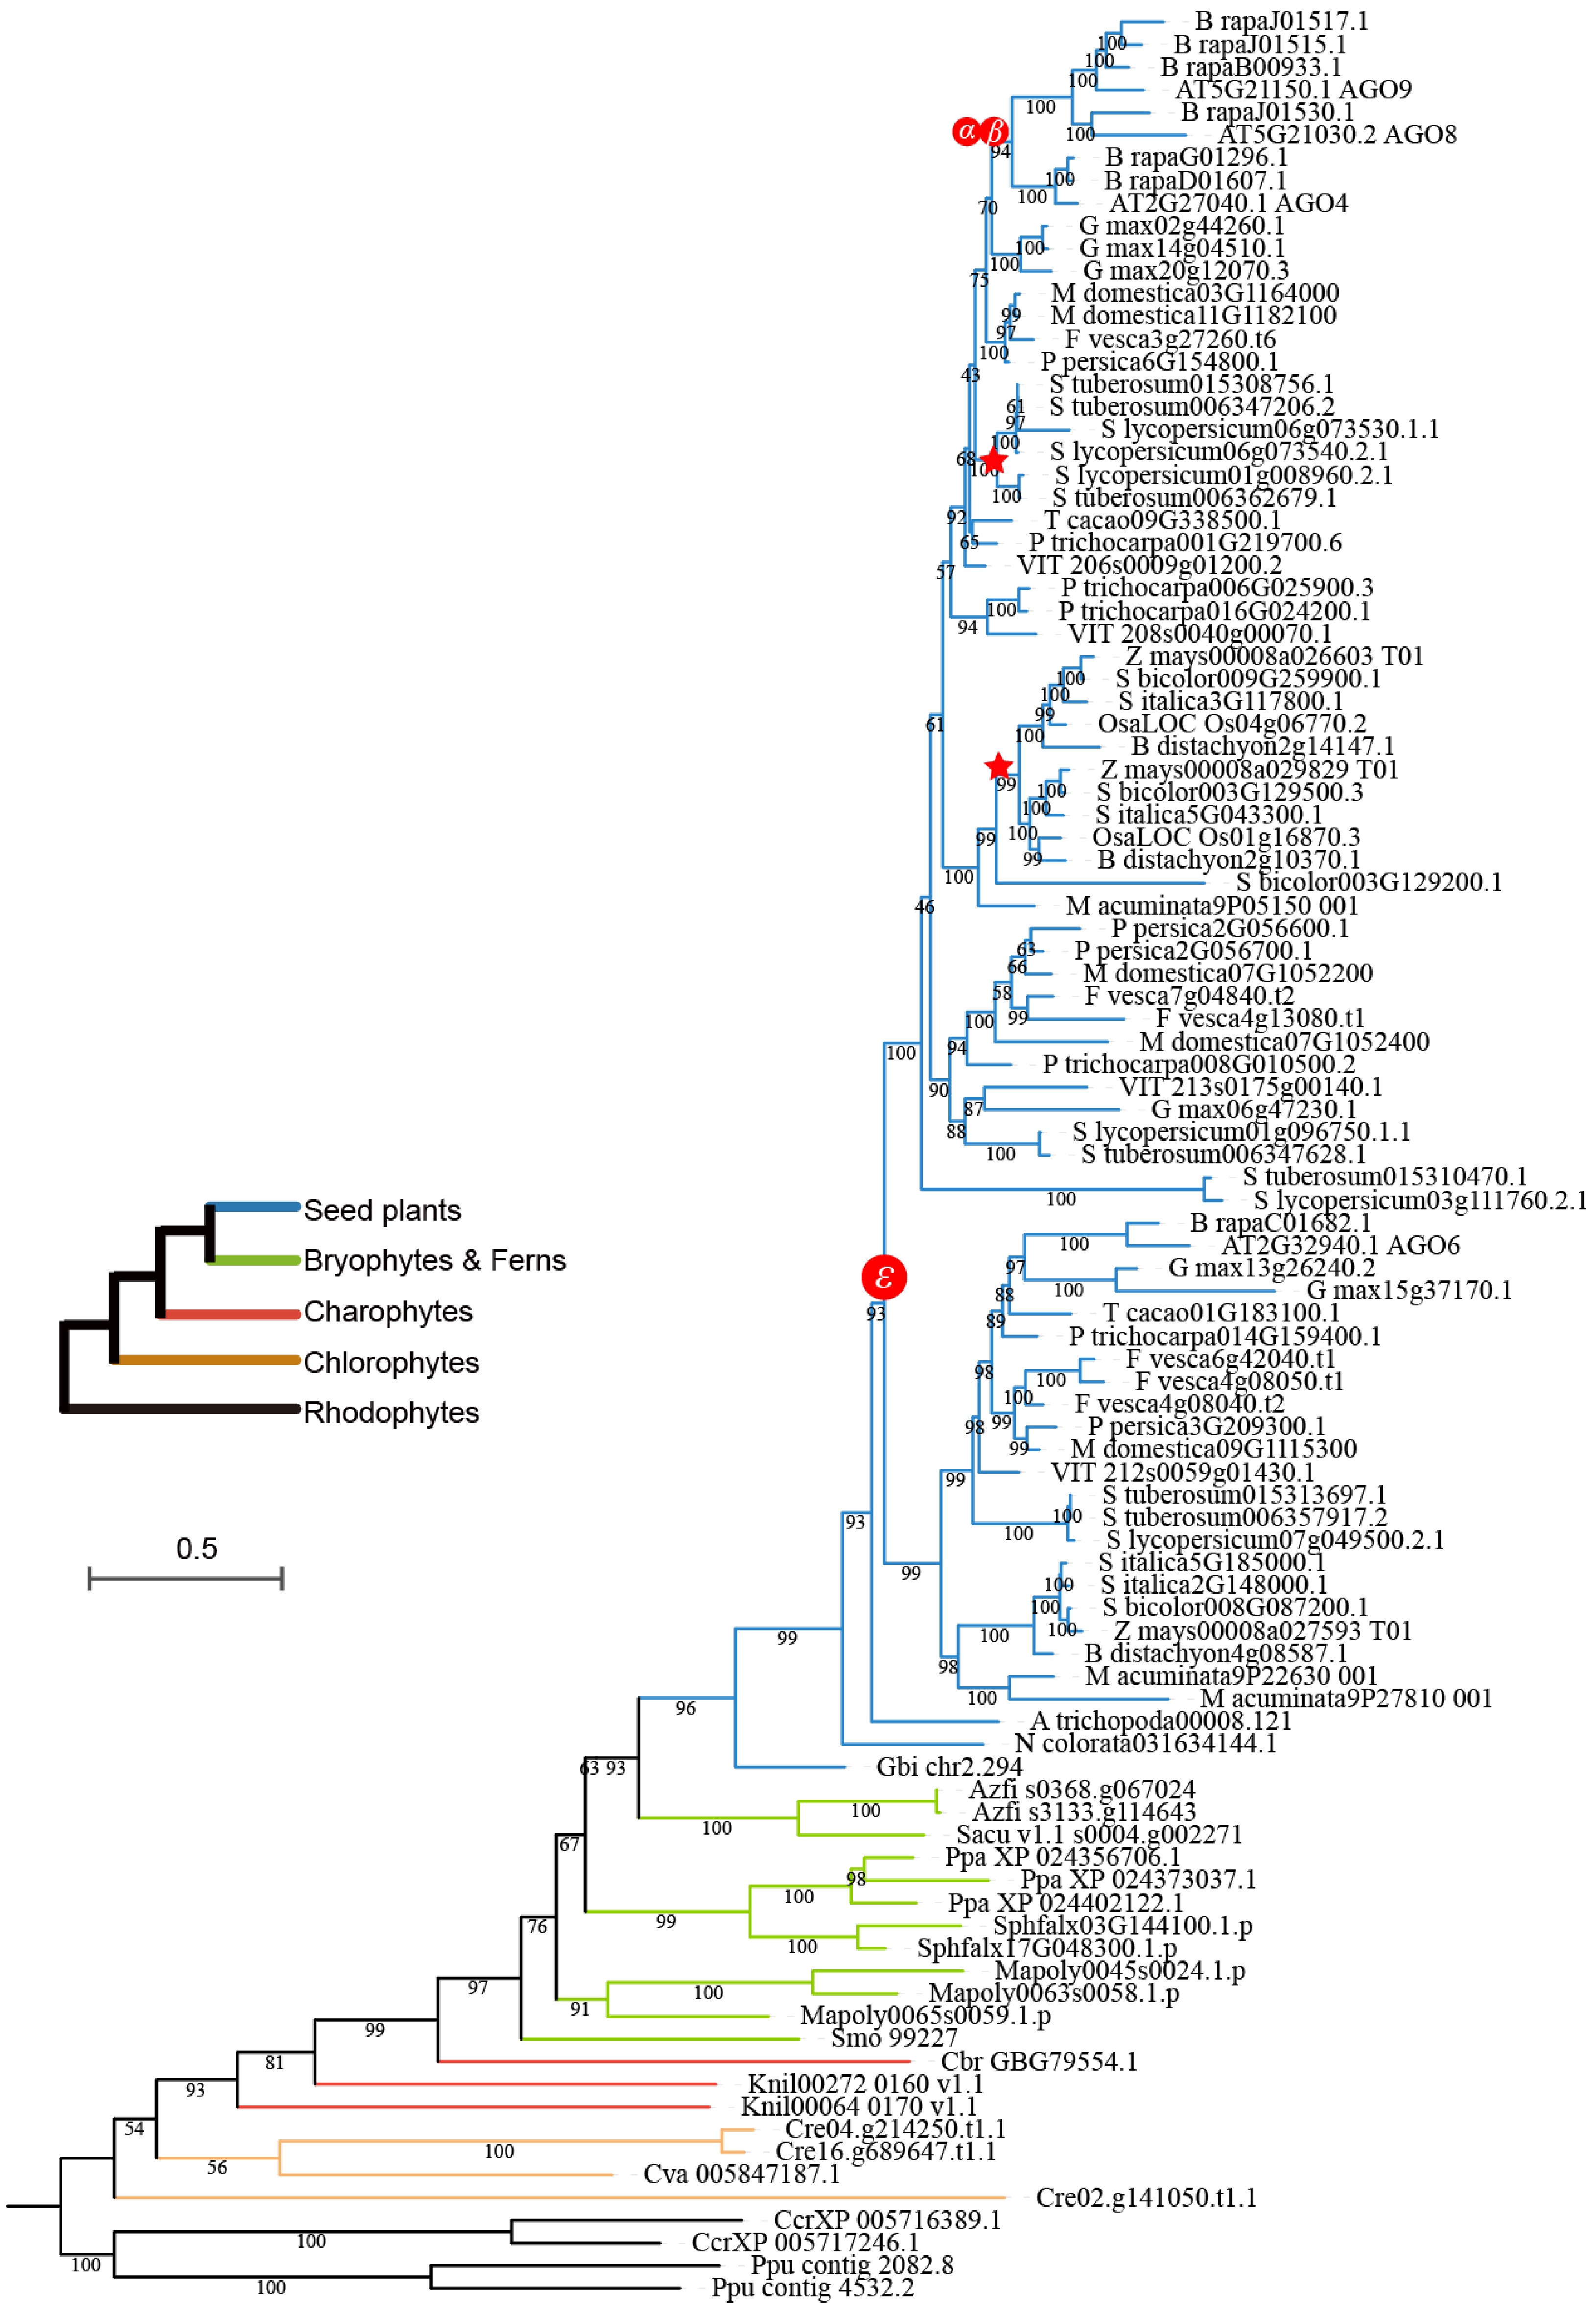
      Figure 3. 

      Phylogeny of the AGO4/6/8/9 clade within the AGO gene family. Different colored branches represent distinct plant groups. The symbols ε, α, and β represent the epsilon angiosperm-wide WGD event, the alpha duplication event, and the beta duplication event, respectively. Red stars along the branches indicate specific whole-genome duplication events.

    • To elucidate the evolutionary differences between DCLs and AGOs in plants, a collinearity network analysis was conducted on 18 plants, including both monocots and dicots, based on their phylogenetic relationships. The analysis identified 542 syntenic gene pairs, grouping the DCL genes into four clusters that represent four distinct evolutionary trajectories. Additionally, four WGD events and three tandem duplication pairs were detected in apple, soybean, and tomato, suggesting lineage-specific expansions of the DCLs during evolution (Fig. 4a). Therefore, we integrated both phylogenetic and collinearity data were integrated (Fig. 4b) and the evolutionary history of DCL genes was reconstructed. It is proposed that two ancestral DCL genes existed before the emergence of seed plants, which subsequently underwent two WGD events. This process resulted in the loss of three branches, leaving four extant DCL groups.
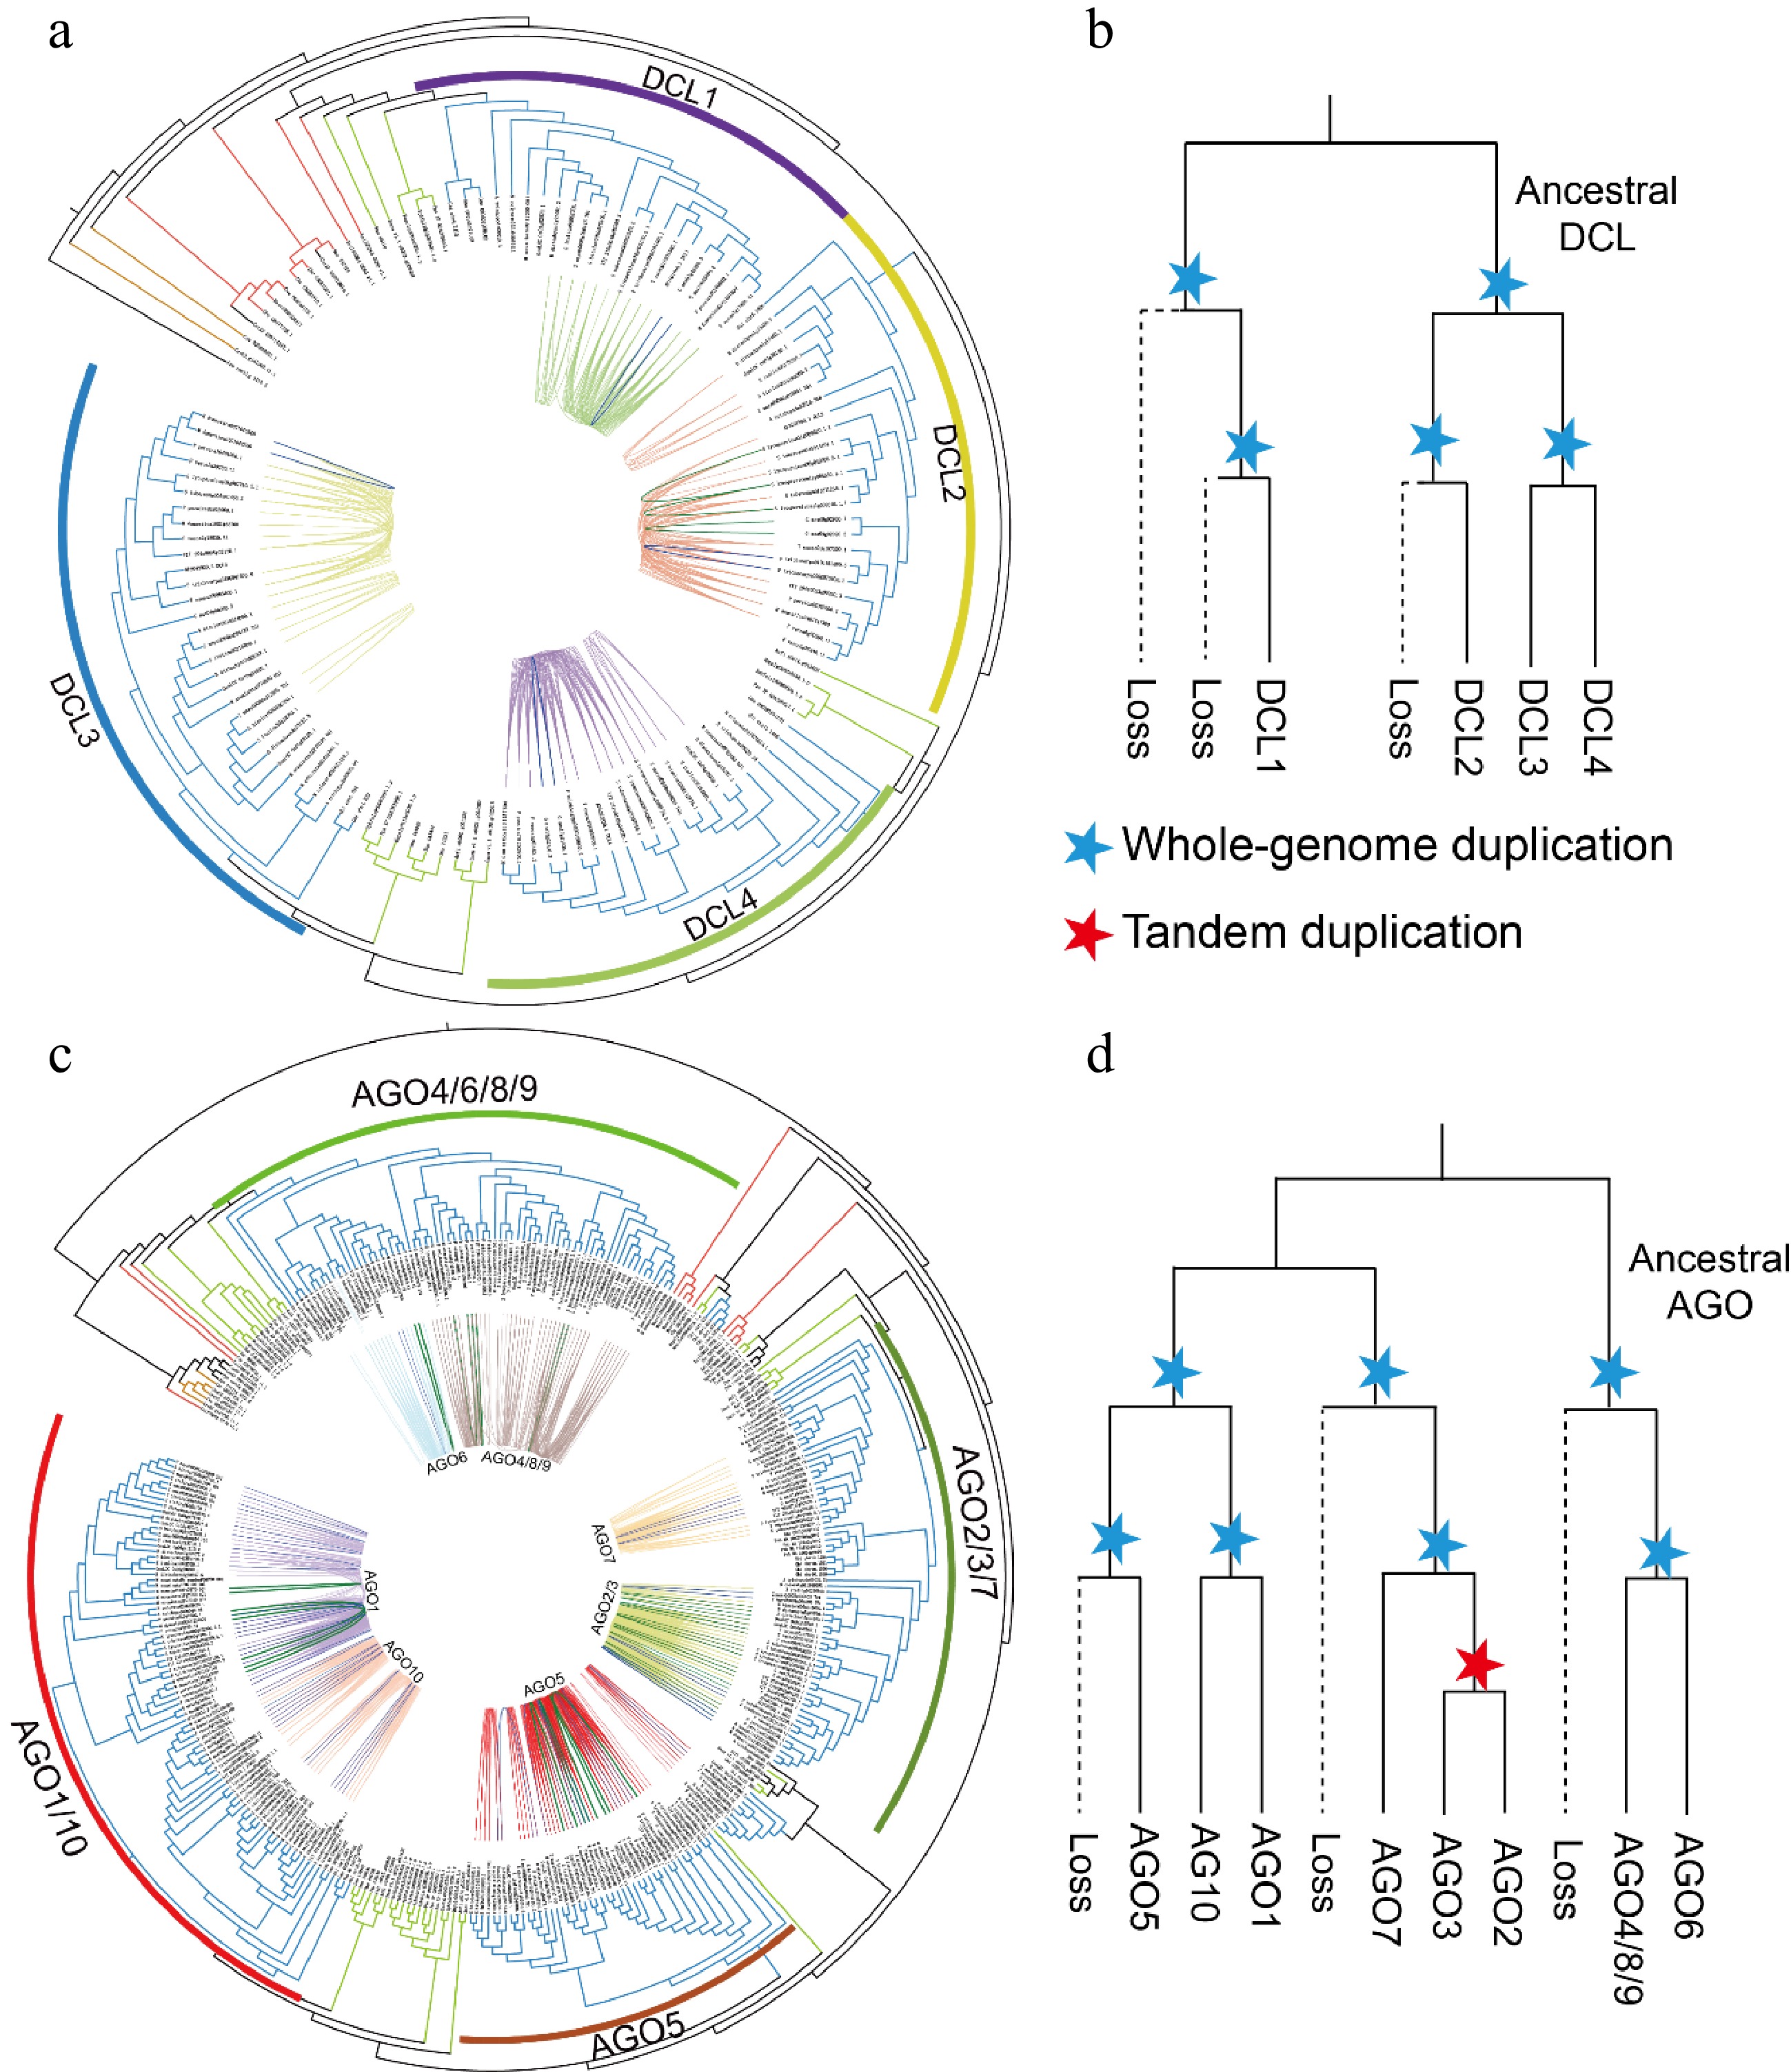
      Figure 4. 

      Phylogenetic analysis and synteny identification of the DCL and AGO genes. (a), (c) Phylogenetic and syntenic relationships of the DCLs and AGOs. The blue and green lines indicate gene pairs resulting from WGD and tandem duplication in the DCLs and AGOs, respectively. (b, d) Schematic representation of the proposed evolutionary histories of the DCL and AGO gene families. The dashed lines indicate gene loss. Blue stars mark either the ancient seed plant-wide or angiosperm-wide genome duplication events. Red stars represent tandem duplication events of genes.

      In the AGO gene family, 1,090 syntenic gene pairs were identified and subsequently clustered into seven groups (Fig. 4c). Notably, AGO4, AGO8, and AGO9 formed a cluster, demonstrating their evolutionary homology. A similar homologous relationship is observed between AGO2 and AGO3. Additionally, 43 syntenic gene pairs resulting from intraspecific duplications across various AGO groups were found. Moreover, 23 tandem duplication pairs were identified, they distributed across the syntenic gene clusters of AGO1, AGO4/8/9, AGO5, and AGO6, with most tandem duplications occurring within AGO2/3. Based on these findings, it is inferred that the AGO family originated from three ancestral genes before the emergence of seed plants, with clusters retained through two WGD events. Furthermore, AGO2 and AGO3 appear to have arisen from tandem duplications (Fig. 4d).

    • To explore the functional differences between DCLs and AGOs throughout plant evolution, expression patterns were analyzed using publicly available data from various tissues of P. patens, Z. may, A. thaliana, and F. vesca. Among these species, F. vesca exhibits the highest number of DCL members, totaling six. The expression profiles of various tissues were largely consistent across the four species, with DCLs showing high expression in reproductive tissues (Fig. 5a, Supplementary Fig. S6a). In F. vesca, the DCL2 and DCL3 branches each contain two gene members, however, in each branch, only one gene exhibits high expression. This contrasts with Z. mays, where the expression patterns of the two DCL3 members are similar. In P. patens, DCL3 is more prominently expressed in vegetative tissues, whereas in A. thaliana, Z. may, and F. vesca, it shows high expression in reproductive tissues. For the AGOs, the overall expression profiles are similar to those of the DCLs, with high expression in reproductive tissues (Fig. 5b, Supplementary Fig. S6b). The AGO4/6/8/9 groups demonstrate functional complementation in reproductive tissues in ancestral species, whereas in A. thaliana, Z. mays, and F. vesca, AGOs are ubiquitously expressed in all reproductive tissues. In P. patens, AGO1 group members are highly expressed only in reproductive tissues in P. patens, however, they maintain high expression levels across all tissues in A. thaliana and F. vesca. Interestingly, despite their overall low expression levels in pollen both DCLs and AGOs from various groups remain active in reproductive organs in A. thaliana and F. vesca.
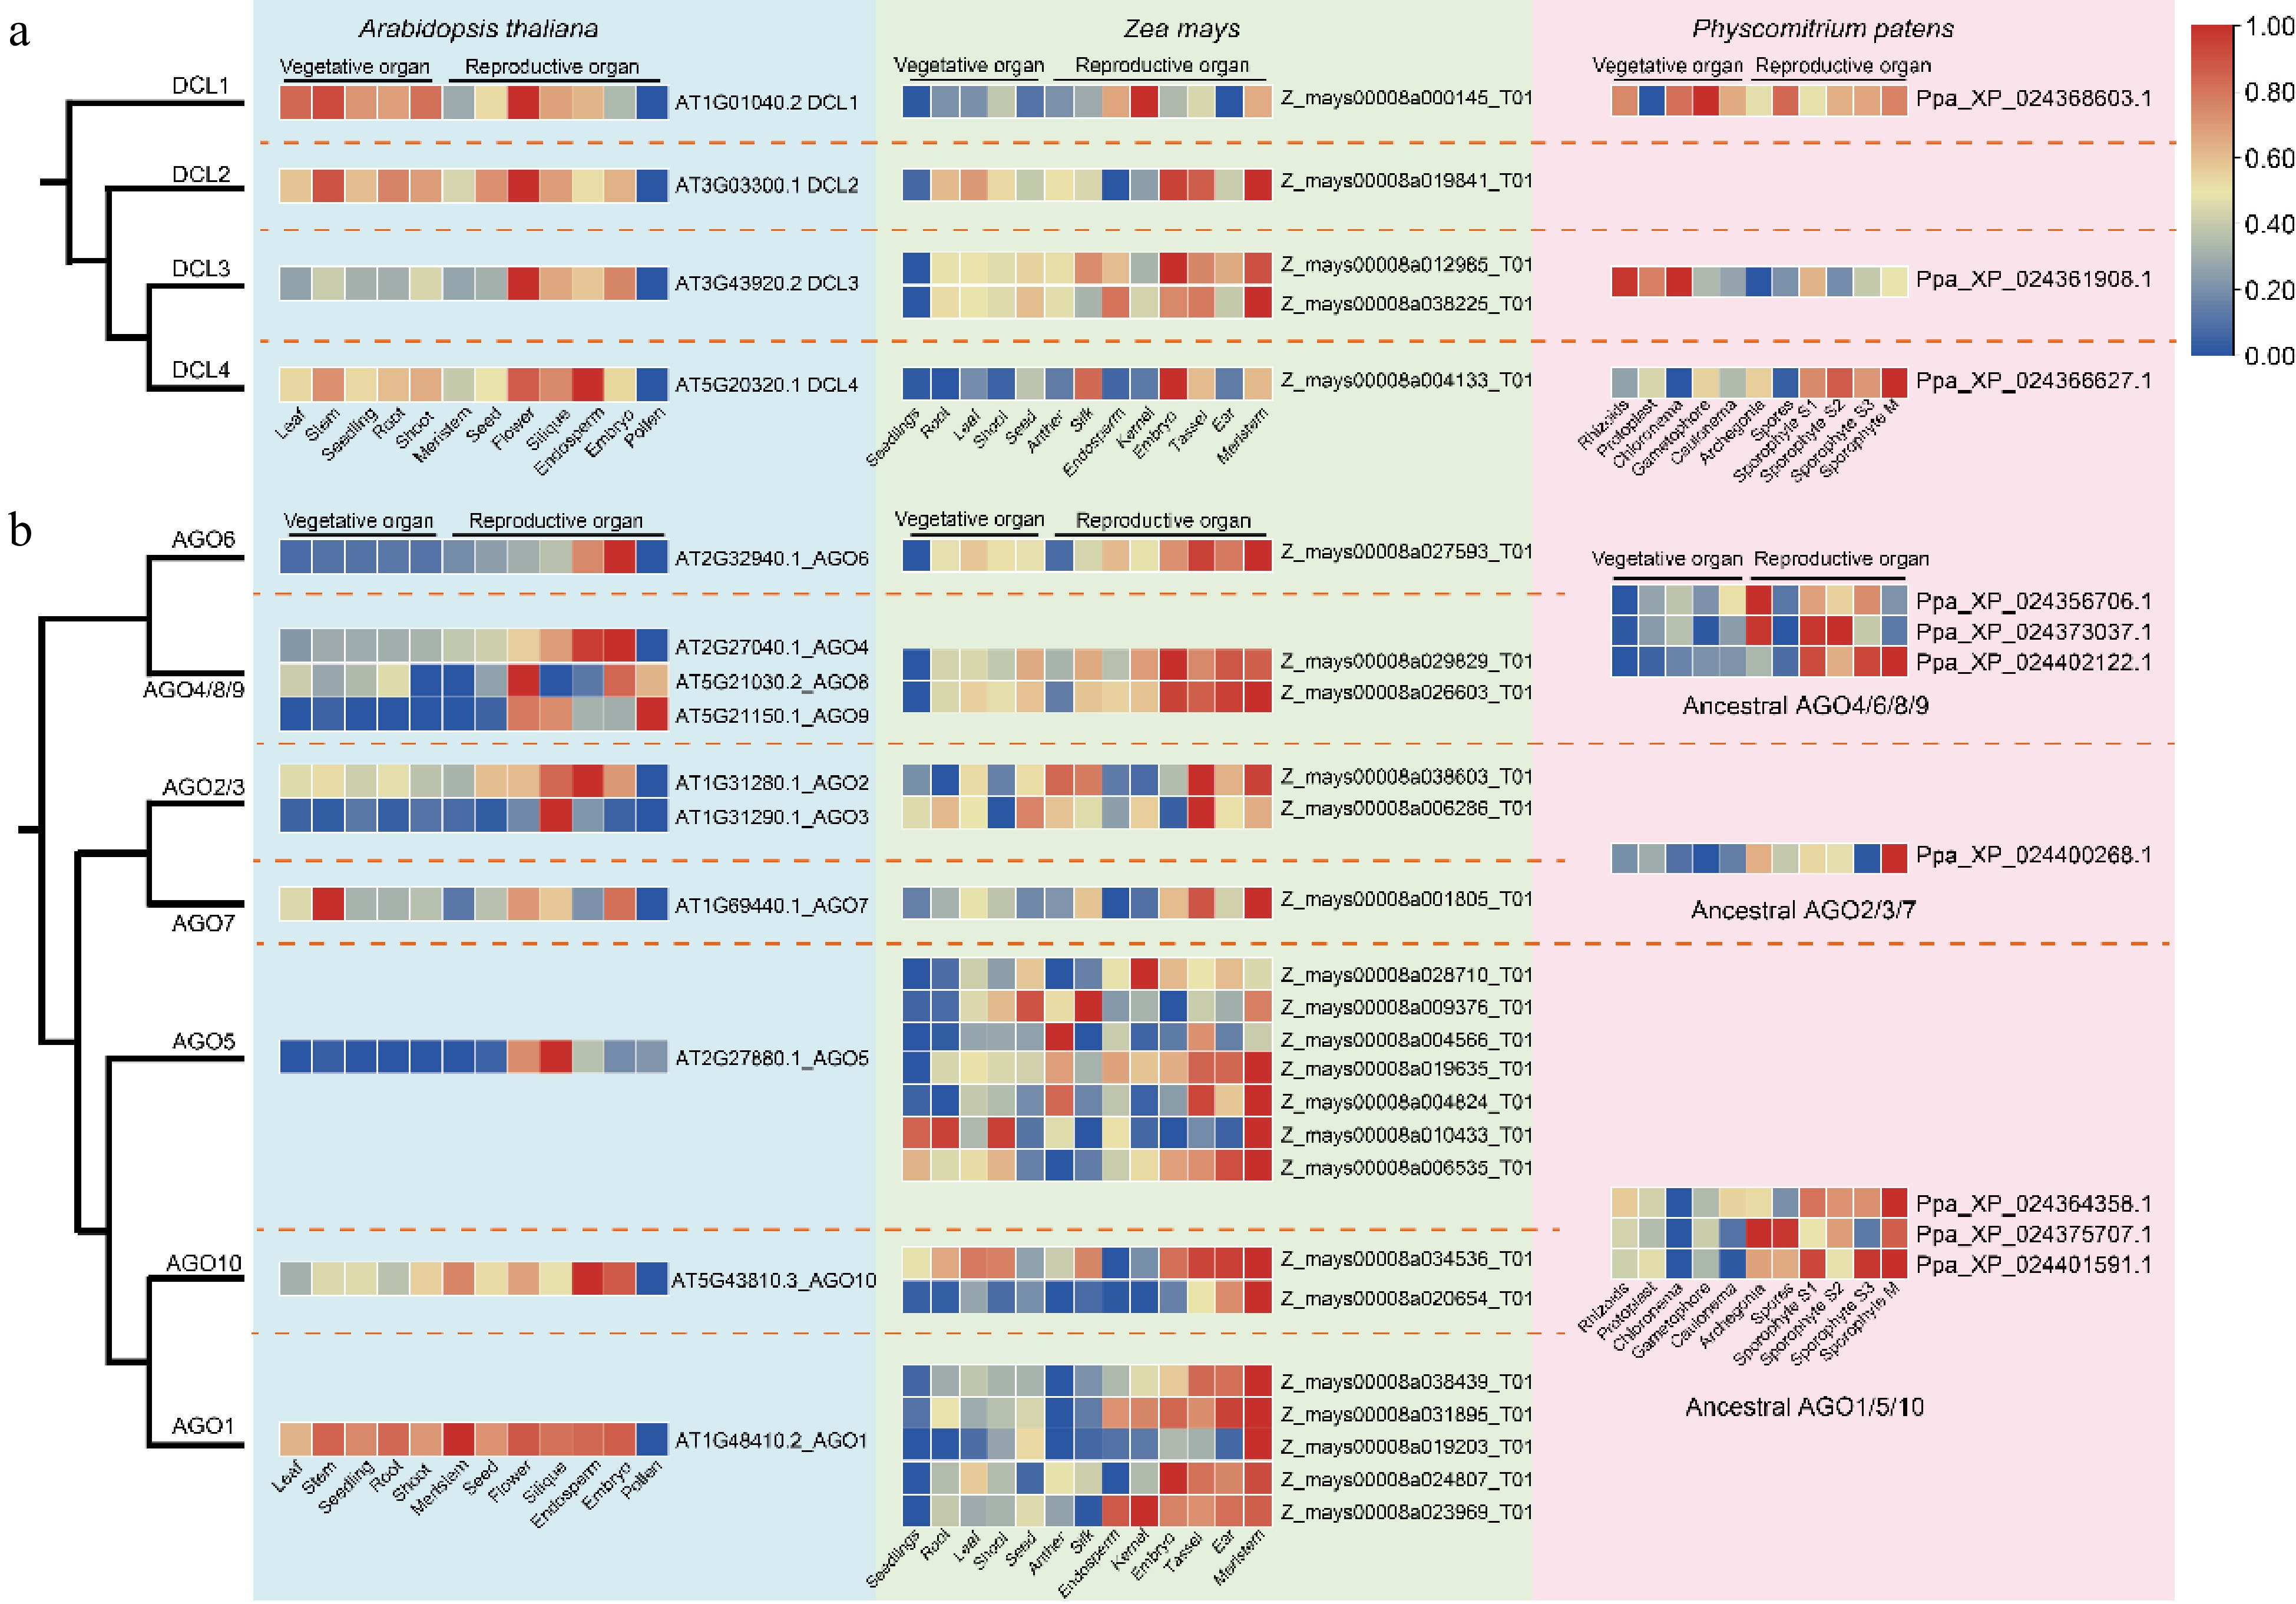
      Figure 5. 

      Expression profiles of DCLs and AGOs in different tissues of A. thaliana, Z. may, and P. patens. (a) Comparative expression profiles of DCL gene family members. (b) Comparative expression profiles of AGO gene family members. Dashed lines demarcate distinct clades, with the heatmap displaying relative expression levels from low (blue) to high (red).

      The expression of DCLs and AGOs in response to various stresses in A. thaliana and Z. may were further analyzed. The results indicate that A. thaliana DCLs respond to all stressors except irradiation, whereas Z. may DCLs primarily respond to heat, salt, drought, and nutrient deficiency (Fig. 6a). The stress responses of AGOs vary across different groups (Fig. 6b). For example, in A. thaliana, AGO6, AGO7, and AGO10 are involved in most stress pathways. In Z. mays, AGO6, AGO4/8/9, AGO2/3, and AGO10 participate in multiple stress responses. In both A. thaliana and Z. mays, AGO5 exhibits minimal responsiveness to stress, whereas AGO4 responds to similar stresses, including heat, salt, drought, cold, shade, and nutrient deficiency. This comprehensive analysis underscores the specificity and variability of DCL and AGO responses to environmental stresses, highlighting their essential adaptive functions in plant stress physiology.
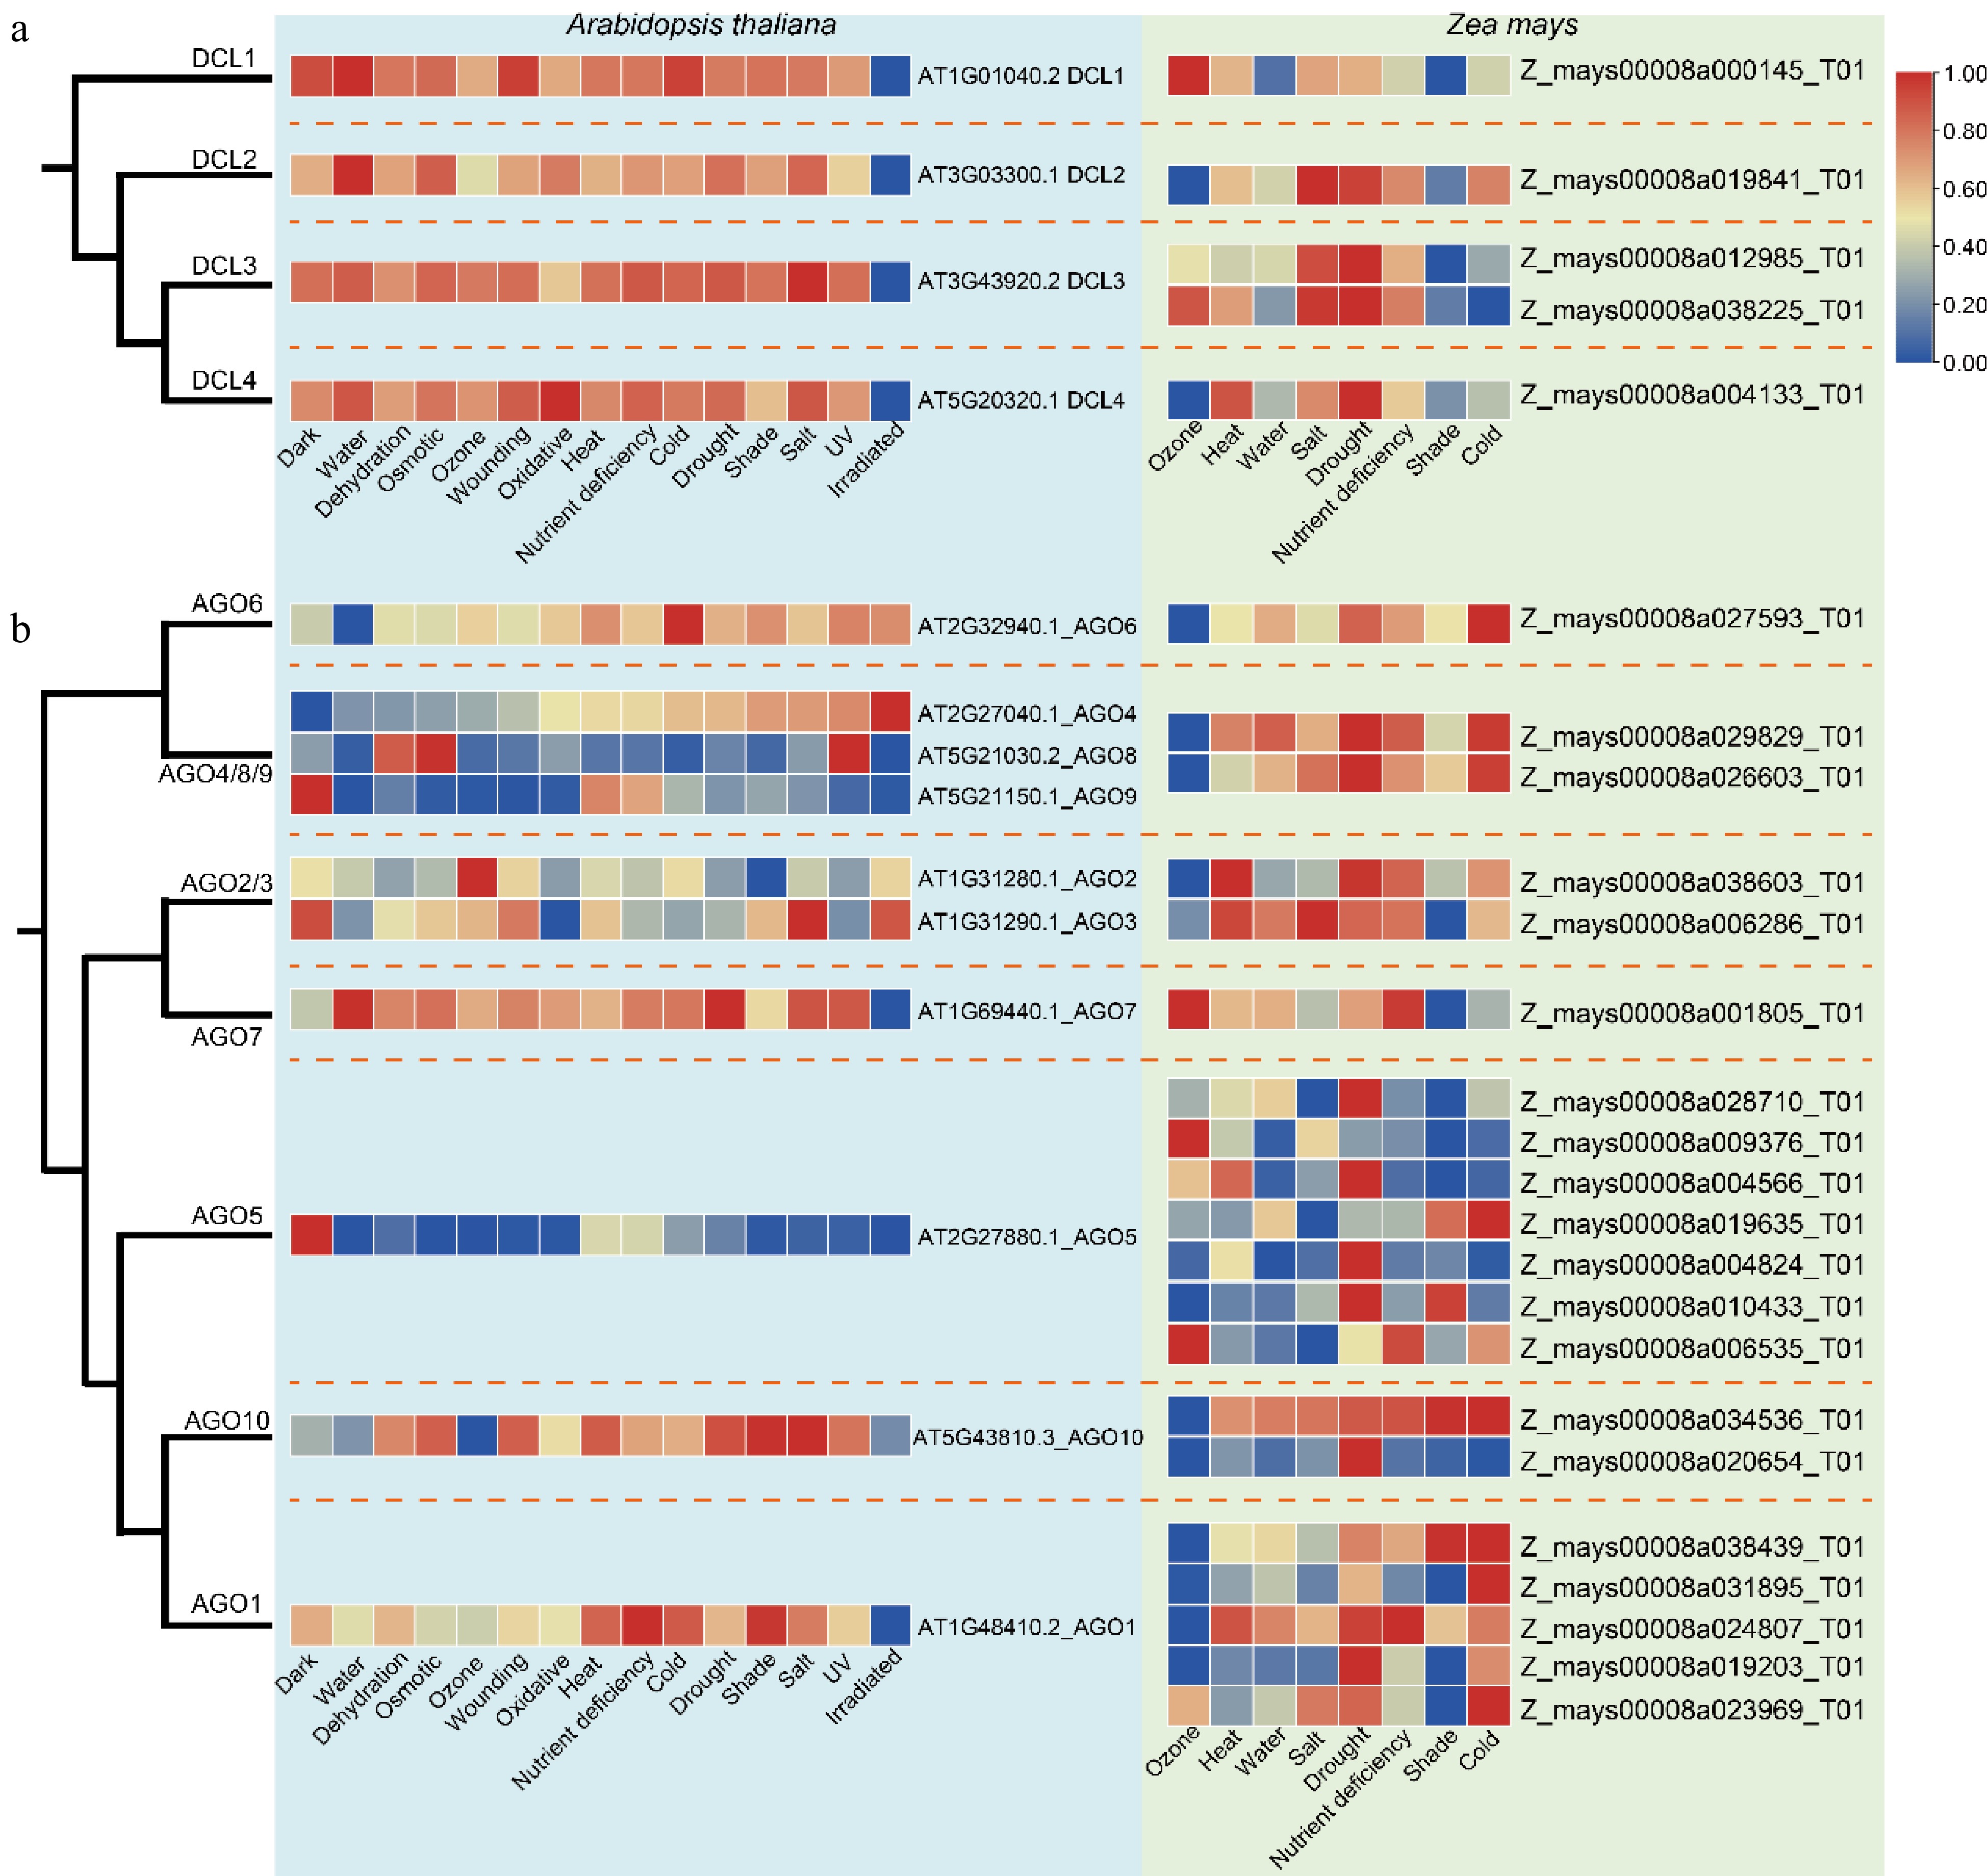
      Figure 6. 

      Expression of the DCLs and AGOs under different stress conditions in A. thaliana and Z. mays. (a) Comparative expression profiles of DCL gene family members. (b) Comparative expression profiles of AGO gene family members. Dashed lines denote distinct clades, with the heatmap displaying relative expression levels from low (blue) to high (red).

    • As plants transitioned from aquatic to terrestrial environments, they encountered more variable habitats and increased exposure to air. This shift prompted the expansion of numerous gene families to adapt to these diverse environmental challenges[3537]. The present findings align with previous studies, revealing that DCLs are predominantly classified into four groups, with DCL2 being exclusive to seed plants (Fig. 1a). The origin of DCLs was traced back to rhodophytes, detecting homologs in Chondrus crispus and Porphyridium purpureum, a finding supported by data from the 1KP database (Supplementary Fig. S1). Similarly, the present analysis suggests that AGOs also originated from rhodophytes, demonstrating the conservation of the RNAi pathway across plant species. Contrary to Li et al., who reported a single ancestral lineage for AGO, the present study identifies ancestral positions for AGO4/6/8/9 and AGO2/3/7 in Porphyridium purpureum[16]. Furthermore, a clear differentiation of AGOs into two distinct groups in rhodophytes, chlorophytes, and charophytes was observed (Fig. 1b). The expansion of the AGO family from charophytes to bryophytes likely represents an evolutionary adaptation crucial for terrestrial colonization[38,39]. Furthermore, these findings underscore the significant role of epigenetics in the terrestrial adaptation of plants.

      DCLs exhibit a single ancestral branch in all algae, however, their expansion during the transition from aquatic to terrestrial environments coincides with that of the AGOs. This expansion continuous as lower plants evolved into higher plants, leading to the present diversification of these gene families. As key components of the RNAi mechanism, DCLs, and AGOs are crucial for the generation and function of miRNA. Specific miRNAs in algae that are conserved in seed plants, such as miR167, miR172, miR395, miR414, miR418, and miR419, are missing in mosses and ferns[4043]. These miRNAs are essential for flower development, stress resistance, and root development in higher plants[44,45]. Their absence in mosses and ferns highlights differences in the miRNA-mediated gene silencing pathways between lower and higher plants and underscores the adaptive changes during plant evolution, reflecting species-specific survival strategies and developmental needs in diverse environments. Further analysis of the evolutionary trajectories of DCLs and AGOs in seed plants revealed that DCLs underwent two rounds of WGDs in land plants without a significant increase in their numbers (Figs 2 & 4). By contrast, AGOs experienced two WGD events and one tandem duplication (Fig. 4), and maintained specific expansions within different species (Fig. 3). These findings reveal distinct evolutionary paths of these gene families and their crucial roles in adapting RNAi mechanisms for plant survival and development across diverse ecological settings.

      WGD and various forms of gene duplication are the primary mechanisms that drive the expansion of gene families. The retention of duplicated genes throughout evolution has facilitated better adaptation in plant growth and development[4648]. Extensive research has established the functions of DCLs and AGOs. This study discovers that most DCL and AGO genes in P. patens are highly expressed in meristematic tissues, a pattern that is conserved in A. thaliana, Z. mays, and F. vesca (Fig. 5 & Supplementary Fig. S3). This expression profile is likely attributed to active DNA methylation and RNAi regulation within these tissues[10,49,50], underscoring the intricate genetic regulation essential for plant development. Additionally, DCL3 and DCL4 in P. patens show high expression in vegetative and meristematic tissues, respectively, suggesting the specialization of their functions (Figs 5 & Supplementary Fig. S3). In Arabidopsis, F. vesca, and Z. mays, the DCL2/3/4 genes are highly expressed in various tissues and response to stress (Fig. 6). The sRNAs they produce vary, indicating that diverse types of sRNAs are extensively involved in the life cycles of plants. This diversity enables plants to adapt to environmental fluctuations and supports their growth and development[5153]. Additionally, DCL serves as the factory for manufacturing and producing miRNAs. Its tissue-specific expression, along with upregulated expression under stress conditions, is closely associated with the miRNAs it produces. For example, the miRNA156/SPL module can participate in root development and vegetative growth while also enhancing the plant's tolerance to abiotic stress. miR169 targets different members of the NF-YA gene family, which is involved in multiple developmental processes and stress responses. Moreover, miR159, miR397, and miR393 possess diverse functions in plant growth, development, and stress tolerance[44,45]. By contrast, the functions of the AGO4/6/8/9 clade have remained largely unchanged throughout evolution, with no special functions emerging from their expansion in Z. may and A. thaliana (Figs 5, 6, & Supplementary Fig. S3). Previous studies have demonstrated functional complementarity among AGO4/6/8/9 proteins[10,54,55], which is essential for maintaining critical biological processes under varying conditions. AGO2/3/7 appear to be predominantly involved in stress responses (Fig. 6), consistent with findings of previous studies[56,57]. In A. thaliana, F. vesca, and Z. mays, AGO1/5/10 exhibit significant functional divergence. Specifically, in A. thaliana, AGO1 and AGO5 exist as single-copy genes. However, AGO5 has largely lost its regulatory functions in tissue development and stress response, whereas AGO1 retains all these functions (Figs 5 & 6). In Z. mays, although there is a significant expansion of members within the AGO1/5/10 group, their functions remain largely similar to those observed in P. patens. These results suggest that subfunctionalization and neofunctionalization are two potential evolutionary outcomes of gene duplication[58], and also demonstrate the role of epigenetic regulation in directing species-specific evolutionary trajectories in plants.

    • Genomic data for 36 plant species used in this study were obtained from databases such as Phytozome (Supplementary Table S1). Gene screening and alignment of the 1KP transcriptome data were conducted using the ONEKP online platform (https://db.cngb.org/onekp). Protein sequences of the four DCLs and ten AGOs from A. thaliana served as query sequences for BLASTP analysis against the proteomic data of the remaining 35 plant genomes, using an e-value threshold of 1e-20. The resulting sequences were then analyzed using InterProScan to identify and annotate conserved domains using the Pfam, PANTHER, and SMART databases[59]. Only sequences that contained domains consistent with those found in A. thaliana were selected for constructing a phylogenetic tree using FastTree. Branches exhibiting abnormal lengths were manually removed to ensure the accuracy of the inferred phylogenetic relationships[60].

    • First, multiple sequence alignment of all DCL and AGO protein sequences was performed using MAFFT. Gap positions were then removed from the aligned sequences using Phyutility with a cutoff parameter of 0.5. Next, ProtTest was used to predict the best-fit substitution models for constructing the DCL and AGO phylogenetic trees. The DCL and AGO trees were constructed using IQ-TREE with the JTT + F + R6 and LG + I + G + F models, respectively, with 1000 Bootstrap replicates[61]. For genes indexed in the 1KP database, phylogenetic trees were constructed using FastTree. Additionally, collinearity blocks were identified by comparing coding sequences across species using the Python version of MCScan[62].

    • Expression data for different tissues of P. patens and F. vesca were obtained from the Physcomitrium eFP Browser and the Strawberry eFP Browser, respectively (http://bar.utoronto.ca). For A. thaliana and Z. mays, tissue-specific and stress-induced expression profiles were downloaded from https://plantrnadb.com. Detailed data sources are provided in Supplementary Table S2. The expression of DCL and AGO genes across these species was visualized using TBtools[63].

      • The research was supported by the Key Research and Development Program of Jiangsu (BE2023350) and the Priority Academic Program Development of Jiangsu Higher Education Institutions Project (PAPD), and the high-performance computing platform at the Bioinformatics Center of Nanjing Agricultural University. We would like to thank A&L Scientific Editing (www.alpublish.com) for their linguistic assistance during the preparation of this manuscript.

      • The authors confirm contribution to the paper as follows: study conception and design: Xiong AS, Cheng ZM, Su LY; data analysis, draft manuscript preparation: Su LY, Li SS, Liu H. All authors reviewed the results and approved the final version of the manuscript.

      • All data generated or analyzed during this study are included in this published article.

      • The authors declare that they have no conflict of interest.

      • # Authors contributed equally: Li-Yao Su, Shan-Shan Li

      • Supplementary Table S1 Genome data used in this study.
      • Supplementary Table S2 Source of gene expression data.
      • Supplementary Fig. S1 The ML tree of DCLs identified with 1KP transcriptomic data. Branches are color-coded to denote different plant groups: black for rhodophytes, yellow for chlorophytes, red for charophytes, green for ferns and bryophytes, and blue for seed plants.
      • Supplementary Fig. S2 The ML tree of AGOs identified with 1KP transcriptomic data. Branches are color-coded to denote different plant groups: black for rhodophytes, yellow for chlorophytes, red for charophytes, green for ferns and bryophytes, and blue for seed plants.
      • Supplementary Fig. S3 RNase III domain alignment of four groups of DCL proteins.
      • Supplementary Fig. S4 MID domain alignment of three groups of AGOs.
      • Supplementary Fig. S5 PAZ domain alignment of three groups of AGOs.
      • Supplementary Fig. S6 Expression of DCLs and AGOs in different tissues of F. vesca. (A) Comparative expression profiles of DCL gene family members. (B) Comparative expression profiles of AGO gene family members. Dashed lines demarcate distinct clades, with the heatmap displaying relative expression levels from low (blue) to high (red).
      • © 2024 by the author(s). Published by Maximum Academic Press, Fayetteville, GA. This article is an open access article distributed under Creative Commons Attribution License (CC BY 4.0), visit https://creativecommons.org/licenses/by/4.0/.
    Figure (6)  References (63)
  • About this article
    Cite this article
    Su LY, Li SS, Liu H, Cheng ZM, Xiong AS. 2024. The origin, evolution, and functional divergence of the Dicer-like (DCL) and Argonaute (AGO) gene families in plants. Epigenetics Insights 17: e003 doi: 10.48130/epi-0024-0005
    Su LY, Li SS, Liu H, Cheng ZM, Xiong AS. 2024. The origin, evolution, and functional divergence of the Dicer-like (DCL) and Argonaute (AGO) gene families in plants. Epigenetics Insights 17: e003 doi: 10.48130/epi-0024-0005

Catalog

  • About this article

/

DownLoad:  Full-Size Img  PowerPoint
Return
Return