-
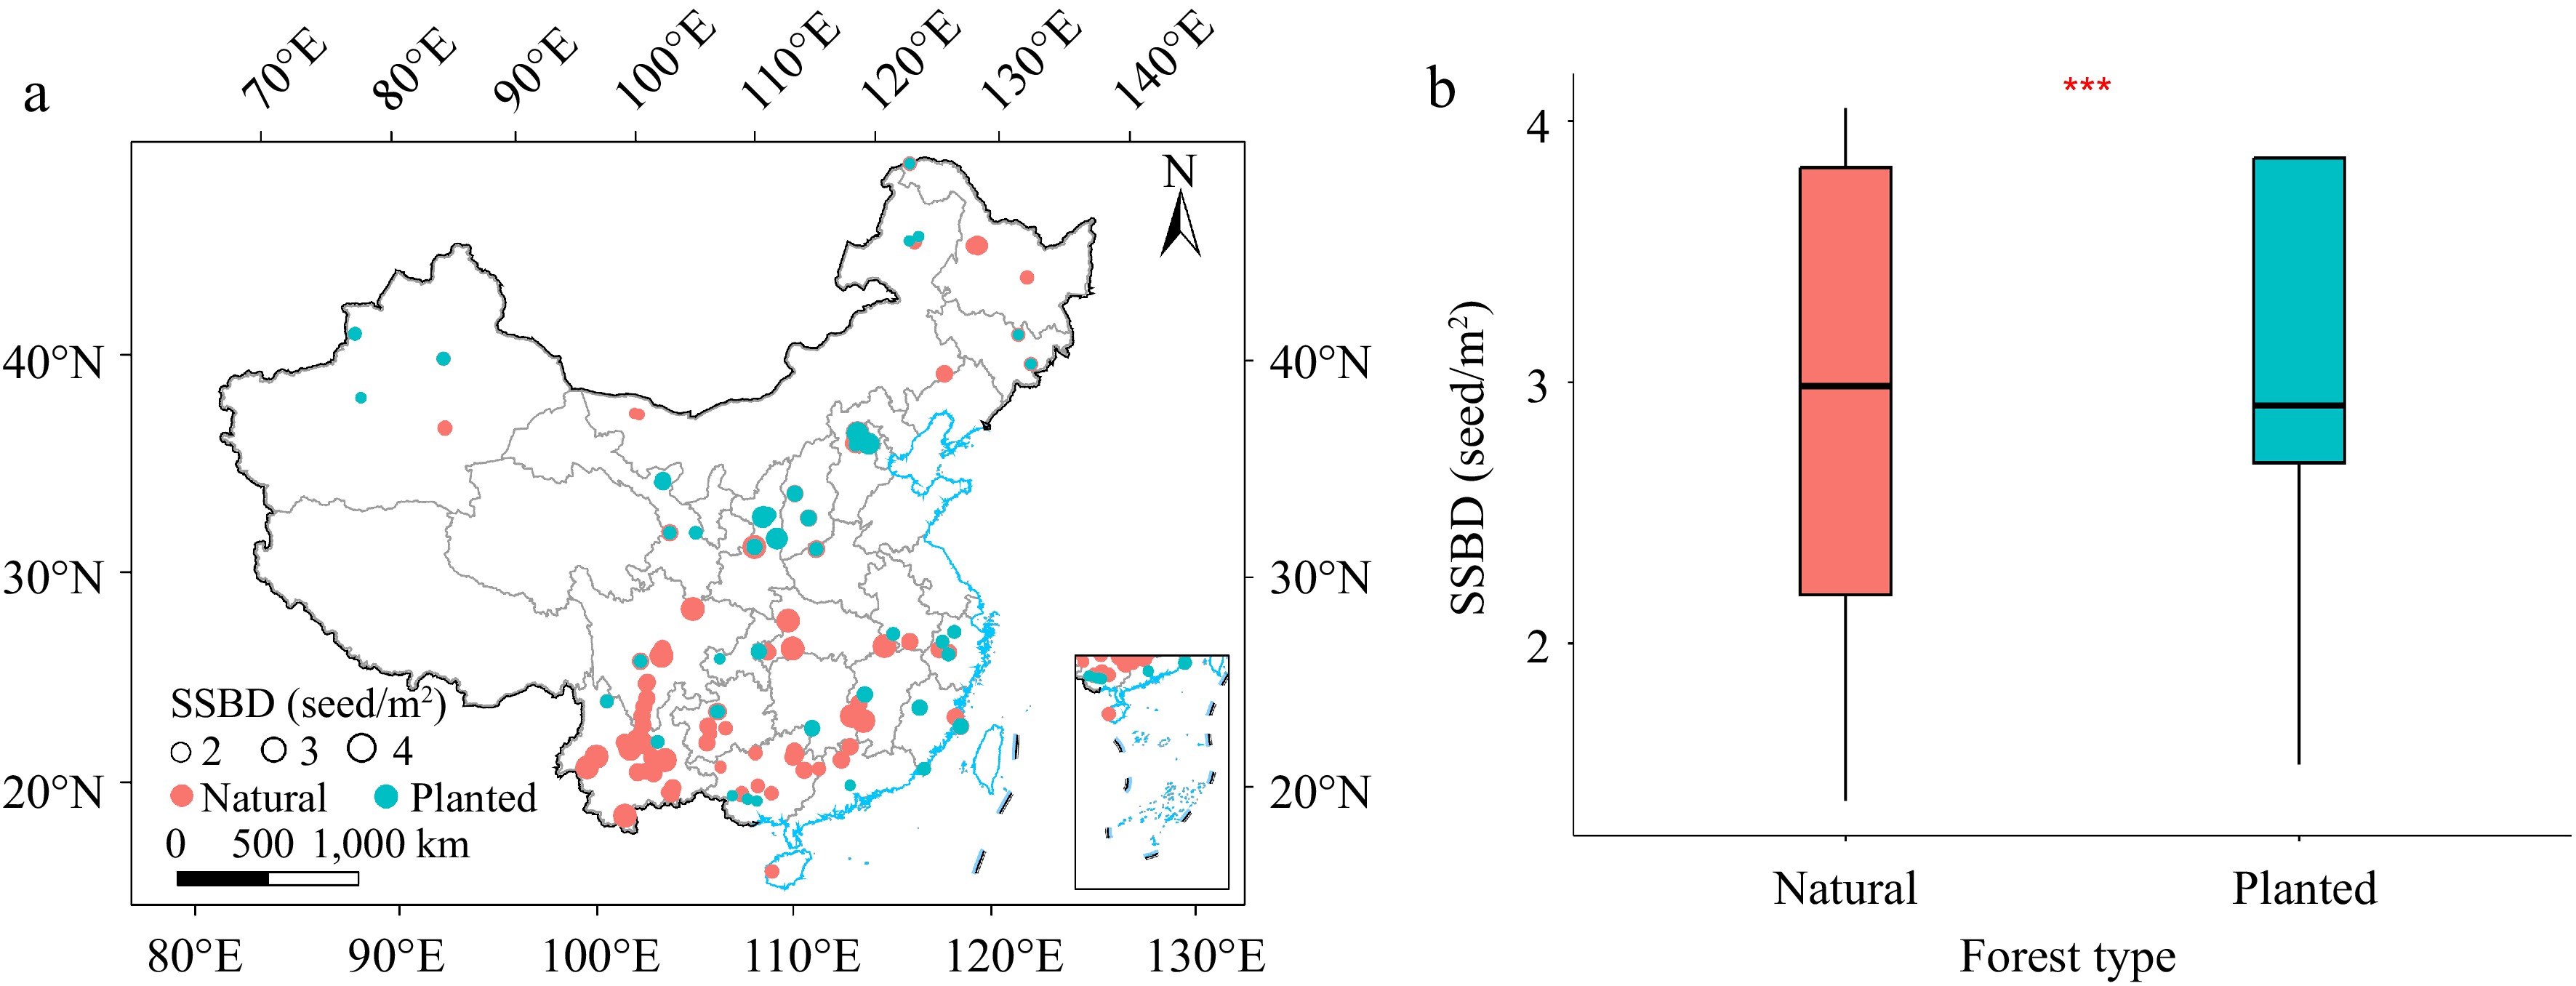
Figure 1.
Spatial distribution of soil seed banks and plot locations in planted and natural forests. (a) Comparison of SSBD between natural forests and planted forests. (b) Significance of the differences was assessed using a t-test, with significance at the 0.001 level. *** p < 0.001.
-
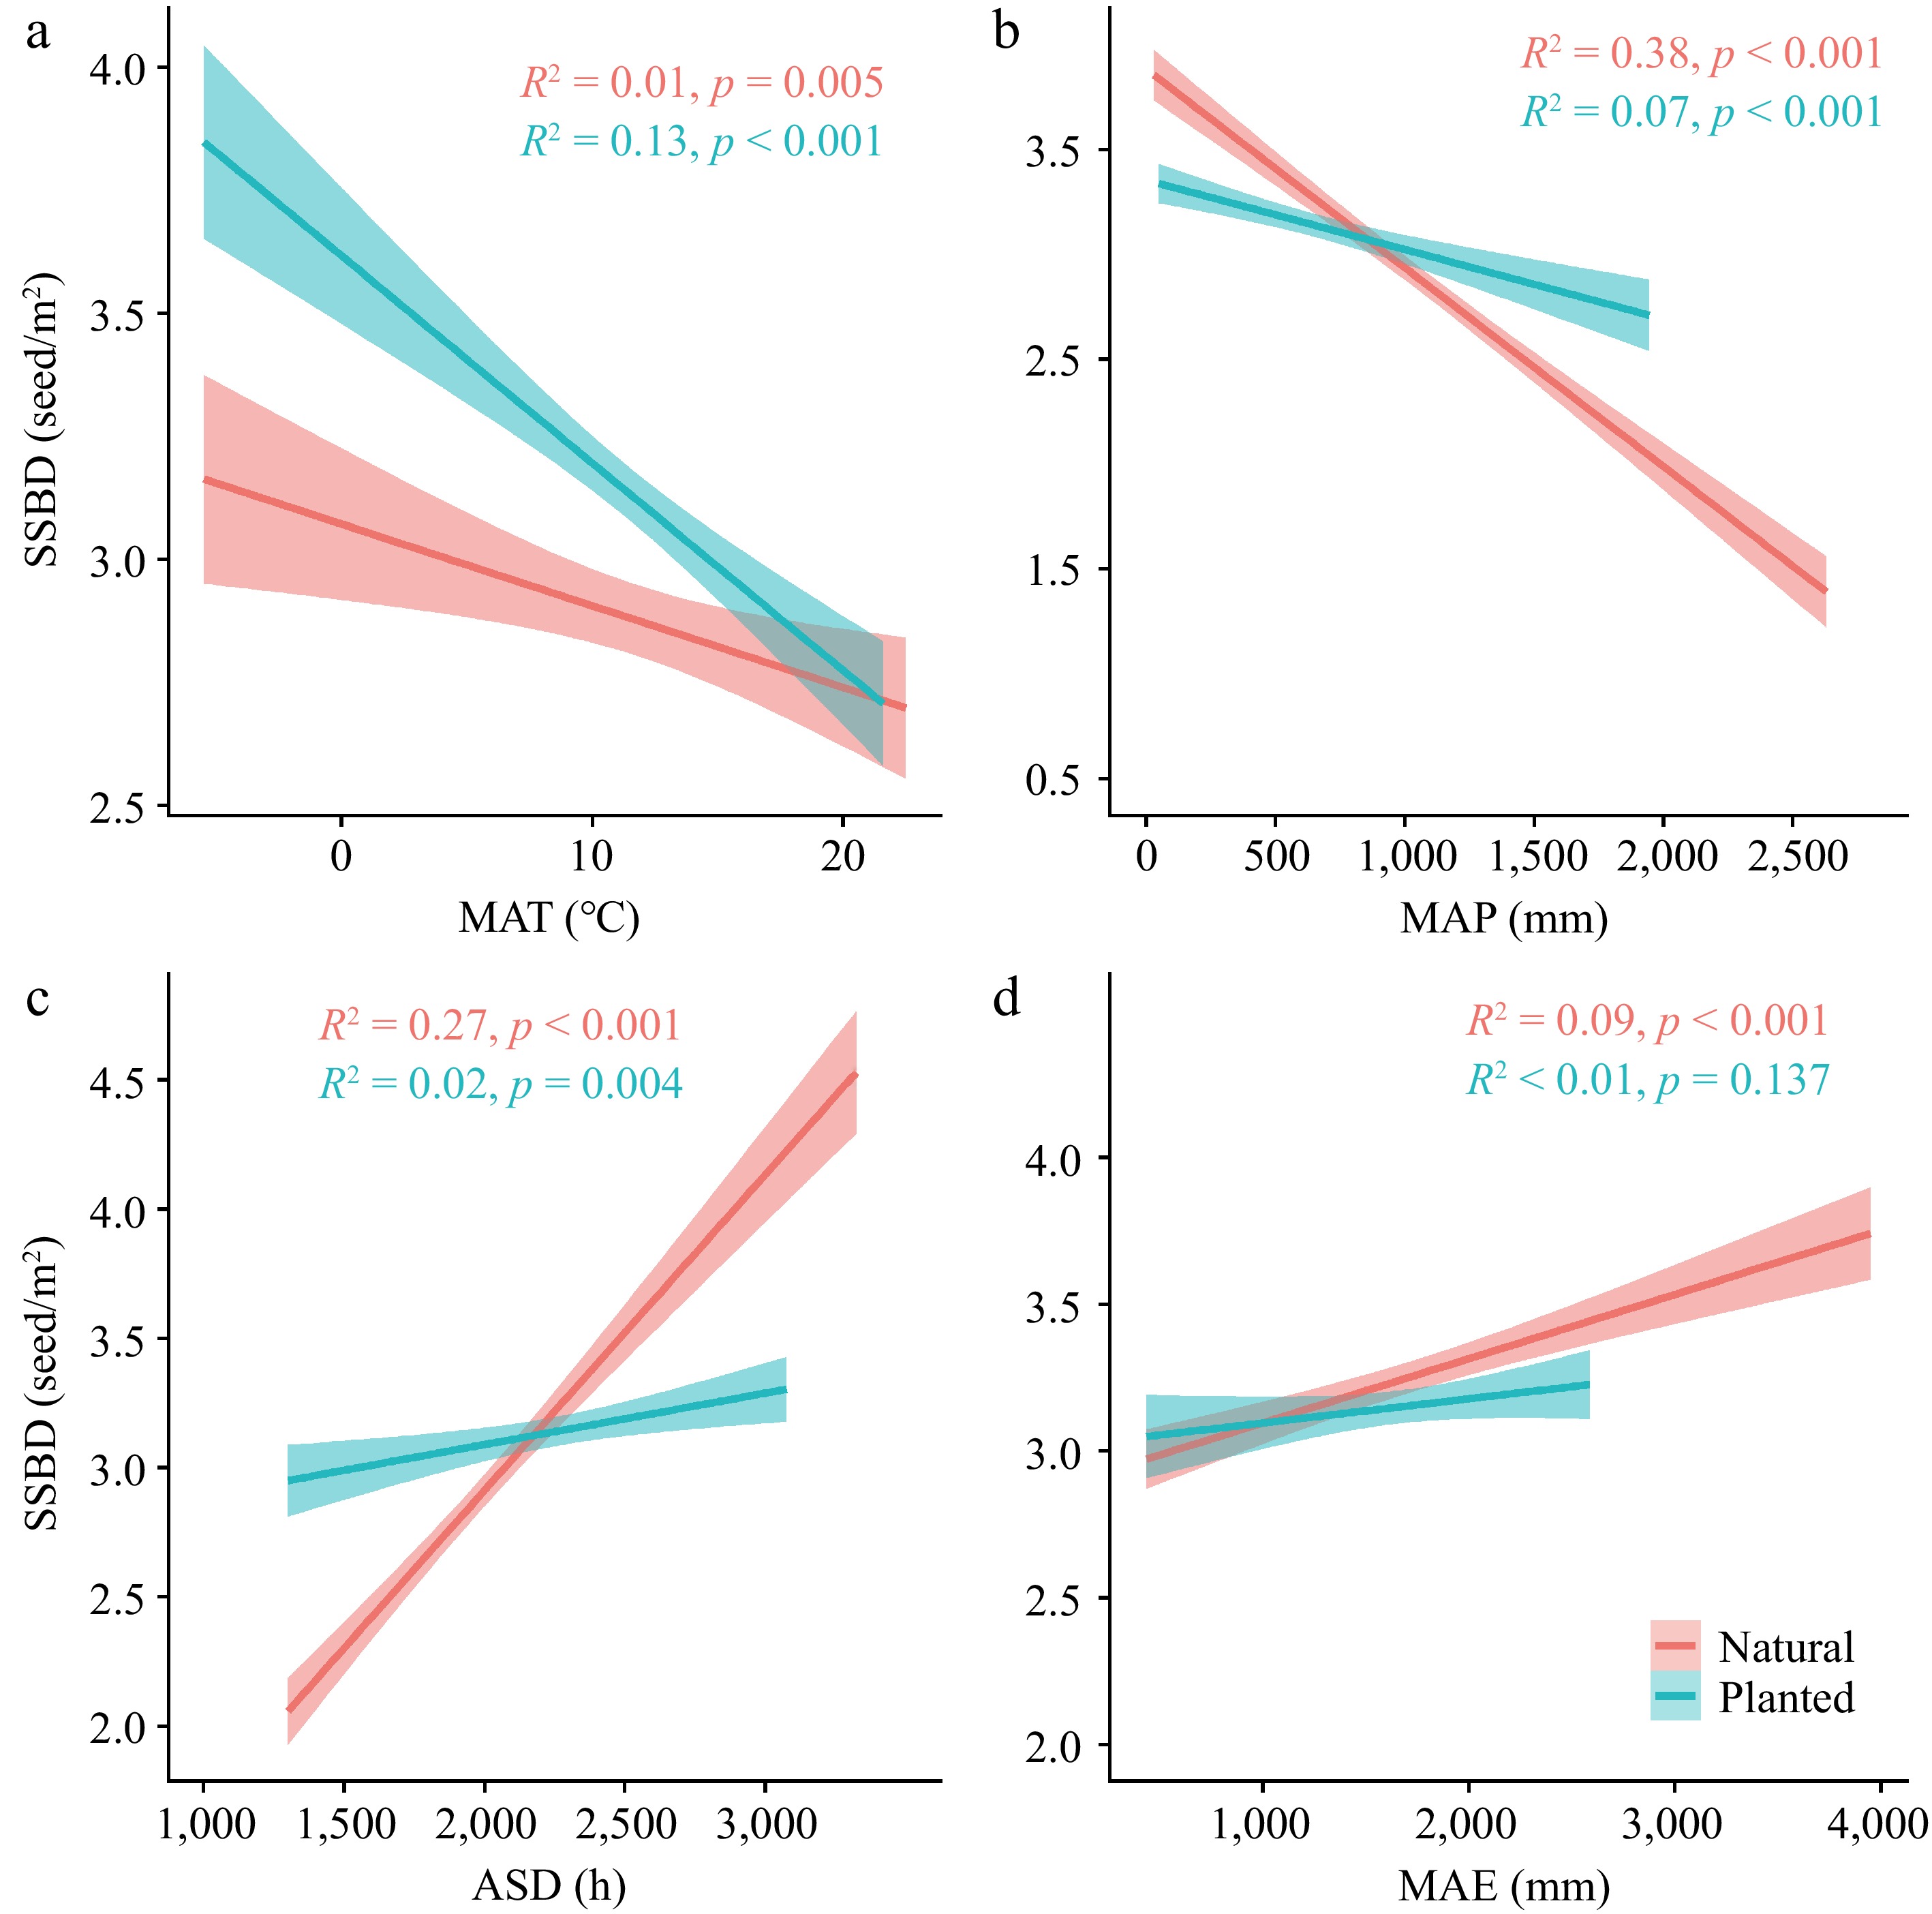
Figure 2.
The relationships between climatic factors and SSBD in natural forests and planted forests. R2 represents the goodness of fit, and P-values indicate significance. Climatic factors include: (a) Mean Annual Temperature (MAT); (b) Mean Annual Precipitation (MAP); (c) Annual Sunlight Duration (ASD); (d) Mean Annual Evaporation (MAE).
-
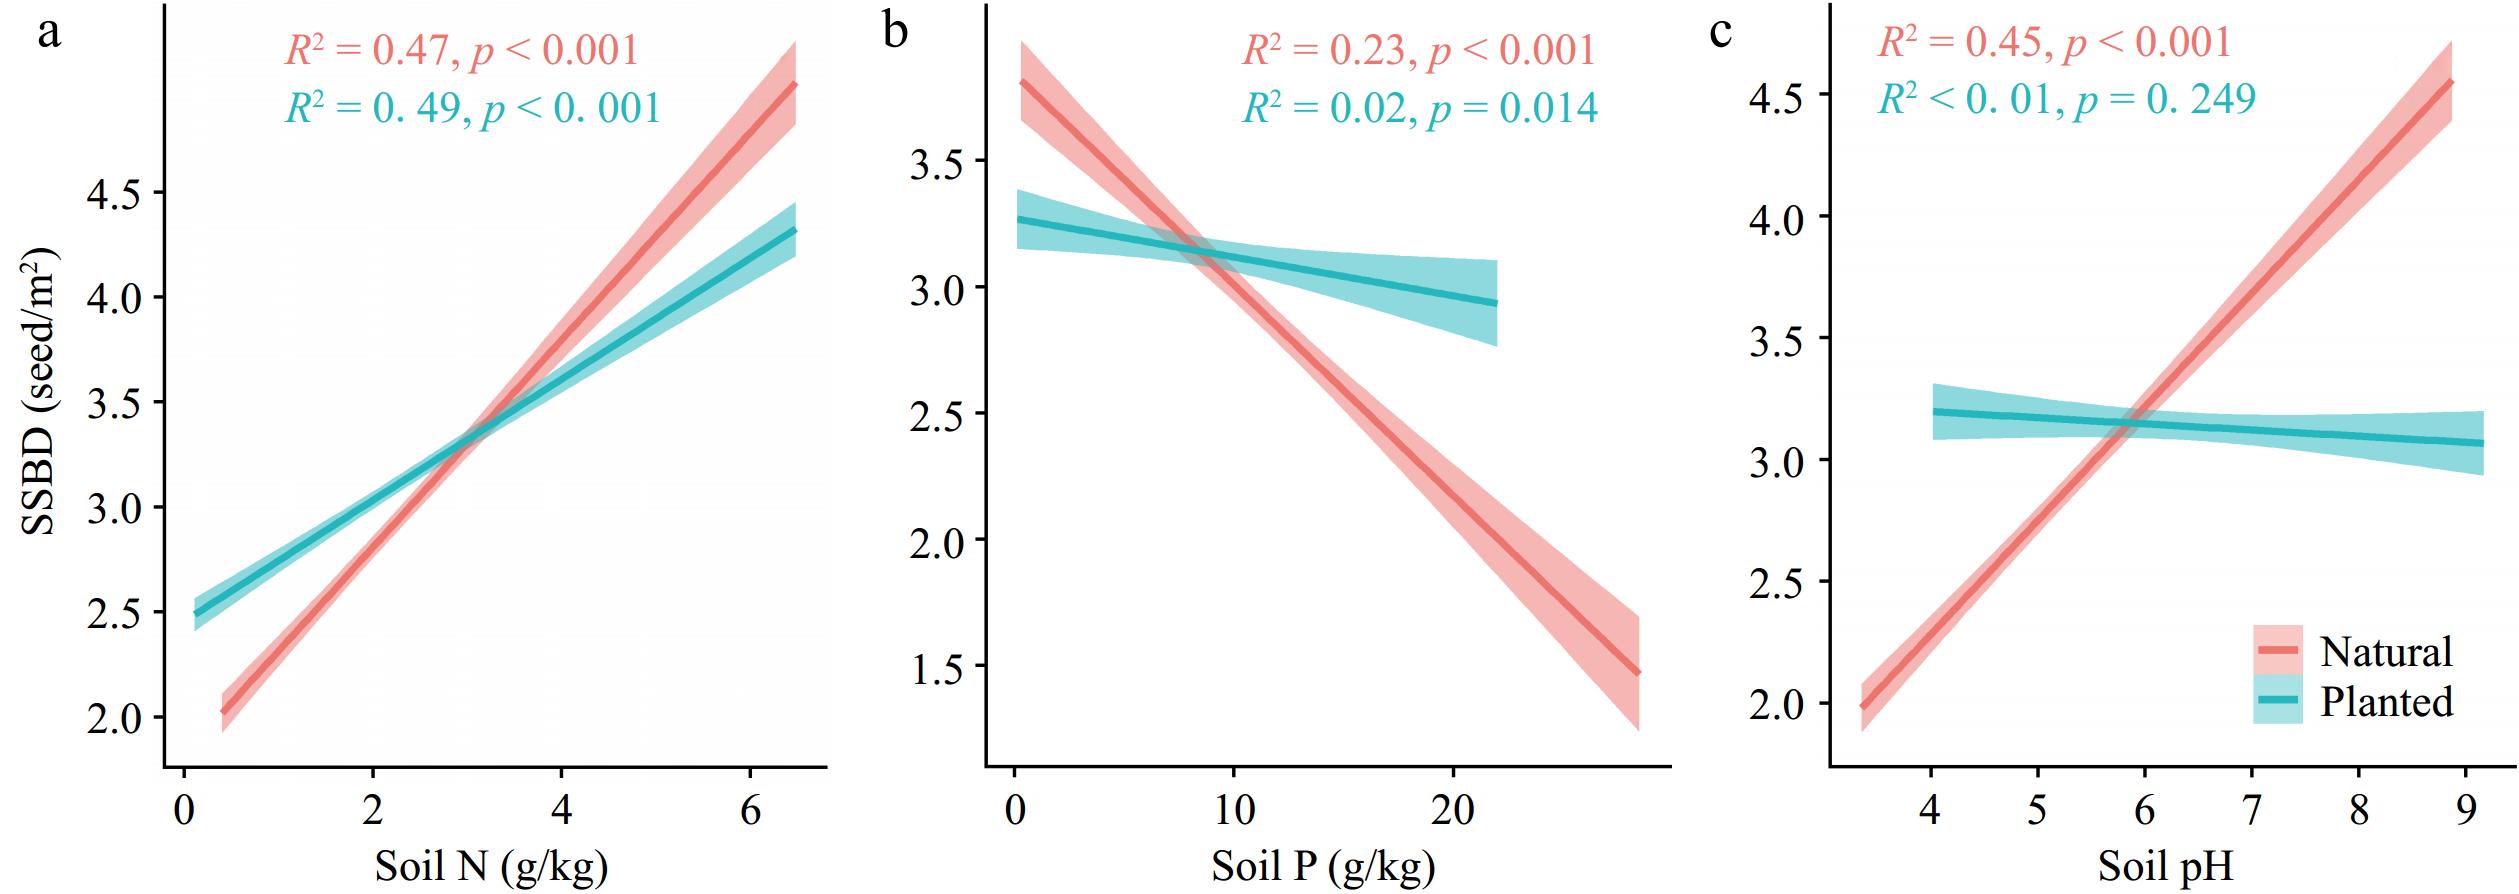
Figure 3.
The relationships between soil factors and SSBD in natural forests and planted forests. R2 represents the goodness of fit, and P-values indicate significance. Soil factors include: (a) Soil total nitrogen content (Soil N); (b) soil total phosphorus content (Soil P); (c) Soil pH.
-
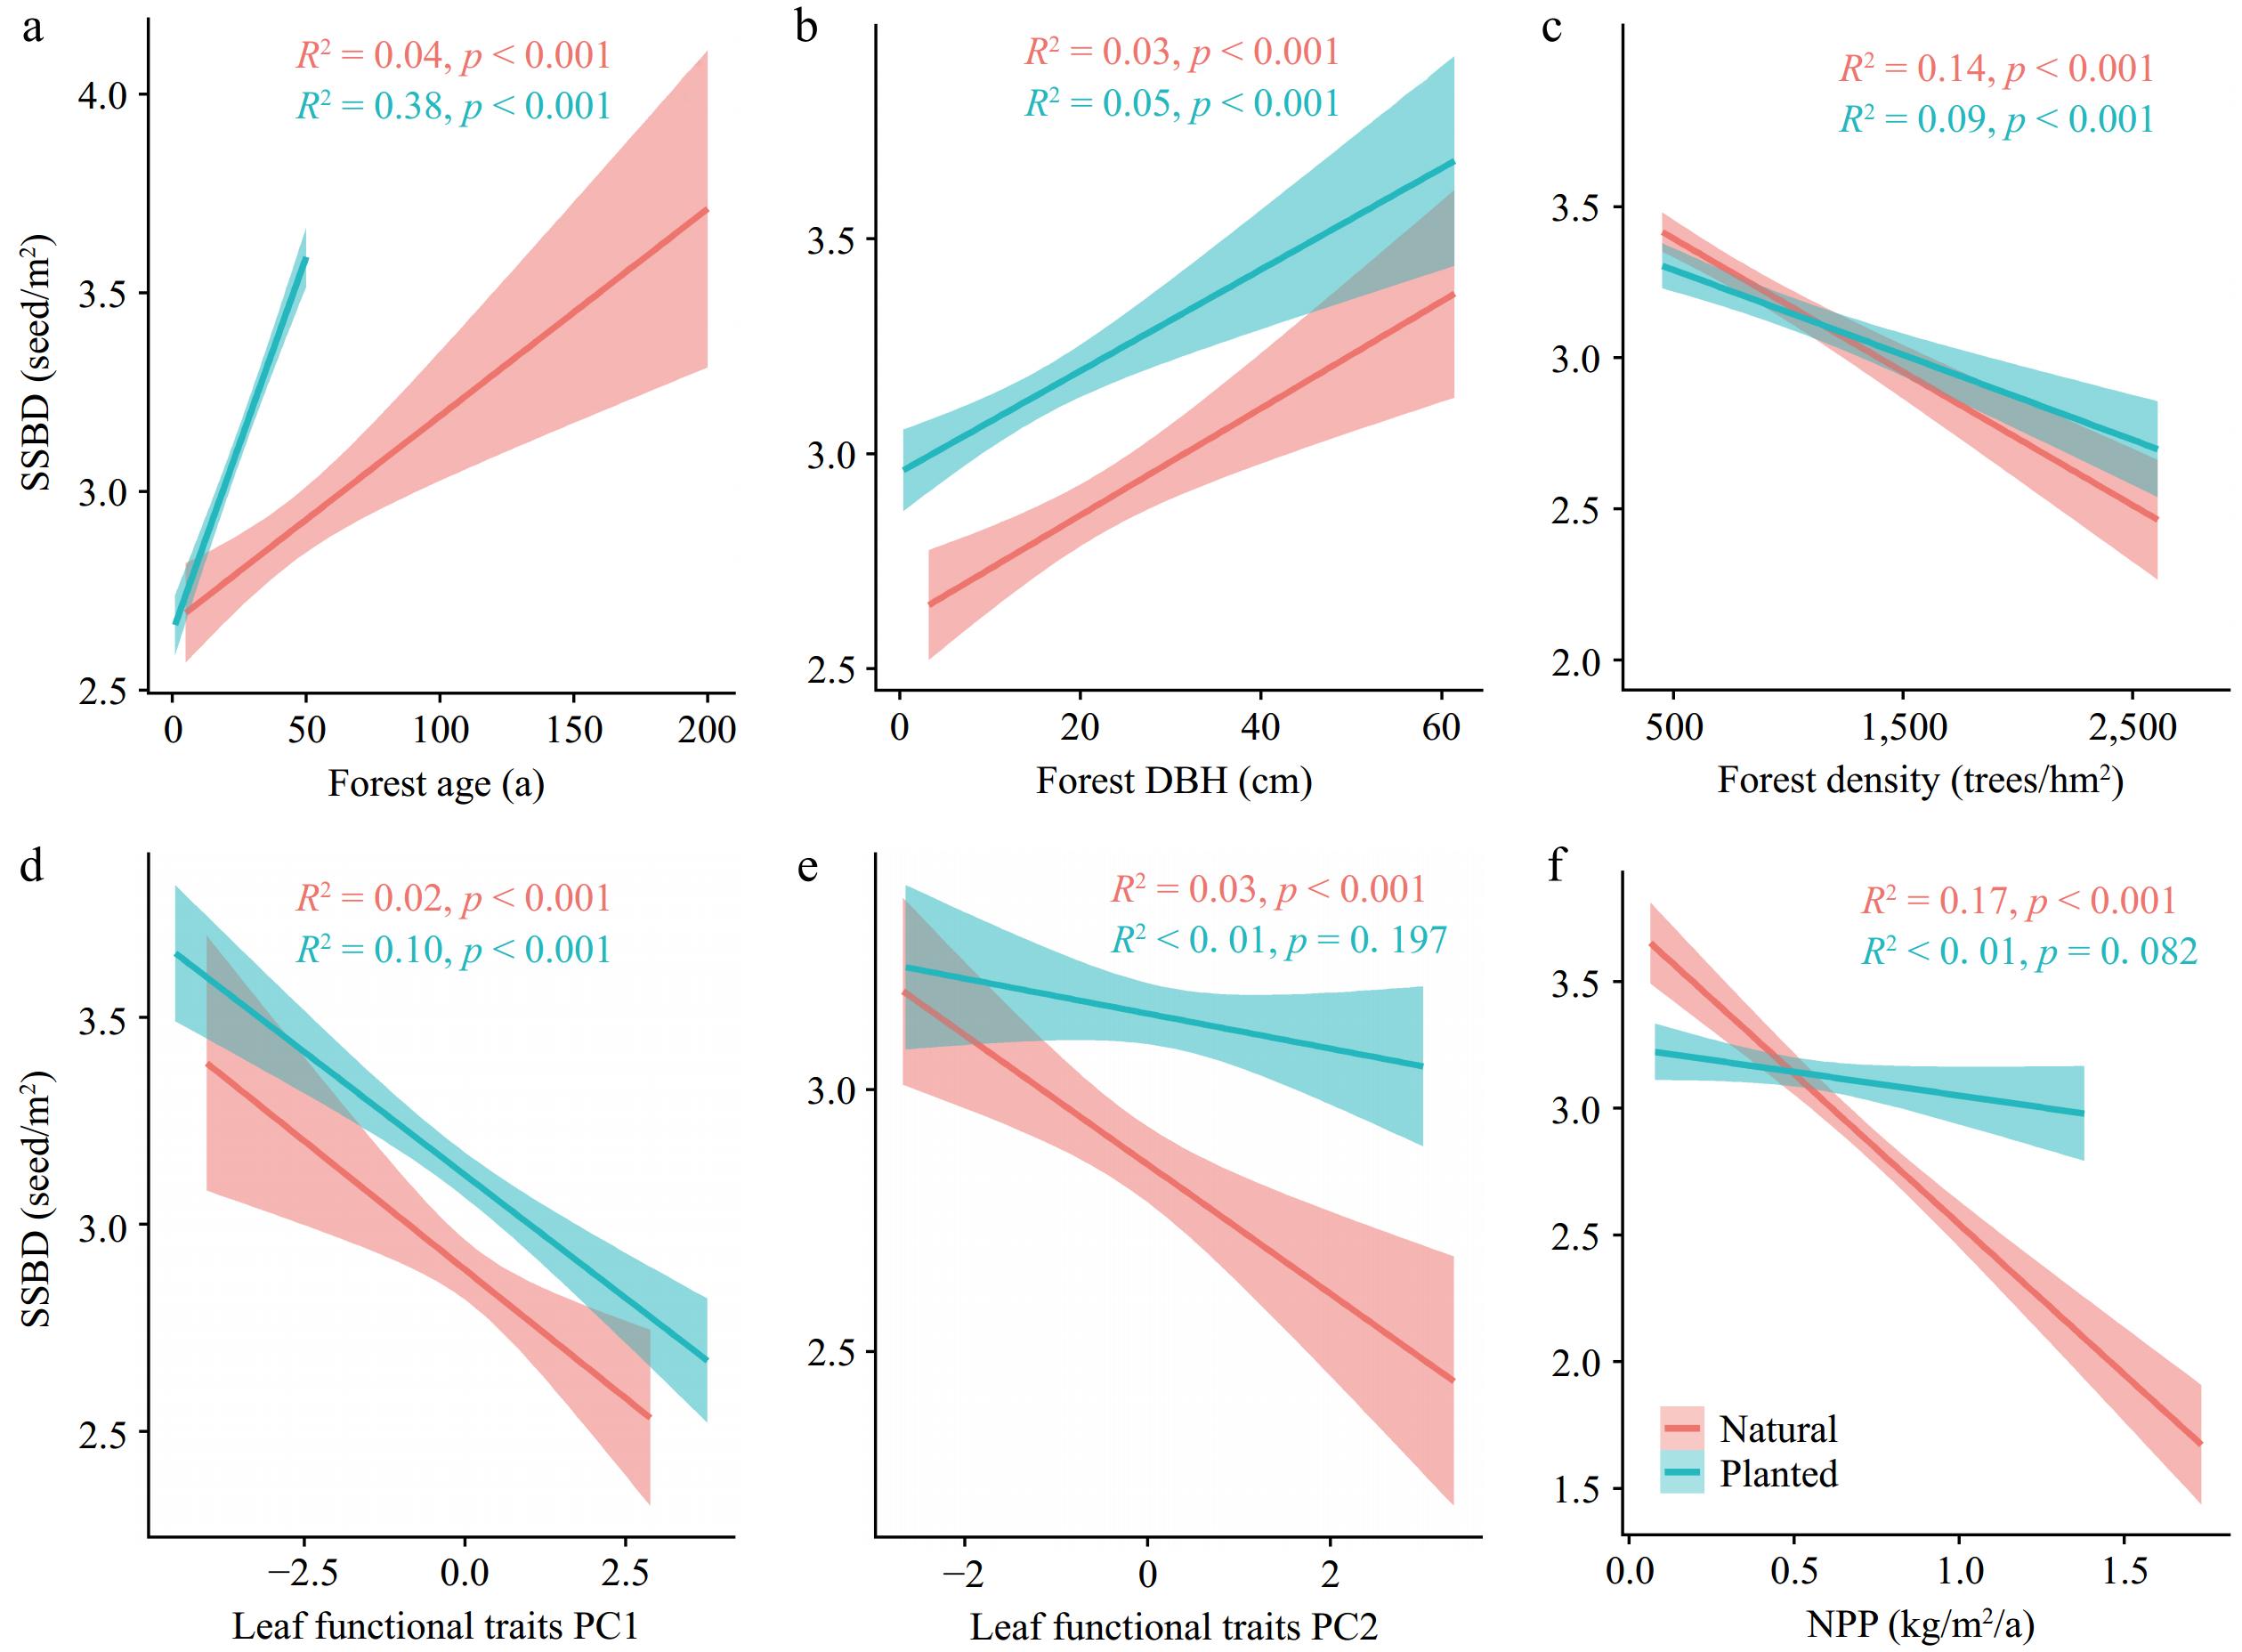
Figure 4.
The relationships between forest stand factors and SSBD in natural forest and planted forests. R2 represents the goodness of fit, and p-values indicate significance. Forest stand factors include: (a) Forest age; (b) Forest diameter at breast height (average DBH); (c) Forest density; (d) Leaf functional traits PC1; (e) Leaf functional traits PC2; (f) Net primary productivity (NPP).
-
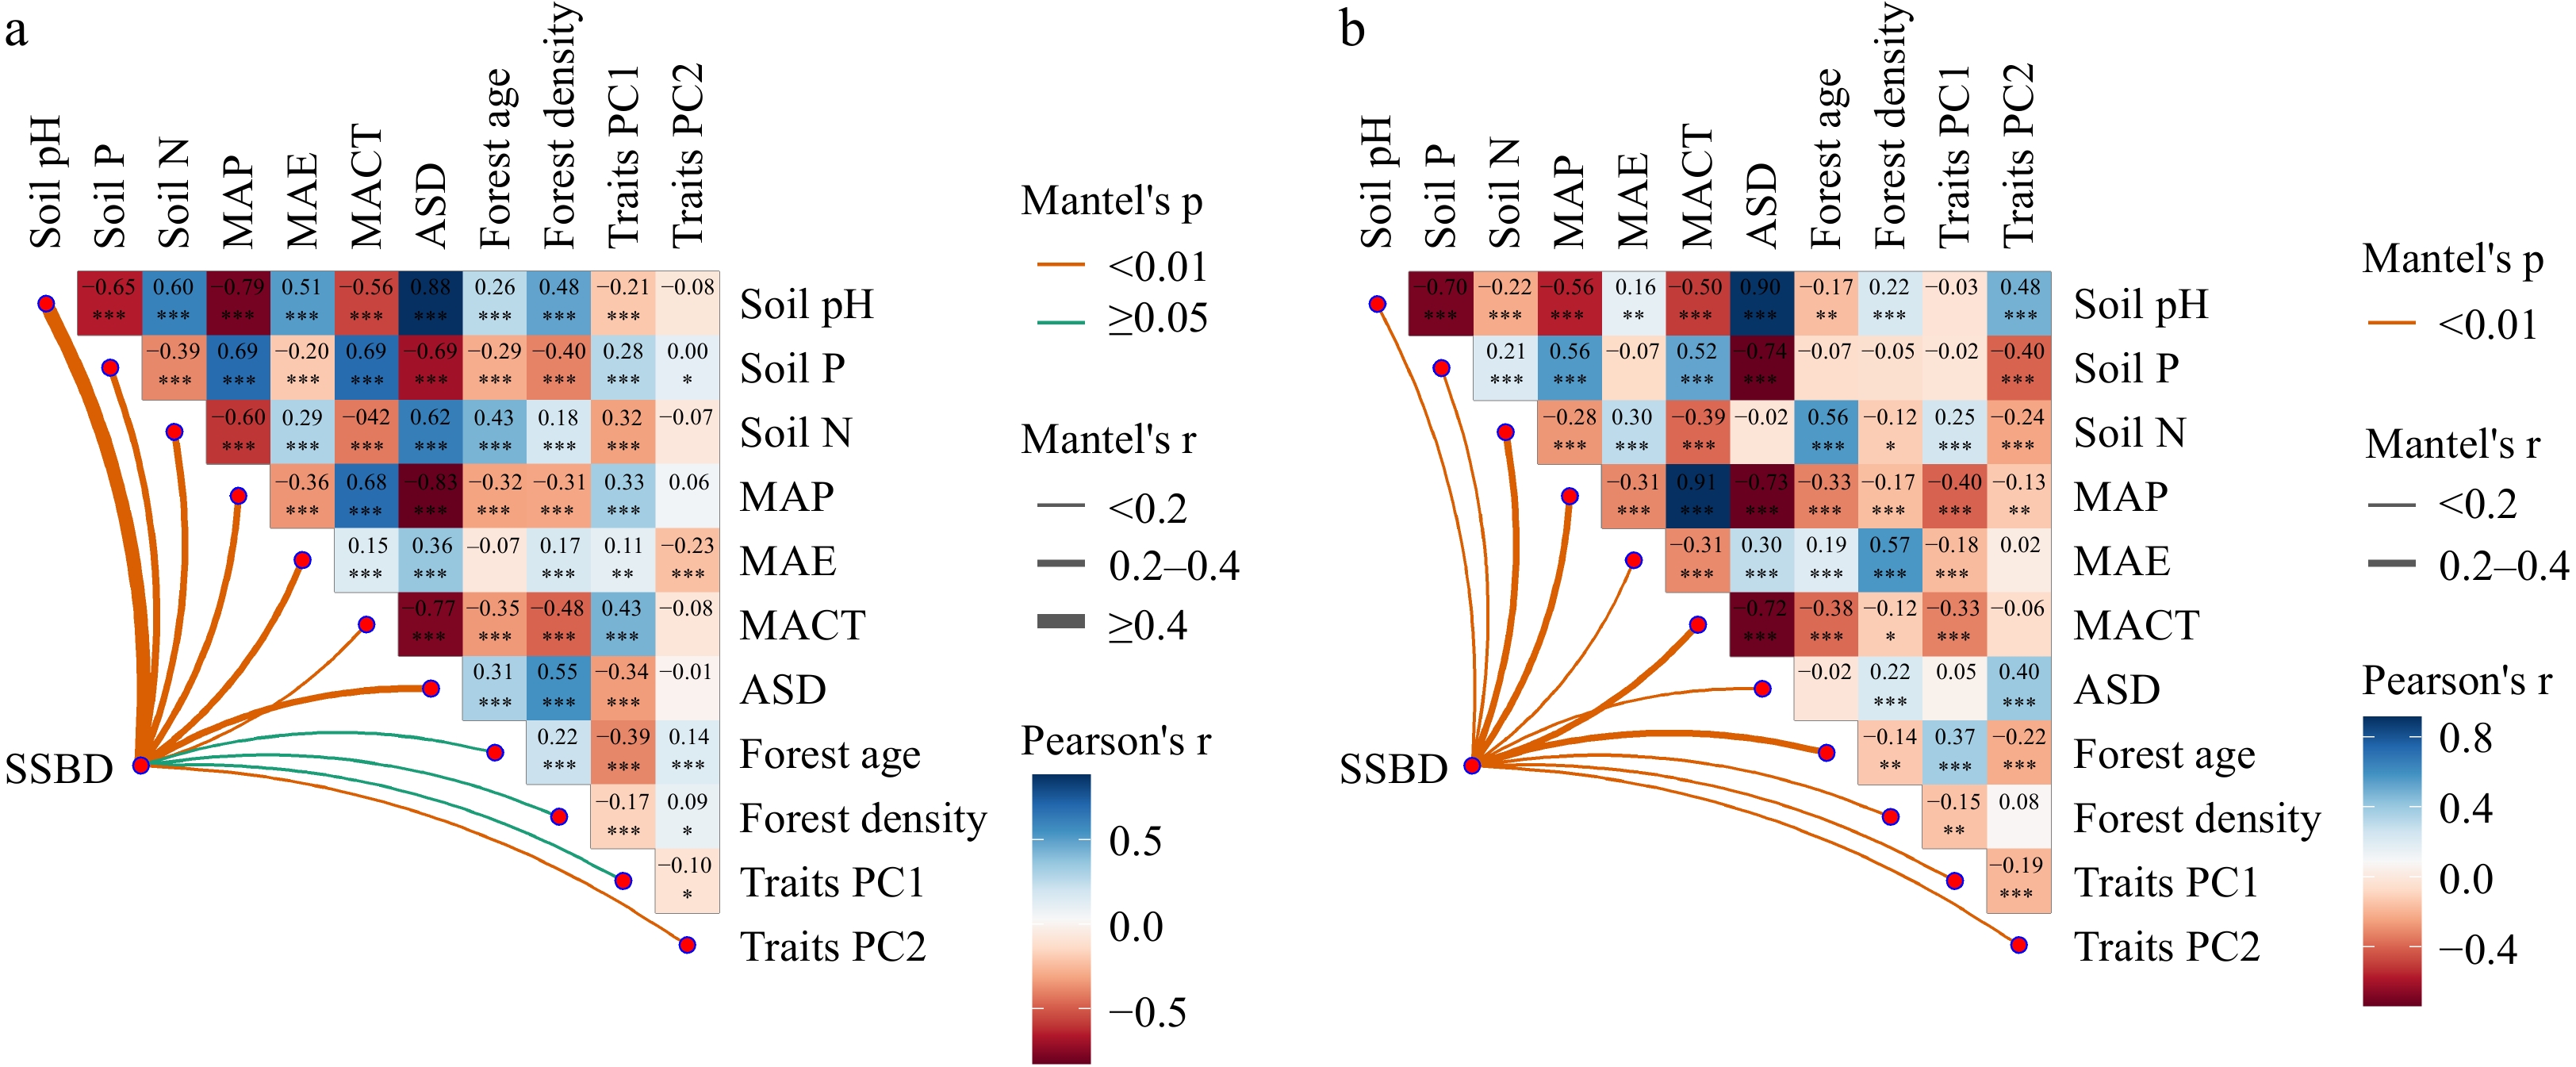
Figure 5.
Multivariate correlation analysis of potential influencing factors on SSBD in (a) natural forests, and (b) planted forests. MAP: Mean annual precipitation; MAE: Mean annual evaporation; MACT: Mean annual coldest month temperature; ASD: Annual sunlight duration; Soil N: Soil total nitrogen content; Soil P: Soil total phosphorus content; Soil pH: Soil pH; Traits PC1: Leaf functional traits PC1; Traits PC2: Leaf functional traits PC2.
-
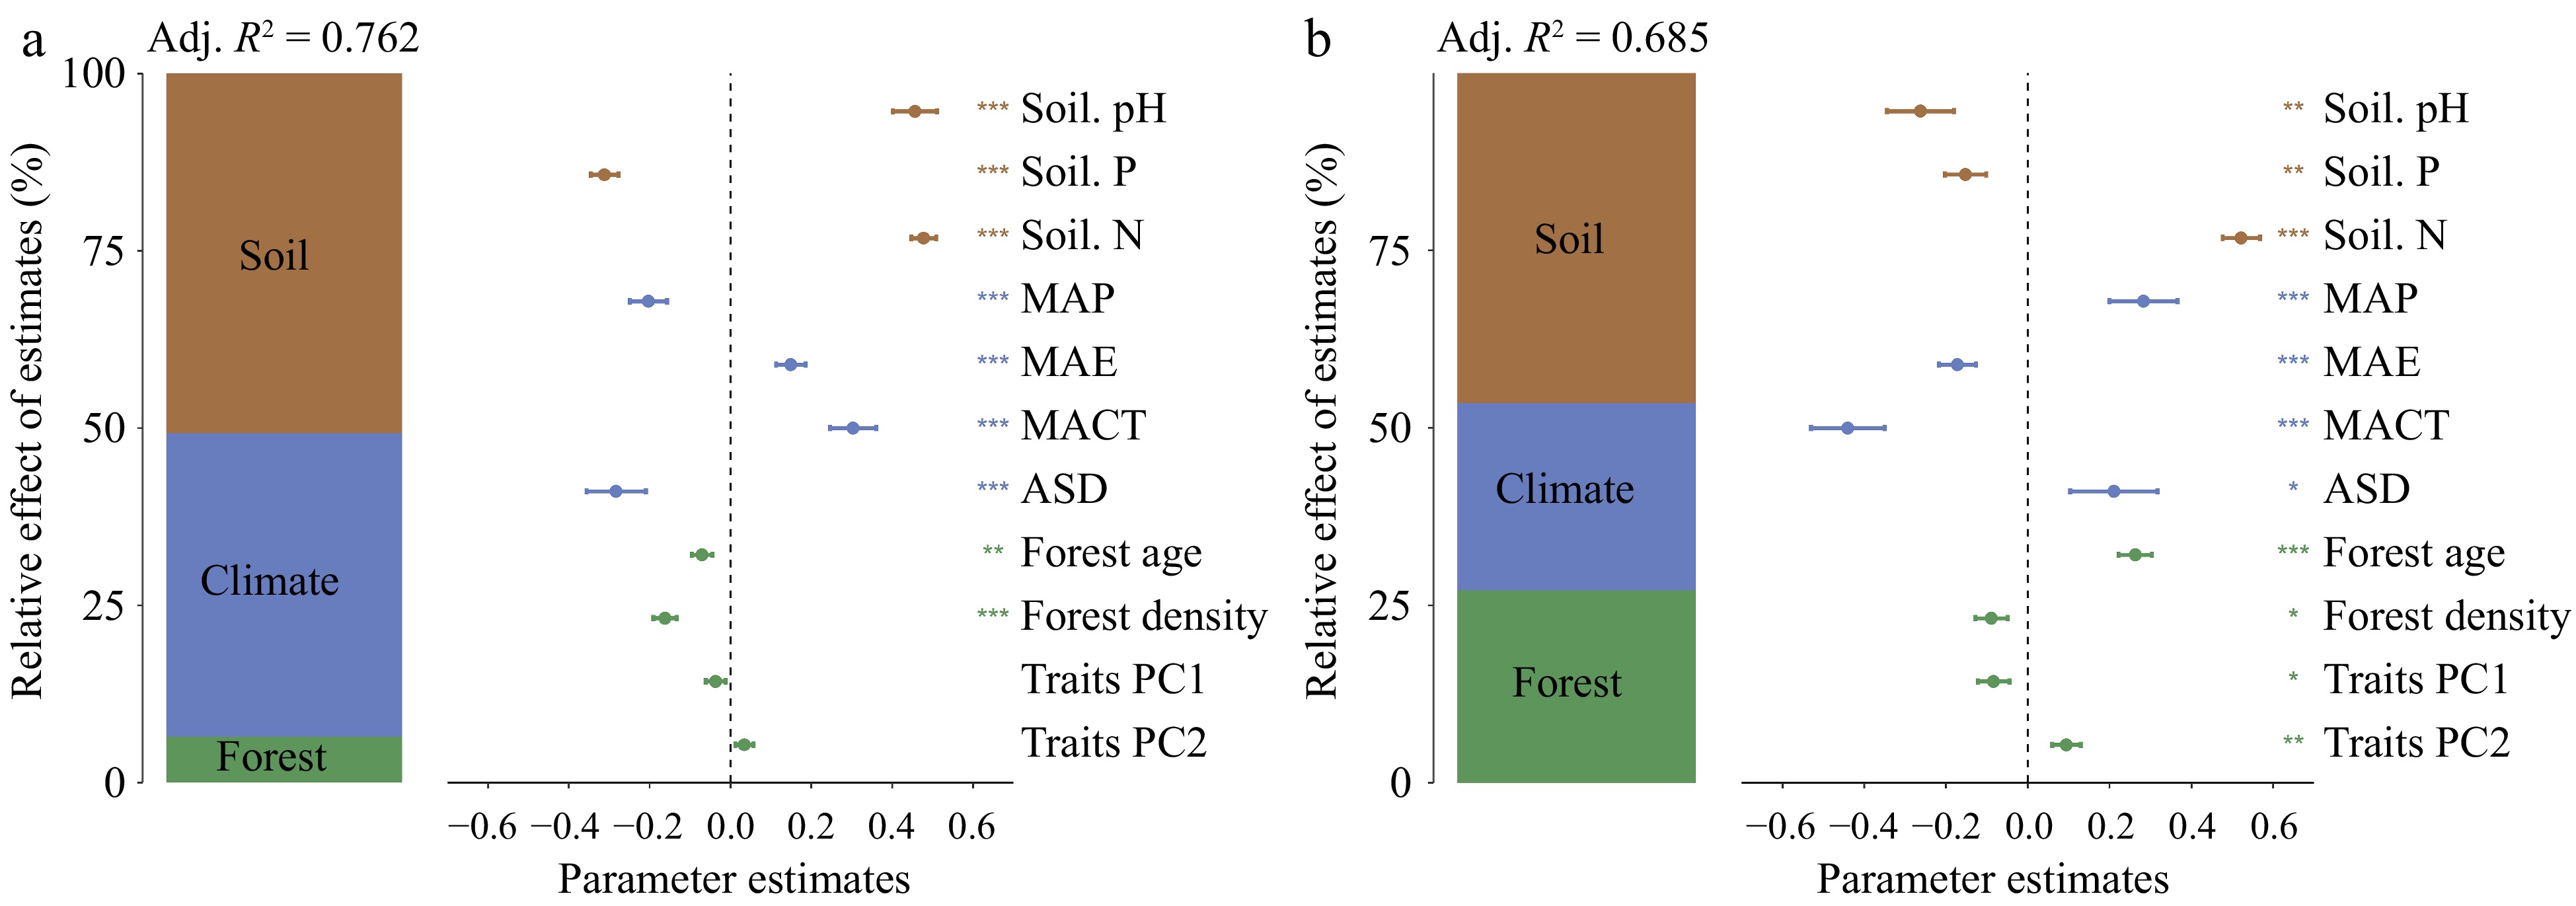
Figure 6.
Impact of potential factors on SSBD in (a) natural forests, and (b) planted forests. The figure presents the average parameter estimates (standardized regression coefficients), related 95% confidence intervals, and the relative importance of each factor, expressed as the percentage of explained variance. The adjusted R2 for the average model and the p-values for each predictive factor are denoted as follows: * p < 0.05; ** p < 0.01; *** p < 0.001.
-
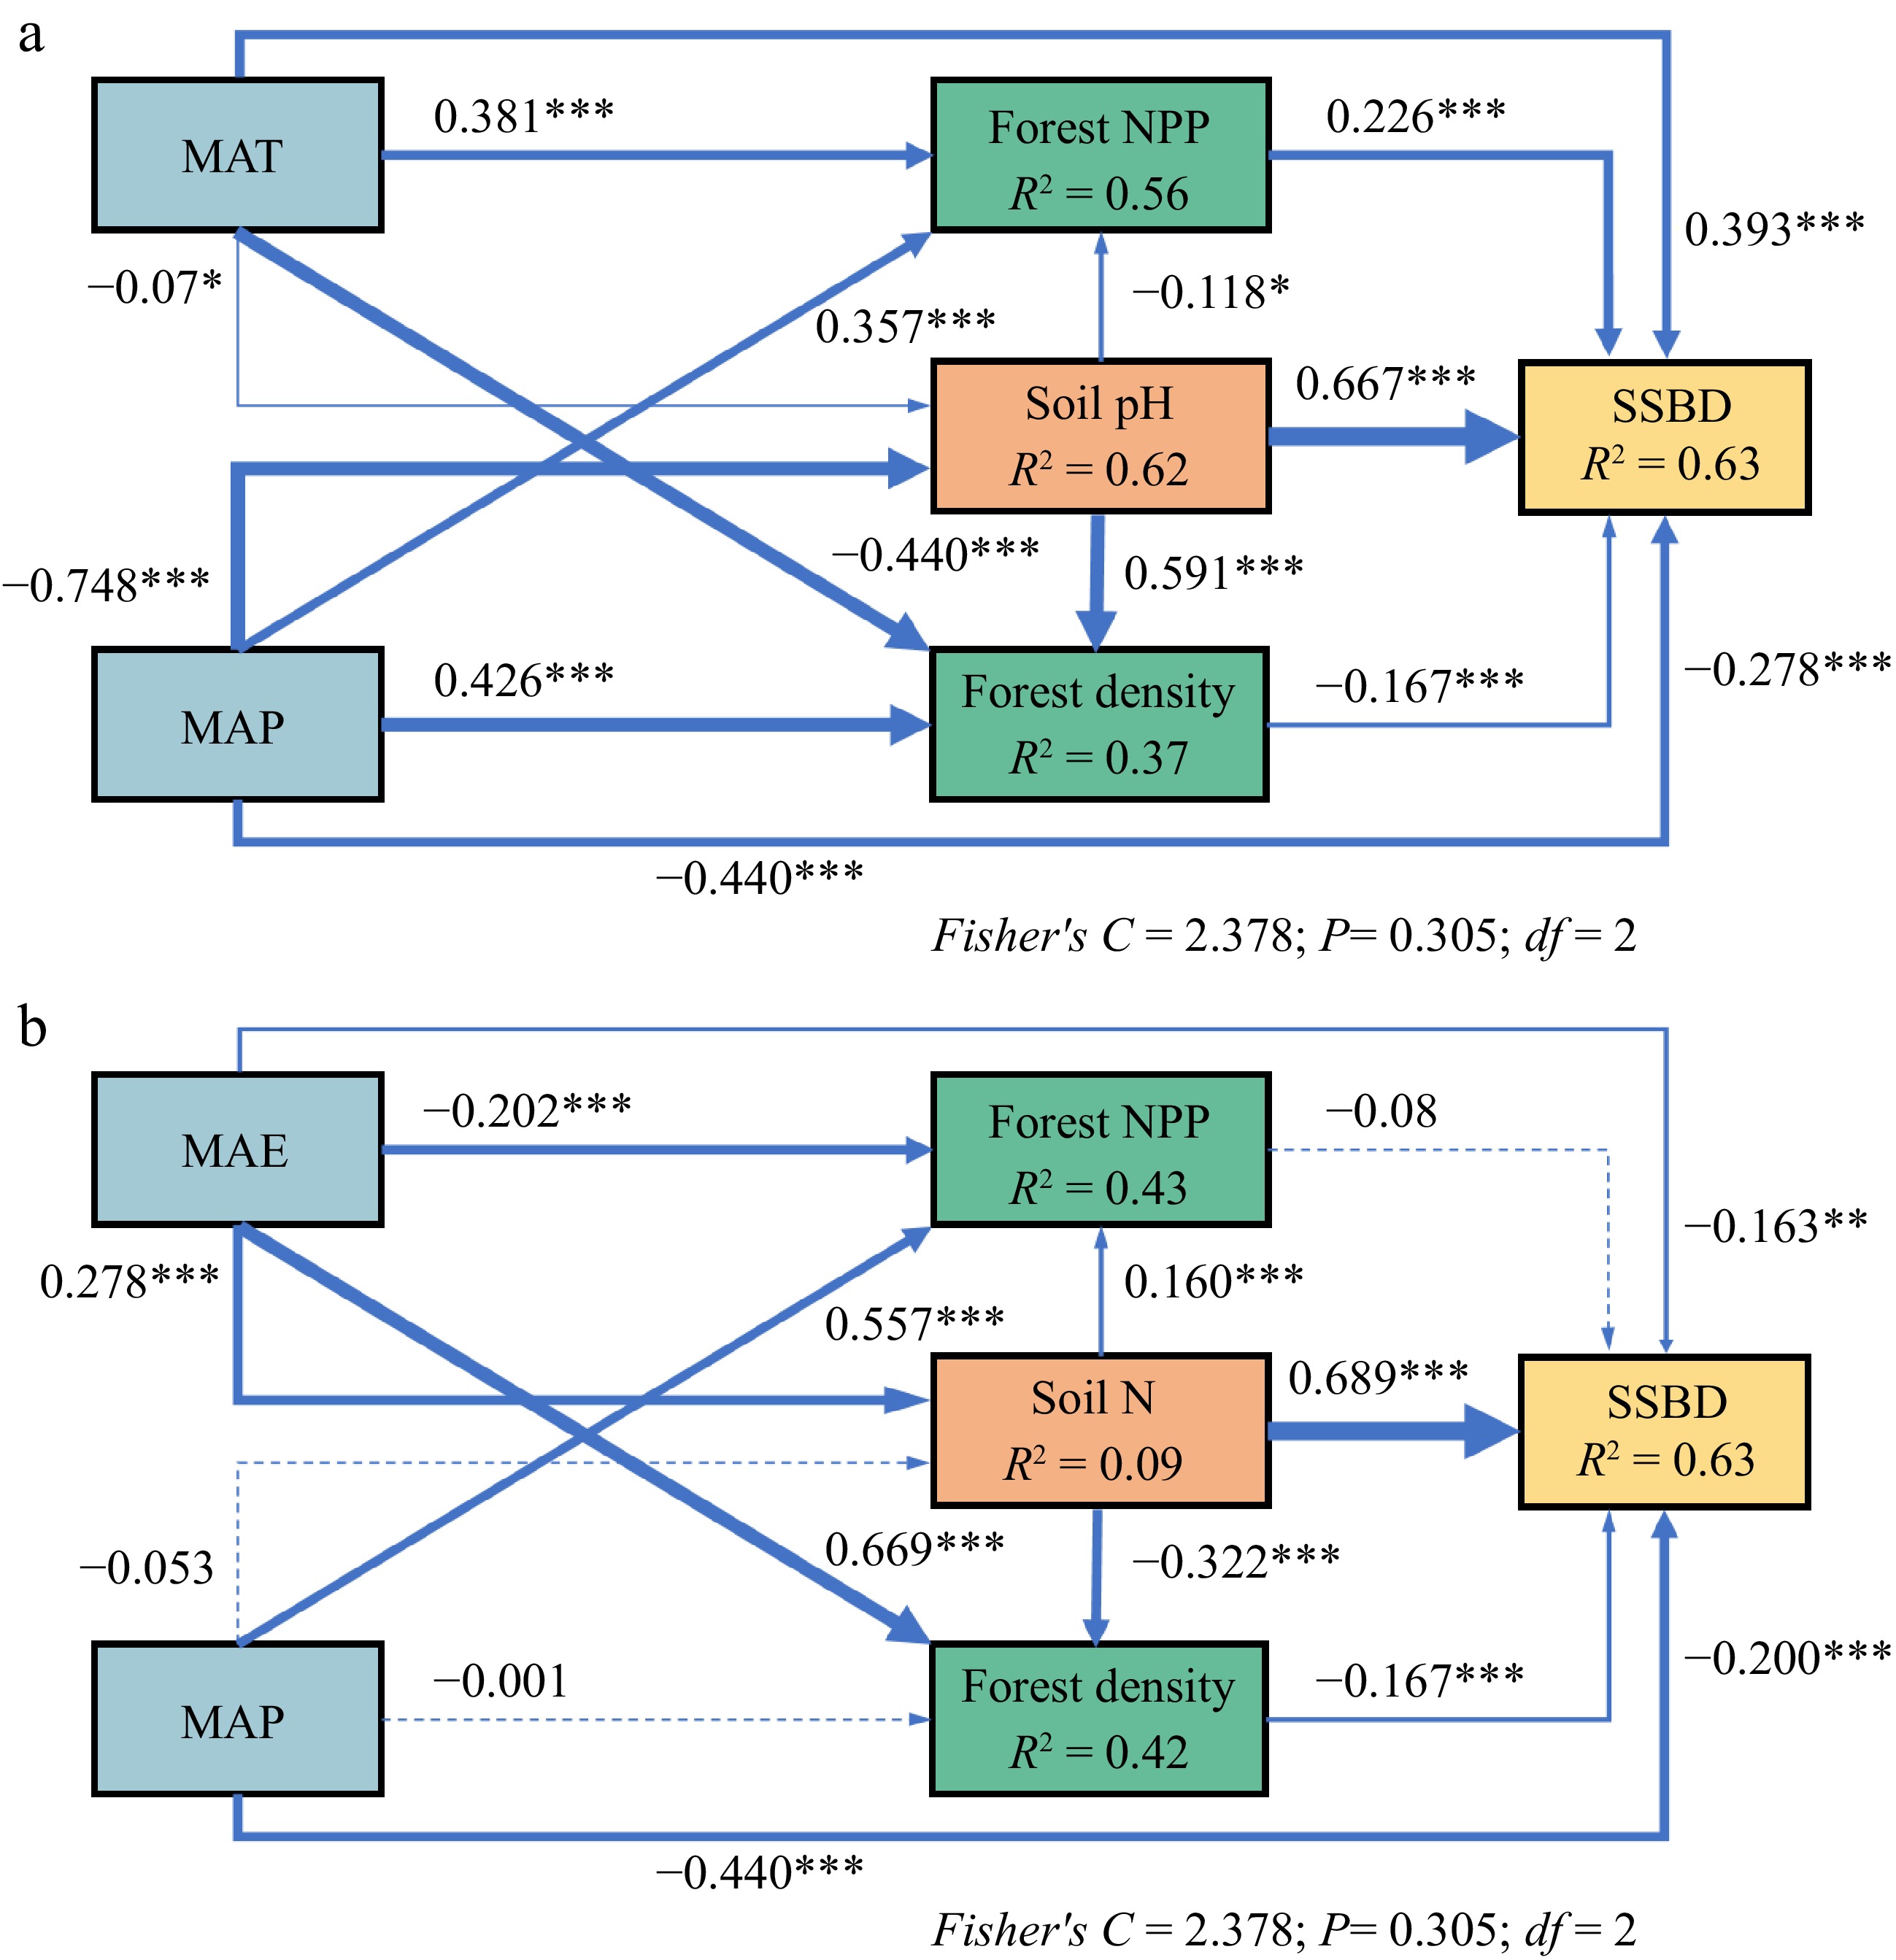
Figure 7.
Relationships between SSBD and climatic factors, soil nutrients, and forest stand factors in (a) natural forests, and (b) planted forests. The path diagrams represent the standardized results of the final Structural Equation Models (SEMs) testing relationships between variables. Numbers alongside the paths indicate the standardized SEM coefficients, and asterisks denote significance (*** p < 0.001; ** p < 0.01; * p < 0.05). R2 indicates the goodness of fit for the generalized additive models. The best SEMs were selected based on the lowest Akaike information criterion.
Figures
(7)
Tables
(0)