-
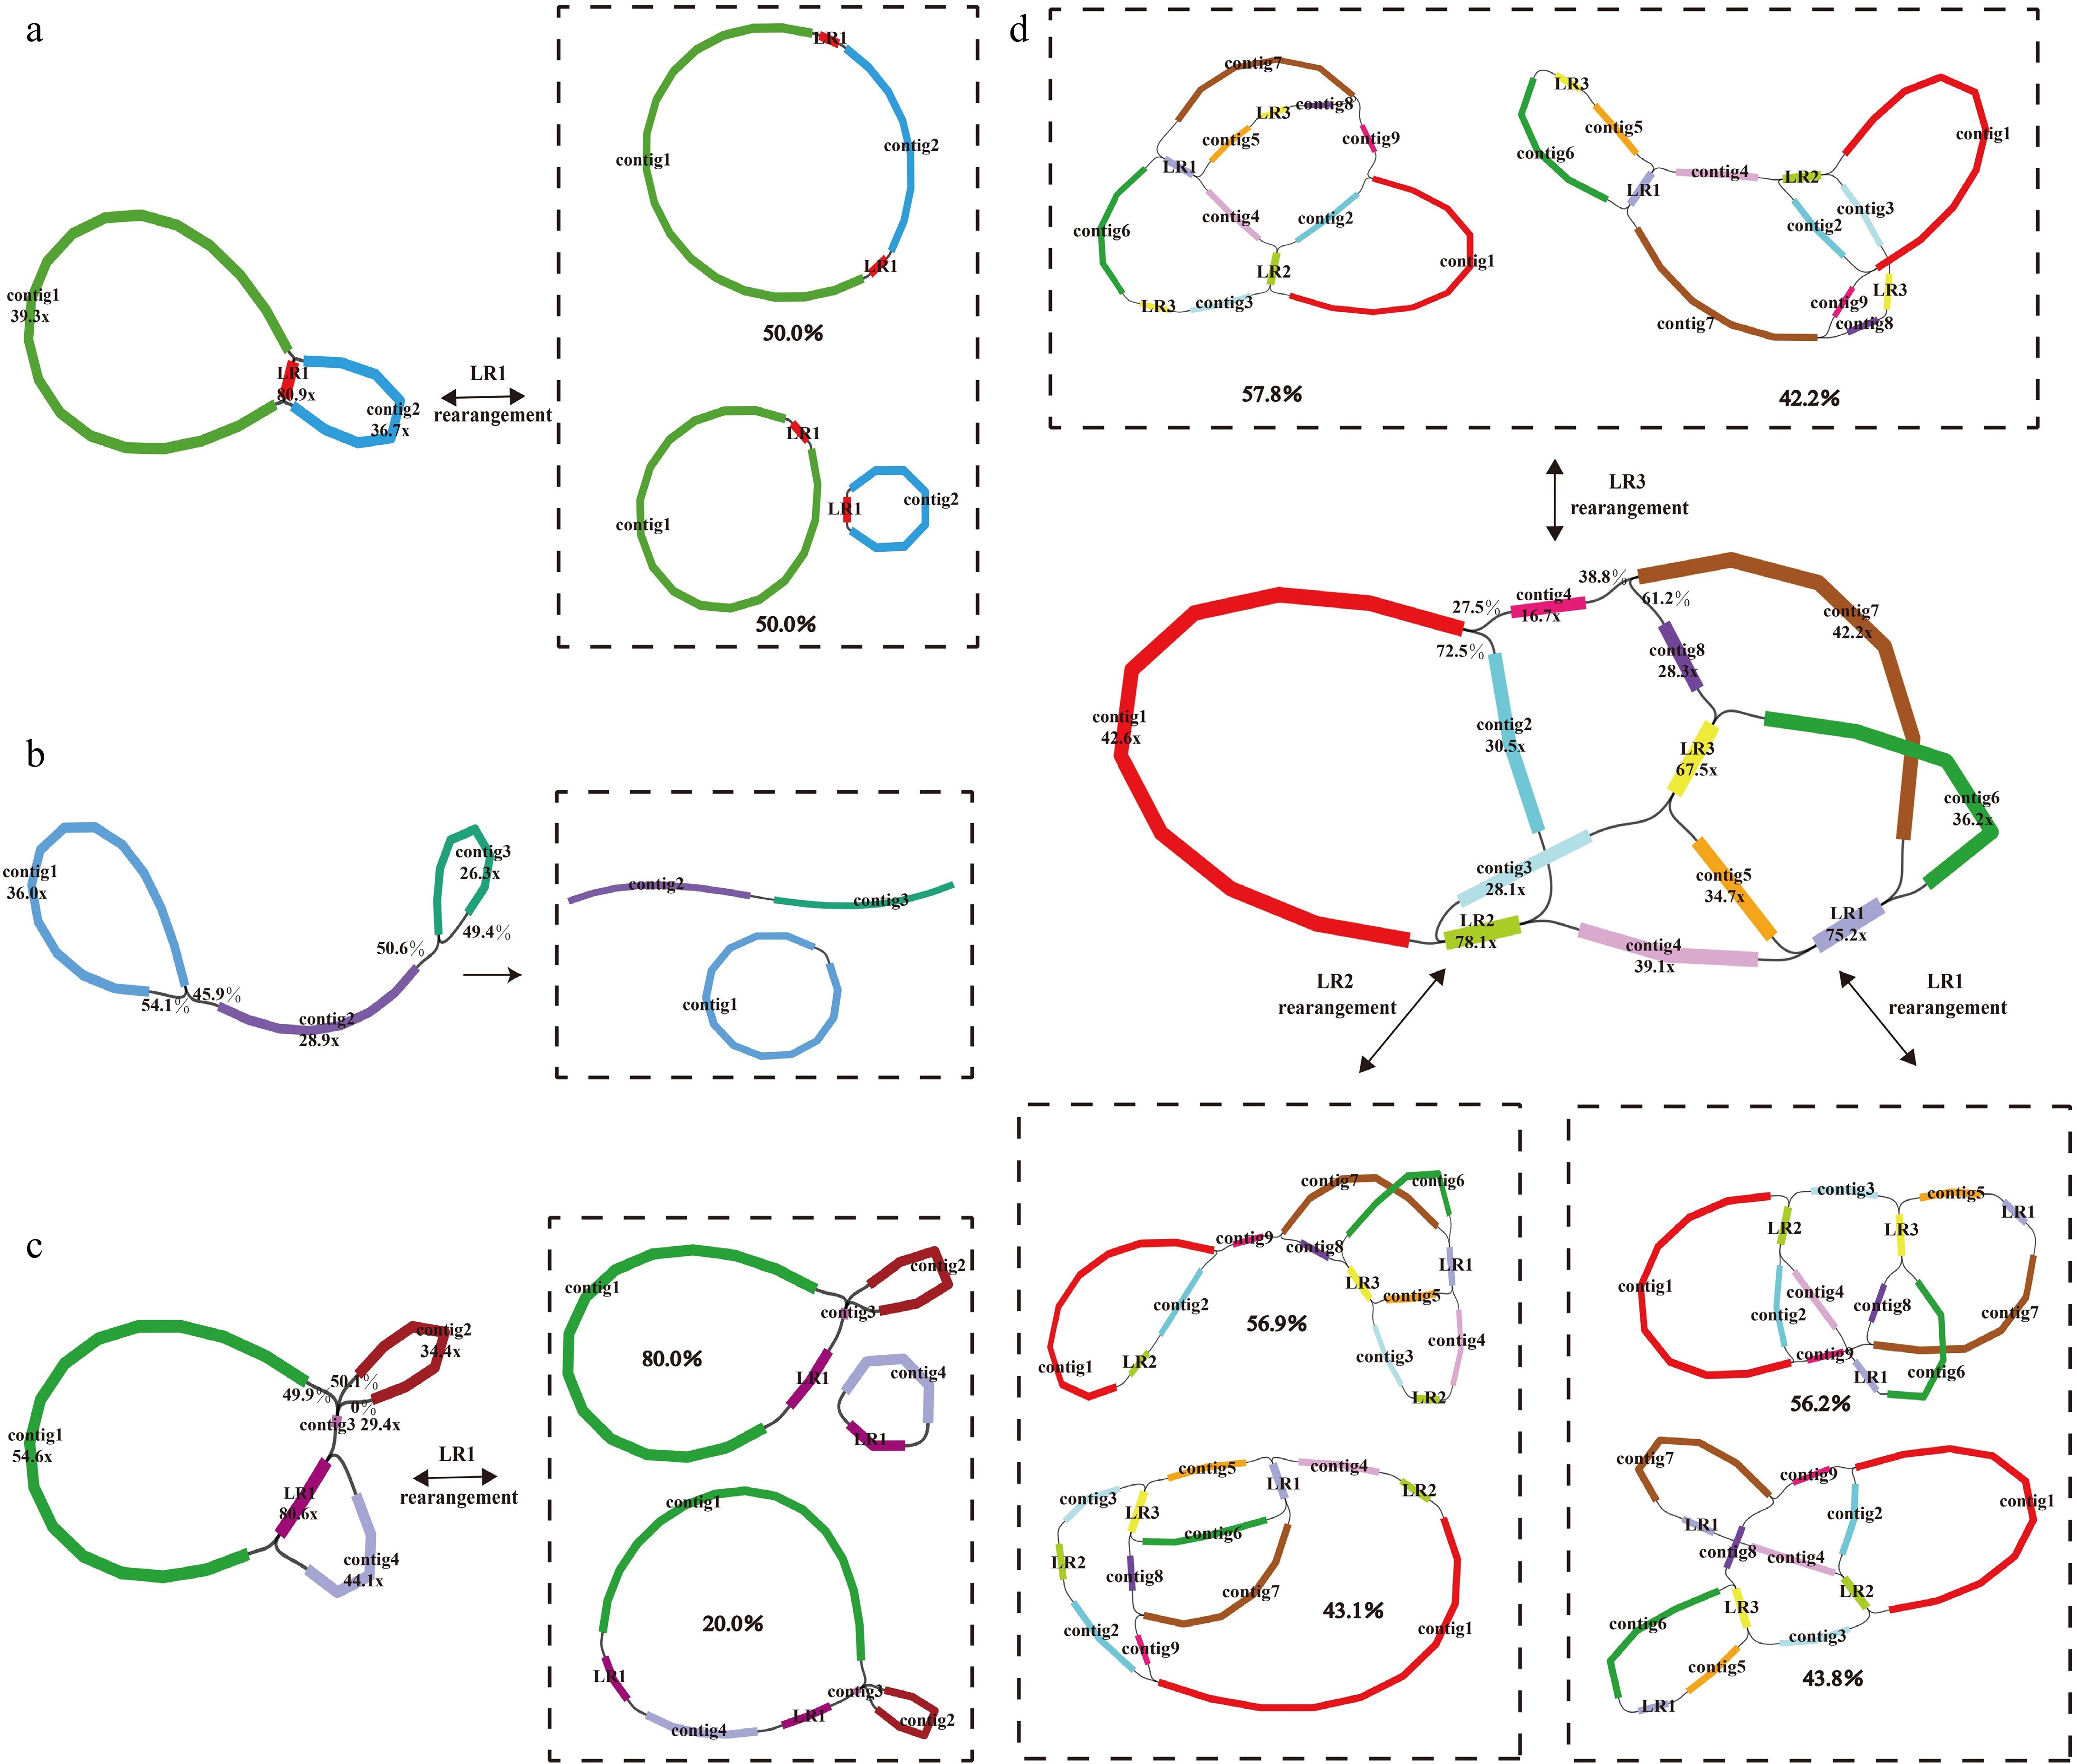
Figure 1.
Mitogenome assembly graph and possible connections (black lines) mediated by repeats for (a) M. notabilis, (b) M. mongolica, (c) M. alba-ZS5801, and (d) M. alba-ZZB. Each colored segment is labeled with its name and coverage. The boxes represent the different mitogenome conformations mediated by each pair of repeats and the probability of being supported.
-
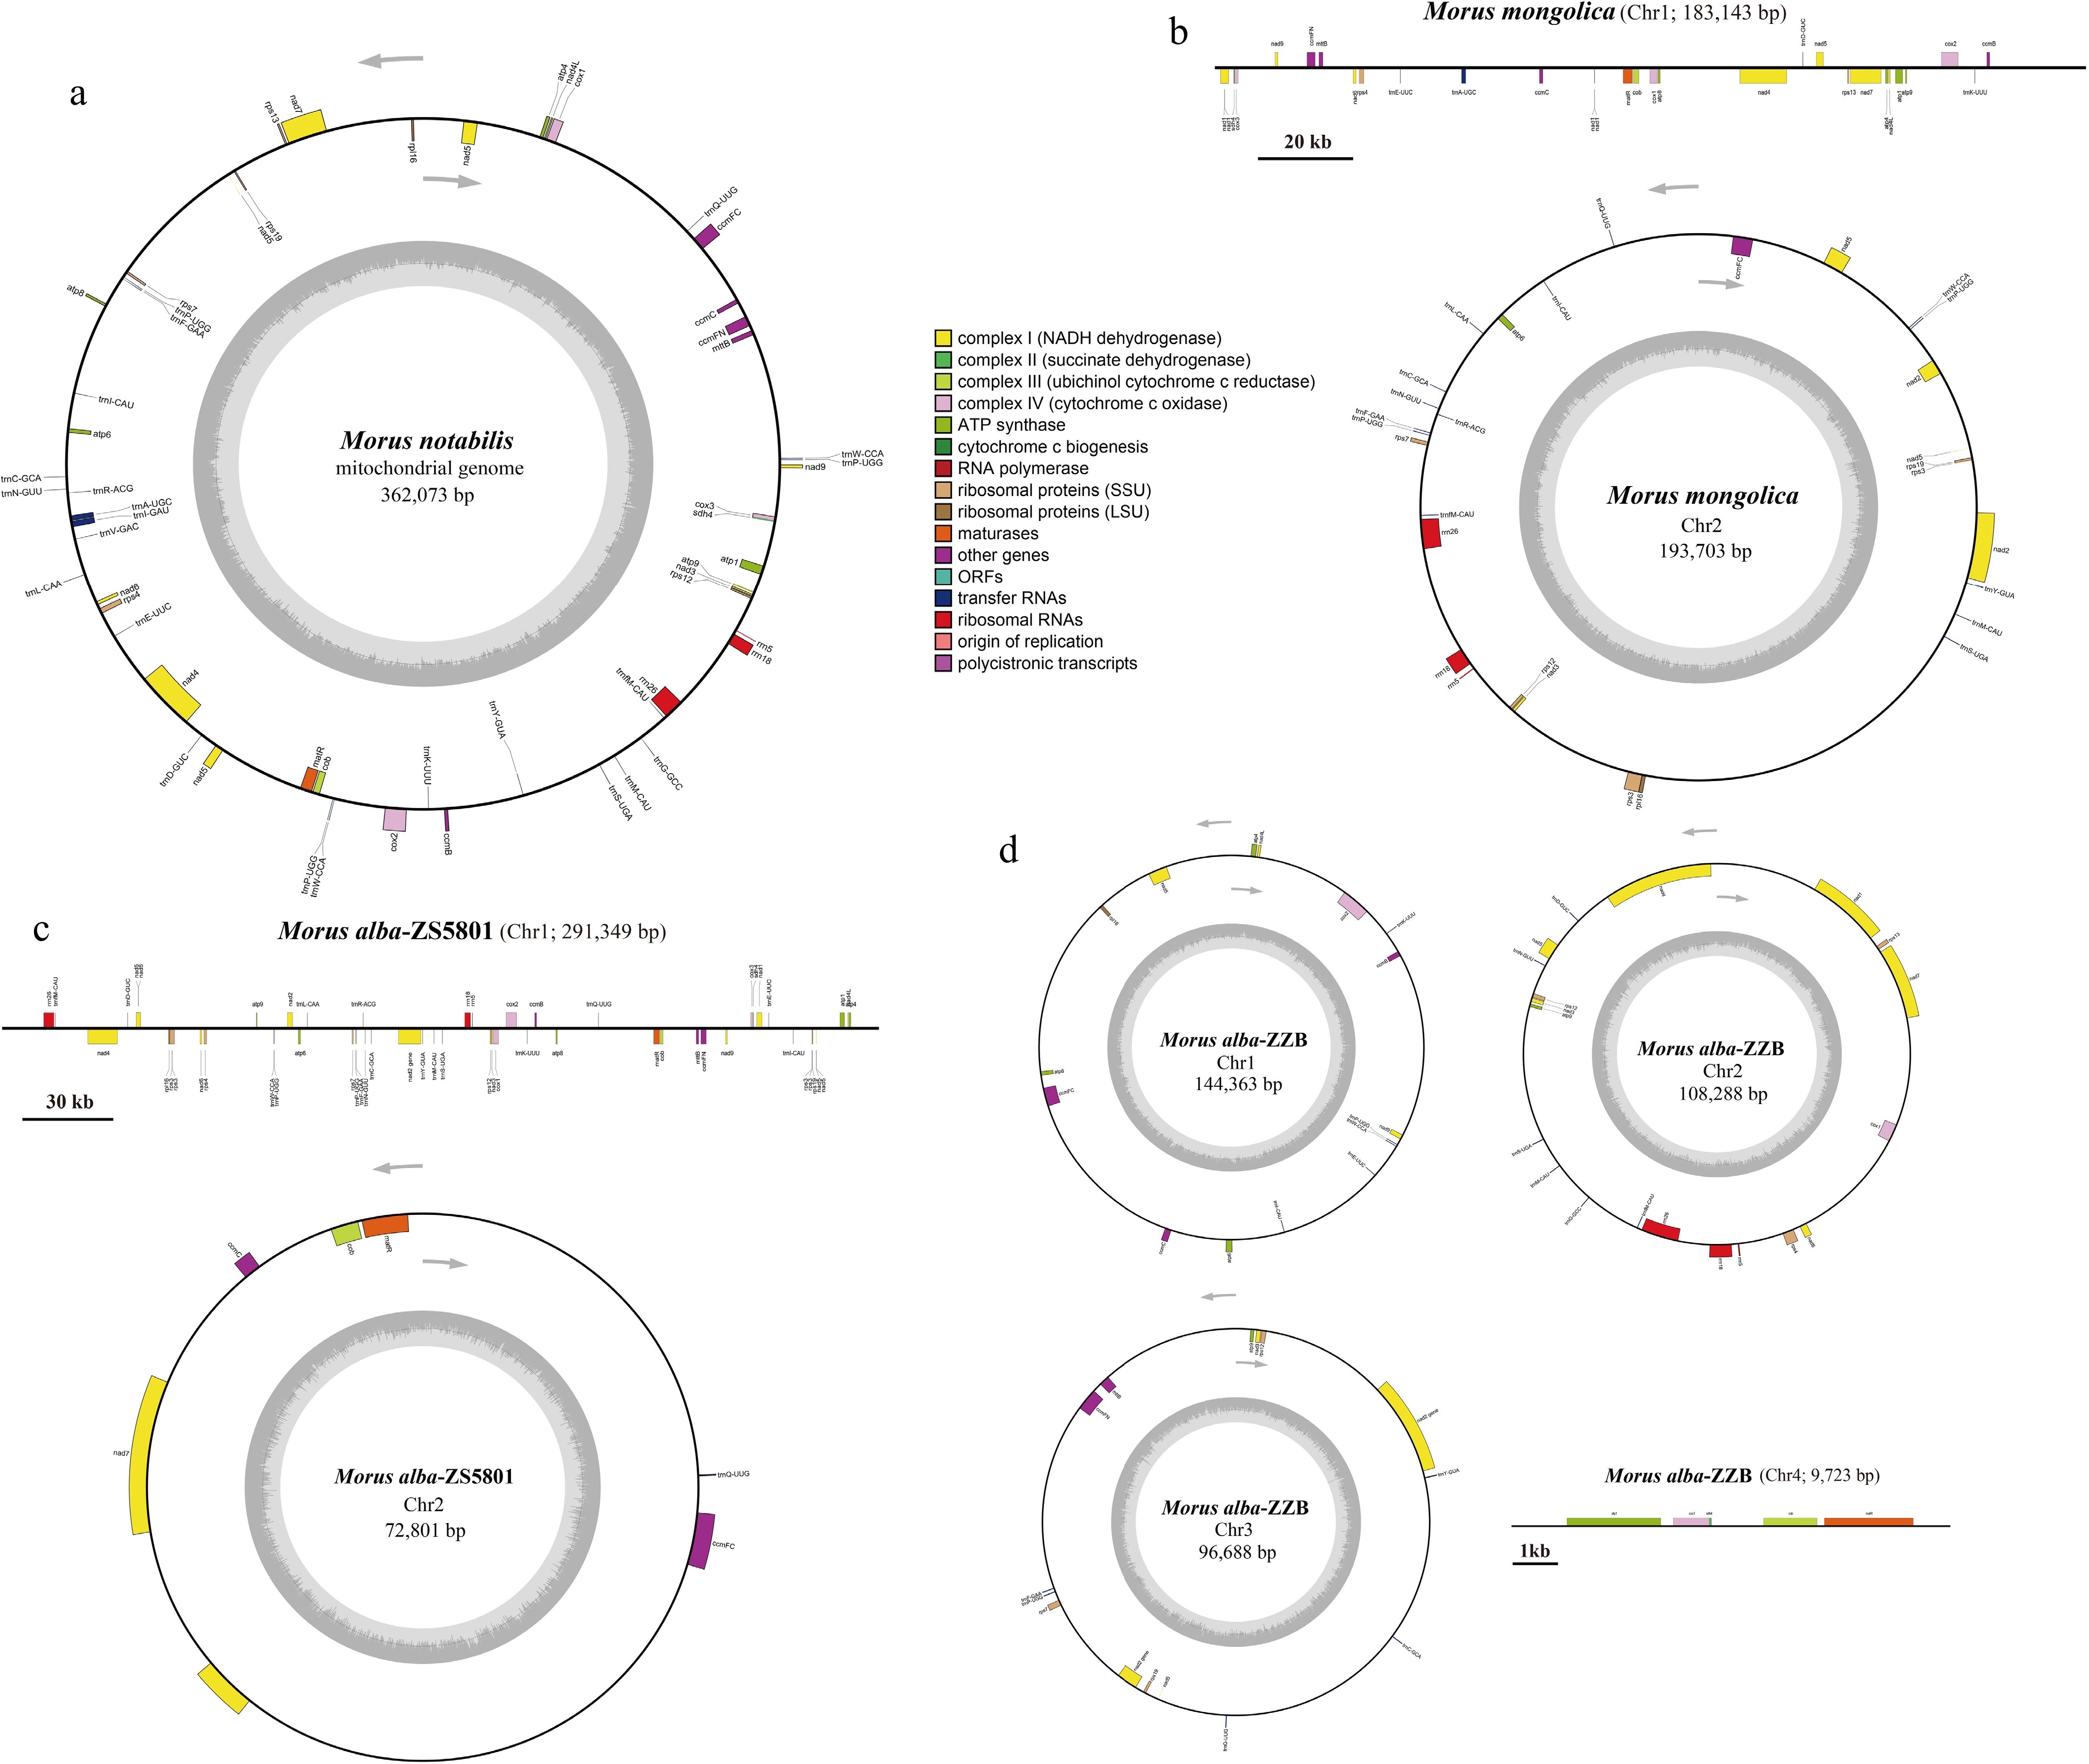
Figure 2.
The mitogenome map of Morus species. (a) M. notabilis, (b) M. mongolica, (c) M. alba-ZS5801, and (d) M. alba-ZZB. Genes belonging to different functional groups are color-coded.
-
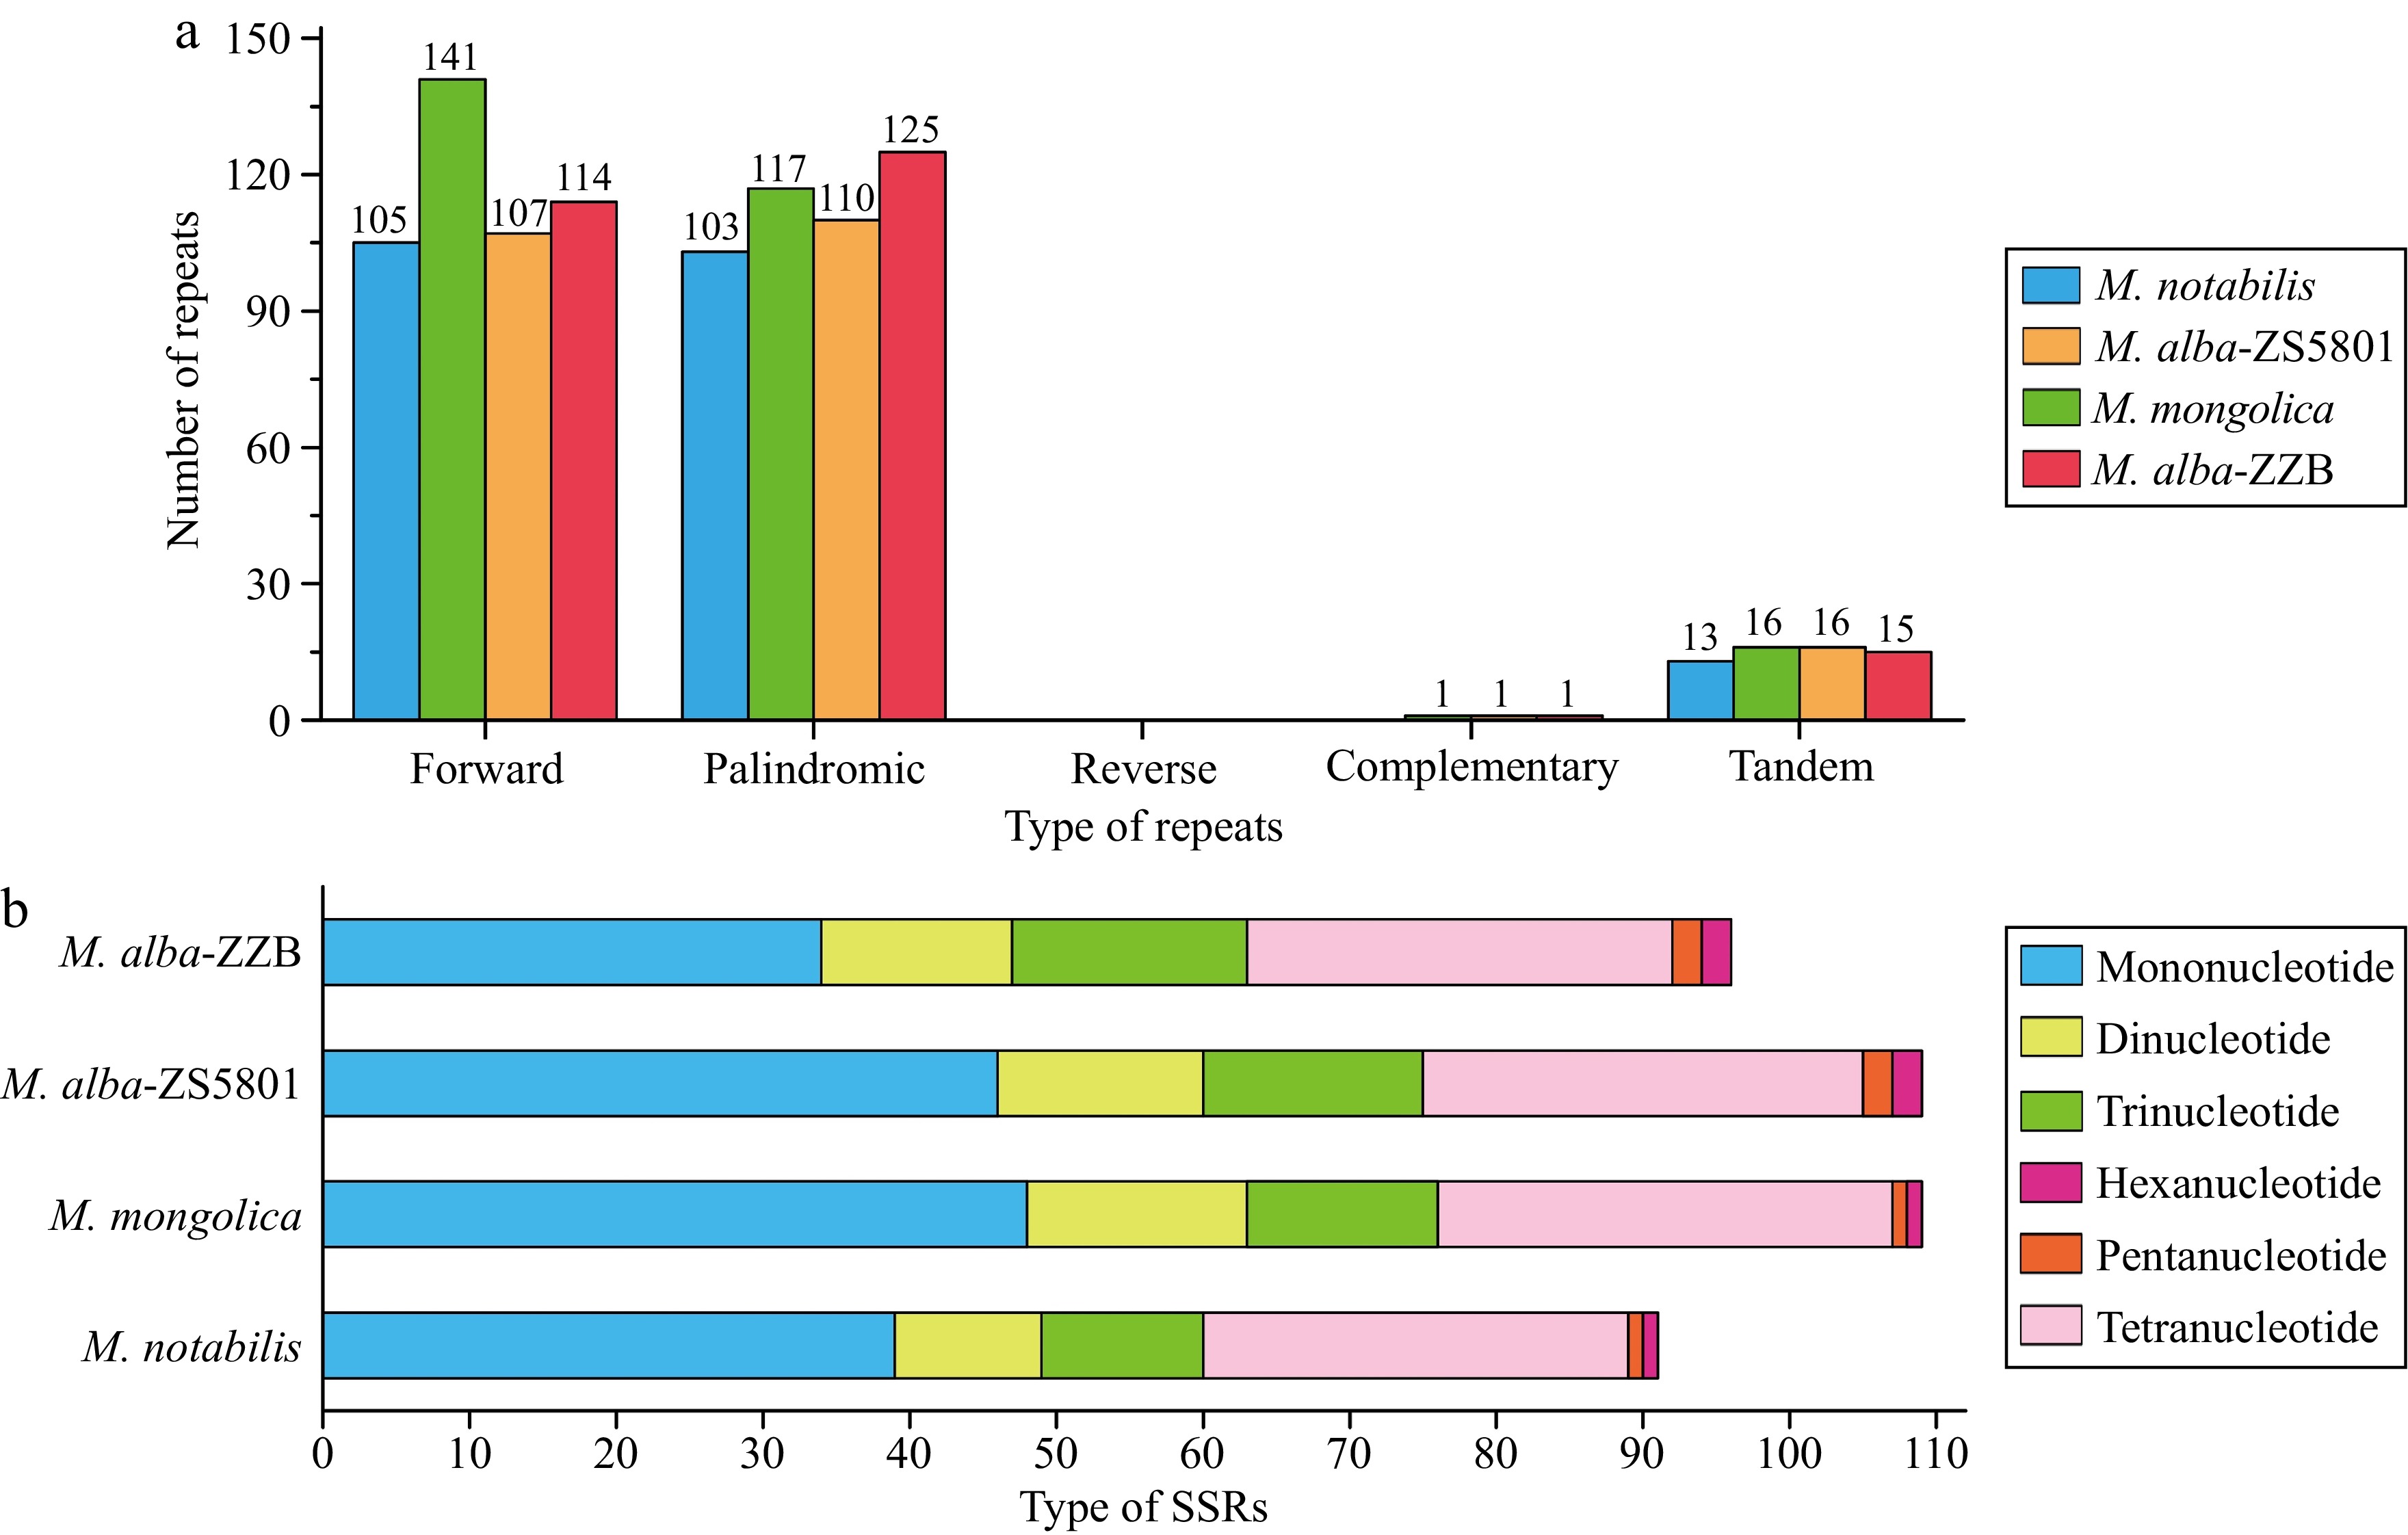
Figure 3.
Repeat sequences in the Morus mitogenomes. (a) Type and number of dispersed repeats and tandem repeats, (b) type and number of simple sequence repeats (SSRs).
-
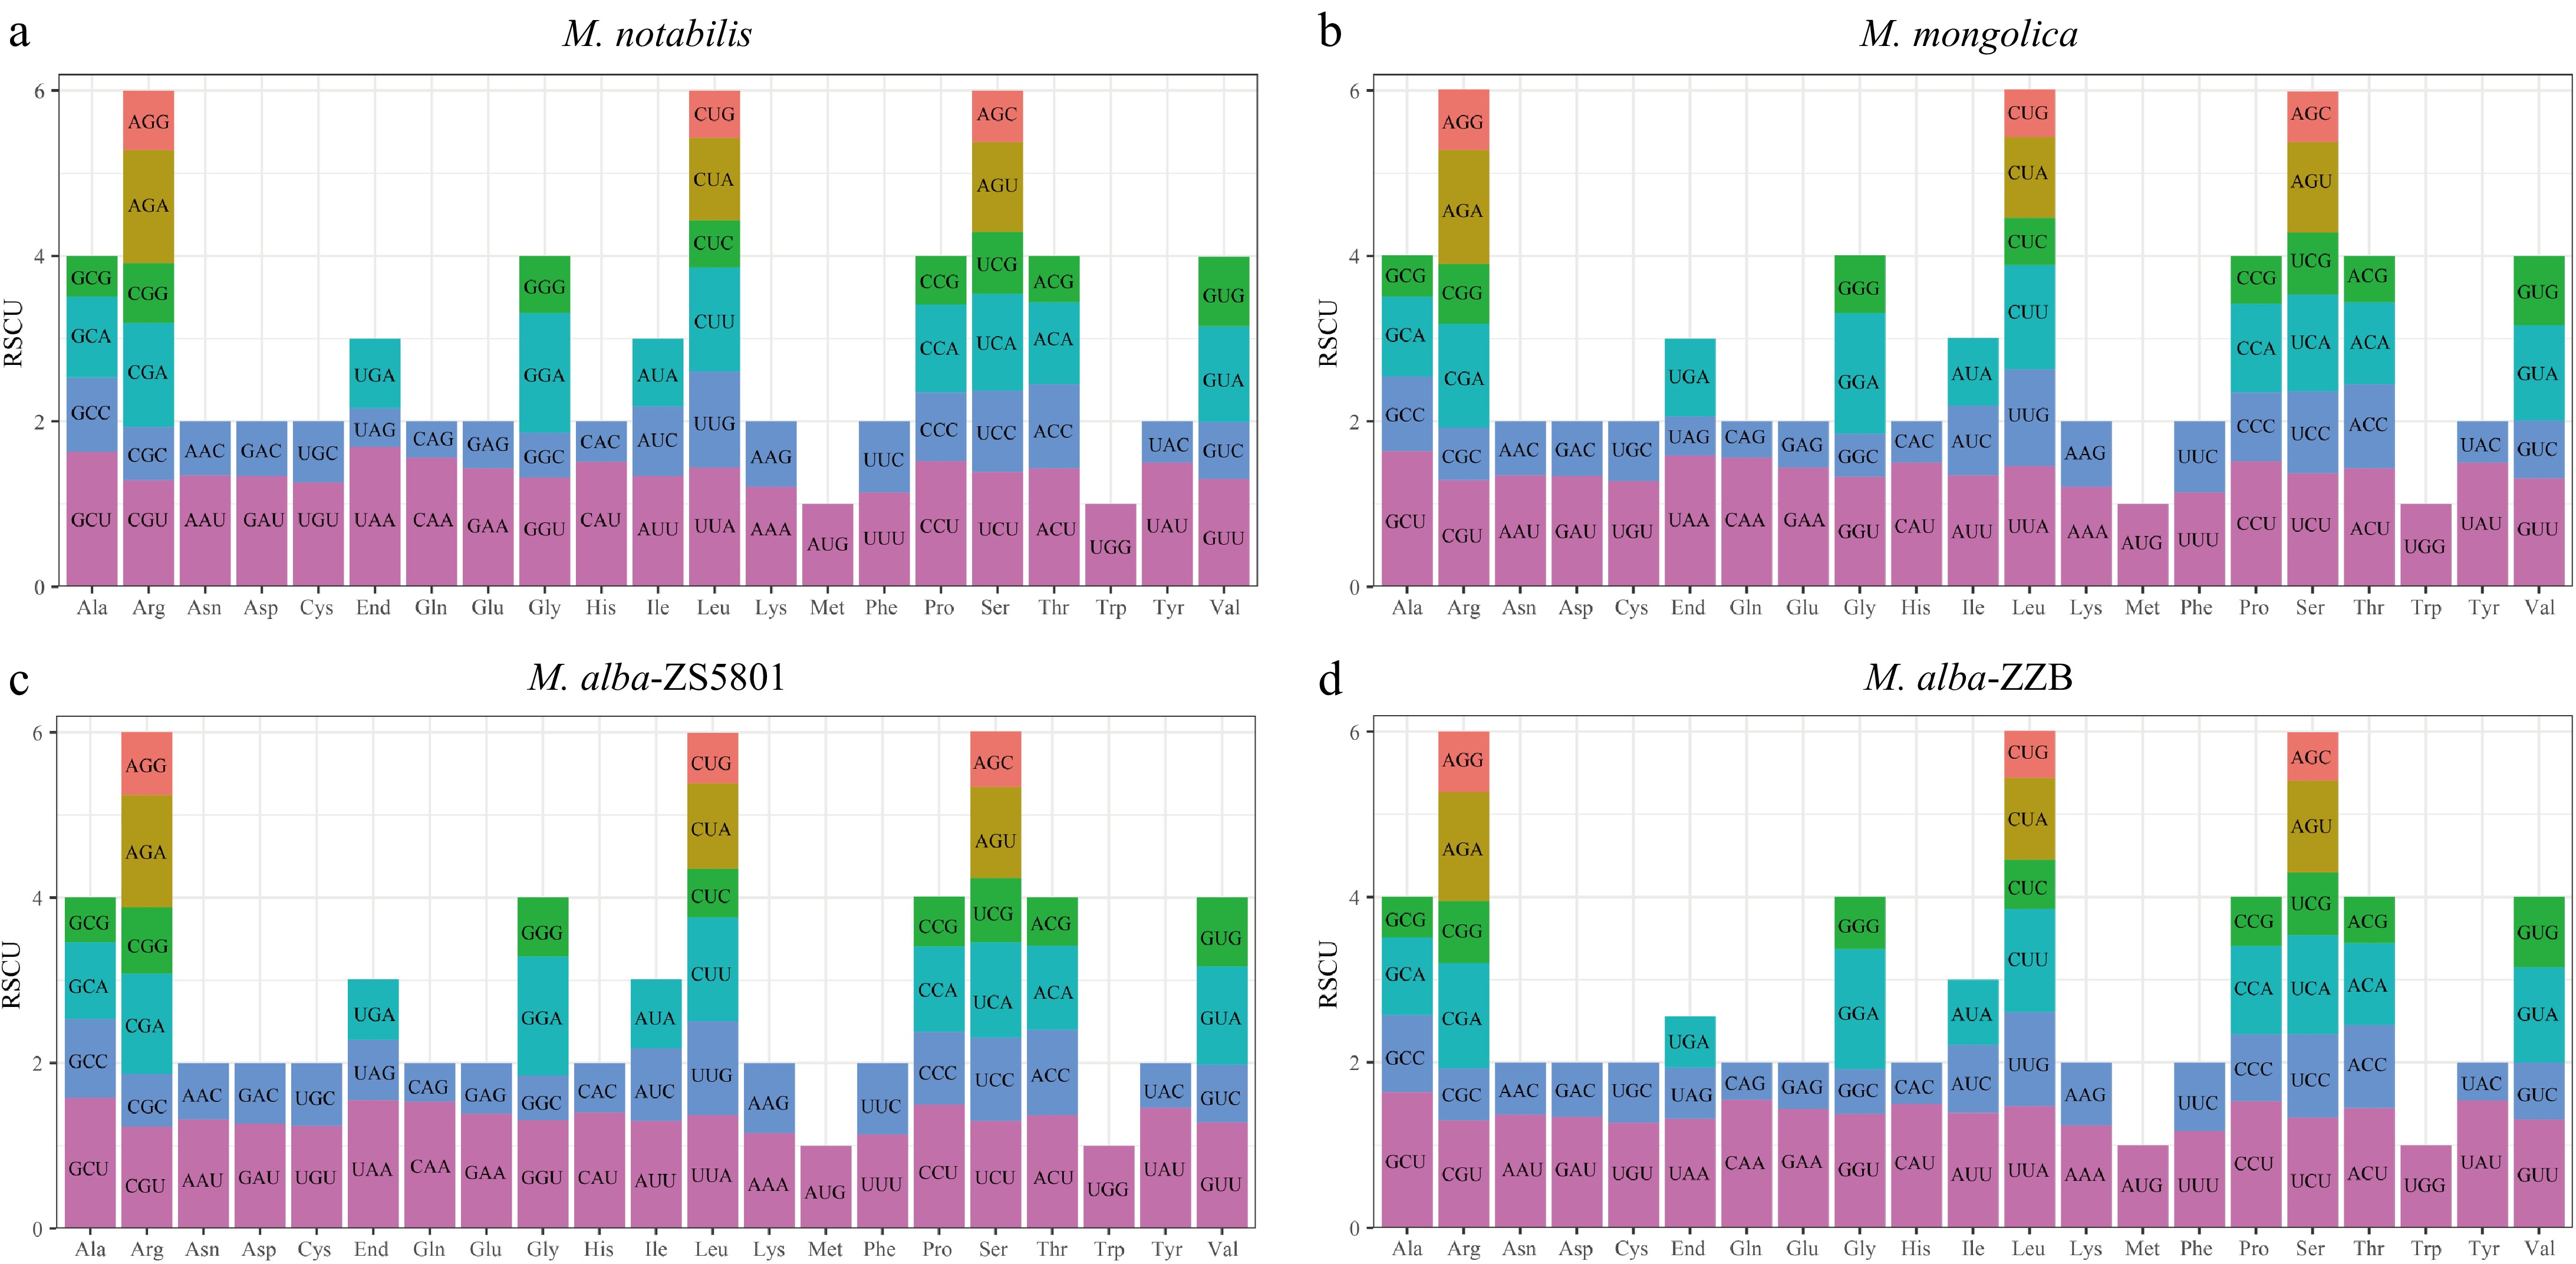
Figure 4.
Relative synonymous codon usage (RSCU) in the four Morus mitogenomes. (a) M. notabilis, (b) M. mongolica, (c) M. alba-ZS5801, and (d) M. alba-ZZB respectively.
-
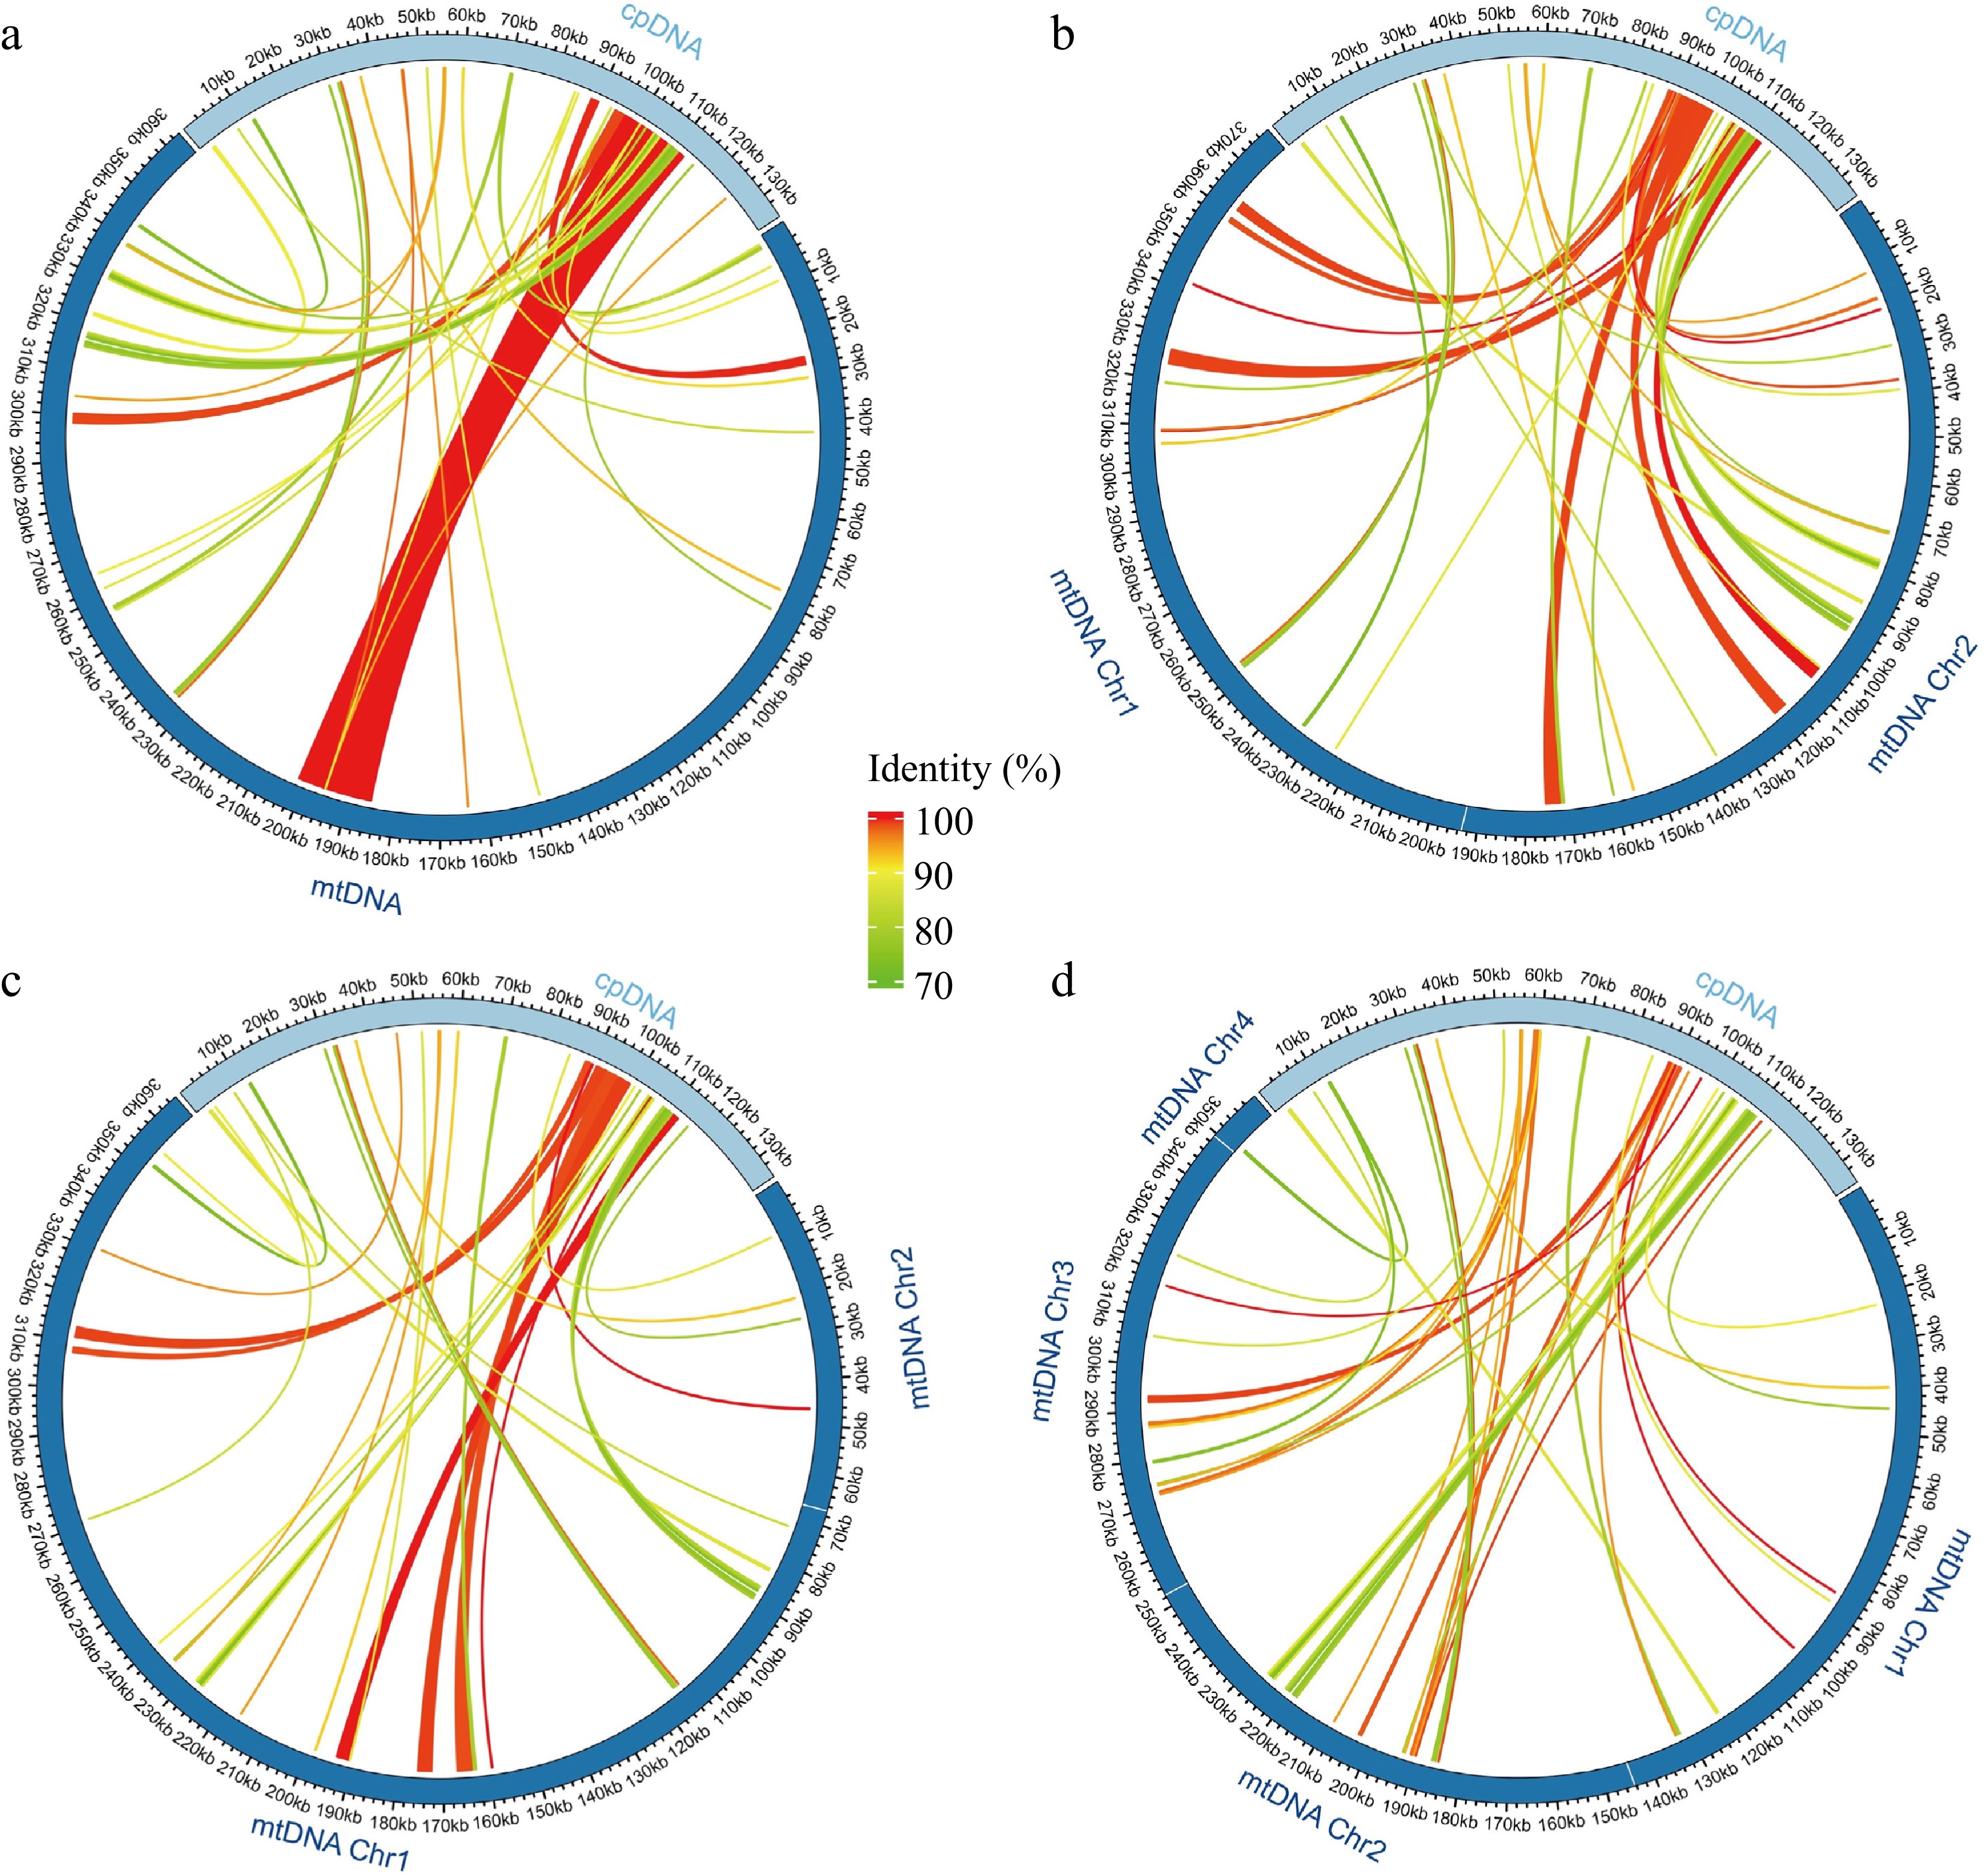
Figure 5.
Schematic representation of the distribution of MTPTs between plastome and mitogenomes for (a) M. notabilis, (b) M. mongolica, (c) M. alba-ZS5801, and (d) M. alba-ZZB. The MTPTs on the plastid IR regions were counted only once. Different colors of ribbons represent different identities. The length of each MTPT and the genes it contains can be found in Supplemental Table S6.
-
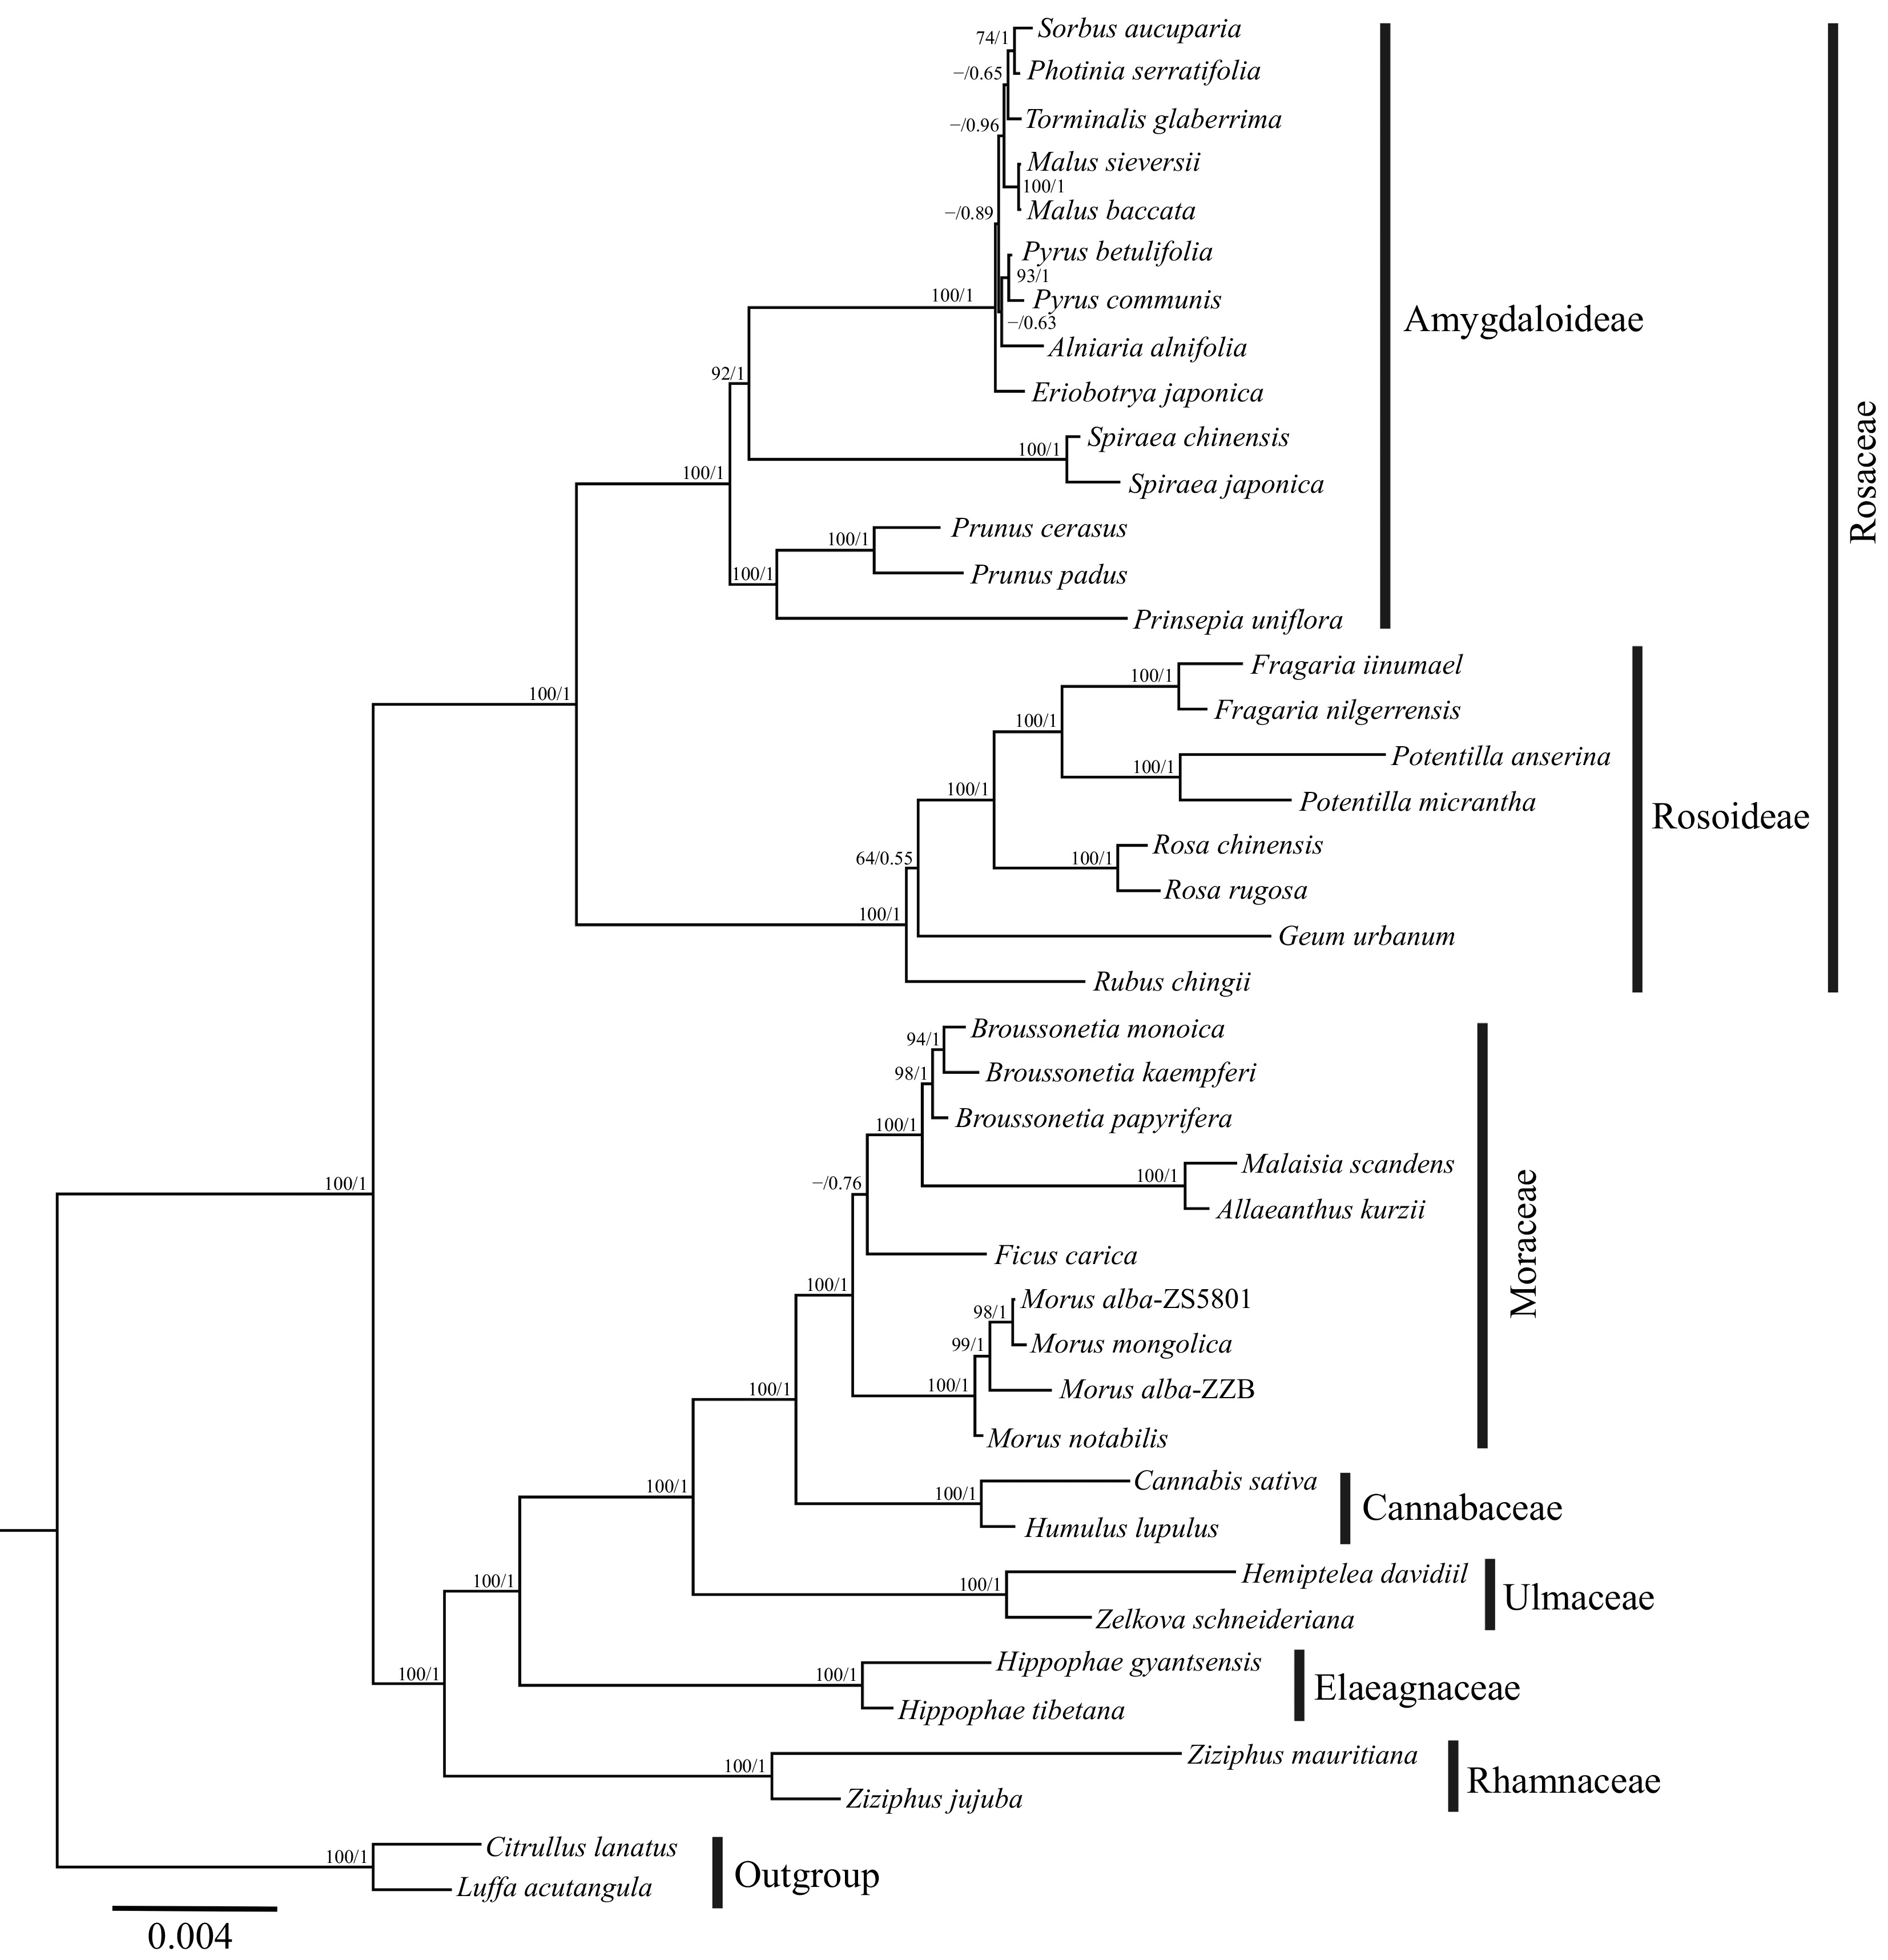
Figure 6.
Phylogenetic trees of Rosales estimated using RA × ML from 25 PCGs of the mitogenomes. Numbers above the branches represent ML bootstrap/Bayesian posterior probability (BS/PP), ML bootstrap values with lower than 50 are indicated by the dash.
-
Group of genes M. notabilis M. mongolica M. alba-ZS5801 M. alba-ZZB Core genes ATP synthase atp1, atp4, atp6, atp8, atp9 atp1, atp4, atp6, atp8, atp9 atp1, atp4, atp6, atp8, atp9 atp1, atp4, atp6, atp8, atp9 (2) Cytochrome c biogenesis ccmB, ccmC, ccmFC*, ccmFN ccmB, ccmC, ccmFC*, ccmFN ccmB, ccmC, ccmFC*, ccmFN ccmB, ccmC, ccmFC*, ccmFN Ubichinol cytochrome c reductase cob cob cob (2) cob Cytochrome c oxidase cox1, cox2*, cox3 cox1, cox2*, cox3 cox1, cox2*, cox3 cox1, cox2*, cox3 Maturases matR matR matR (2) matR Transport membrane protein mttB mttB mttB mttB NADH dehydrogenase nad1*, nad2****, nad3, nad4***, nad4L, nad5**, nad6, nad7****, nad9 nad1*, nad2***, nad3, nad4***, nad4L, nad5**, nad6, nad7****, nad9 nad1*, nad2***, nad3, nad4***, nad4L, nad5**, nad6, nad7****, nad9 nad1*, nad2***, nad3 (2), nad4***, nad4L, nad5**, nad6, nad7****, nad9 Variable genes Large subunit of ribosome rpl16 rpl16 rpl16 rpl16 Small subunit of ribosome rps3*, rps4, rps7, rps12, rps13, rps19 rps3, rps4, rps7, rps12, rps13, rps19 rps3, rps4, rps7, rps12, rps19 rps4, rps7, rps12 (2), rps13, rps19 Succinate dehydrogenase sdh4 sdh4 sdh4 sdh4 rRNA genes Ribosomal RNAs rrn5, rrn18, rrn26 rrn5, rrn18, rrn26 rrn5, rrn18, rrn26 rrn5, rrn18, rrn26 tRNA genes Transfer RNAs trnA-UGC*, trnC-GCA, trnD-GUC, trnE-UUC, trnF-GAA, trnfM-CAU, trnG-GCC, trnI-CAU, trnI-GAU*, trnK-UUU, trnL-CAA, trnM-CAU, trnN-GUU, trnP-UGG (3), trnQ-UUG, trnR-ACG, trnS-UGA, trnV-GAC, trnW-CCA (2), trnY-GUA trnA-UGC*, trnC-GCA, trnD-GUC, trnE-UUC, trnF-GAA, trnfM-CAU, trnI-CAU, trnK-UUU, trnL-CAA, trnM-CAU, trnN-GUU, trnP-UGG (2), trnQ-UUG, trnR-ACG, trnS-UGA, trnW-CCA, trnY-GUA trnC-GCA, trnD-GUC, trnE-UUC, trnF-GAA, trnfM-CAU, trnI-CAU, trnK-UUU, trnL-CAA, trnM-CAU, trnN-GUU, trnP-UGG (2), trnQ-UUG (2), trnR-ACG, trnS-UGA, trnW-CCA, trnY-GUA trnC-GCA, trnD-GUC, trnE-UUC, trnF-GAA, trnfM-CAU, trnG-GCC, trnI-CAU, trnK-UUU, trnM-CAU, trnN-GUU, trnP-UGG (2), trnQ-UUG, trnS-UGA, trnW-CCA, trnY-GUA The number of asterisks indicate the number of introns that the genes contained. The number in the parentheses indicate the number of copies of the genes. Table 1.
Summary of genes contained in the four Morus mitogenomes.
Figures
(6)
Tables
(1)