-

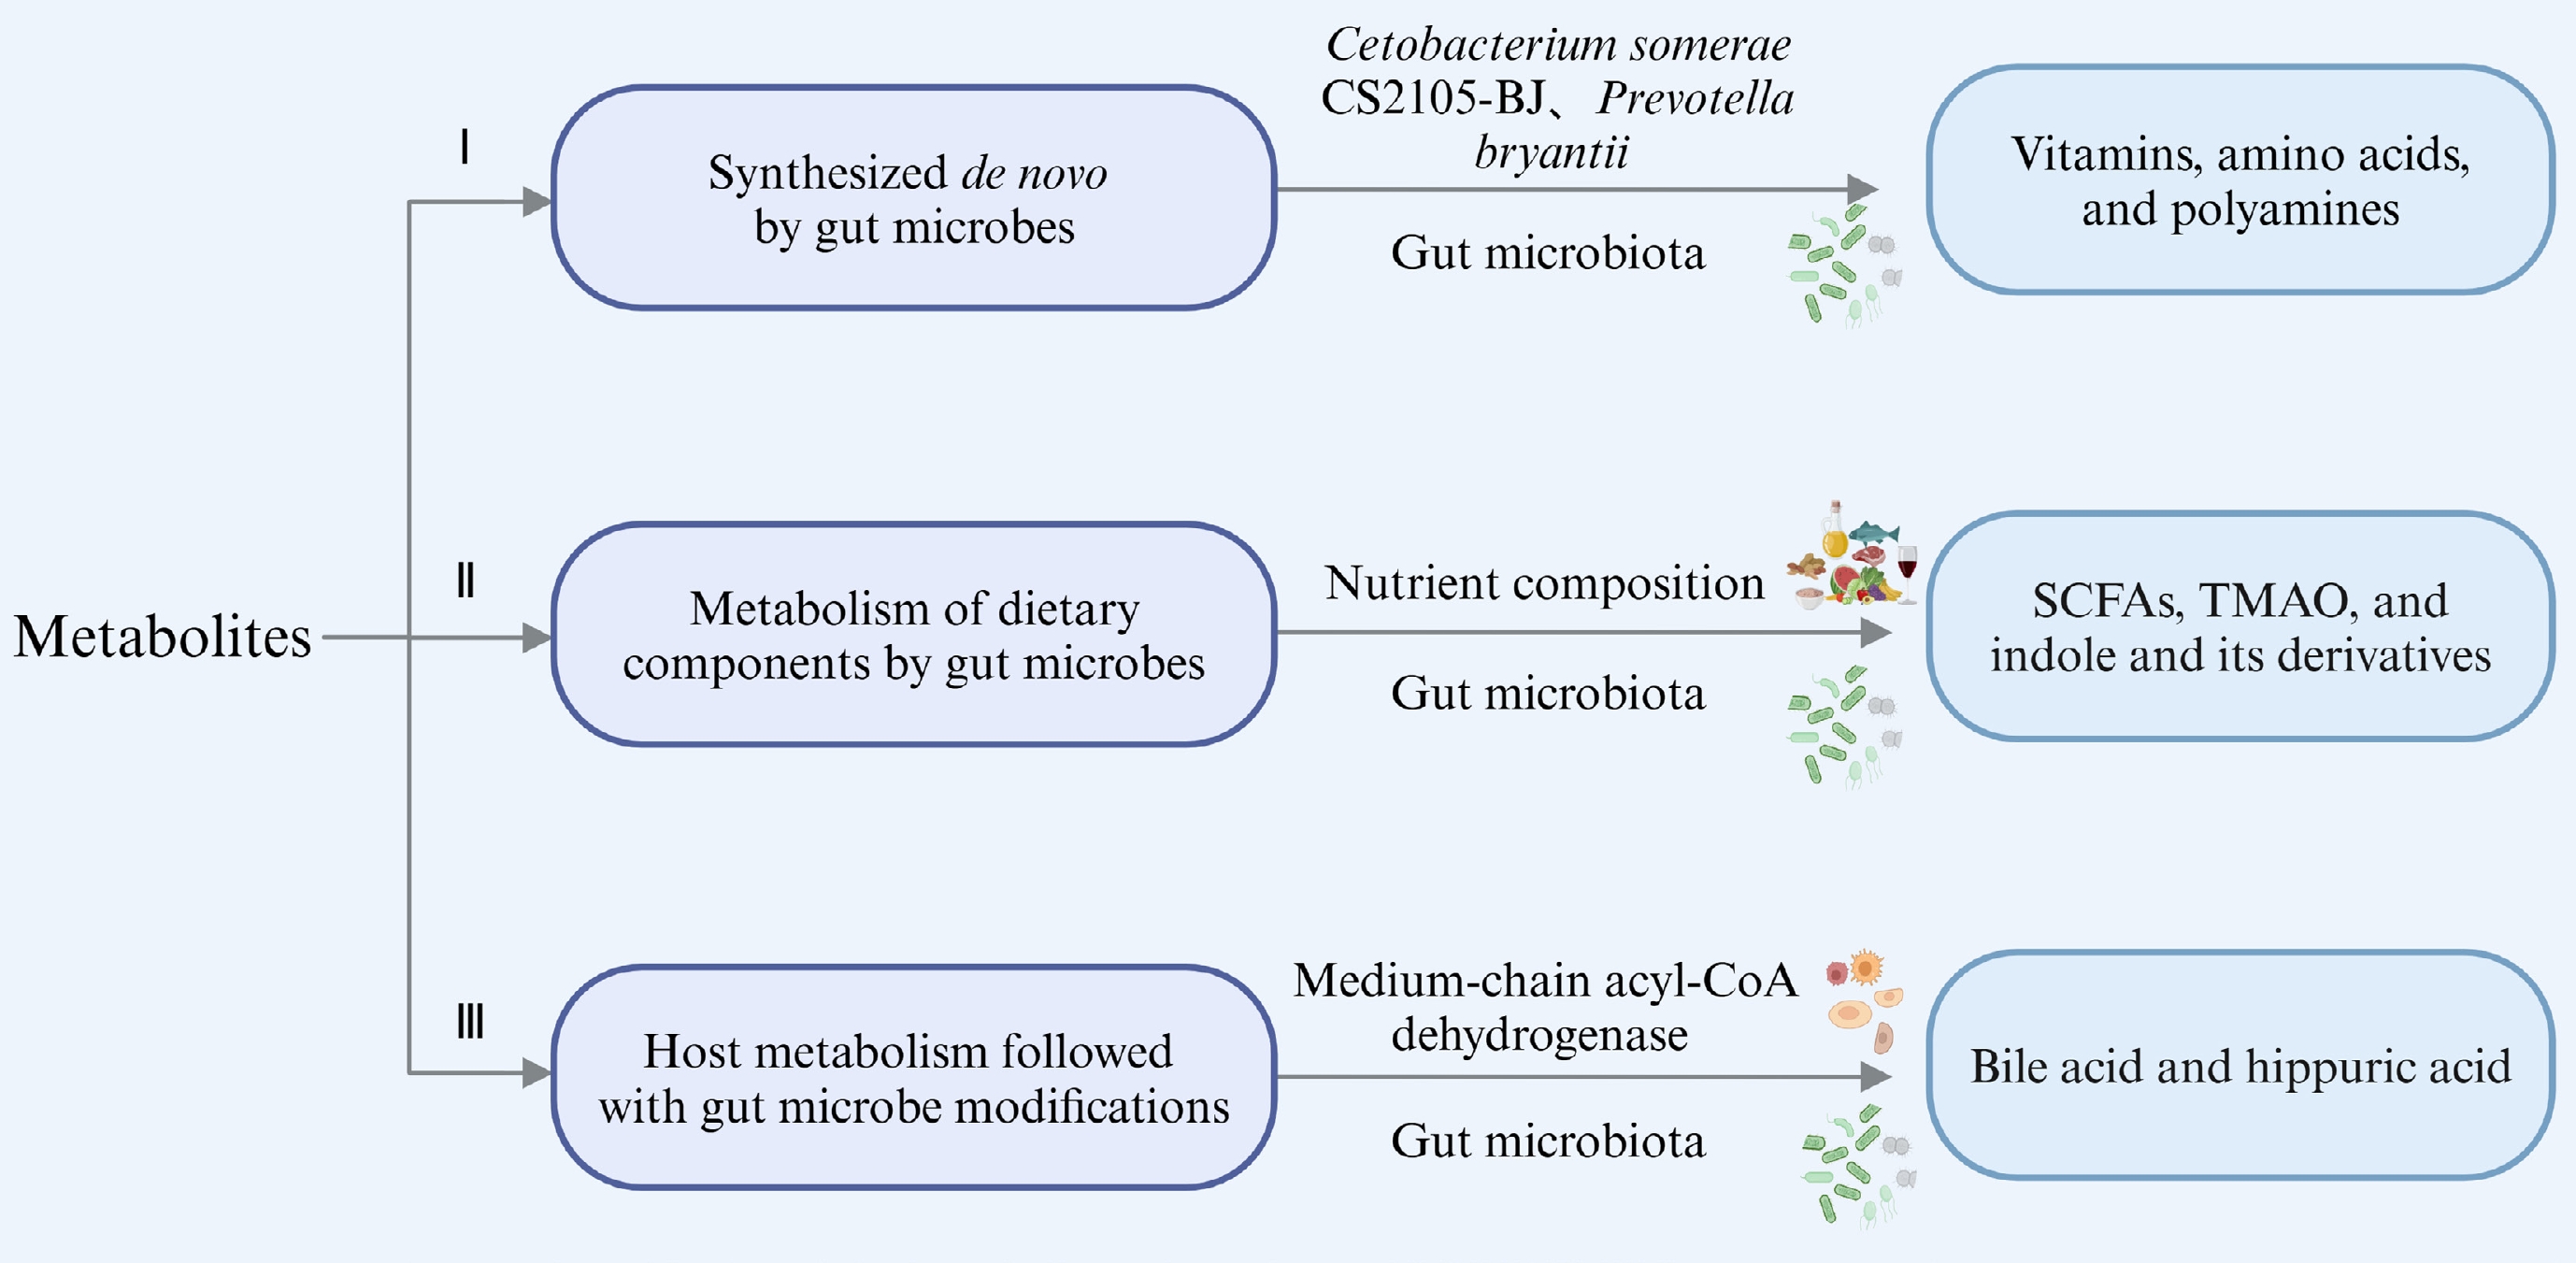
Figure 1.
Types of microbial metabolites derived from various sources (created with BioRender.com).
-

Figure 2.
Natural product-derived gut microbial metabolites in metabolic diseases. Different colors refer to different classes of metabolites, with red representing alkaloids, green representing terpenoids, and yellow representing flavonoids. The blue boxes indicate key sites on the pathways, and the brown boxes indicate key sites shared by the three metabolites (created with BioRender.com).
-

Figure 3.
Impact of food processing on dietary nutrients and their health benefits via gut microbiota and related metabolites. The blue arrows represent the impact of thermal processing, while the purple arrows represent the impact of non-thermal processing (created with BioRender.com).
Figures
(3)
Tables
(0)