-
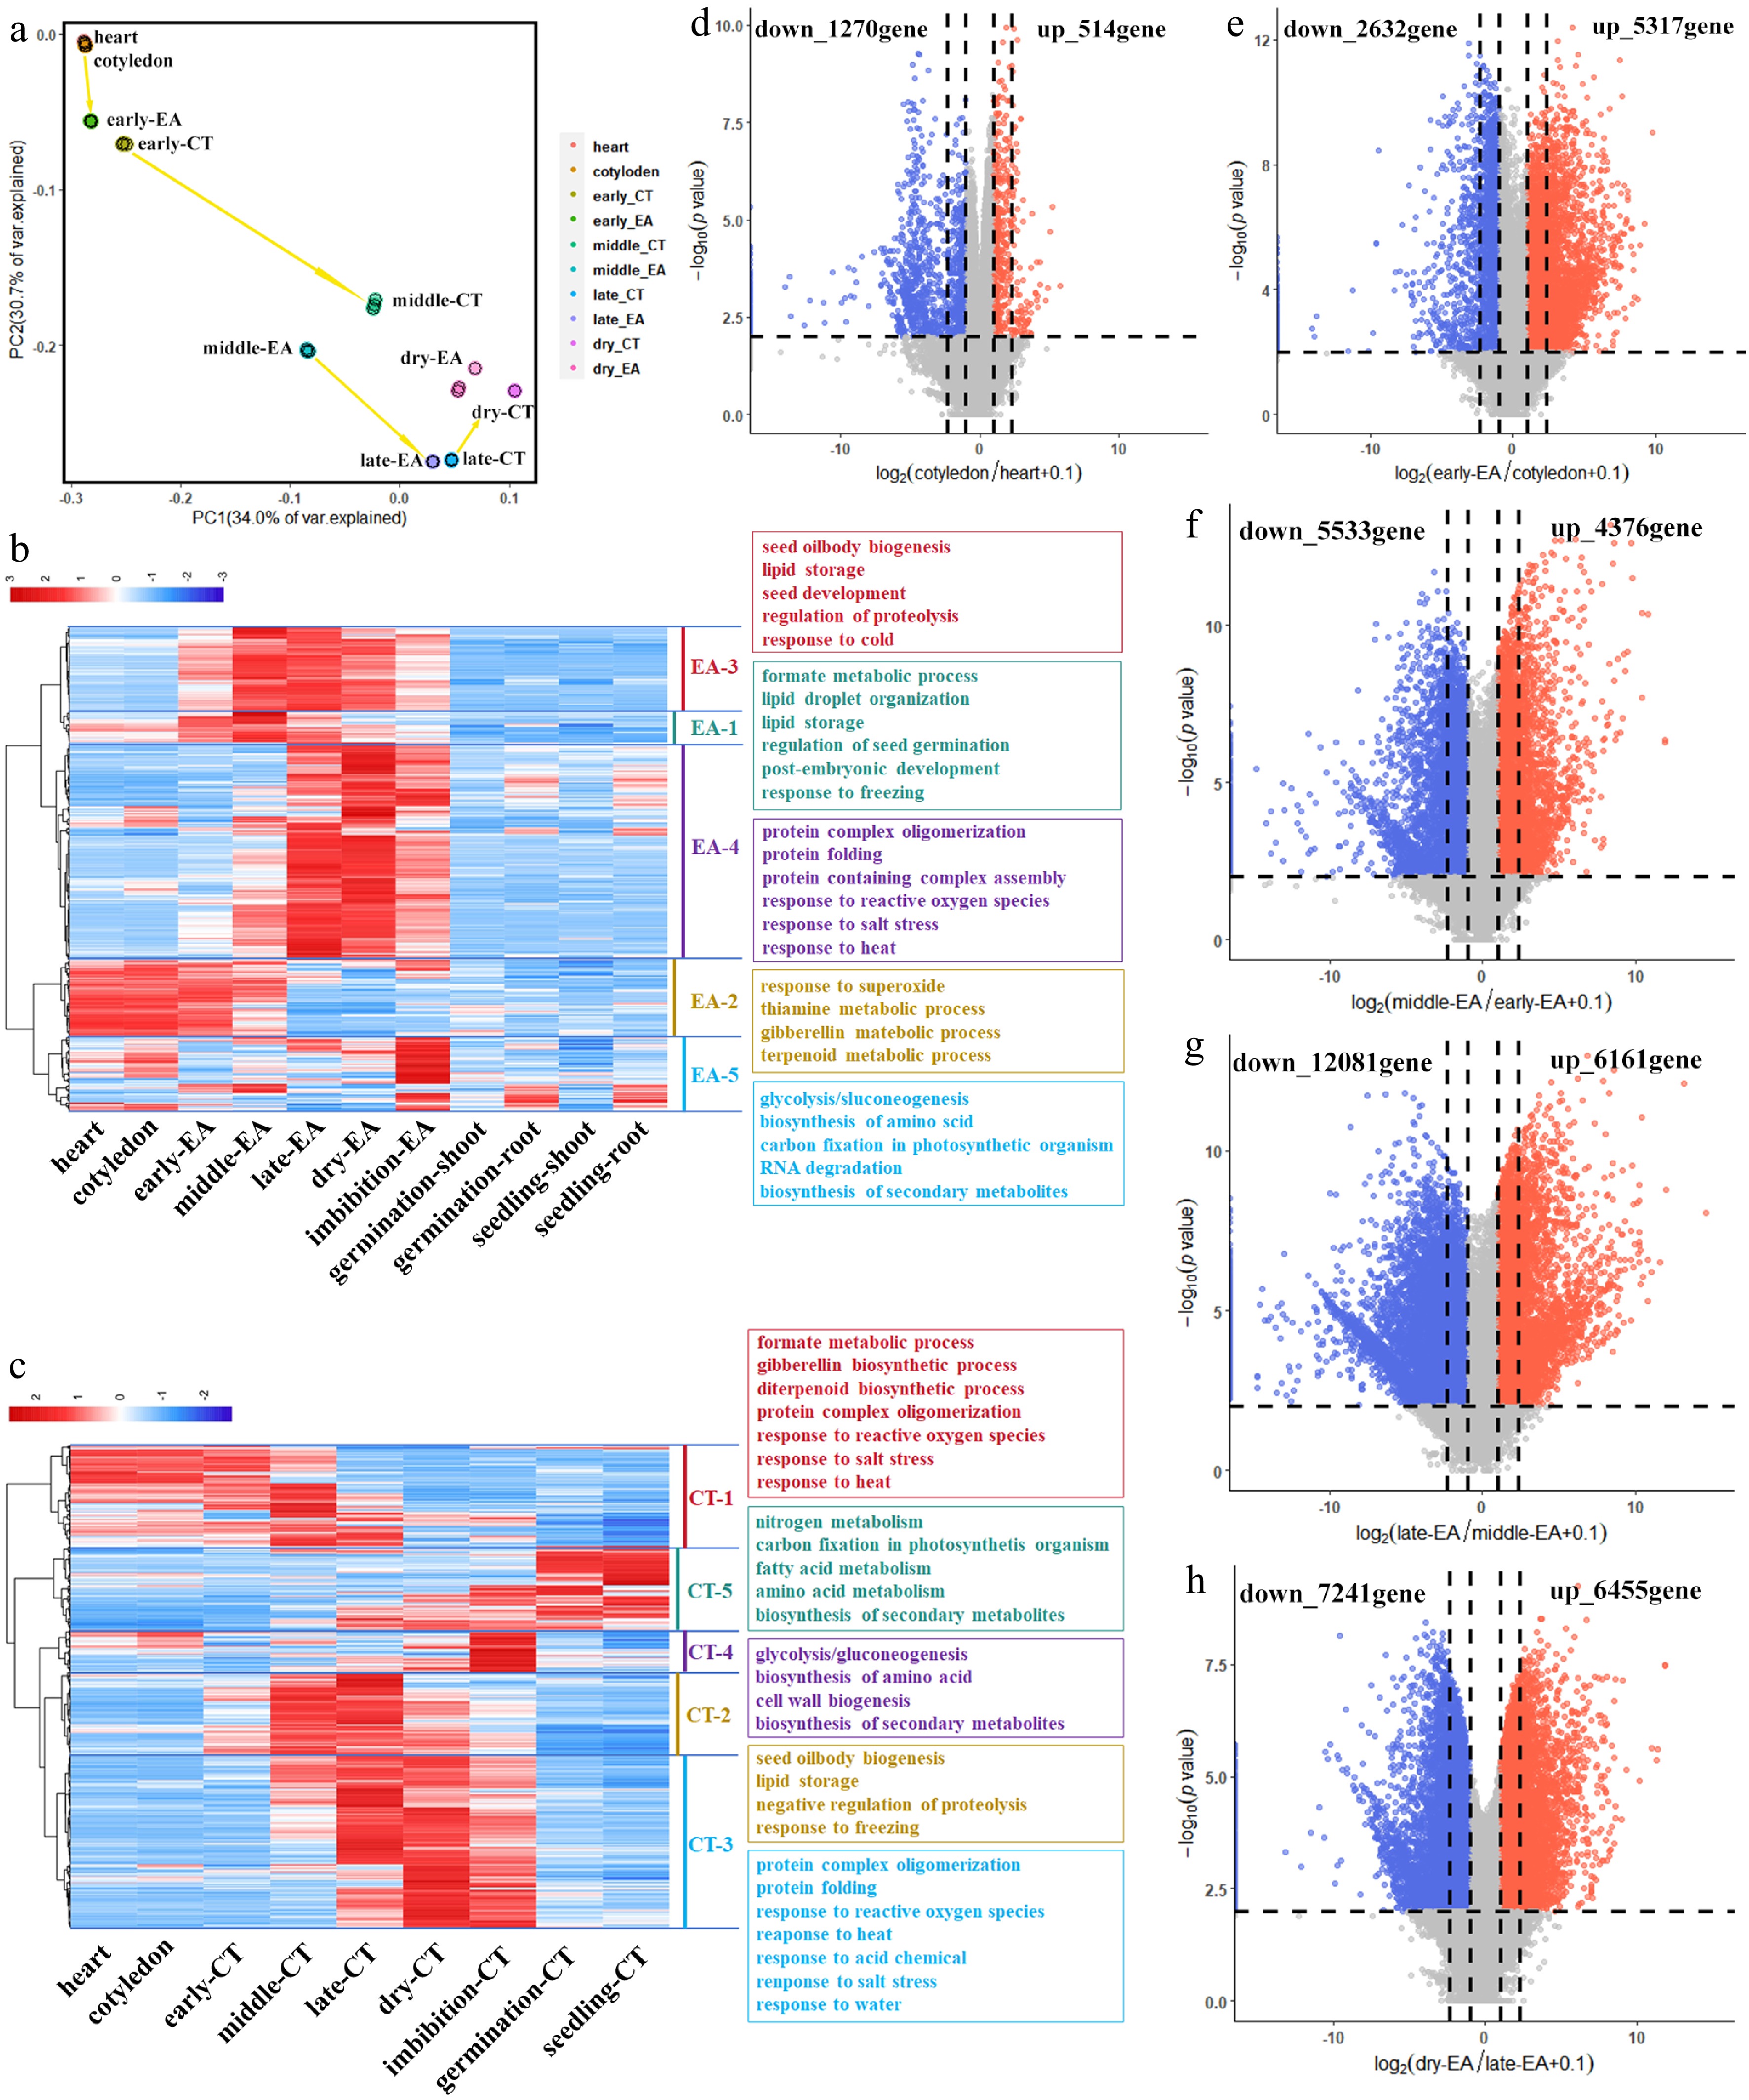
Figure 3.
Transcription dynamics during soybean embryo development. (a) PCA analysis shows correlation of samples from heart embryo to dry seed. (b) Heatmap of significant genes during EA development, and five gene clusters were clarified to show the main cell biological process in EA. (c) Heatmap of significant genes during CT development, and five gene clusters were clarified to show the main cell biological process in CT. Volcano plot and DEG numbers for the comprison of (d) cotyledon embryo vs heart embryo, (e) early-maturation EA vs cotyledon embryo, (f) middle-maturation EA vs early-maturation EA, (g) late-maturation EA vs middle-maturation EA, and (h) dry-seed EA vs late-maturation EA, respectively.
-
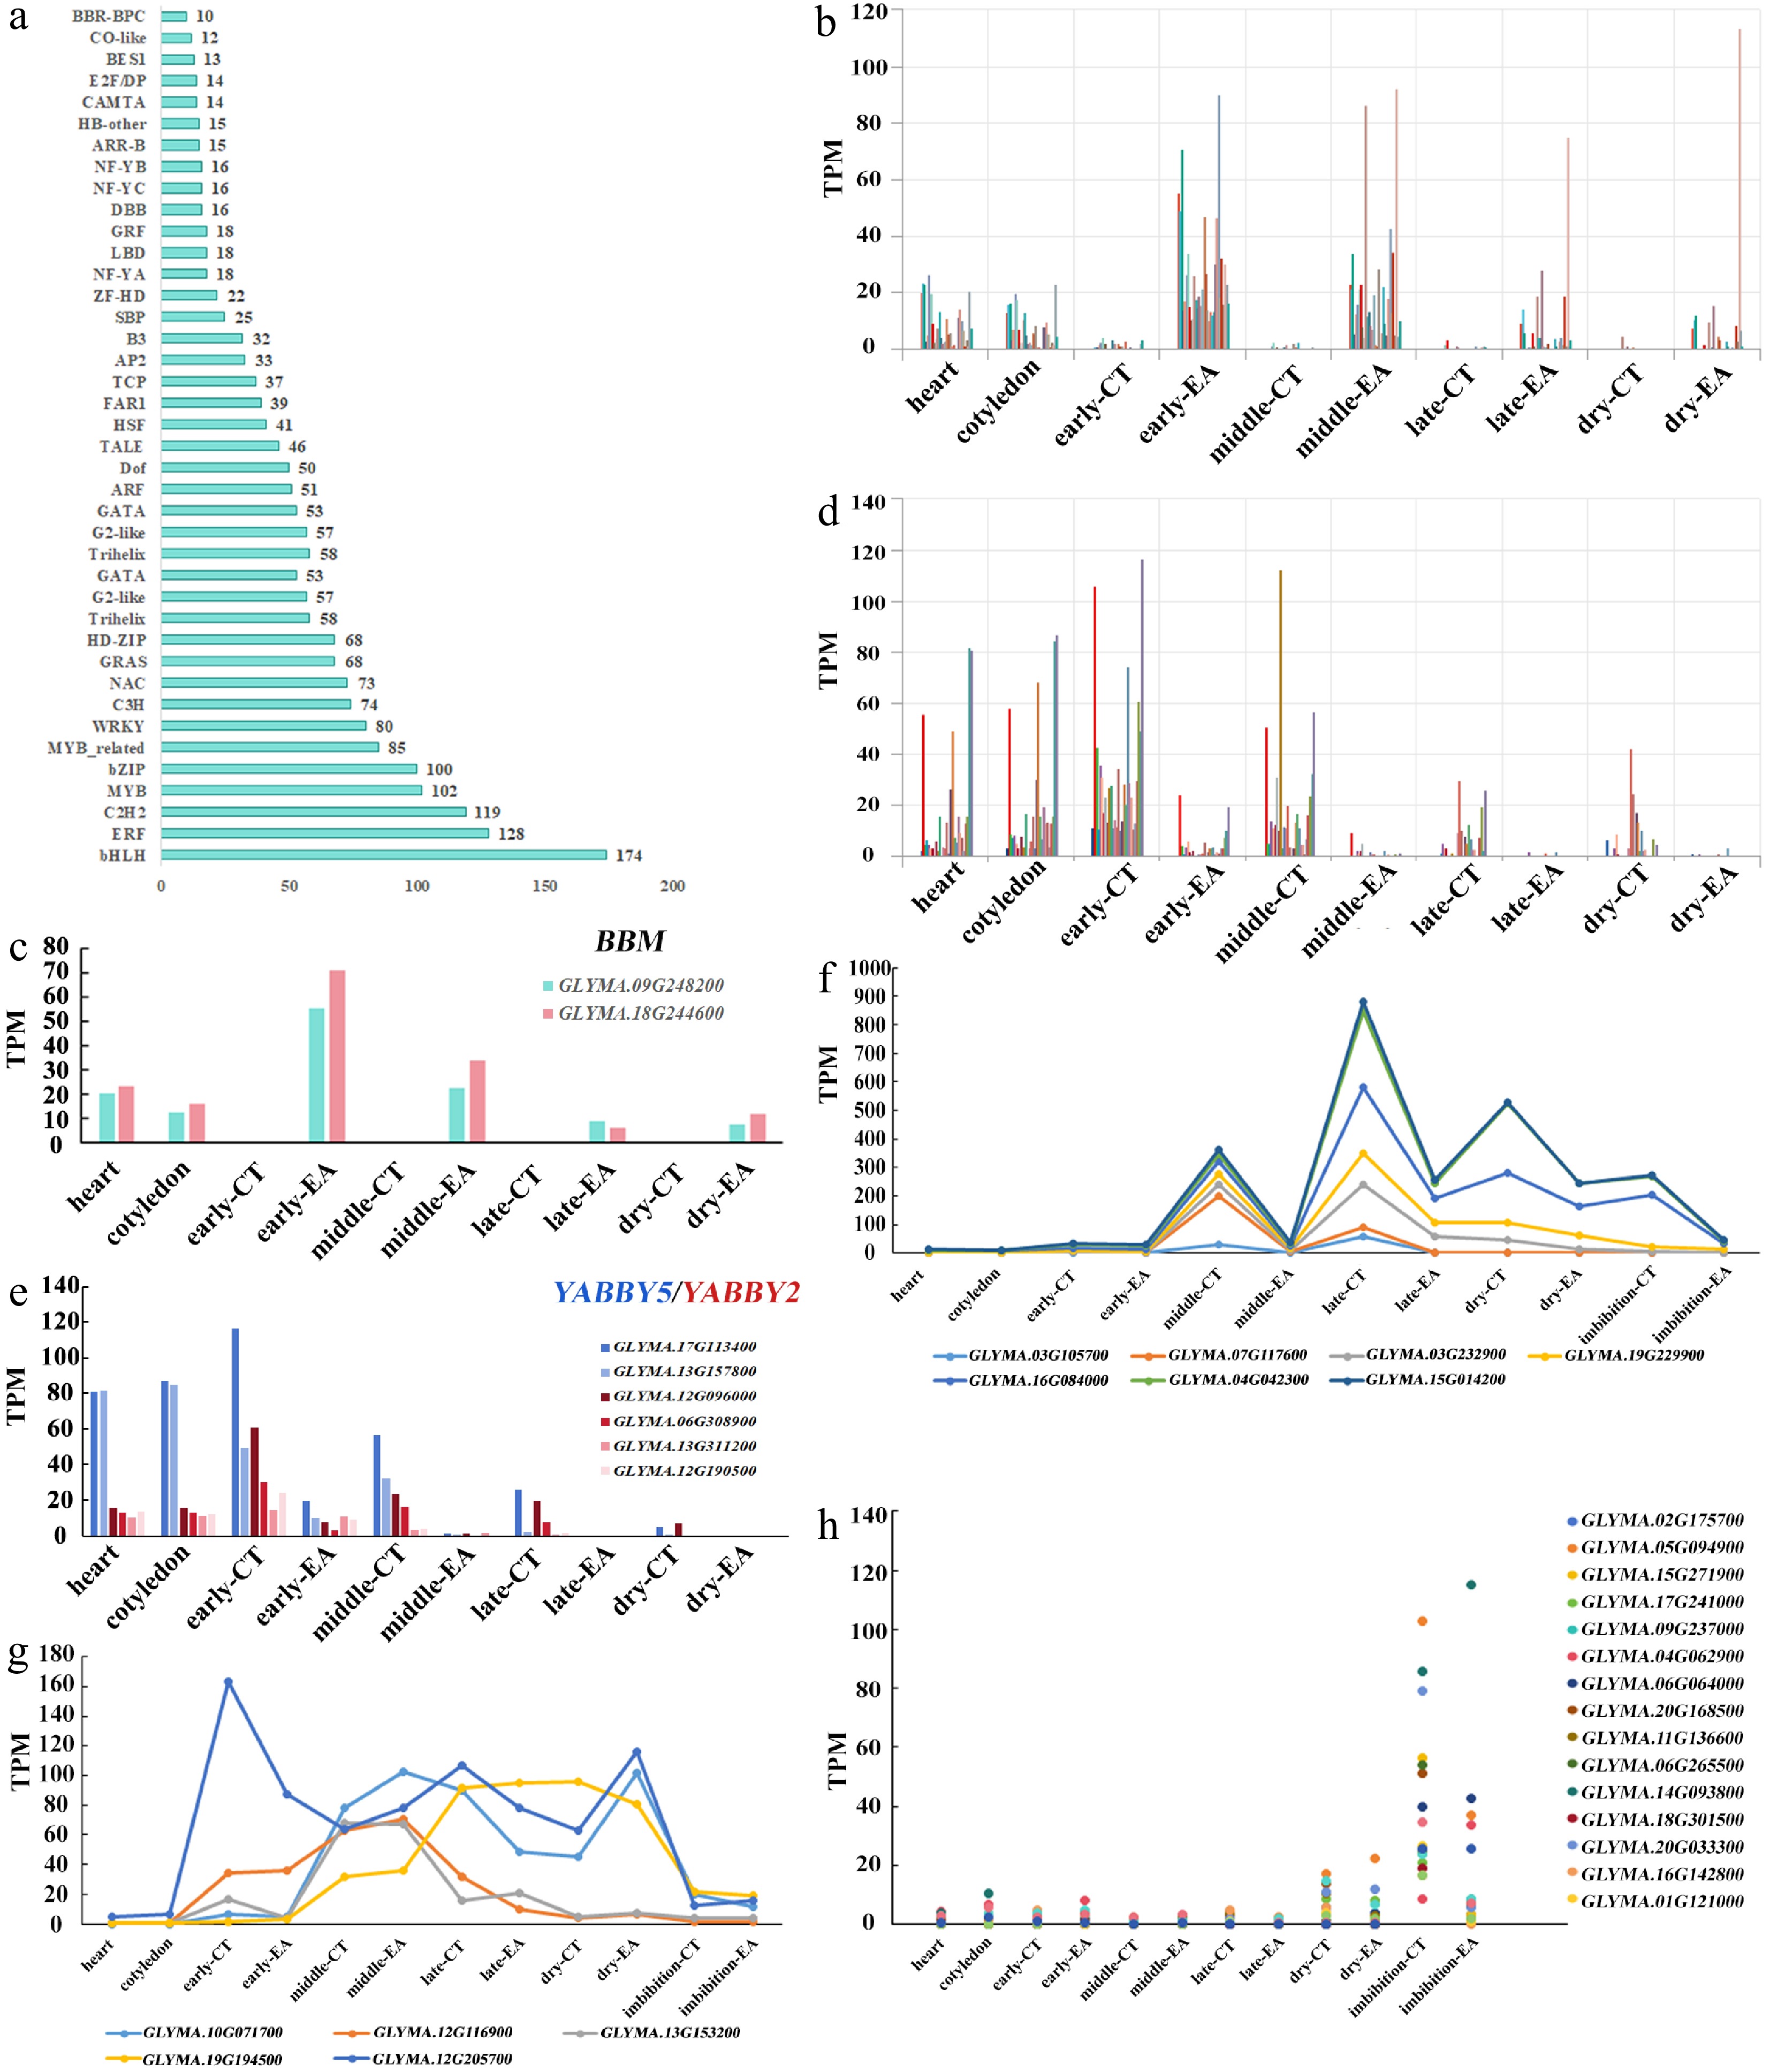
Figure 4.
TFs involved in embryo morphogenesis and development. (a) Family and numbers of TFs expressed during soybean embryo development. (b) Expression pattern of EA-enriched TFs. (c) Expression of two BBM genes. (d) Expression pattern of CT-enriched TFs. (e) Expression of six YABBY genes. (f) Expression pattern of maturation-enriched TFs with high level in CT. (g) Expression pattern of maturation-enriched TFs with high level in a certain stage. (h) Expression pattern of TFs enriched in imbibition seed.
-
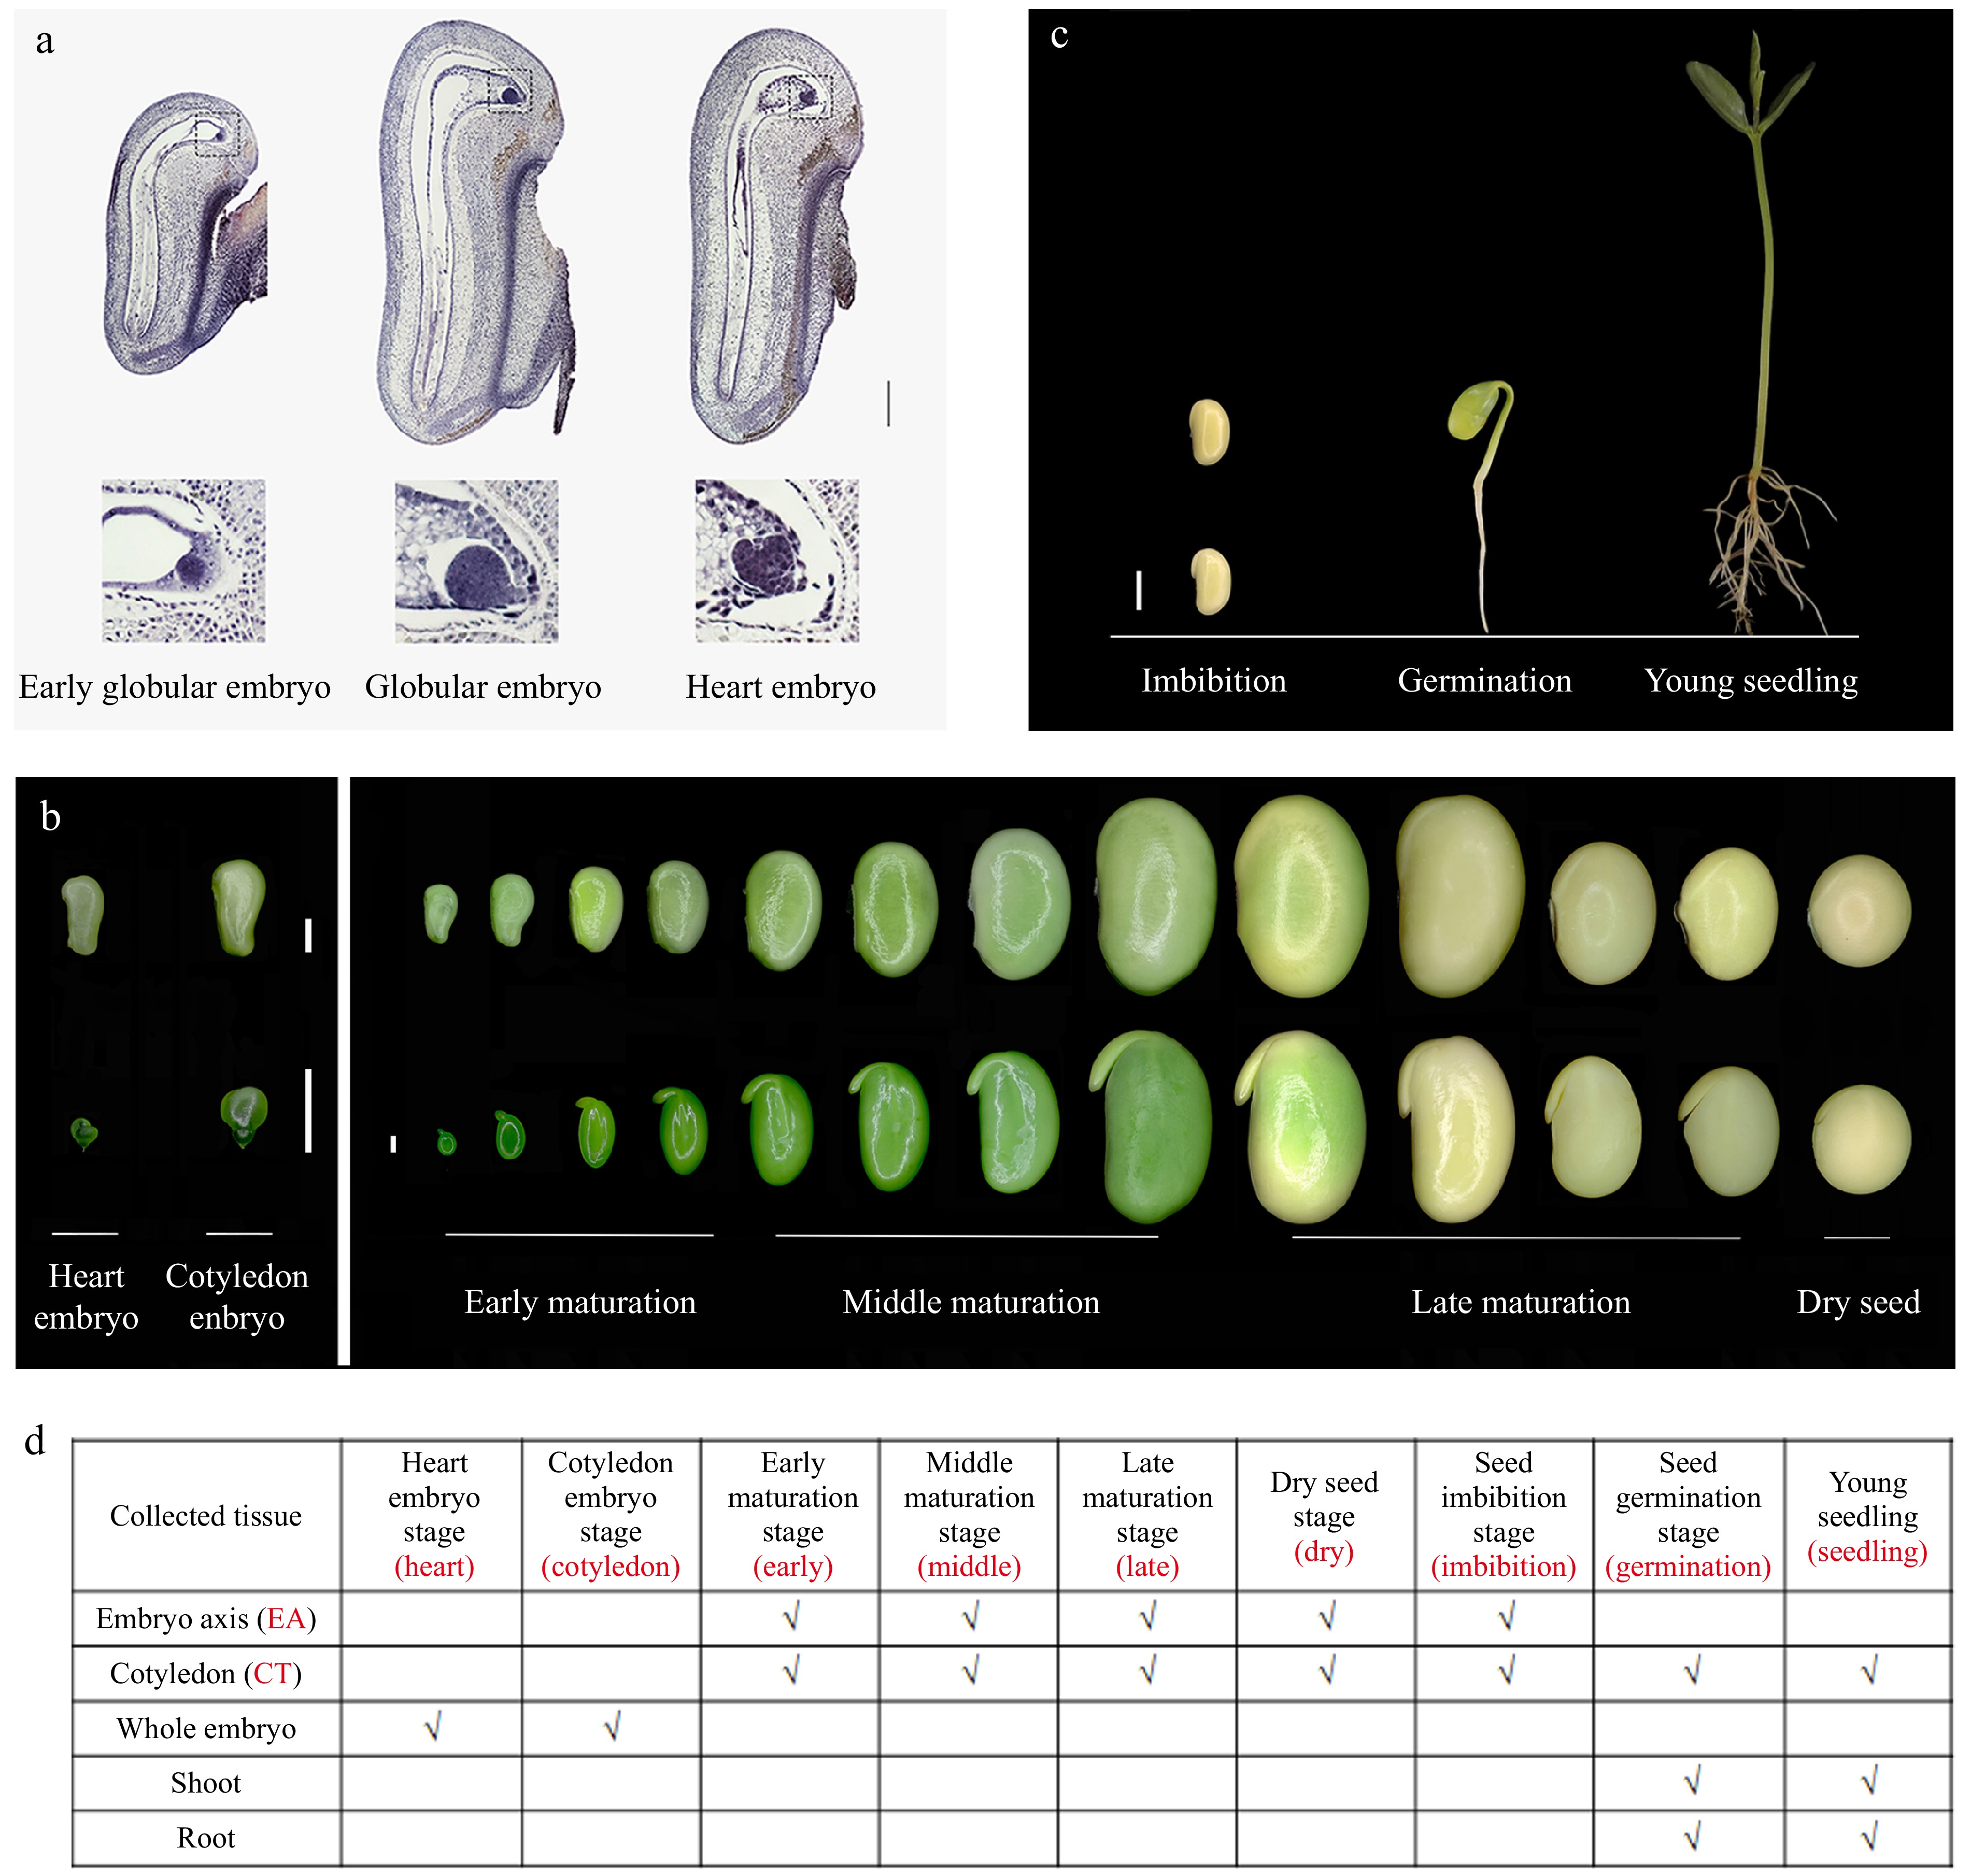
Figure 1.
Morphological view of soybean seed development and germination process. (a) Paraffin section of globular and heart embryo stage seeds. The upper panel shows the longitudinal section of the ovule with embryos inside the embryo sac, the lower panel shows the enlarged view of embryos. Scale bar = 100 μm. (b) Dissected embryos from the corresponding seeds during soybean seed development. The upper panel shows the whole seeds, the lower panel shows the isolated embryos. Scale bar = 1 mm. (c) Morphological view of imbibition seed, germinated seed, and young seedling. Scale bar = 1 cm. (d) The samples used for RNA-seq library preparation. '√' represents the selected samples. The words in red represent the short name for the stages and samples in later analysis.
-
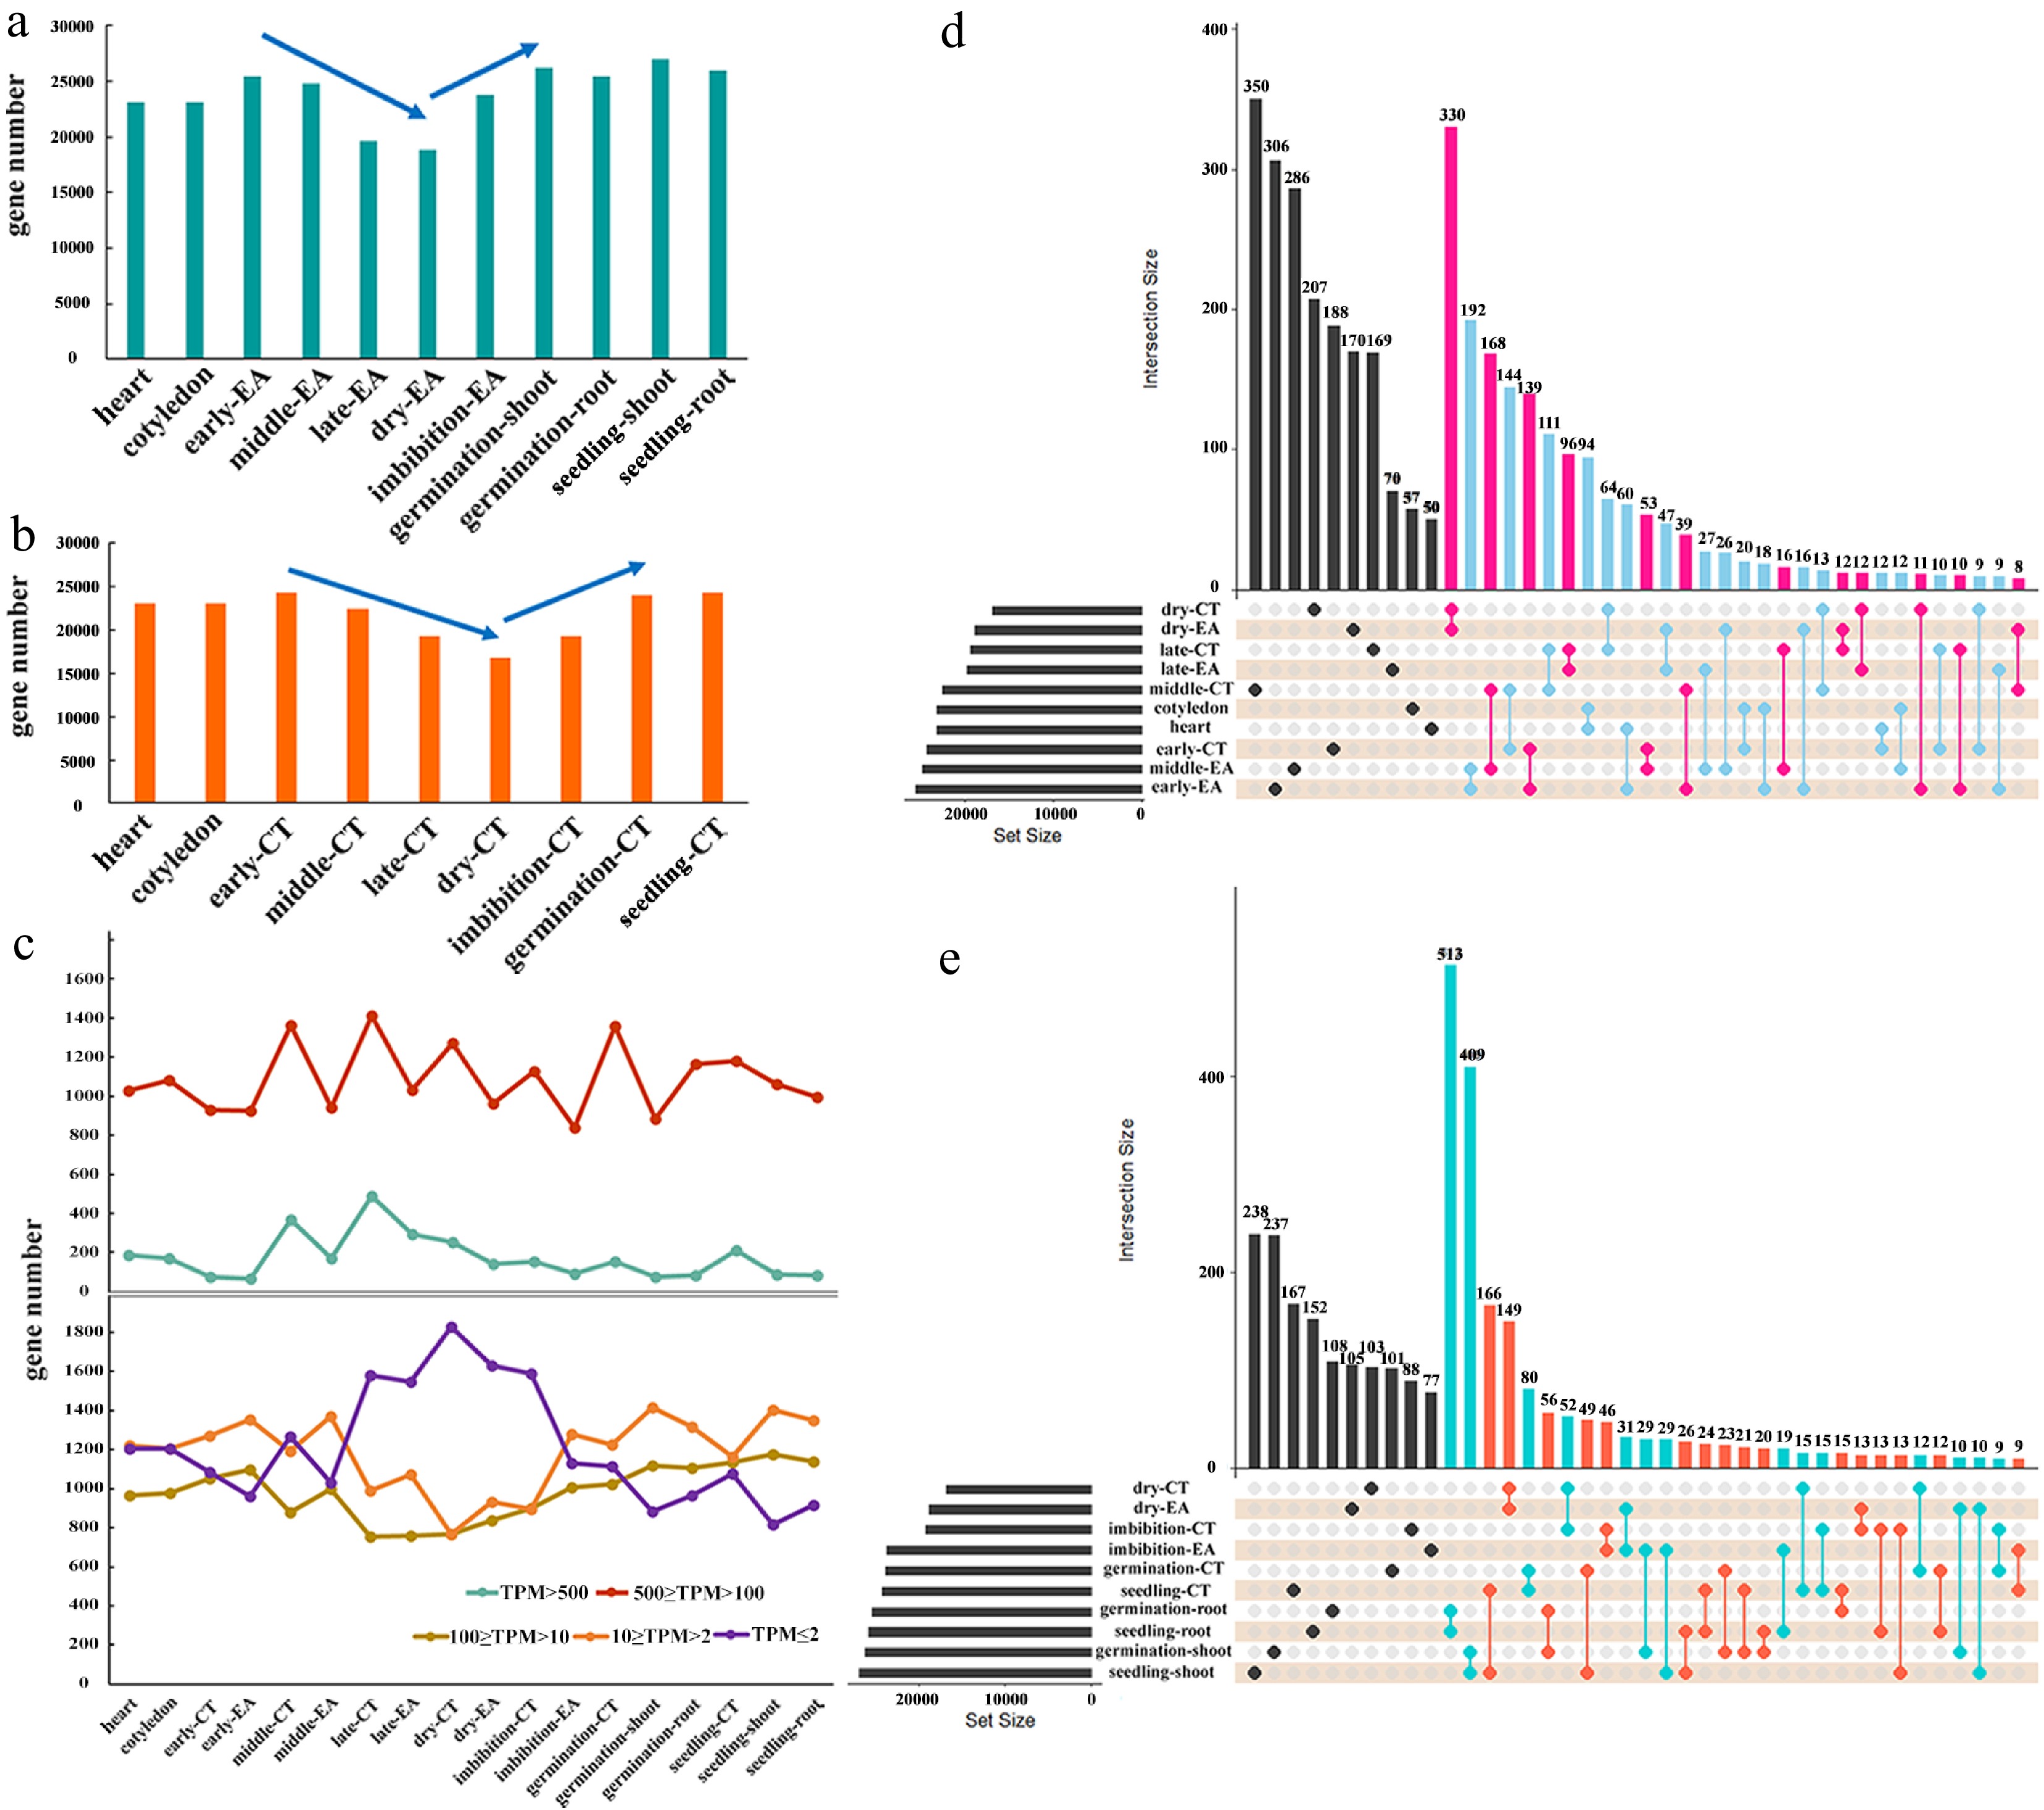
Figure 2.
The transcriptome atlas for soybean embryo development. (a) The number of expressed genes in EA of each stage, and in root/shoot of the germinated plants. (b) The number of expressed genes in CT of each stage. (c) The number of genes from five different expression levels in all the samples. Shared genes and specific genes in samples from (d) heart embryo to dry seed, and from (e) dry seed to young seedling.
-
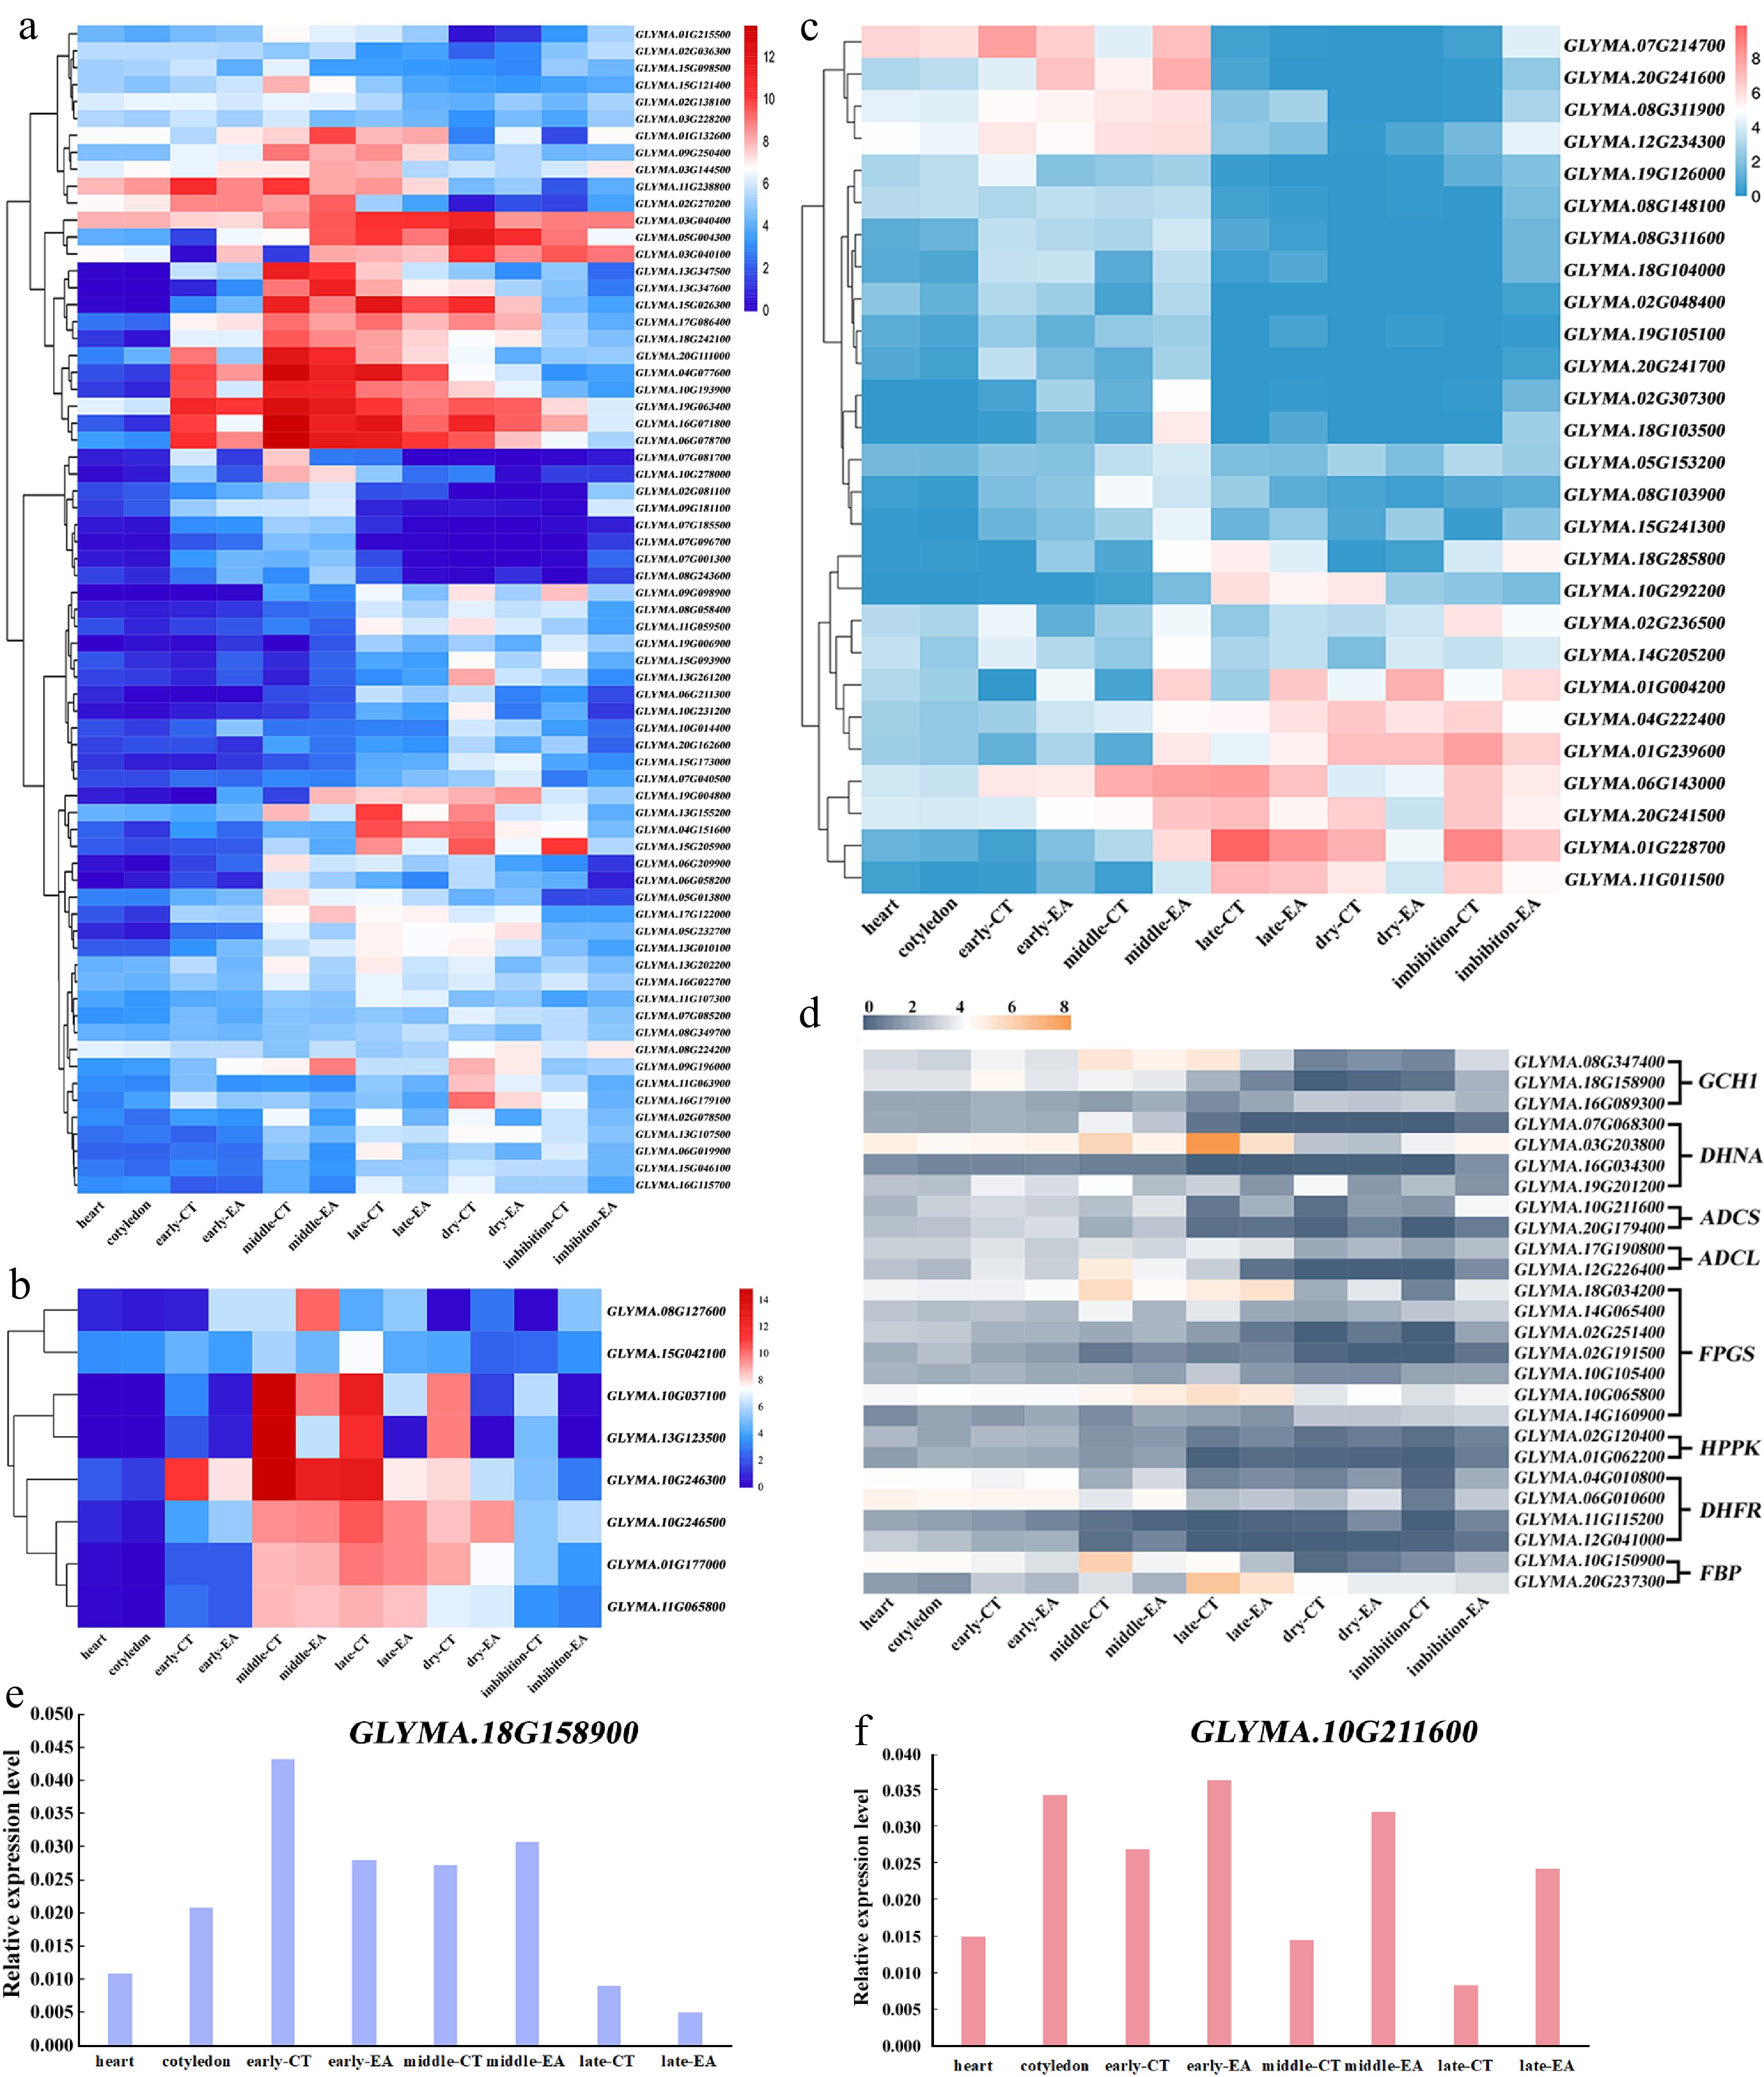
Figure 5.
Metabolites synthesis during soybean embryo development. Heatmap of gene expression patterns from (a) lipid, (b) conglycinin and glycinin, (c) flavonoid, (d) folate synthesis network during embryo development, respectively. RT-qPCR results for two genes, (e) GLYMA.18G158900, and (f) GLYMA.10G211600, which are involved in folate synthesis.
-
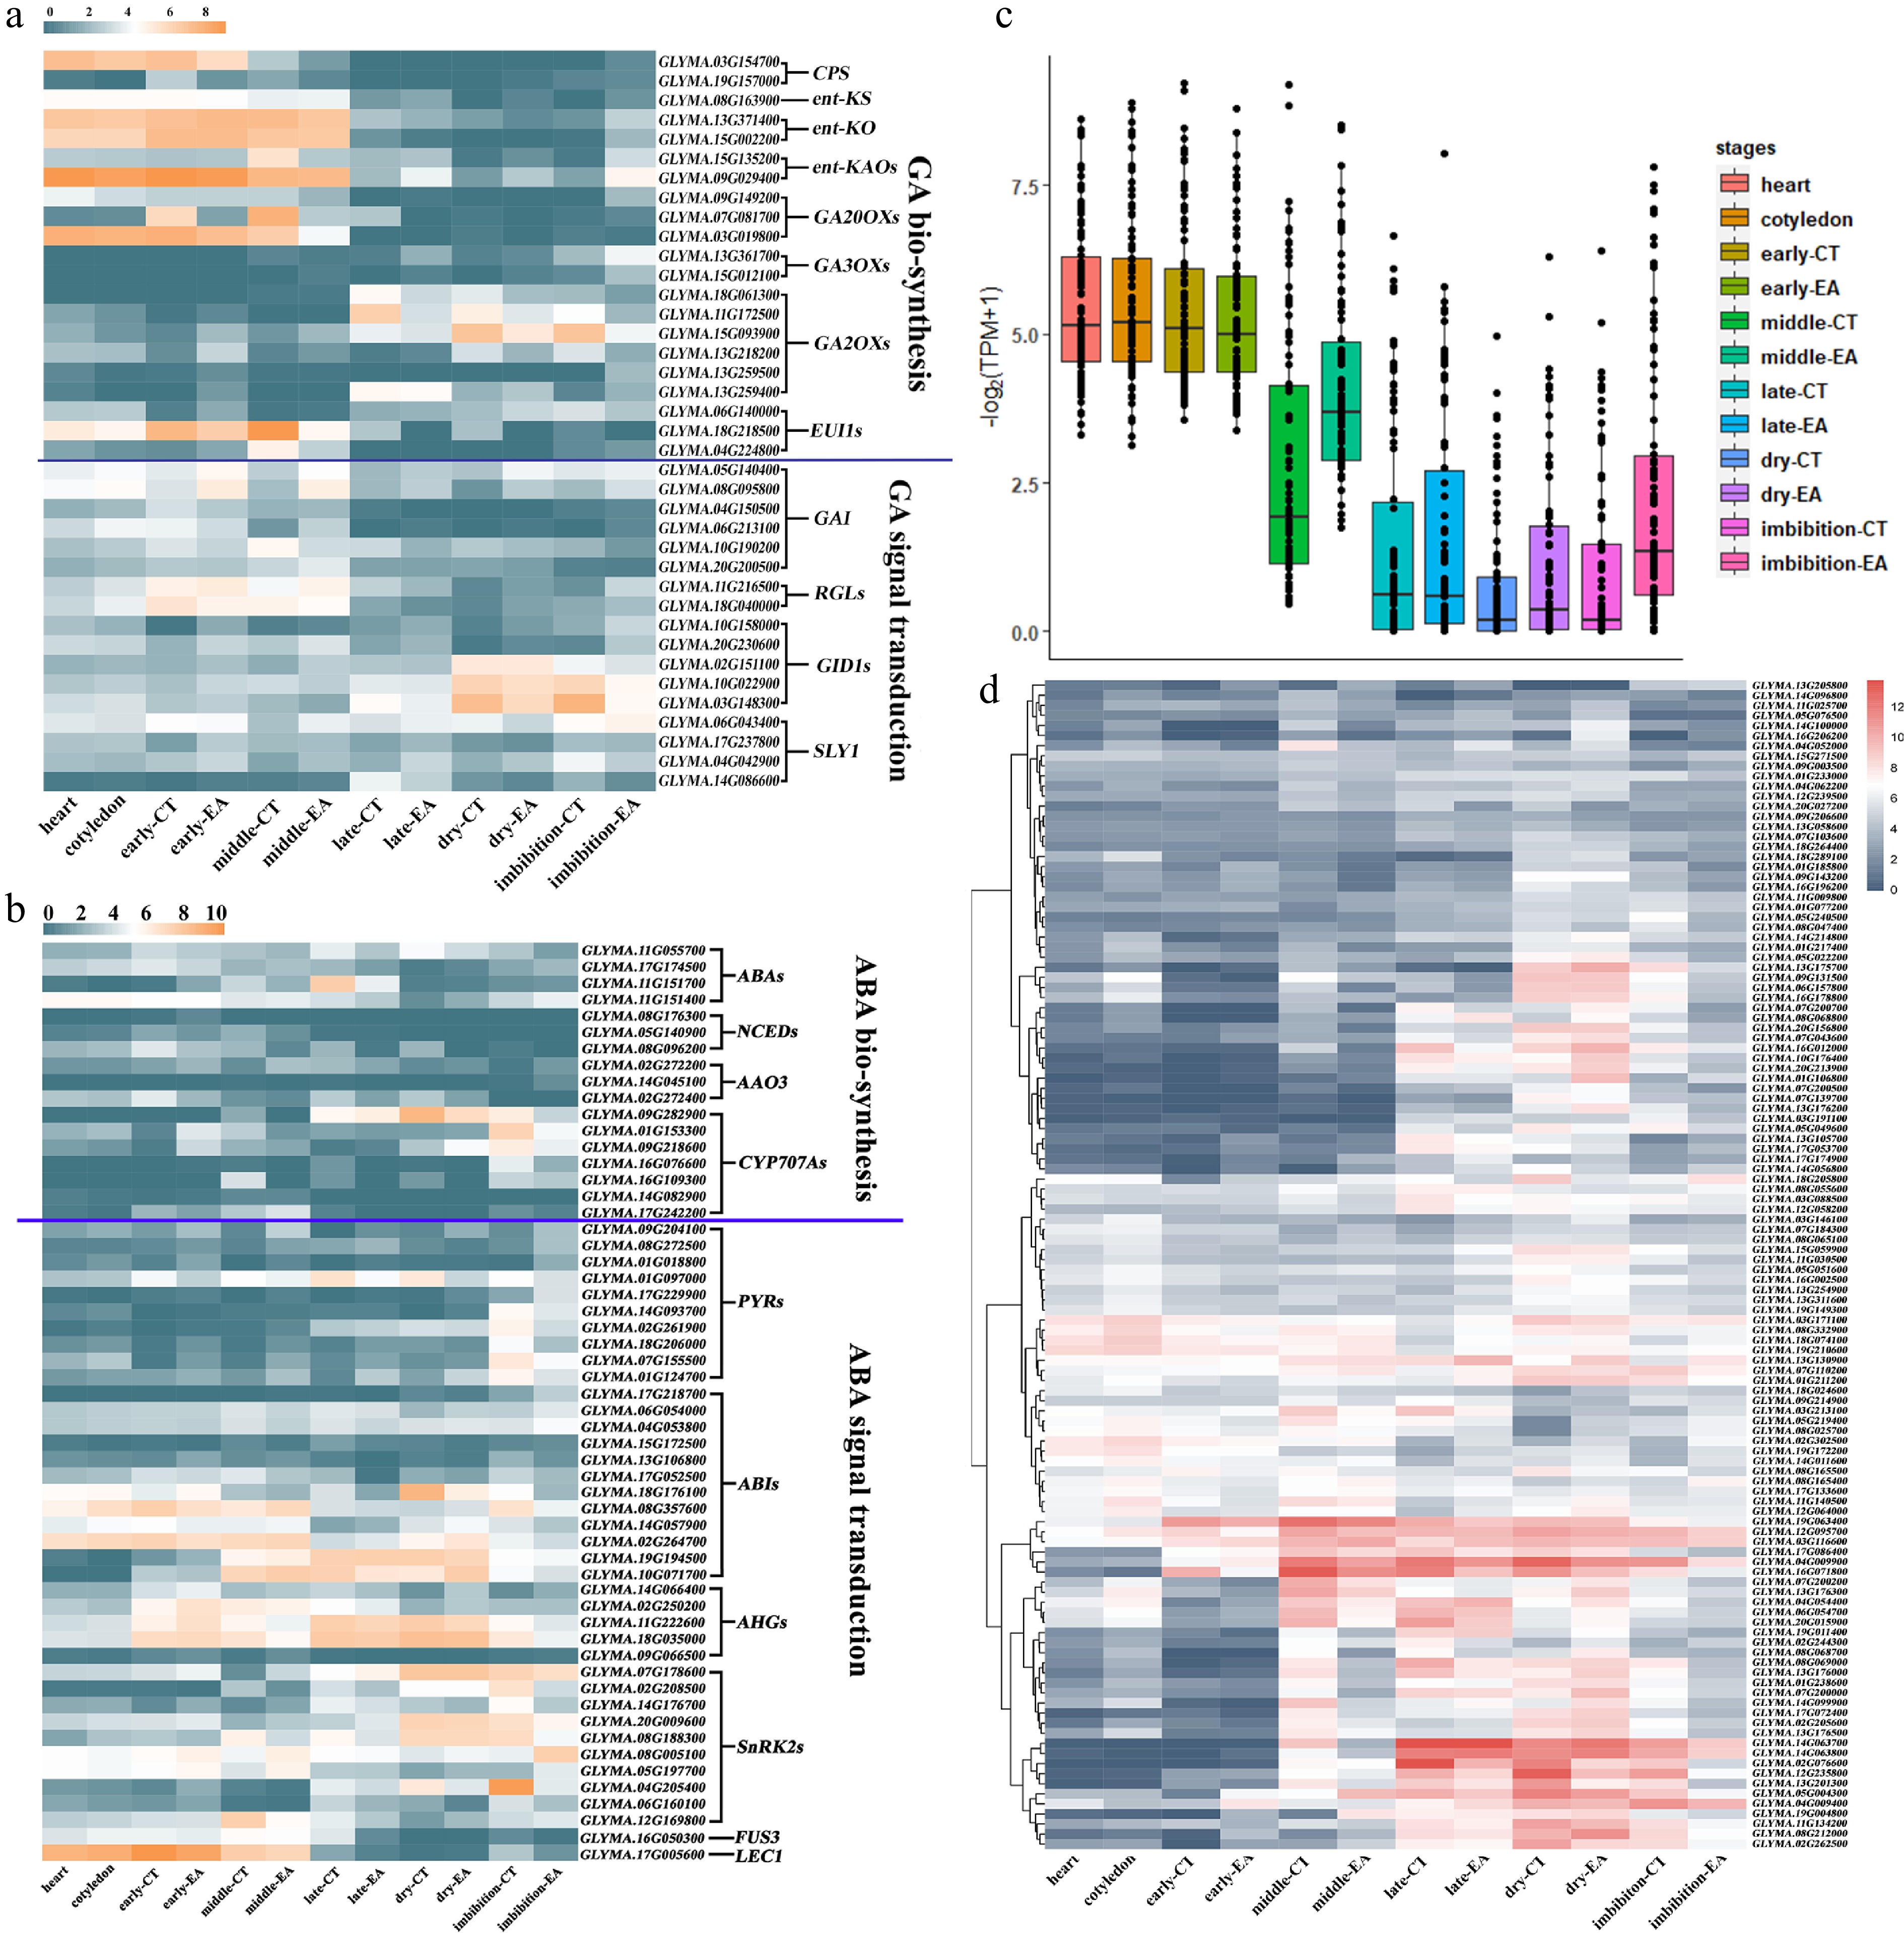
Figure 6.
Internal and external signal response in soybean embryo development. Heatmap of gene expression patterns from (a) GA, and (b) ABA synthesis and signal transduction network during embryo development. (c) Expression pattern of cell cycle associated genes. (d) Heatmap of gene expression patterns from water and heat response network expression during embryo development.
-
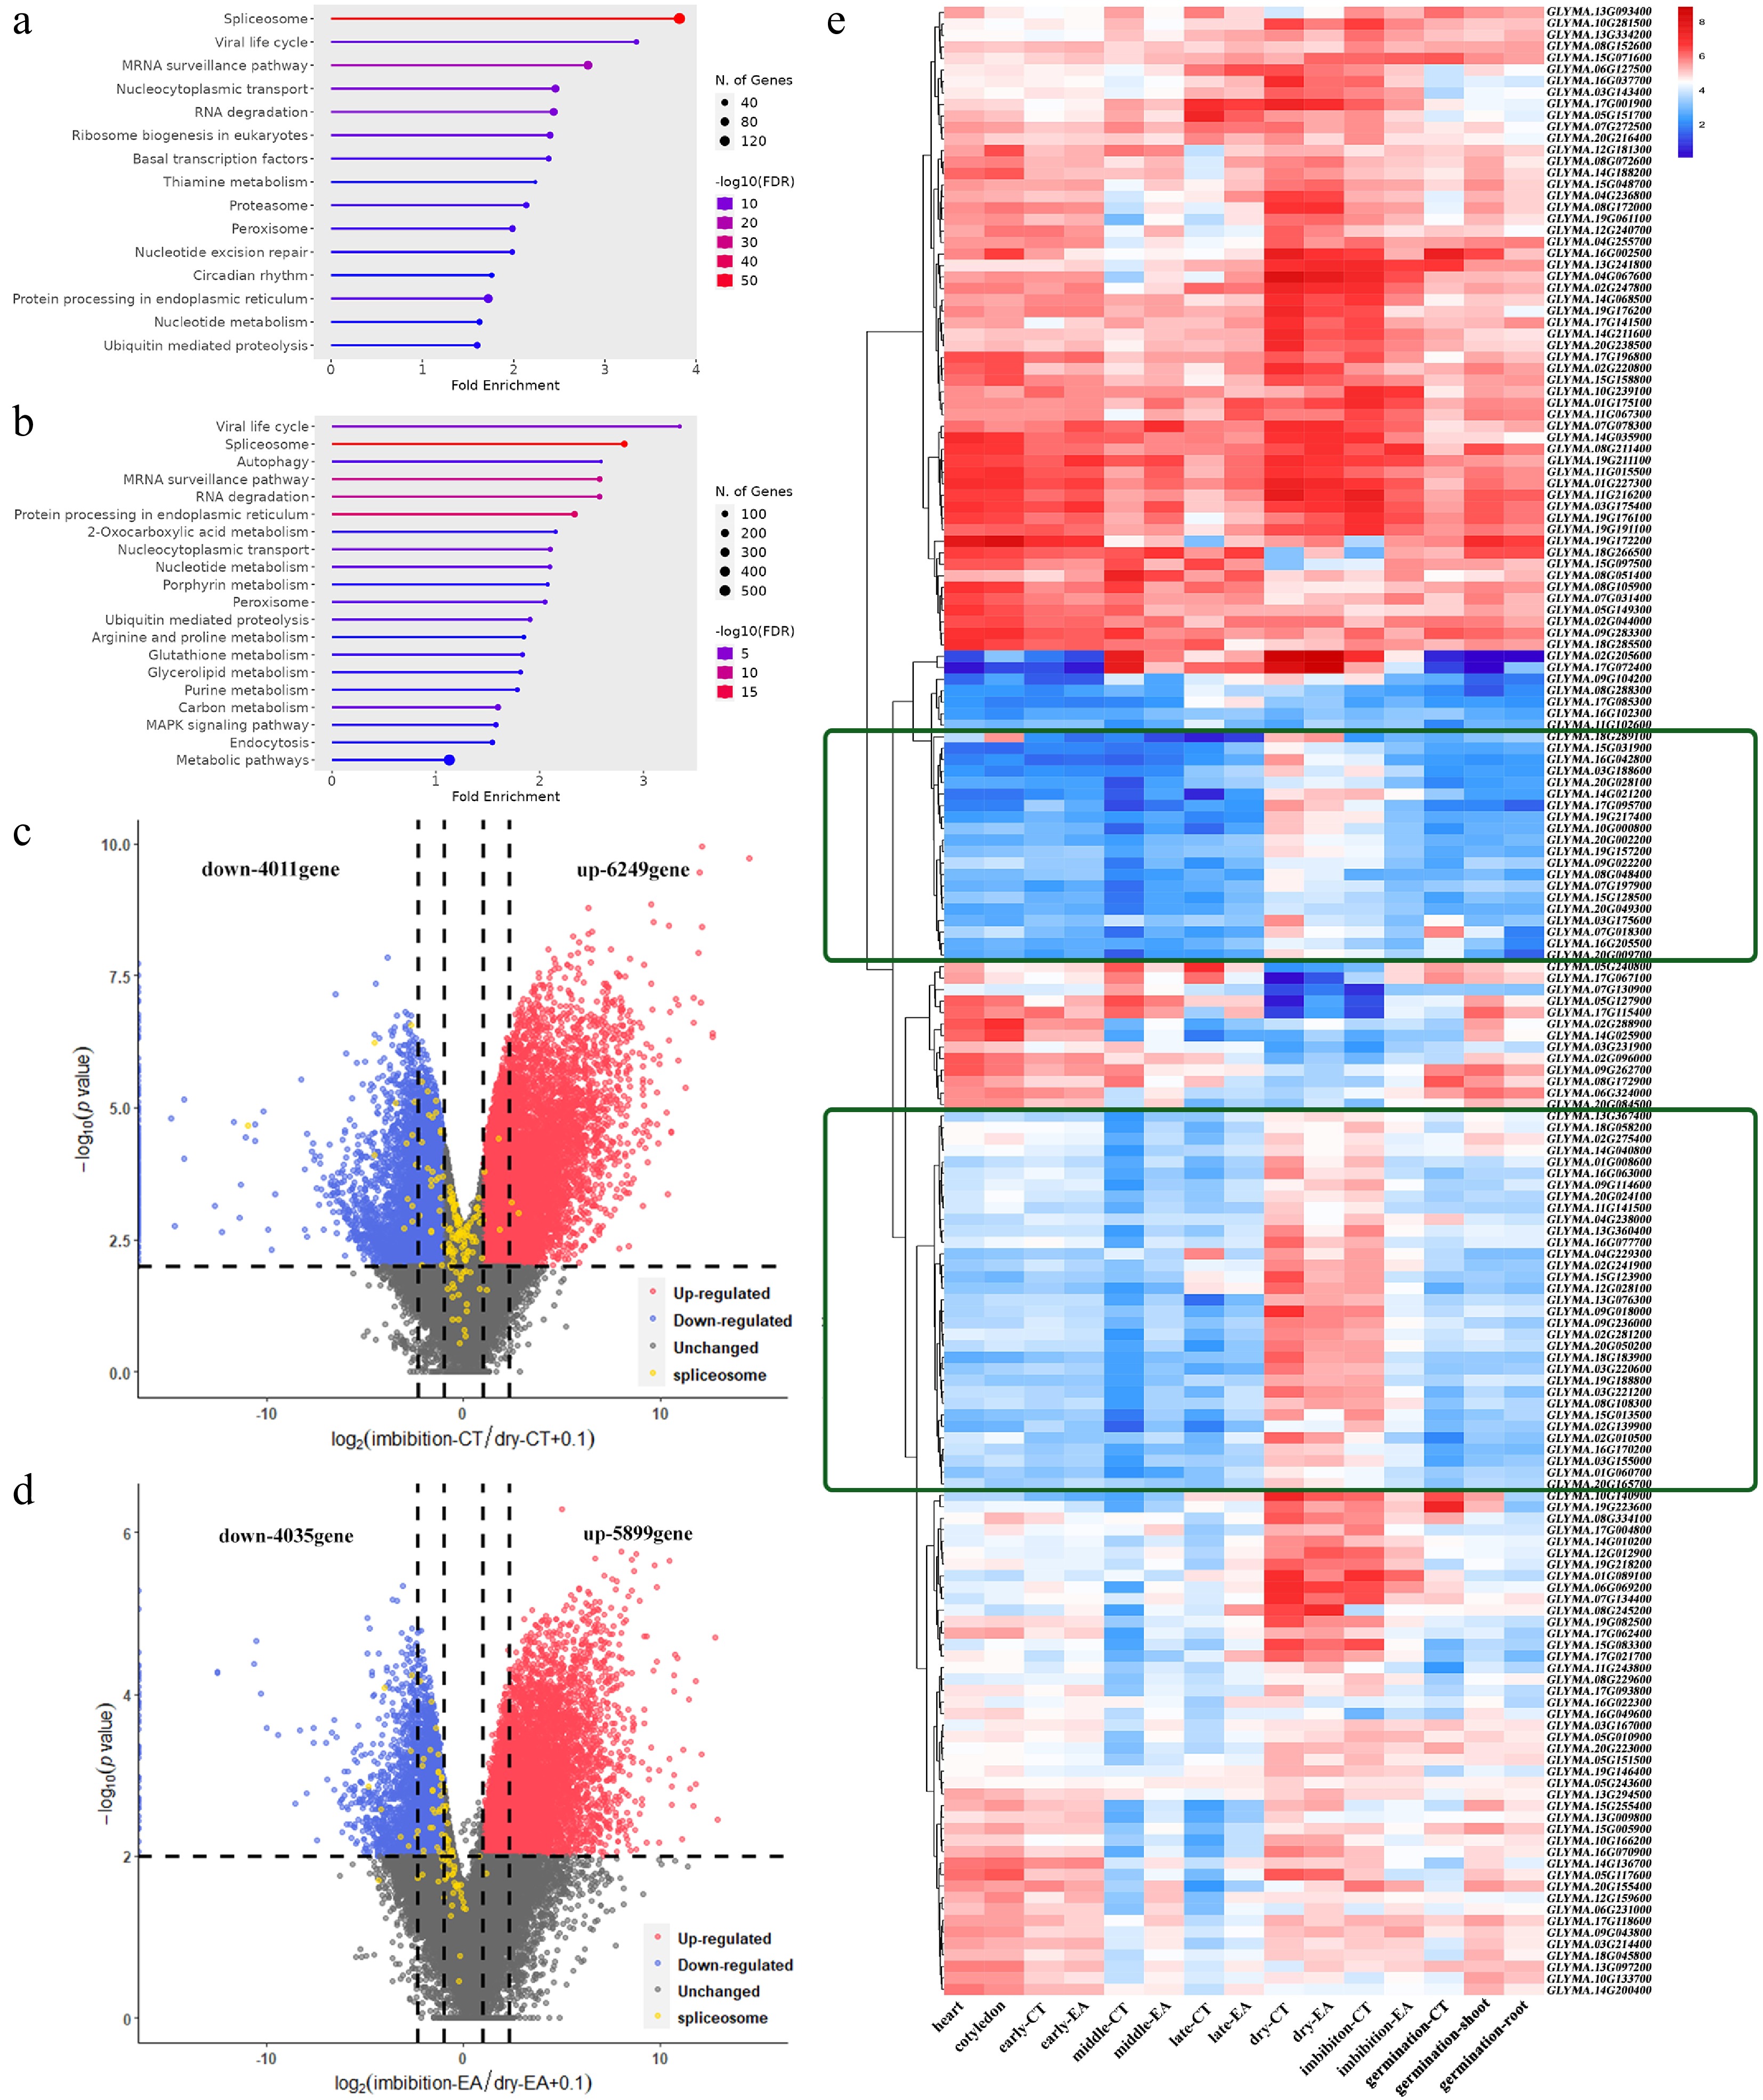
Figure 7.
RNA storage in embryo of dry seeds. KEGG items of upregulated genes in comparison of (a) dry-seed CT vs late-maturation CT, and (b) dry-seed EA vs late-maturation EA. Volcano plot and DEG numbers for comparison of (c) imbibition-seed CT vs dry-seed CT, and (d) imbibition-seed EA vs dry-seed EA. (e) Heatmap of genes expression patterns from KEGG item 'spliceosome' during embryo development. The green box shows the group of genes with significantly high expression in dry seeds.
-
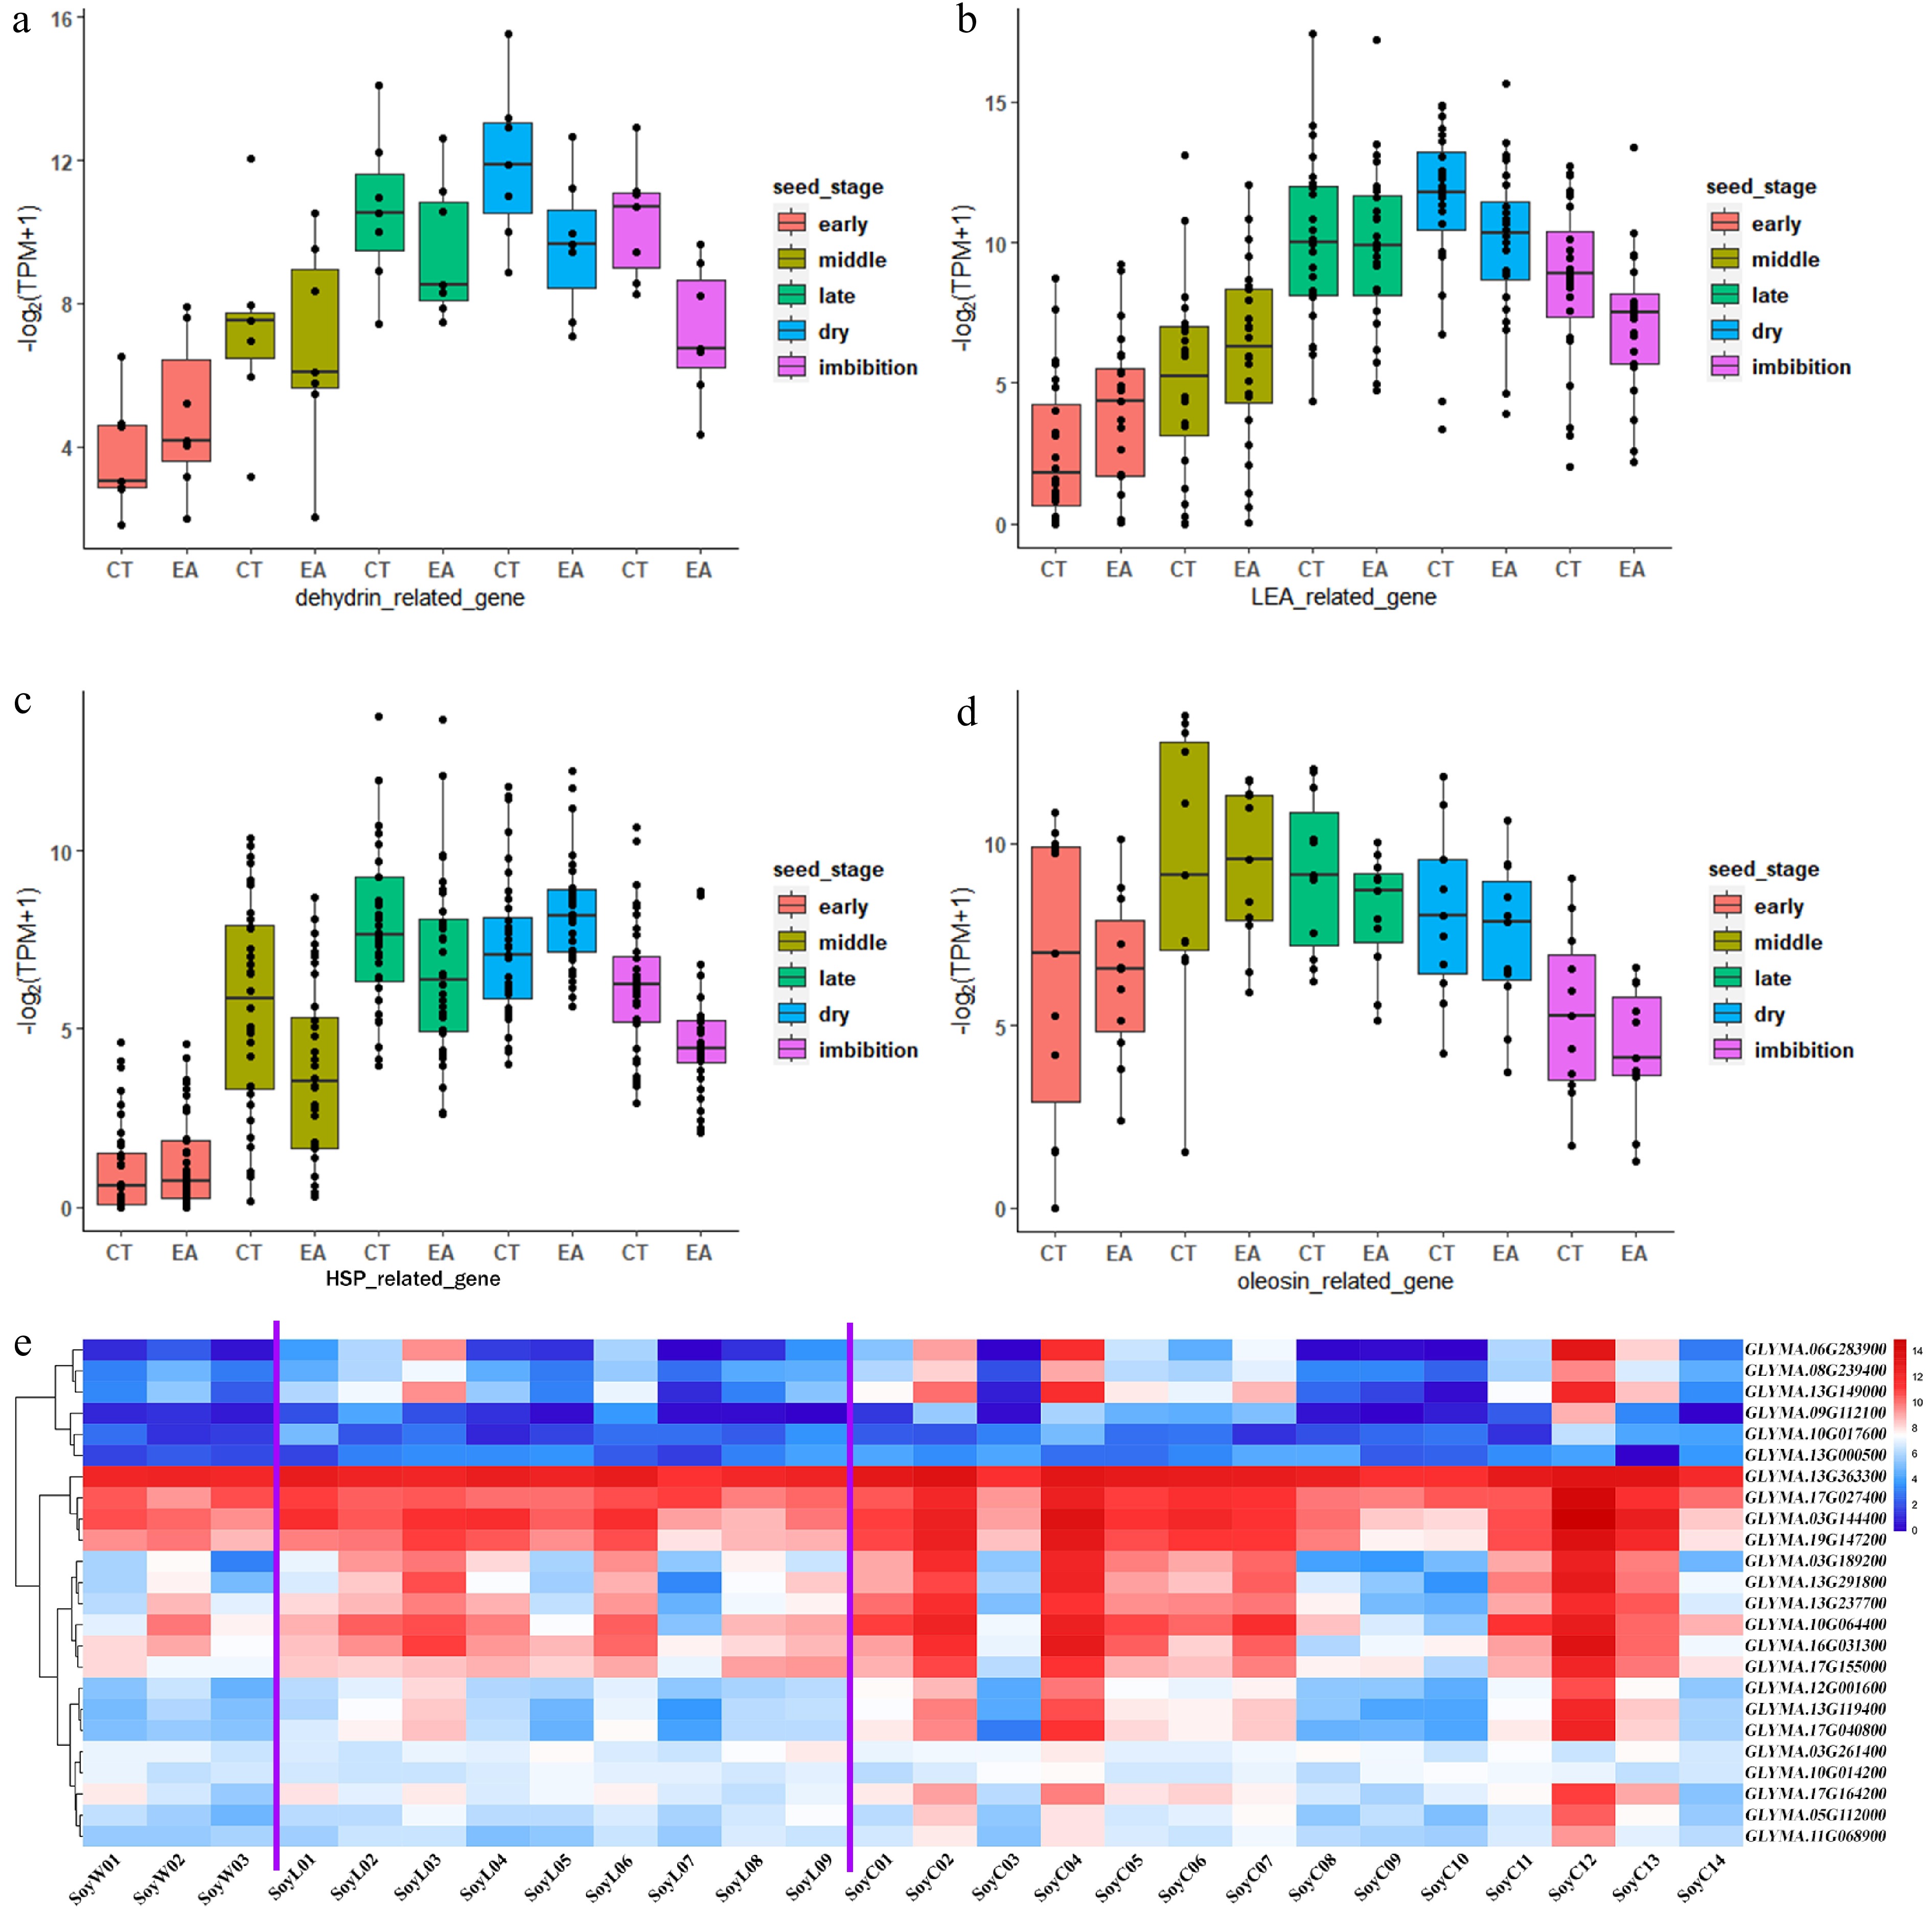
Figure 8.
Domestication selection of dehydration genes in soybean seed maturation. Box plot shows expression pattern of (a) dehydrin family, (b) LEA family, (c) HSP family, and (d) oleosin family during seed development. (e) Heatmap shows expression of LEA family genes in developing seed from wild soybeans, landraces and cultivars. The purple lines separate wild soybean, landrace and cultivar into three groups. 'SoyW' represents wild soybean, 'SoyL' represent landrace, 'SoyC' represents cultivar soybean.
Figures
(8)
Tables
(0)