-

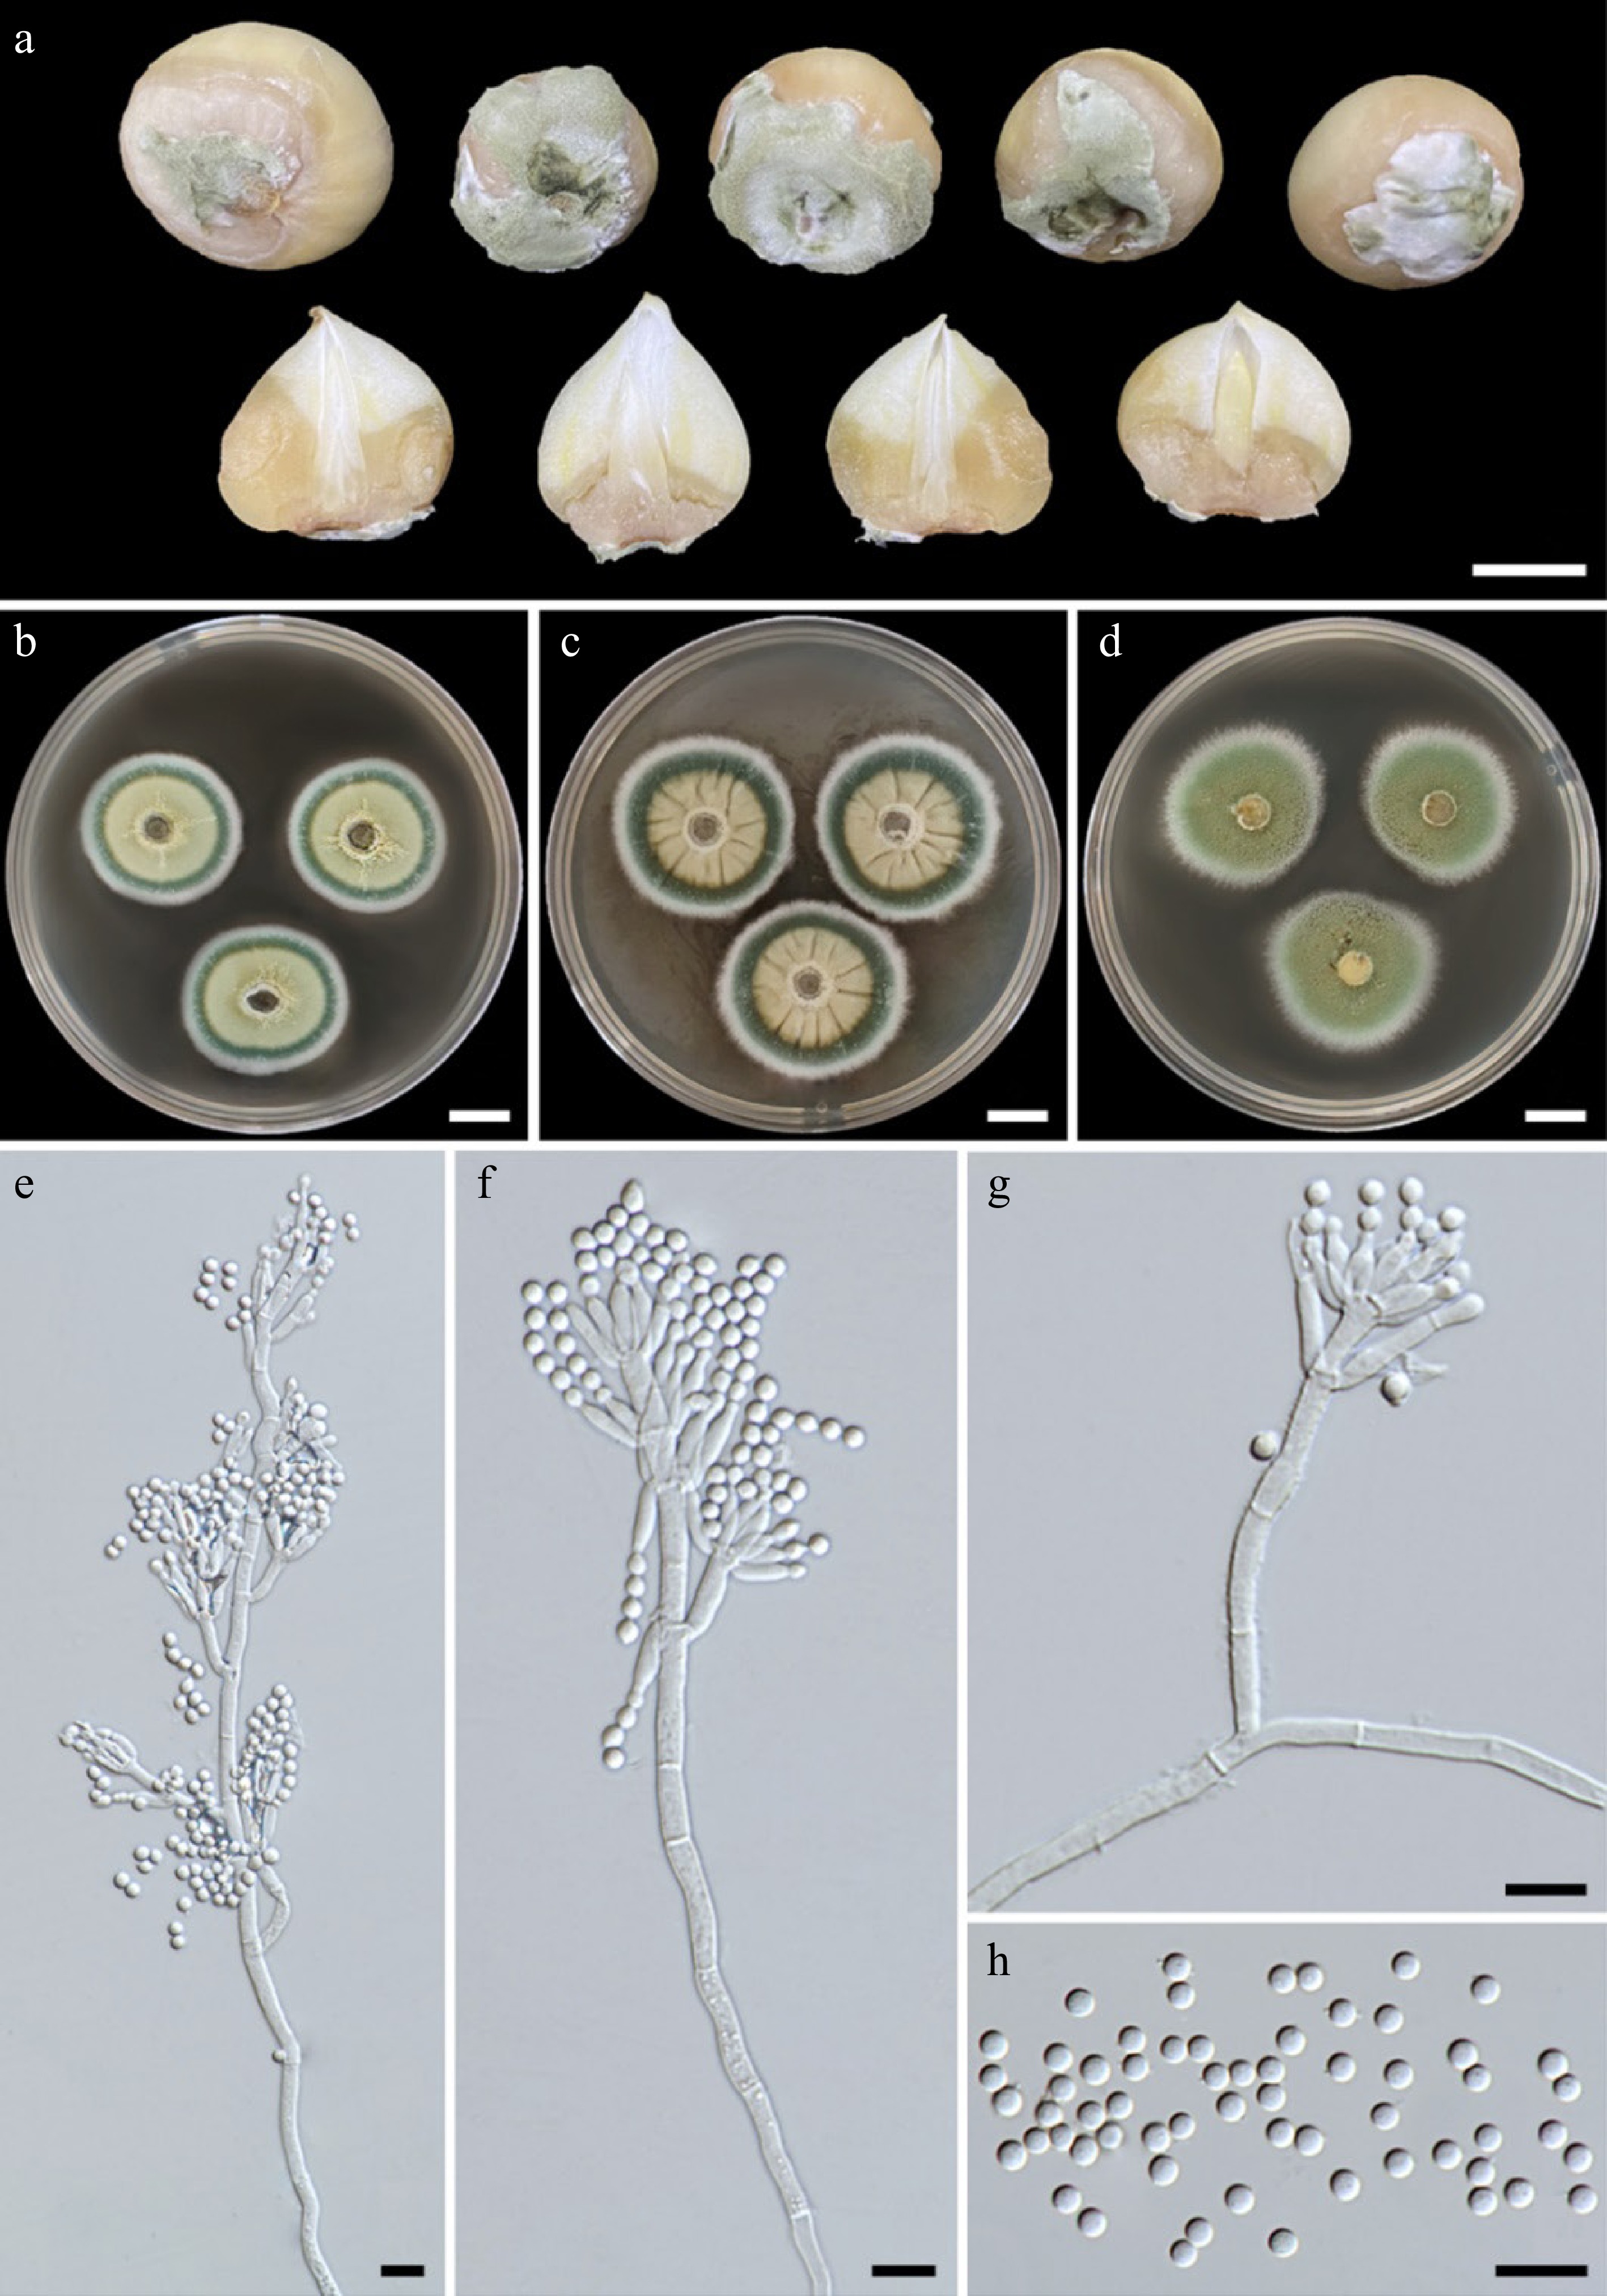
Figure 1.
(a) Natural symptoms of blue mold disease on bulbs of elephant garlic by Penicillium allii . Colonies of Penicillium allii SDBR-CMU499 after incubation at 25 °C for one week. (b) PDA. (c) CYA. (d) MEA. (e)–(g) Conidiophores. (h) Conidia. Scale bars: (a)–(d) = 10 mm, (e)–(h) = 10 μm.
-

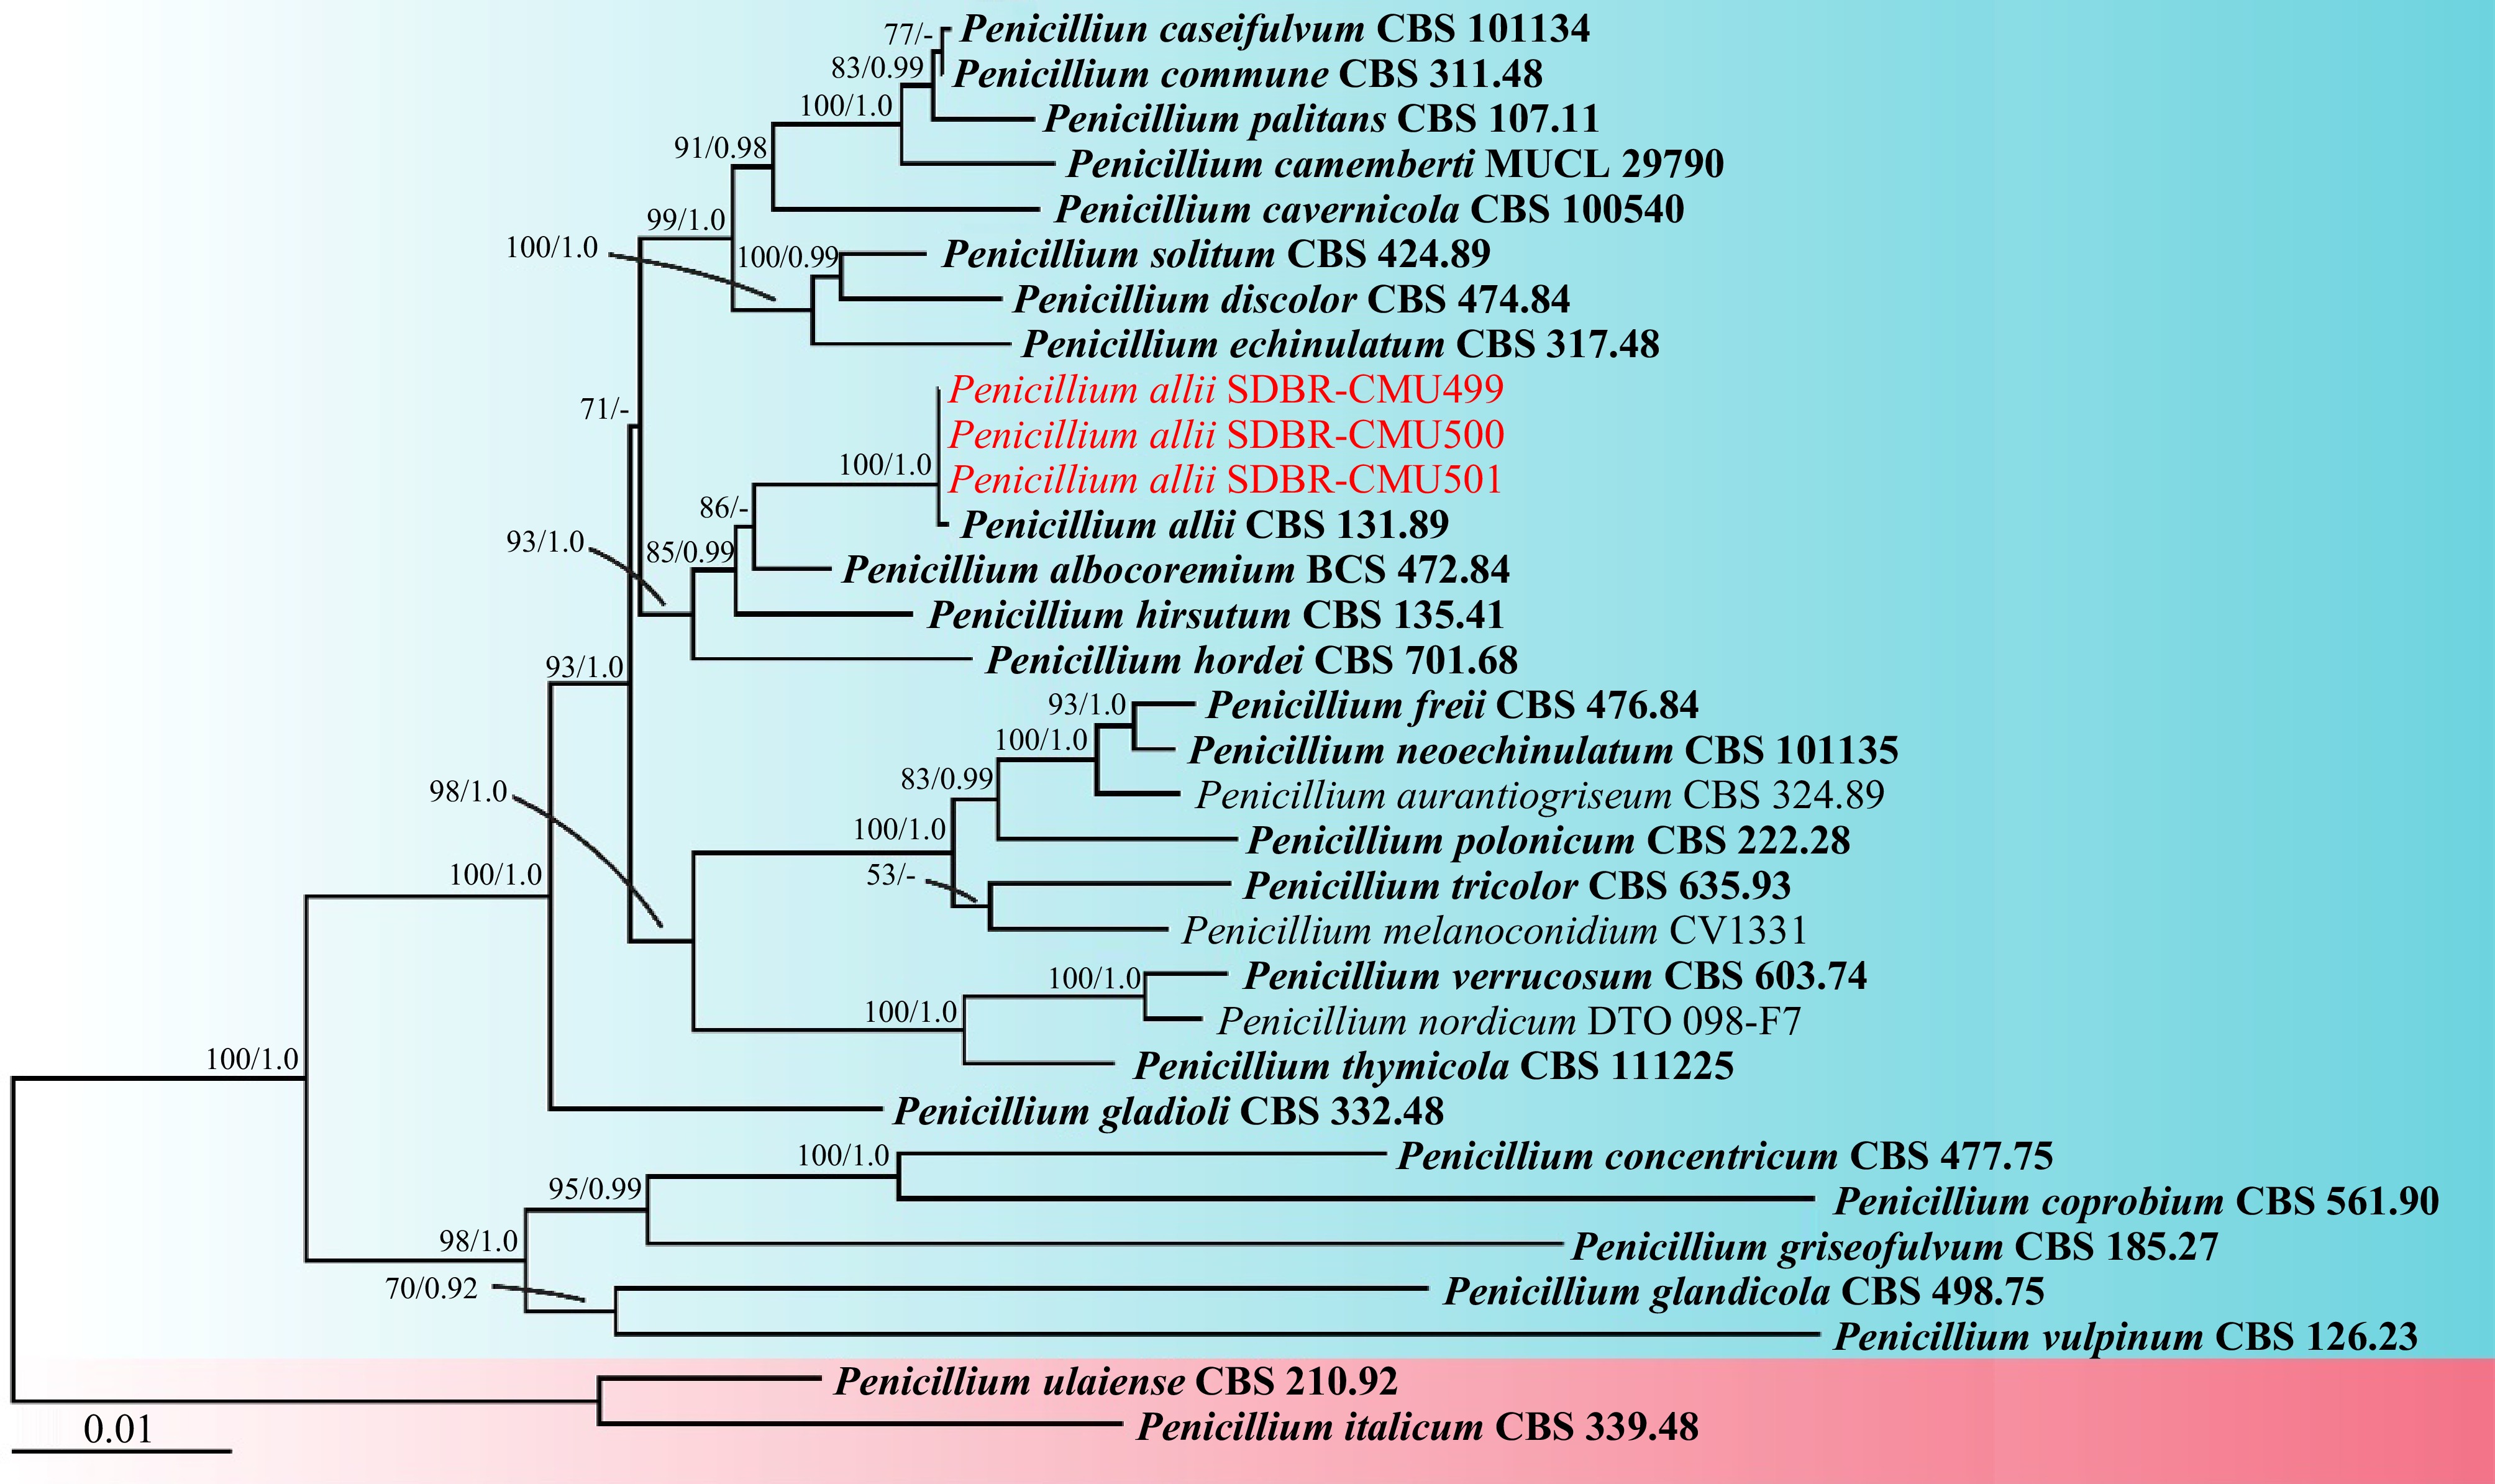
Figure 2.
Phylogram derived from maximum likelihood analysis of the combined ITS, BenA, CaM, and rpb2 sequences of 30 taxa in the Penicillium section Fasciculata and two taxa in the Penicillium section Penicillium. Penicillium italicum CBS 339.48 and P. ulaiense CBS 210.92 were used as outgroups. Bootstrap values ≥ 50% (left) and Bayesian posterior probabilities ≥ 0.90 (right) are displayed above nodes. The scale bar represents the expected number of nucleotide substitutions per site. The sequences of fungal species obtained in this study are in red. The ex-type strain are in bold.
-

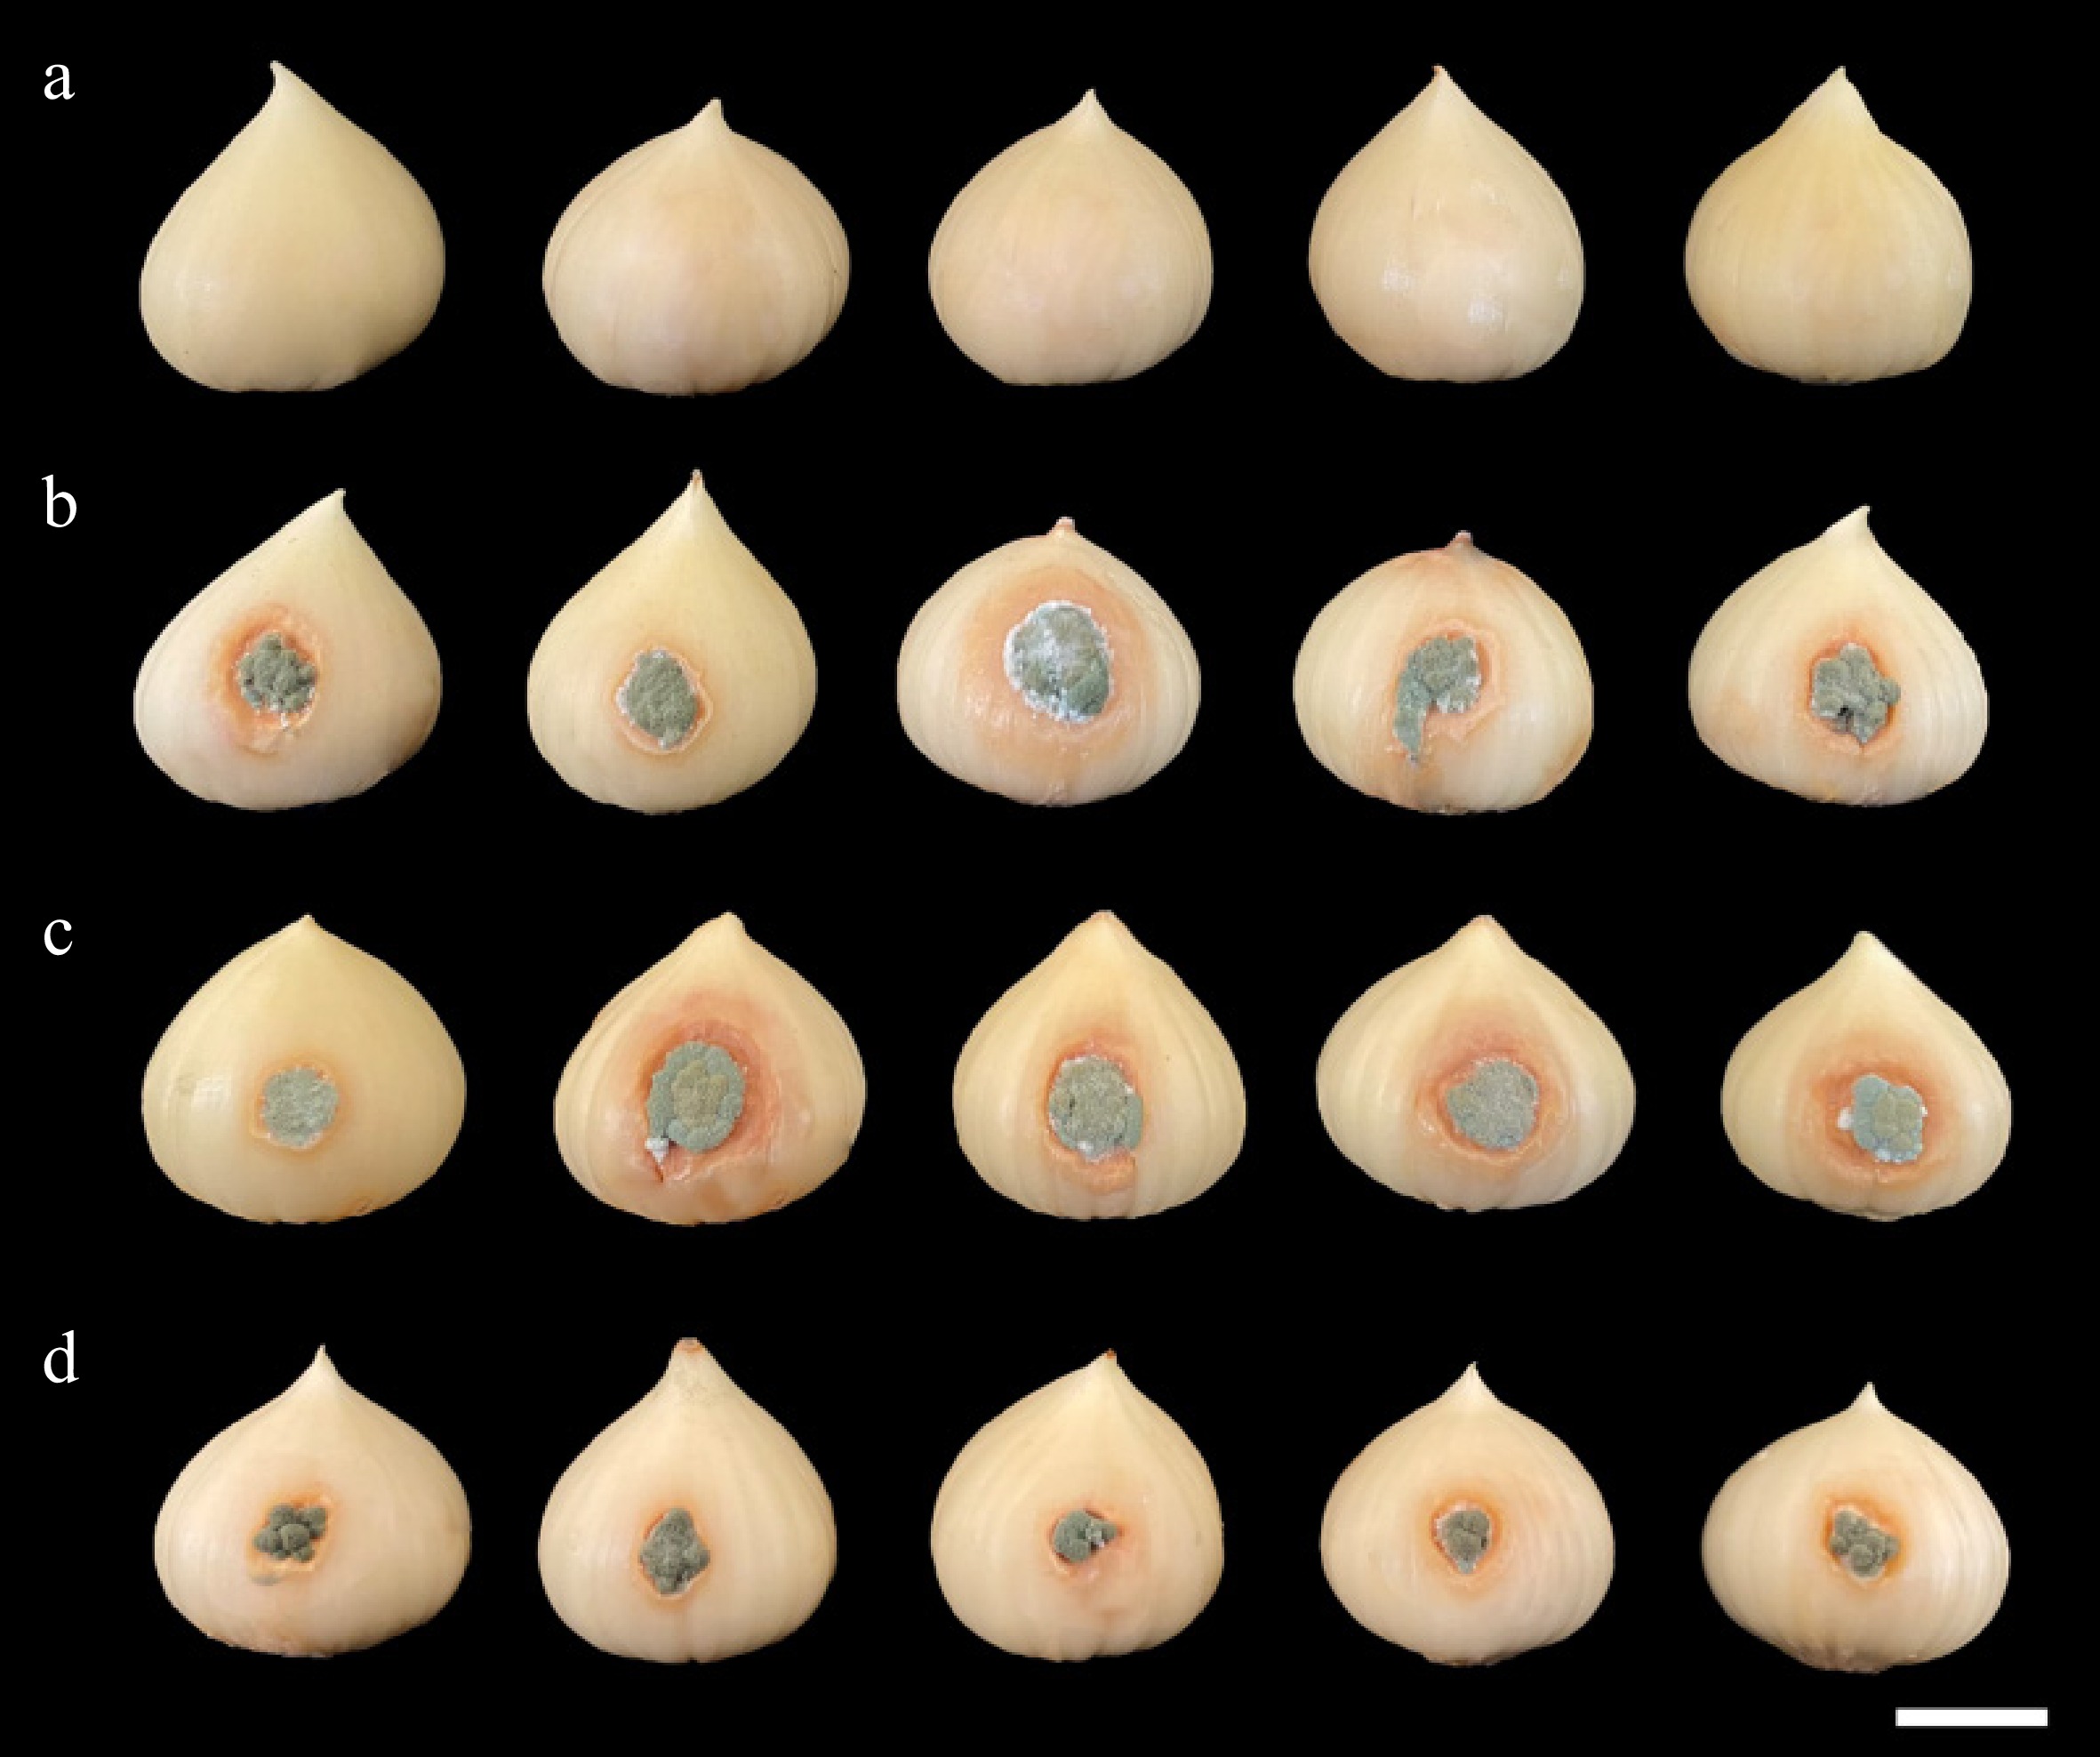
Figure 3.
Pathogenicity test using Penicillium allii SDBR-CMU499, SDBR-CMU500, and SDBR-CMU501 on bulbs of elephant garlic after one week inoculation at 25 °C. (a) Control bulbs treated with sterile distilled water instead of inoculum. Blue mold disease on bulbs of elephant garlic after inoculation of isolate (b) SDBR-CMU499, (c) SDBR-CMU500, and (d) SDBR-CMU501. Scale bar: 10 mm.
-
Penicillium species Strain/isolate GenBank accession number ITS BenA CaM rpb2 P. albocoremium CBS 472.84T AJ004819 AY674326 KUJ896819 KU904344 P. allii CBS 131.89T ‒ AY674331 KU896820 KU904345 P. allii SDBR-CMU499 PP998350 PQ032853 PQ032856 PQ032859 P. allii SDBR-CMU500 PP998351 PQ032854 PQ032857 PQ032860 P. allii SDBR-CMU501 PP998352 PQ032855 PQ032858 PQ032861 P. aurantiogriseum CBS 324.89 AF033476 AY674296 KU896822 JN406573 P. camemberti MUCL 29790T AB479314 FJ930956 KU896825 JN121484 P. cavernicola CBS 100540T MH862709 KJ834439 KU896827 KU904348 P. caseifulvum CBS 101134T MH862722 AY674372 KU896826 KU904347 P. commune CBS 311.48T AY213672 AY674366 KU896829 KU904350 P. concentricum CBS 477.75T KC411763 AY674413 DQ911131 KT900575 P. coprobium CBS 561.90T DQ339559 AY674425 KU896830 KT900576 P. discolor CBS 474.84T OW986149 AY674348 KU896834 KU904351 P. echinulatum CBS 317.48T MH856364 AY674341 DQ911133 KU904352 P. freii CBS 476.84T MH861769 KU896813 KU896836 KU904353 P. gladioli CBS 332.48T AF033480 AY674287 KU896837 JN406567 P. glandicola CBS 498.75T AB479308 AY674415 KU896838 KU904354 P. griseofulvum CBS 185.27T AF033468 AY674432 JX996966 JN121449 P. hirsutum CBS 135.41T AY373918 AF003243 KU896840 JN406629 P. hordei CBS 701.68T MN431391 AY674347 KU896841 KU904355 P. italicum CBS 339.48T KJ834509 AY674398 DQ911135 ‒ P. melanoconidium CV1331 JX091410 JX091545 JX141587 KU904358 P. neoechinulatum CBS 101135T JN942722 AF003237 KU896844 JN985406 P. nordicum DTO 098-F7 KJ834513 KJ834476 KU896845 KU904359 P. palitans CBS 107.11T KJ834514 KJ834480 KU896847 KU904360 P. polonicum CBS 222.28T AF033475 AY674305 KU896848 JN406609 P. solitum CBS 424.89T AY373932 AY674354 KU896851 KU904363 P. thymicola CBS 111225T KJ834518 AY674321 FJ530990 KU904364 P. tricolor CBS 635.93T MH862450 AY674313 KU896852 JN985422 P. ulaiense CBS 210.92T KC411695 AY674408 KUB96854 KU904365 P. verrucosum CBS 603.74T AY373938 AY674323 DQ911138 JN121539 P. vulpinum CBS 126.23T AF506012 KJ834501 KU896857 KU904367 Ex-type species are indicated by the superscript letters as 'T'. '−' indicates the absence of sequencing information in GenBank. The fungal isolates and sequences obtained in this study are in bold. Table 1.
Details of sequences in Penicillium section Fasciculata used in molecular phylogenetic analysis.
-
Fungicides Dosages Inhibition of mycelial growth (%)* Reaction SDBR-CMU499 SDBR-CMU500 SDBR-CMU501 Benalaxyl-M + mancozeb 1/2RD 30.08 ± 1.41 c 29.27 ± 2.25 c 30.08 ± 2.53 c Insensitive RD 55.28 ± 1.41 b 56.10 ± 3.62 b 60.16 ± 1.67 b Sensitive 2RD 82.11 ± 2.82 a 83.74 ± 1.41 a 83.74 ± 3.45 a Sensitive Captan 1/2RD 2.44 ± 3.50 c 1.63 ± 2.41 c 2.44 ± 1.25 c Insensitive RD 4.88 ± 2.25 b 4.88 ± 2.23 b 5.69 ± 2.30 b Insensitive 2RD 72.36 ± 1.60 a 73.93 ± 3.45 a 73.98 ± 2.82 a Sensitive Carbendazim 1/2RD 100 ± 0 a 100 ± 0 a 100 ± 0 a Inhibition RD 100 ± 0 a 100 ± 0 a 100 ± 0 a Inhibition 2RD 100 ± 0 a 100 ± 0 a 100 ± 0 a Inhibition Copper oxychloride 1/2RD 61.79 ± 1.60 c 58.54 ± 1.05 c 56.91 ± 1.41 f Sensitive RD 68.29 ± 1.20 b 68.29 ± 2.05 b 68.29 ± 2.54 d Sensitive 2RD 100 ± 0 a 100 ± 0 a 100 ± 0 a Inhibition Difenoconazole + azoxystrobin 1/2RD 100 ± 0 a 100 ± 0 a 100 ± 0 a Inhibition RD 100 ± 0 a 100 ± 0 a 100 ± 0 a Inhibition 2RD 100 ± 0 a 100 ± 0 a 100 ± 0 a Inhibition Difenoconazole 1/2RD 100 ± 0 a 100 ± 0 a 100 ± 0 a Inhibition RD 100 ± 0 a 100 ± 0 a 100 ± 0 a Inhibition 2RD 100 ± 0 a 100 ± 0 a 100 ± 0 a Inhibition Mancozeb 1/2RD 19.51 ± 2.44 c 22.76 ± 3.73 c 21.14 ± 1.41 c Insensitive RD 47.15 ± 1.45 b 47.15 ± 2.82 b 43.90 ± 2.44 b Insensitive 2RD 58.54 ± 2.44 a 54.47 ± 1.42 a 55.28 ± 1.45 a Sensitive * Results are means of five replicates ± standard deviation with the independently repeated twice. Data with different letters within the same column for each fungal isolate and fungicide indicate a significant difference at p ≤ 0.05 according to Duncan's multiple range test. 1/2RD, RD, and 2RD indicate half of the recommended dosage, recommended dosage, and double the recommended dosage, respectively. Table 2.
Percentage of mycelial inhibition and reactions of three isolates of Penicillium allii against fungicides.
Figures
(3)
Tables
(2)