-
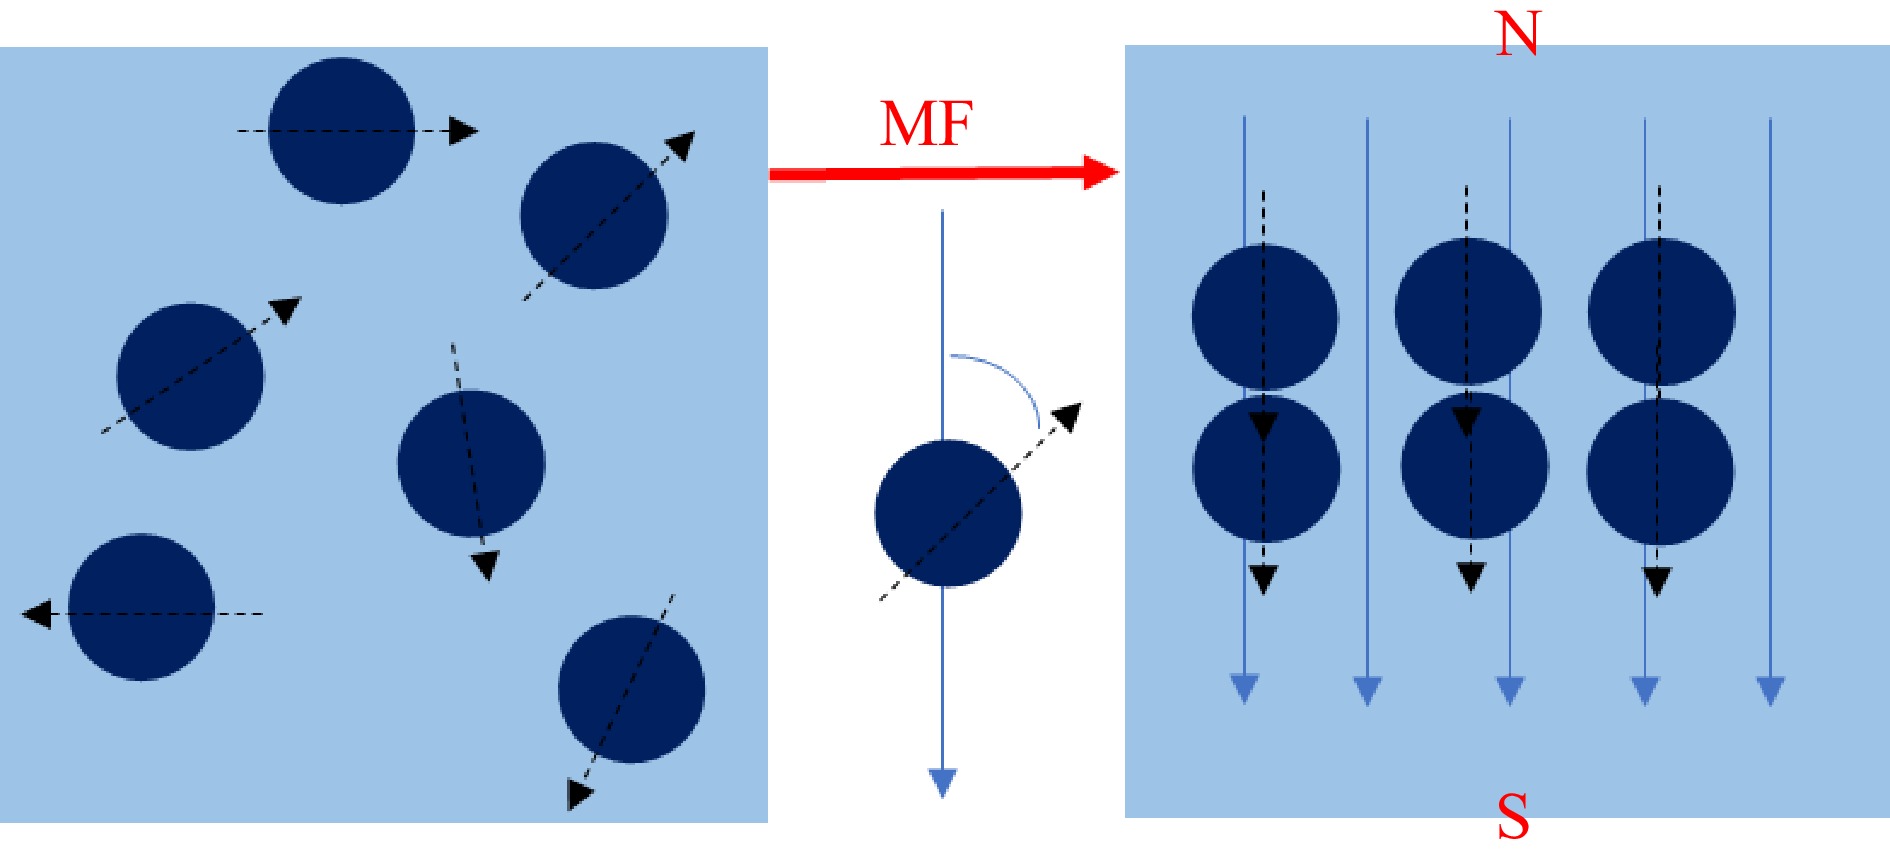
Figure 1.
The spin of a magnetic nucleus produces a magnetization vector (MF: magnetic field, N: magnetic north, S: magnetic south).
-
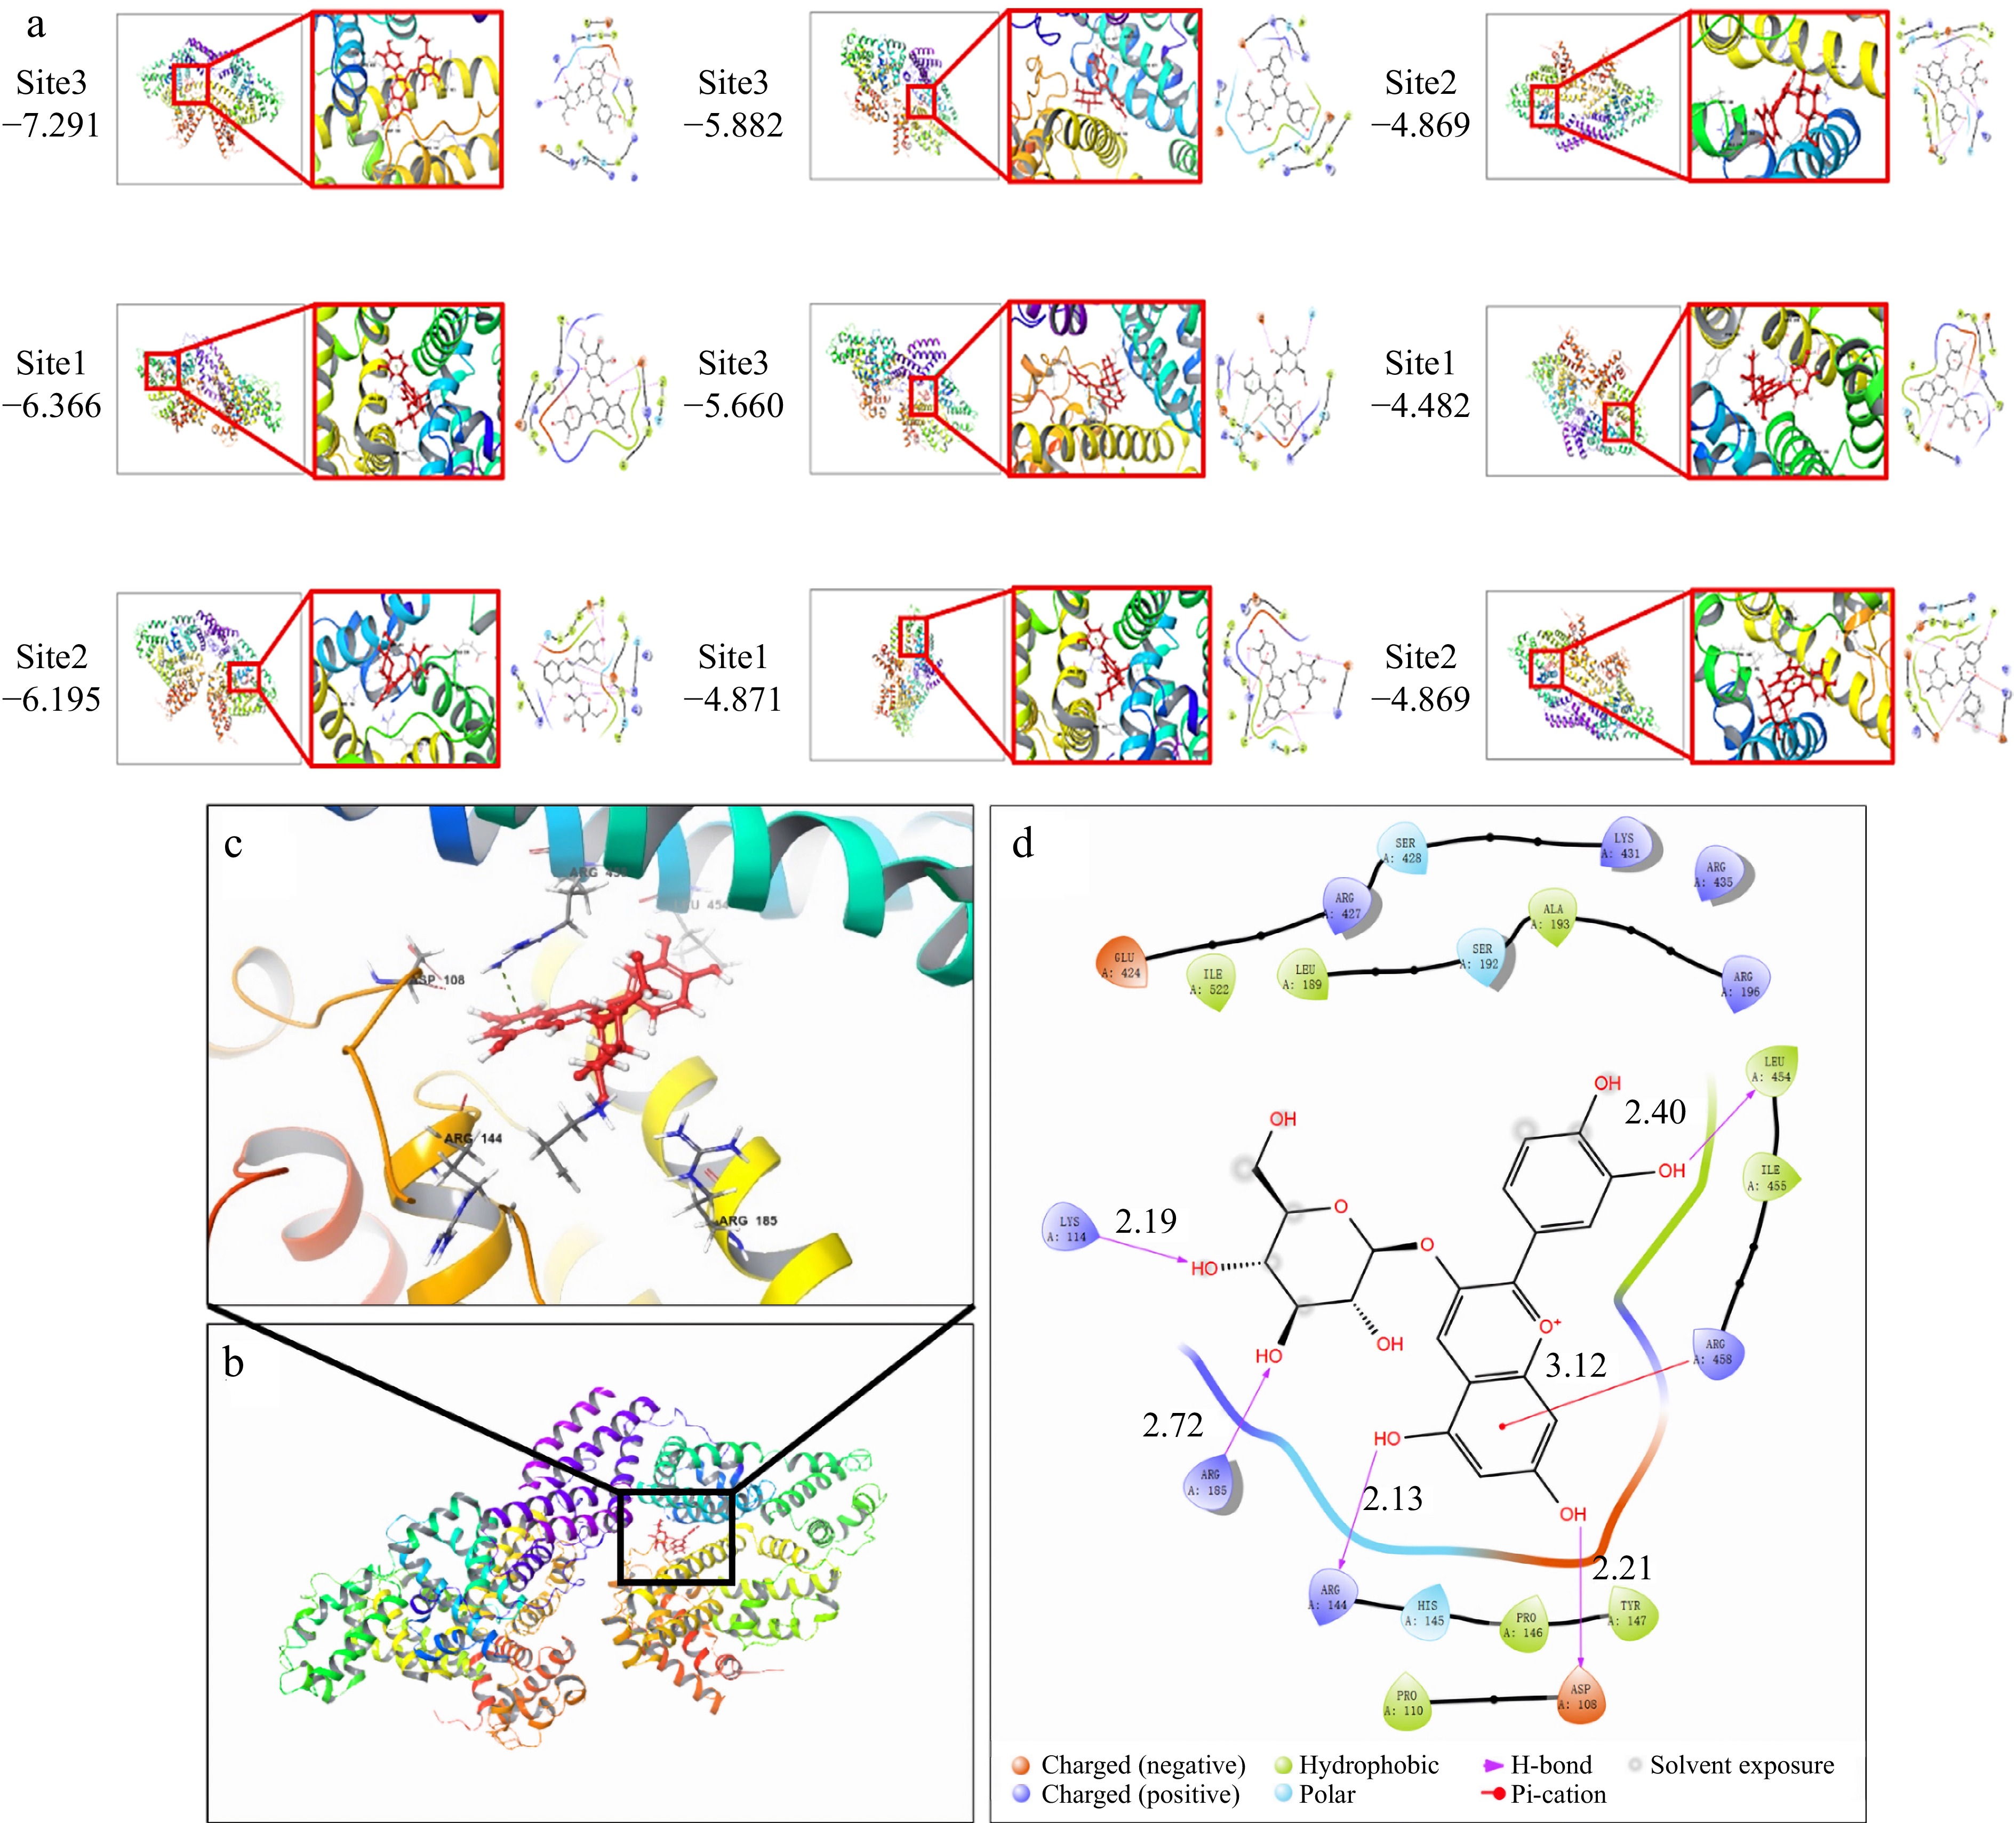
Figure 2.
Molecular docking of simulated BSA-C3G conjugates, (a) nine simulation results, (b) BSA-C3G conjugate model, (c) BSA-C3G binding site detail diagram, (d) main force type.
-
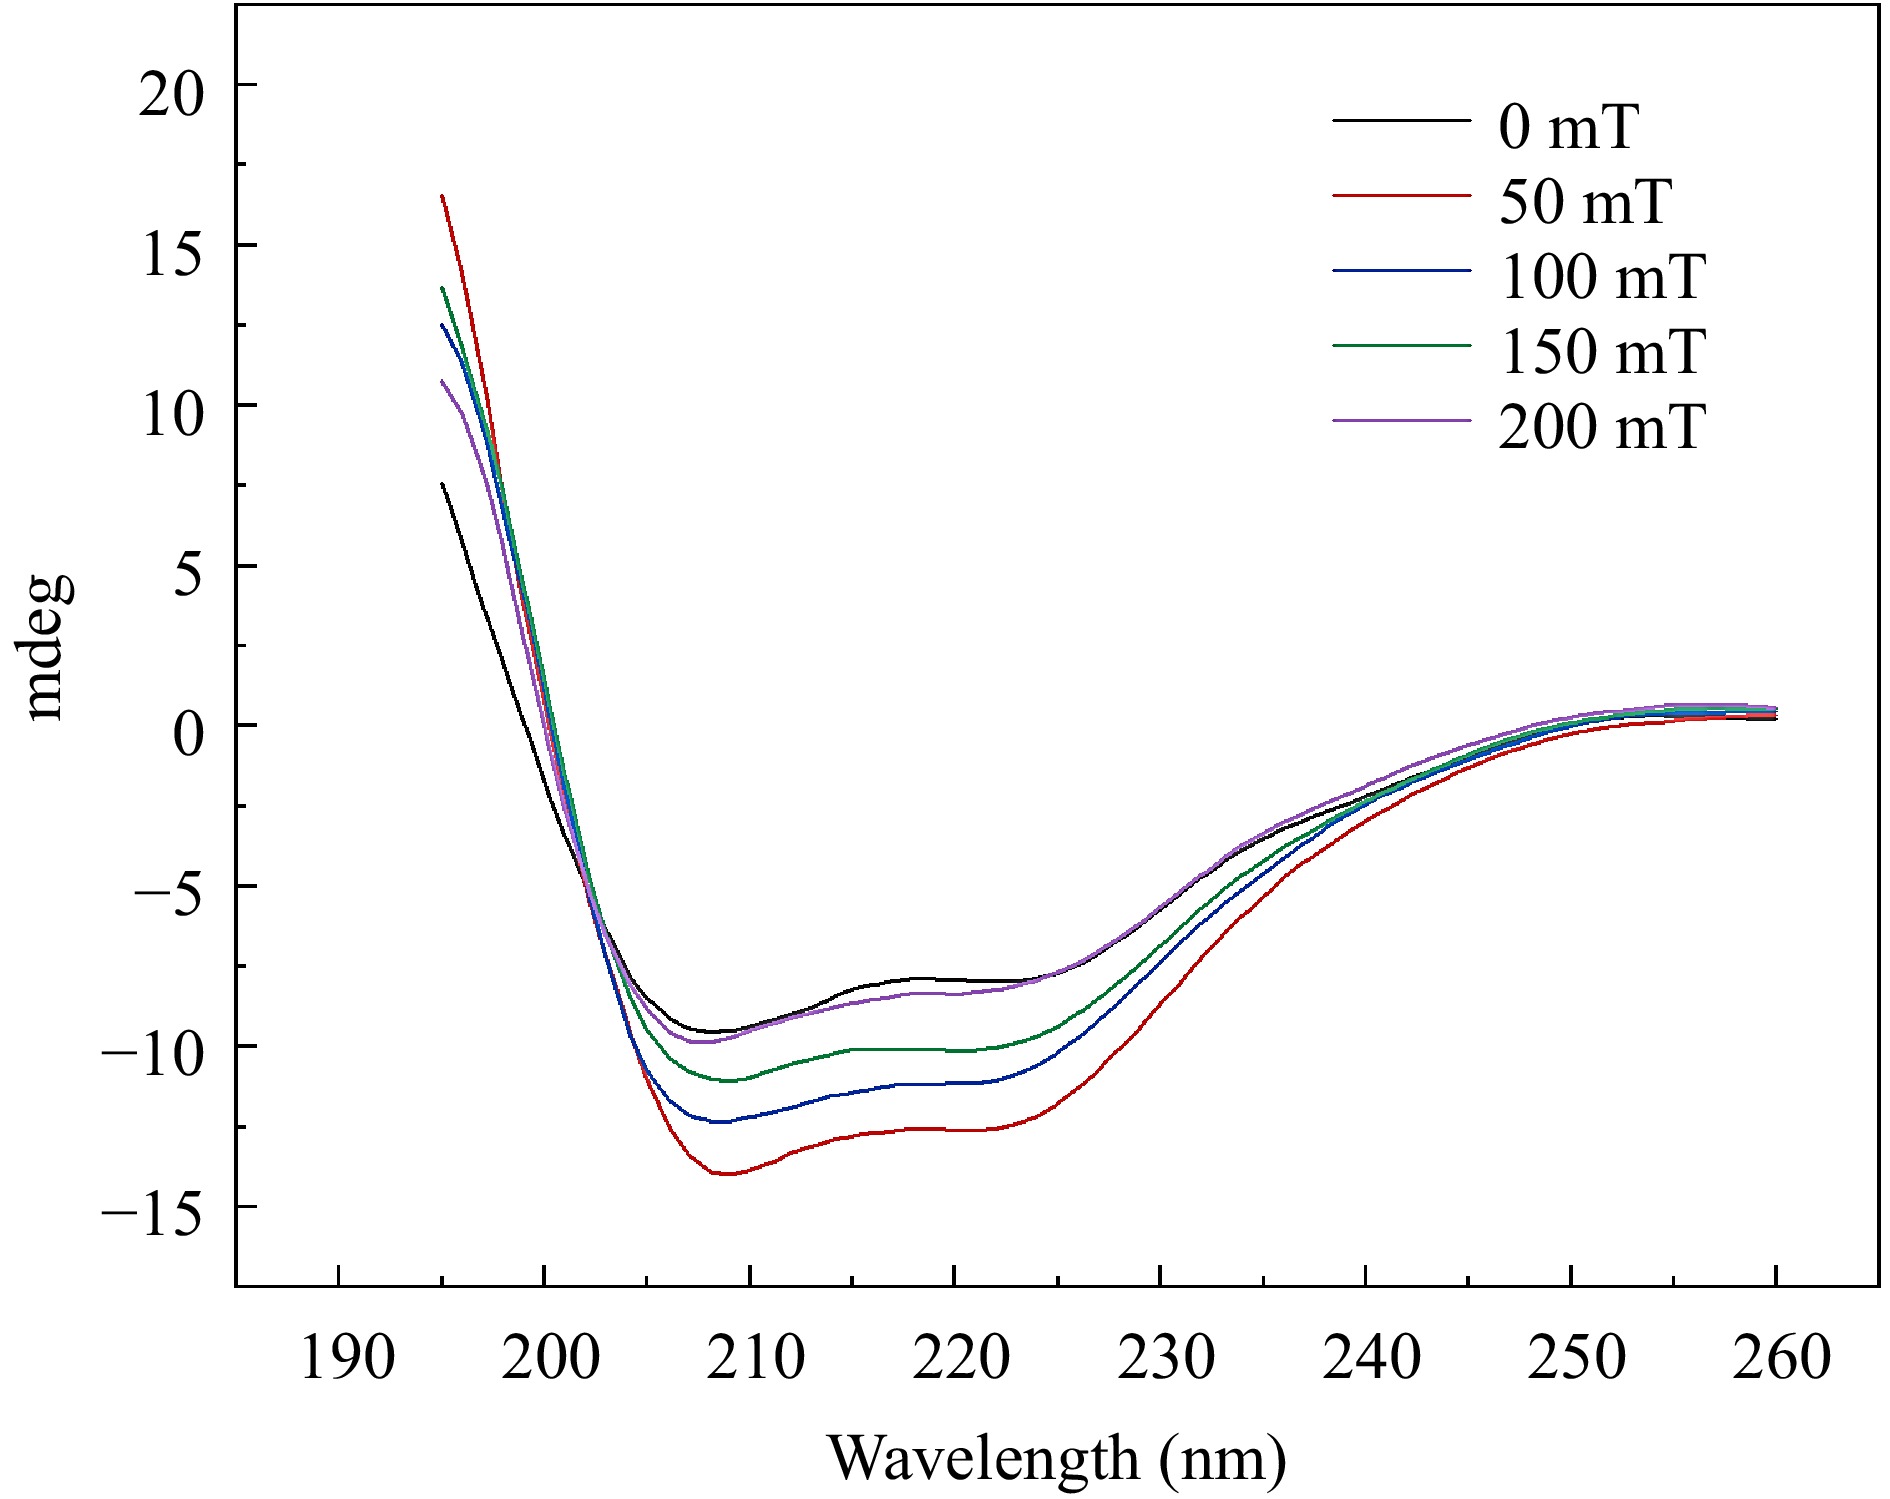
Figure 3.
Circular dichroism spectra of BSA-C3G conjugates at different magnetic sensing intensities.
-
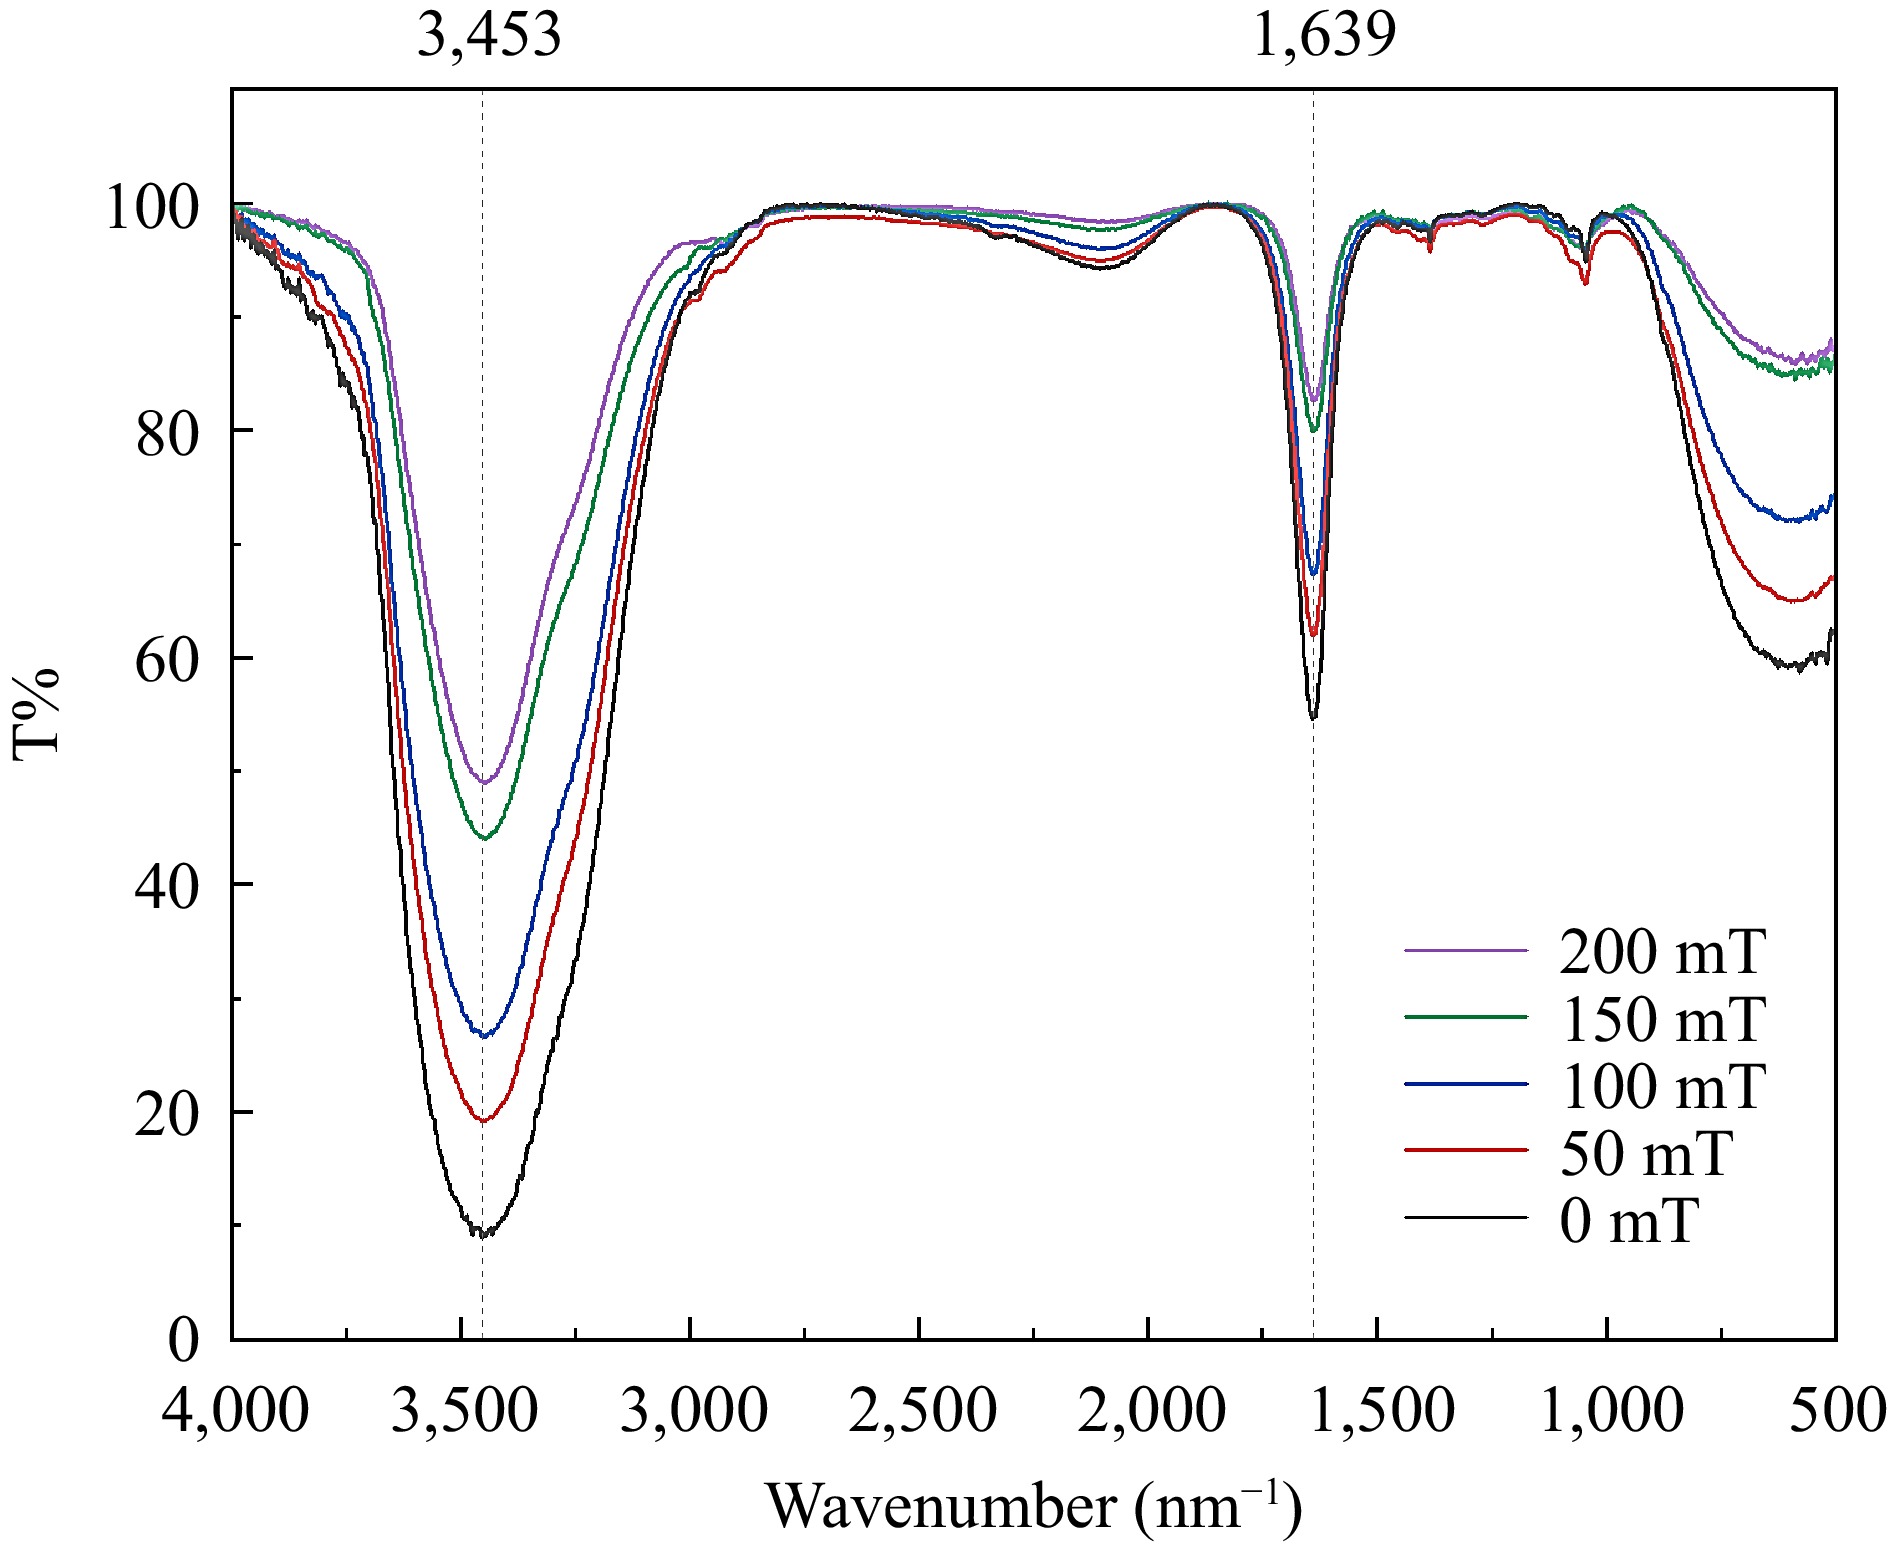
Figure 4.
FTIR of BSA-C3G conjugates under different MF conditions.
-
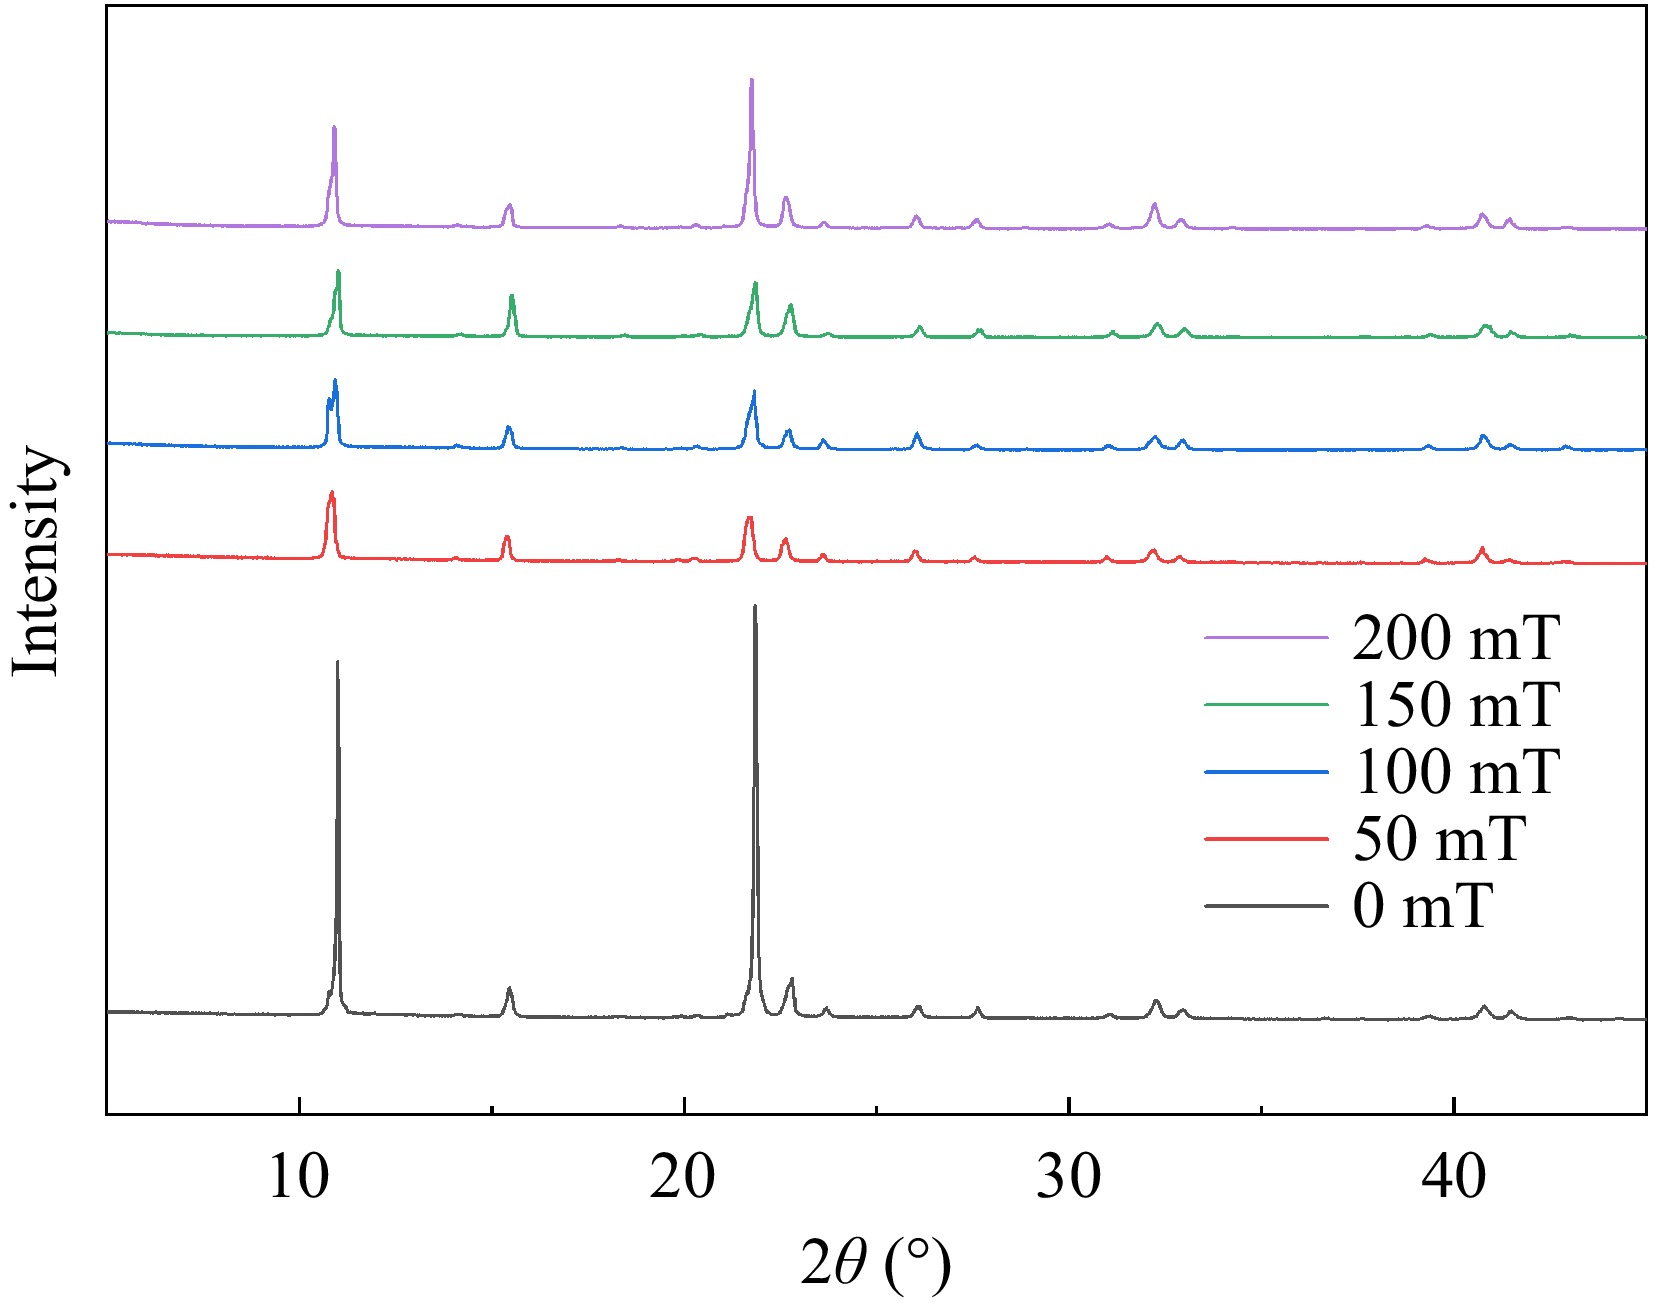
Figure 5.
XRD patterns of BSA-C3G conjugates under different magnetic field conditions.
-
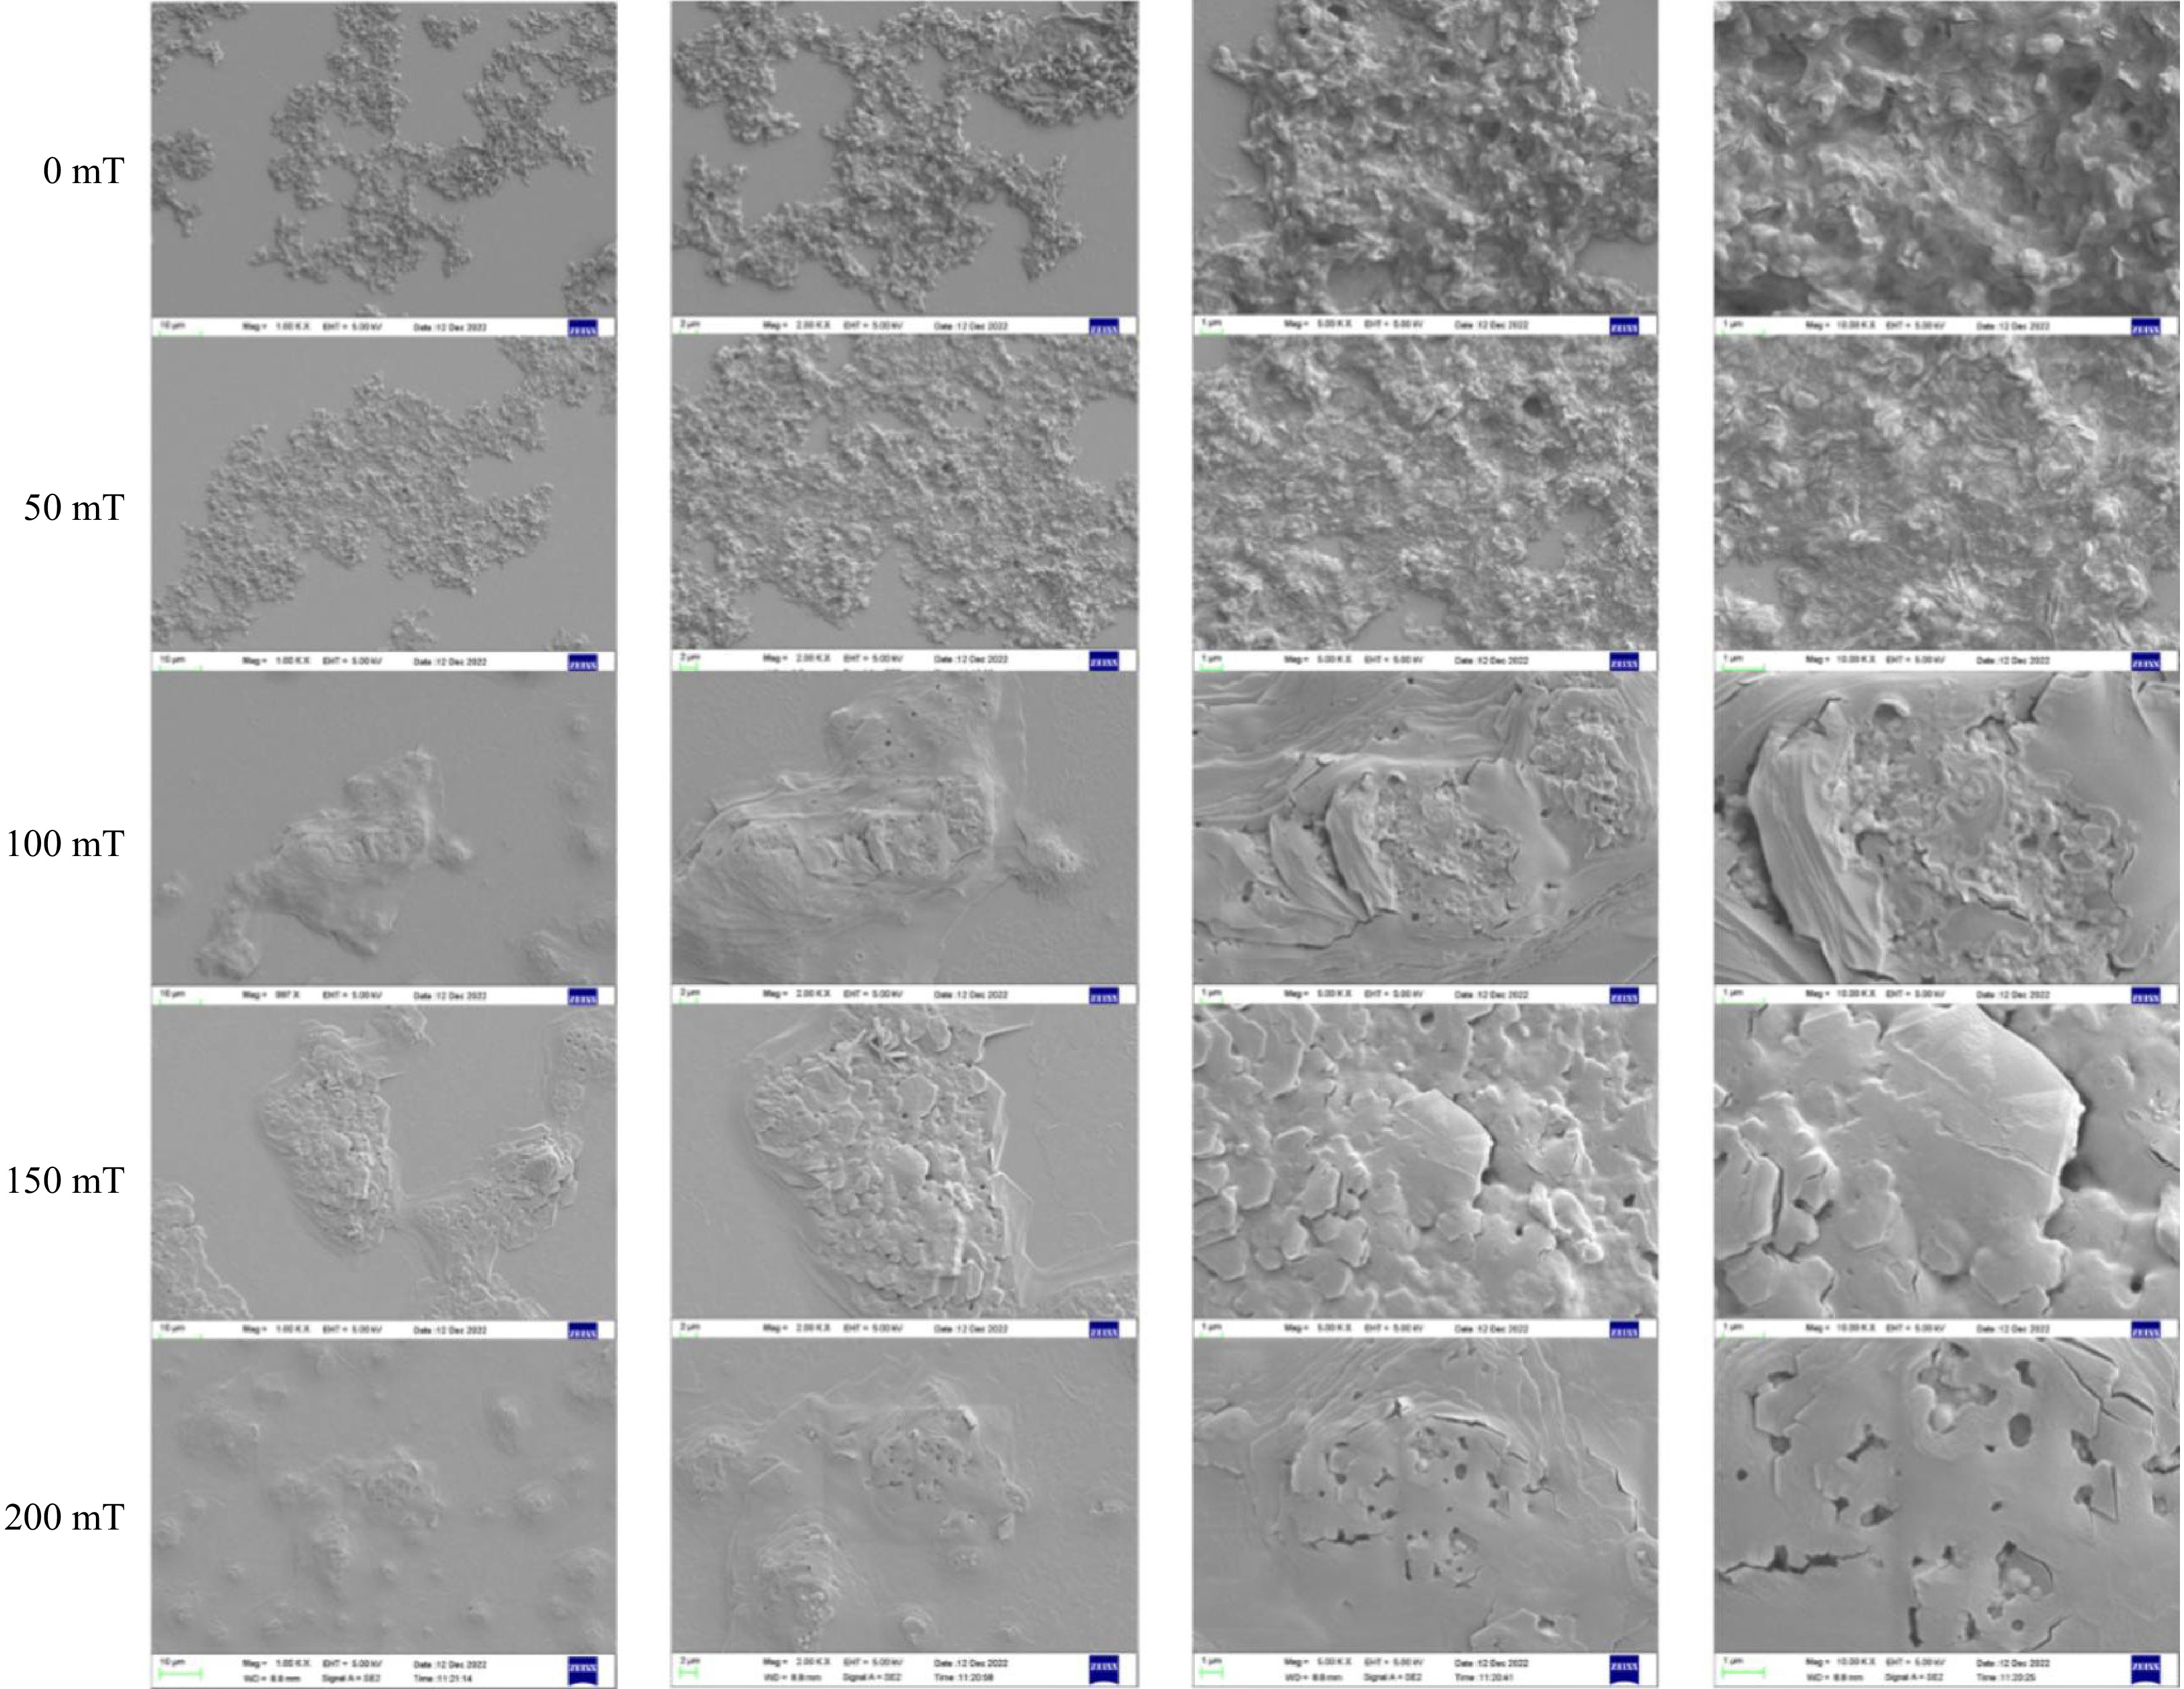
Figure 6.
SEM patterns of BSA-C3G conjugates under different magnetic field conditions.
-
Magnetic intensity α-helix β-sheet β-turn Random coil 0 mT 32.6% 5.5% 22.1% 39.8% 50 mT 29.3% 23.7% 16.9% 30.1% 100 mT 25.0% 30.9% 12.1% 31.9% 150 mT 24.3% 35.8% 10.7% 29.2% 200 mT 23.4% 39.6% 8.4% 28.6% Table 1.
Changes in secondary structure content of BSA-C3G conjugates at different magnetic sensing strengths.
-
Compound Peak position
(2 Theta)FWHM Crystaline
size D (nm)Average D
(nm)0 mT 11.00 0.07 115.30 52.44 15.46 0.20 40.99 21.84 0.11 71.56 22.74 0.25 31.90 23.68 0.19 43.76 27.62 0.15 55.92 32.26 0.24 34.82 32.94 0.20 41.16 40.78 0.23 36.55 50 mT 10.89 0.26 31.14 37.36 21.72 0.27 30.07 23.64 0.16 51.99 26.05 0.18 44.46 31.02 0.20 41.07 32.22 0.30 26.95 32.92 0.20 41.55 40.77 0.27 31.61 100 mT 10.97 0.18 43.81 39.70 15.42 0.16 51.03 21.81 0.23 34.66 22.73 0.24 34.45 27.66 0.19 42.07 31.12 0.19 44.53 32.28 0.26 31.66 32.99 0.23 35.41 150 mT 10.82 0.22 36.57 40.63 15.39 0.17 46.43 20.26 0.17 46.86 21.68 0.23 35.73 22.61 0.21 38.63 25.99 0.18 46.48 30.98 0.18 45.67 32.17 0.25 33.19 40.73 0.23 36.14 200 mT 10.89 0.18 44.21 41.30 21.74 0.15 52.58 26.03 0.20 41.67 32.90 0.24 34.85 40.74 0.26 33.20 Table 2.
Peak position, FWHM, crystaline size, and average size of conjugates.
Figures
(6)
Tables
(2)