ARTICLE   Open Access    

The effect of static magnetic field on inducing the binding of bovine serum albumin and cyanidin-3-O-glucoside

More Information
  • Serum albumin can bind with a diverse range of small molecules. It could therefore serve a protective or carrier function, and effectively address the issue of anthocyanins' susceptibility to decomposition. The anisotropic effect of the magnetic field (MF) can influence their interaction, thereby playing a distinct role in molecular bonding. In this study, bovine serum albumin (BSA) and cyanidin-3-O-glucoside (C3G) were used as raw materials. The mechanism underlying the formation of BSA-C3G complexes induced by static magnetic field (SMF) was investigated through analyses of secondary structure, functional groups, dipole moment, crystal cell dimensions, and microstructural characteristics. BSA and C3G were treated with 50, 100, 150, and 200 mT, respectively. As the magnetic intensity increased, the secondary structure of the complex changed, the α-spiral content, β-corner content, and irregular curl content decreased, while, the β-folding content increased. The average grain size of the BSA-C3G composite was observed to decrease. Furthermore, alterations in the crystal cell dimensions of the BSA-C3G complex were noted, accompanied by a tendency for the microstructure to become more flattened. This study offers valuable insights into the influence of SMF on the assembly behavior and structural characteristics of proteins and anthocyanins.
  • Aquaporin’s (AQPs) are small (21–34 kD) channel-forming, water-transporting trans-membrane proteins which are known as membrane intrinsic proteins (MIPs) conspicuously present across all kingdoms of life. In addition to transporting water, plant AQPs act to transport other small molecules including ammonia, carbon dioxide, glycerol, formamide, hydrogen peroxide, nitric acid, and some metalloids such as boron and silicon from the soil to different parts of the plant[1]. AQPs are typically composed of six or fewer transmembrane helices (TMHs) coupled by five loops (A to E) and cytosolic N- and C-termini, which are highly conserved across taxa[2]. Asparagine-Proline-Alanine (NPA) boxes and makeup helices found in loops B (cytosolic) and E (non-cytosolic) fold back into the protein's core to form one of the pore's two primary constrictions, the NPA region[1]. A second filter zone exists at the pore's non-cytosolic end, where it is called the aromatic/arginine (ar/R) constriction. The substrate selectivity of AQPs is controlled by the amino acid residues of the NPA and ar/R filters as well as other elements of the channel[1].

    To date, the AQP gene families have been extensively explored in the model as well as crop plants[39]. In seed plants, AQP distributed into five subfamilies based on subcellular localization and sequence similarities: the plasma membrane intrinsic proteins (PIPs; subgroups PIP1 and PIP2), the tonoplast intrinsic proteins (TIPs; TIP1-TIP5), the nodulin26-like intrinsic proteins (NIPs; NIP1-NIP5), the small basic intrinsic proteins (SIPs; SIP1-SIP2) and the uncategorized intrinsic proteins (XIPs; XIP1-XIP3)[2,10]. Among them, TIPs and PIPs are the most abundant and play a central role in facilitating water transport. SIPs are mostly found in the endoplasmic reticulum (ER)[11], whereas NIPs homologous to GmNod26 are localized in the peribacteroid membrane[12].

    Several studies reported that the activity of AQPs is regulated by various developmental and environmental factors, through which water fluxes are controlled[13]. AQPs are found in all organs such as leaves, roots, stems, flowers, fruits, and seeds[14,15]. According to earlier studies, increased AQP expression in transgenic plants can improve the plants' tolerance to stresses[16,17]. Increased root water flow caused by upregulation of root aquaporin expression may prevent transpiration[18,19]. Overexpression of Tamarix hispida ThPIP2:5 improved osmotic stress tolerance in Arabidopsis and Tamarix plants[20]. Transgenic tomatoes having apple MdPIP1;3 ectopically expressed produced larger fruit and improved drought tolerance[21]. Plants over-expressing heterologous AQPs, on the other hand, showed negative effects on stress tolerance in many cases. Overexpression of GsTIP2;1 from G. soja in Arabidopsis plants exhibited lower resistance against salt and drought stress[22].

    A few recent studies have started to establish a link between AQPs and nanobiology, a research field that has been accelerating in the past decade due to the recognition that many nano-substances including carbon-based materials are valuable in a wide range of agricultural, industrial, and biomedical activities[23]. Carbon nanotubes (CNTs) were found to improve water absorption and retention and thus enhance seed germination in tomatoes[24,25]. Ali et al.[26] reported that Carbon nanoparticles (CTNs) and osmotic stress utilize separate processes for AQP gating. Despite lacking solid evidence, it is assumed that CNTs regulate the aquaporin (AQPs) in the seed coats[26]. Another highly noticed carbon-nano-molecule, the fullerenes, is a group of allotropic forms of carbon consisting of pure carbon atoms[27]. Fullerenes and their derivatives, in particular the water-soluble fullerols [C60(OH)20], are known to be powerful antioxidants, whose biological activity has been reduced to the accumulation of superoxide and hydroxyl[28,29]. Fullerene/fullerols at low concentrations were reported to enhance seed germination, photosynthesis, root growth, fruit yield, and salt tolerance in various plants such as bitter melon and barley[3032]. In contrast, some studies also reported the phytotoxic effect of fullerene/fullerols[33,34]. It remains unknown if exogenous fullerene/fullerol has any impact on the expression or activity of AQPs in the cell.

    Garden pea (P. sativum) is a cool-season crop grown worldwide; depending on the location, planting may occur from winter until early summer. Drought stress in garden pea mainly affects the flowering and pod filling which harm their yield. In the current study, we performed a genome-wide identification and characterization of the AQP genes in garden pea (P. sativum), the fourth largest legume crop worldwide with a large complex genome (~4.5 Gb) that was recently decoded[35]. In particular, we disclose, for the first time to our best knowledge, that the transcriptional regulations of AQPs by osmotic stress in imbibing pea seeds were altered by fullerol supplement, which provides novel insight into the interaction between plant AQPs, osmotic stress, and the carbon nano-substances.

    The whole-genome sequence of garden pea ('Caméor') was retrieved from the URGI Database (https://urgi.versailles.inra.fr/Species/Pisum). Protein sequences of AQPs from two model crops (Rice and Arabidopsis) and five other legumes (Soybean, Chickpea, Common bean, Medicago, and Peanut) were used to identify homologous AQPs from the garden pea genome (Supplemental Table S1). These protein sequences, built as a local database, were then BLASTp searched against the pea genome with an E-value cutoff of 10−5 and hit a score cutoff of 100 to identify AQP orthologs. The putative AQP sequences of pea were additionally validated to confirm the nature of MIP (Supplemental Table S2) and transmembrane helical domains through TMHMM (www.cbs.dtu.dk/services/TMHMM/).

    Further phylogenetic analysis was performed to categorize the AQPs into subfamilies. The pea AQP amino acid sequences, along with those from Medicago, a cool-season model legume phylogenetically close to pea, were aligned through ClustalW2 software (www.ebi.ac.uk/Tools/msa/clustalw2) to assign protein names. The unaligned AQP sequences to Medicago counterparts were once again aligned with the AQP sequences of Arabidopsis, rice, and soybean. Based on the LG model, unrooted phylogenetic trees were generated via MEGA7 and the neighbor-joining method[36], and the specific name of each AQP gene was assigned based on its position in the phylogenetic tree.

    By using the conserved domain database (CDD, www.ncbi.nlm.nih.gov/Structure/cdd/cdd.shtml), the NPA motifs were identified from the pea AQP protein sequences[37]. The software TMHMM (www.cbs. dtu.dk/services/TMHMM/)[38] was used to identify the protein transmembrane domains. To determine whether there were any alterations or total deletion, the transmembrane domains were carefully examined.

    Basic molecular properties including amino acid composition, relative molecular weight (MW), and instability index were investigated through the online tool ProtParam (https://web.expasy.org/protparam/). The isoelectric points (pI) were estimated by sequence Manipulation Suite version 2 (www.bioinformatics.org/sms2)[39]. The subcellular localization of AQP proteins was predicted using Plant-mPLoc[40] and WoLF PSORT (www.genscript.com/wolf-psort.html)[ 41] algorithms.

    The gene structure (intron-exon organization) of AQPs was examined through GSDS ver 2.0[42]. The chromosomal distribution of the AQP genes was illustrated by the software MapInspect (http://mapinspect.software.informer.com) in the form of a physical map.

    To explore the tissue expression patterns of pea AQP genes, existing NGS data from 18 different libraries covering a wide range of tissue, developmental stage, and growth condition of the variety ‘Caméor’ were downloaded from GenBank (www.ncbi.nlm.nih.gov/bioproject/267198). The expression levels of the AQP genes in each tissue and growth stage/condition were represented by the FPKM (Fragments Per Kilobase of transcript per Million fragments mapped) values. Heatmaps of AQPs gene were generated through Morpheus software (https://software.broadinstitute.org/morpheus/#).

    Different solutions, which were water (W), 0.3 M mannitol (M), and fullerol of different concentrations dissolved in 0.3 M mannitol (MF), were used in this study. MF solutions with the fullerol concentration of 10, 50, 100, and 500 mg/L were denoted as MF1, MF2, MF3, and MF4, respectively. Seeds of 'SQ-1', a Chinese landrace accession of a pea, were germinated in two layers of filter paper with 30 mL of each solution in Petri dishes (12 cm in diameter) each solution, and the visual phenotype and radicle lengths of 150 seeds for each treatment were analyzed 72 h after soaking. The radicle lengths were measured using a ruler. Multiple comparisons for each treatment were performed using the SSR-Test method with the software SPSS 20.0 (IBM SPSS Statistics, Armonk, NY, USA).

    Total RNA was extracted from imbibing embryos after 12 h of seed soaking in the W, M, and MF3 solution, respectively, by using Trizol reagent (Invitrogen, Carlsbad, CA, USA). The quality and quantity of the total RNA were measured through electrophoresis on 1% agarose gel and an Agilent 2100 Bioanalyzer respectively (Agilent Technologies, Santa Rosa, USA). The TruSeq RNA Sample Preparation Kit was utilized to construct an RNA-Seq library from 5 µg of total RNA from each sample according to the manufacturer's instruction (Illumina, San Diego, CA, USA). Next-generation sequencing of nine libraries were performed through Novaseq 6000 platform (Illumina, San Diego, CA, USA).

    First of all, by using SeqPrep (https://github.com/jstjohn/SeqPrep) and Sickle (https://github.com/najoshi/sickle) the raw RNA-Seq reads were filtered and trimmed with default parameters. After filtering, high-quality reads were mapped onto the pea reference genome (https://urgi.versailles.inra.fr/Species/Pisum) by using TopHat (V2.1.0)[43]. Using Cufflinks, the number of mapped reads from each sample was determined and normalised to FPKM for each predicted transcript (v2.2.1). Pairwise comparisons were made between W vs M and W vs M+F treatments. The DEGs with a fold change ≥ 1.5 and false discovery rate (FDR) adjusted p-values ≤ 0.05 were identified by using Cuffdiff[44].

    qPCR was performed by using TOROGGreen® qPCR Master Mix (Toroivd, Shanghai, China) on a qTOWER®3 Real-Time PCR detection system (Analytik Jena, Germany). The reactions were performed at 95 °C for 60 s, followed by 42 cycles of 95 °C for 10 s and 60 °C for 30 s. Quantification of relative expression level was achieved by normalization against the transcripts of the housekeeping genes β-tubulin according to Kreplak et al.[35]. The primer sequences for reference and target genes used are listed in Supplemental Table S3.

    The homology-based analysis identifies 41 putative AQPs in the garden pea genome. Among them, all but two genes (Psat0s3550g0040.1, Psat0s2987g0040.1) encode full-length aquaporin-like sequences (Table 1). The conserved protein domain analysis later validated all of the expected AQPs (Supplemental Table S2). To systematically classify these genes and elucidate their relationship with the AQPs from other plants' a phylogenetic tree was created. It clearly showed that the AQPs from pea and its close relative M. truncatula formed four distinct clusters, which represented the different subfamilies of AQPs i.e. TIPs, PIPs, NIPs, and SIPs (Fig. 1a). However, out of the 41 identified pea AQPs, 4 AQPs couldn't be tightly aligned with the Medicago AQPs and thus were put to a new phylogenetic tree constructed with AQPs from rice, Arabidopsis, and soybean. This additional analysis assigned one of the 4 AQPs to the XIP subfamily and the rest three to the TIP or NIP subfamilies (Fig. 1b). Therefore, it is concluded that the 41 PsAQPs comprise 11 PsTIPs, 15 PsNIPs, 9 PsPIPs, 5 PsSIPs, and 1 PsXIP (Table 2). The PsPIPs formed two major subgroups namely PIP1s and PIP2s, which comprise three and six members, respectively (Table 1). The PsTIPs formed two major subgroups TIPs 1 (PsTIP1-1, PsTIP1-3, PsTIP1-4, PsTIP1-7) and TIPs 2 (PsTIP2-1, PsTIP2-2, PsTIP2-3, PsTIP2-6) each having four members (Table 2). Detailed information such as gene/protein names, accession numbers, the length of deduced polypeptides, and protein structural features are presented in Tables 1 & 2

    Table 1.  Description and distribution of aquaporin genes identified in the garden pea genome.
    Chromosome
    S. NoGene NameGene IDGene length
    (bp)
    LocationStartEndTranscription length (bp)CDS length
    (bp)
    Protein length
    (aa)
    1PsPIP1-1Psat5g128840.32507chr5LG3231,127,859231,130,365675675225
    2PsPIP1-2Psat2g034560.11963chr2LG149,355,95849,357,920870870290
    3PsPIP1-4Psat2g182480.11211chr2LG1421,647,518421,648,728864864288
    4PsPIP2-1Psat6g183960.13314chr6LG2369,699,084369,702,397864864288
    5PsPIP2-2-1Psat4g051960.11223chr4LG486,037,44686,038,668585585195
    6PsPIP2-2-2Psat5g279360.22556chr5LG3543,477,849543,480,4042555789263
    7PsPIP2-3Psat7g228600.22331chr7LG7458,647,213458,649,5432330672224
    8PsPIP2-4Psat3g045080.11786chr3LG5100,017,377100,019,162864864288
    9PsPIP2-5Psat0s3550g0040.11709scaffold0355020,92922,63711911191397
    10PsTIP1-1Psat3g040640.12021chr3LG589,426,47389,428,493753753251
    11PsTIP1-3Psat3g184440.12003chr3LG5393,920,756393,922,758759759253
    12PsTIP1-4Psat7g219600.12083chr7LG7441,691,937441,694,019759759253
    13PsTIP1-7Psat6g236600.11880chr6LG2471,659,417471,661,296762762254
    14PsTIP2-1Psat1g005320.11598chr1LG67,864,8107,866,407750750250
    15PsTIP2-2Psat4g198360.11868chr4LG4407,970,525407,972,392750750250
    16PsTIP2-3Psat1g118120.12665chr1LG6230,725,833230,728,497768768256
    17PsTIP2-6Psat2g177040.11658chr2LG1416,640,482416,642,139750750250
    18PsTIP3-2Psat6g054400.11332chr6LG254,878,00354,879,334780780260
    19PsTIP4-1Psat6g037720.21689chr6LG230,753,62430,755,3121688624208
    20PsTIP5-1Psat7g157600.11695chr7LG7299,716,873299,718,567762762254
    21PsNIP1-1Psat1g195040.21864chr1LG6346,593,853346,595,7161863645215
    22PsNIP1-3Psat1g195800.11200chr1LG6347,120,121347,121,335819819273
    23PsNIP1-5Psat7g067480.12365chr7LG7109,420,633109,422,997828828276
    24PsNIP1-6Psat7g067360.12250chr7LG7109,270,462109,272,711813813271
    25PsNIP1-7Psat1g193240.11452chr1LG6344,622,606344,624,057831831277
    26PsNIP2-1-2Psat3g197520.1669chr3LG5420,092,382420,093,050345345115
    27PsNIP2-2-2Psat3g197560.1716chr3LG5420,103,168420,103,883486486162
    28PsNIP3-1Psat2g072000.11414chr2LG1133,902,470133,903,883798798266
    29PsNIP4-1Psat7g126440.11849chr7LG7209,087,362209,089,210828828276
    30PsNIP4-2Psat5g230920.11436chr5LG3463,340,575463,342,010825825275
    31PsNIP5-1Psat6g190560.11563chr6LG2383,057,323383,058,885867867289
    32PsNIP6-1Psat5g304760.45093chr5LG3573,714,868573,719,9605092486162
    33PsNIP6-2Psat7g036680.12186chr7LG761,445,34161,447,134762762254
    34PsNIP6-3Psat7g259640.12339chr7LG7488,047,315488,049,653918918306
    35PsNIP7-1Psat6g134160.24050chr6LG2260,615,019260,619,06840491509503
    36PsSIP1-1Psat3g091120.13513chr3LG5187,012,329187,015,841738738246
    37PsSIP1-2Psat1g096840.13609chr1LG6167,126,599167,130,207744744248
    38PsSIP1-3Psat7g203280.12069chr7LG7401,302,247401,304,315720720240
    39PsSIP2-1-1Psat0s2987g0040.1706scaffold02987177,538178,243621621207
    40PsSIP2-1-2Psat3g082760.13135chr3LG5173,720,100173,723,234720720240
    41PsXIP2-1Psat7g178080.12077chr7LG7335,167,251335,169,327942942314
    bp: base pair, aa: amino acid.
     | Show Table
    DownLoad: CSV
    Figure 1.  Phylogenetic analysis of the identified AQPs from pea genome. (a) The pea AQPs proteins aligned with those from the cool-season legume Medicago truncatual. (b) The four un-assigned pea AQPs in (a) (denoted as NA) were further aligned with the AQPs of rice, soybean, and Arabidopsis by using the Clustal W program implemented in MEGA 7 software. The nomenclature of PsAQPs was based on homology with the identified aquaporins that were clustered together.
    Table 2.  Protein information, conserved amino acid residues, trans-membrane domains, selectivity filter, and predicted subcellular localization of the 39 full-length pea aquaporins.
    S. NoAQPsGeneLengthTMHNPANPAar/R selectivity filterpIWoLF PSORTPlant-mPLoc
    LBLEH2H5LE1LE2
    Plasma membrane intrinsic proteins (PIPs)
    1PsPIP1-1Psat5g128840.32254NPA0F0008.11PlasPlas
    2PsPIP1-2Psat2g034560.12902NPANPAFHTR9.31PlasPlas
    3PsPIP1-4Psat2g182480.12886NPANPAFHTR9.29PlasPlas
    4PsPIP2-1Psat6g183960.12886NPANPAFHT08.74PlasPlas
    5PsPIP2-2-1Psat4g051960.1195300FHTR8.88PlasPlas
    6PsPIP2-2-2Psat5g279360.22635NPANPAFHTR5.71PlasPlas
    7PsPIP2-3Psat7g228600.22244NPA0FF006.92PlasPlas
    8PsPIP2-4Psat3g045080.12886NPANPAFHTR8.29PlasPlas
    Tonoplast intrinsic proteins (TIPs)
    1PsTIP1-1Psat3g040640.12517NPANPAHIAV6.34PlasVacu
    2PsTIP1-3Psat3g184440.12536NPANPAHIAV5.02Plas/VacuVacu
    3PsTIP1-4Psat7g219600.12537NPANPAHIAV4.72VacuVacu
    4PsTIP1-7Psat6g236600.12546NPANPAHIAV5.48Plas/VacuVacu
    5PsTIP2-1Psat1g005320.12506NPANPAHIGR8.08VacuVacu
    6PsTIP2-2Psat4g198360.12506NPANPAHIGR5.94Plas/VacuVacu
    7PsTIP2-3Psat1g118120.12566NPANPAHIAL6.86Plas/VacuVacu
    8PsTIP2-6Psat2g177040.12506NPANPAHIGR4.93VacuVacu
    9PsTIP3-2Psat6g054400.12606NPANPAHIAR7.27Plas/VacuVacu
    10PsTIP4-1Psat6g037720.22086NPANPAHIAR6.29Vac/ plasVacu
    11PsTIP5-1Psat7g157600.12547NPANPANVGC8.2Vacu /plasVacu/Plas
    Nodulin-26 like intrisic proteins (NIPs)
    1PsNIP1-1Psat1g195040.22155NPA0WVF06.71PlasPlas
    2PsNIP1-3Psat1g195800.12735NPANPVWVAR6.77PlasPlas
    3PsNIP1-5Psat7g067480.12766NPANPVWVAN8.98PlasPlas
    4PsNIP1-6Psat7g067360.12716NPANPAWVAR8.65Plas/VacuPlas
    5PsNIP1-7Psat1g193240.12776NPANPAWIAR6.5Plas/VacuPlas
    6PsNIP2-1-2Psat3g197520.11152NPAOG0009.64PlasPlas
    7PsNIP2-2-2Psat3g197560.116230NPA0SGR6.51PlasPlas
    8PsNIP3-1Psat2g072000.12665NPANPASIAR8.59Plas/VacuPlas
    9PsNIP4-1Psat7g126440.12766NPANPAWVAR6.67PlasPlas
    10PsNIP4-2Psat5g230920.12756NPANPAWLAR7.01PlasPlas
    11PsNIP5-1Psat6g190560.12895NPSNPVAIGR7.1PlasPlas
    12PsNIP6-1Psat5g304760.41622NPA0I0009.03PlasPlas
    13PsNIP6-2Psat7g036680.1254000G0005.27ChloPlas/Nucl
    14PsNIP6-3Psat7g259640.13066NPANPVTIGR8.32PlasPlas
    15PsNIP7-1Psat6g134160.25030NLK0WGQR8.5VacuChlo/Nucl
    Small basic intrinsic proteins (SIPs)
    1PsSIP1-1Psat3g091120.12466NPTNPAVLPN9.54PlasPlas/Vacu
    2PsSIP1-2Psat1g096840.12485NTPNPAIVPL9.24VacuPlas/Vacu
    3PsSIP1-3Psat7g203280.12406NPSNPANLPN10.32ChloPlas
    4PsSIP2-1-2Psat3g082760.12404NPLNPAYLGS10.28PlasPlas
    Uncharacterized X intrinsic proteins (XIPs)
    1PsXIP2-1Psat7g178080.13146SPVNPAVVRM7.89PlasPlas
    Length: protein length (aa); pI: Isoelectric point; Trans-membrane helicase (TMH) represents for the numbers of Trans-membrane helices predicted by TMHMM Server v.2.0 tool; WoLF PSORT and Plant-mPLoc: best possible cellualr localization predicted by the WoLF PSORT and Plant-mPLoc tool, respectively (Chlo Chloroplast, Plas Plasma membrane, Vacu Vacuolar membrane, Nucl Nucleus); LB: Loop B, L: Loop E; NPA: Asparagine-Proline-Alanine; H2 represents for Helix 2, H5 represents for Helix 5, LE1 represents for Loop E1, LE2 represents for Loop E2, Ar/R represents for Aromatic/Arginine.
     | Show Table
    DownLoad: CSV

    To understand the genome distribution of the 41 PsAQPs, we mapped these genes onto the seven chromosomes of a pea to retrieve their physical locations (Fig. 2). The greatest number (10) of AQPs were found on chromosome 7, whereas the least (2) on chromosome 4 (Fig. 2 and Table 1). Chromosomes 1 and 6 each contain six aquaporin genes, whereas chromosomes 2, 3, and 5 carry four, seven, and four aquaporin genes, respectively (Fig. 2). The trend of clustered distribution of AQPs was seen on specific chromosomes, particularly near the end of chromosome 7.

    Figure 2.  Chromosomal localization of the 41 PsAQPs on the seven chromosomes of pea. Chr1-7 represents the chromosomes 1 to 7. The numbers on the right of each chromosome show the physical map positions of the AQP genes (Mbp). Blue, green, orange, brown, and black colors represent TIPs, NIPs, PIPs, SIPs, and XIP, respectively.

    The 39 full-length PsAQP proteins have a length of amino acid ranging from 115 to 503 (Table 1) and Isoelectric point (pI) values ranging from 4.72 to 10.35 (Table 2). As a structural signature, transmembrane domains were predicted to exist in all PsAQPs, with the number in individual AQPs varying from 2 to 6. By subfamilies, TIPs harbor the greatest number of TM domains in total, followed by PIPs, NIPs, SIPs, and XIP (Table 2). Exon-intron structure analysis showed that most PsAQPs (16/39) having two introns, while ten members had three, seven members had four, and five members had only one intron (Fig. 3). Overall, PsAQPs exhibited a complex structure with varying intron numbers, positions, and lengths.

    Figure 3.  The exon-intron structures of the AQP genes in pea. Upstream/downstream region, exon, and intron are represented by a blue box, yellow box, and grey line, respectively.

    As aforementioned, generally highly conserved two NPA motifs generate an electrostatic repulsion of protons in AQPs to form the water channel, which is essential for the transport of substrate molecules[15]. In order to comprehend the potential physiological function and substrate specificity of pea aquaporins, NPA motifs (LB, LE) and residues at the ar/R selectivity filter (H2, H5, LE1, and LE2) were examined. (Table 2). We found that all PsTIPs and most PsPIPs had two conserved NPA motifs except for PsPIP1-1, PsPIP2-2-1, and PsPIP2-3, each having a single NPA motif. Among PsNIPs, PsNIP1-6, PsNIP1-6, PsNIP1-7, PsNIP3-1, PsNIP4-1 and PSNIP4-2 had two NPA domains, while PsNIP1-1, PsNIP2-1-2, PsNIP2-2-2 and PsNIP6-1 each had a single NPA motif. In the PsNIP sub-family, the first NPA motif showed an Alanine (A) to Valine (V) substitution in three PsNIPs (PsNIP1-3, PsNIP1-5, and PsNIP6-3) (Table 2). Furthermore, the NPA domains of all members of the XIP and SIP subfamilies were different. The second NPA motif was conserved in PsSIP aquaporins, however, all of the first NPA motifs had Alanine (A) replaced by Leucine (L) (PsSIP2-1-1, PsSIP2-1-2) or Threonine (T) (PsSIP1-1). In comparison to other subfamilies, this motif variation distinguishes water and solute-transporting aquaporins[45].

    Compared to NPA motifs, the ar/R positions were more variable and the amino acid composition appeared to be subfamily-dependent. The majority of PsPIPs had phenylalanine at H2, histidine at H5, threonine at LE1, and arginine at LE2 selective filter (Table 2). All of the PsTIP1 members had a Histidine-Isoleucine-Alanine-Valine structure at this position, while all PsTIP2 members but PsTIP2-3 harbored Histidine-Isoleucine-Glycine-Arginine. Similarly, PsNIPs, PsSIPs and PsXIP also showed subgroup-specific variation in ar/R selectivity filter (Table 2). Each of these substitutions partly determines the function of transporting water[46].

    Sequence-based subcellular localization analysis using WoLF PSORT predicted that all PsPIPs localized in the plasma membrane, which is consistent with their subfamily classification (Table 2). Around half (5/11) of the PsTIPs (PsTIP1-4, PsTIP2-1, PsTIP2-6, PsTIP4-1, and PsTIP5-1) were predicted to localize within vacuoles. However, several TIP members (PsTIP1-1, PsTIP1-3, PsTIP1-7, PsTIP2-2, PsTIP2-3 and PsTIP3-2) were predicted to localize in plasma membranes. We then further investigated their localizations by using another software (Plant-mPLoc, Table 2), which predicted that all the PsTIPs localize within vacuoles, thus supporting that they are tonoplast related. An overwhelming majority of PsNIPs (14/15) and PsXIP were predicted to be found only in plasma membranes., which was also expected (Table 2). Collectively, the versatility in subcellular localization of the pea AQPs is implicative of their distinct roles in controlling water and/or solute transport in the context of plant cell compartmentation.

    Tissue expression patterns of genes are indicative of their functions. Since there were rich resources of RNA-Seq data from various types of pea tissues in the public database, they were used for the extraction of expression information of PsAQP genes as represented by FPKM values. A heat map was generated to show the expression patterns of PsAQP genes in 18 different tissues/stages and their responses to nitrate levels (Fig. 4). According to the heat map, PsPIP1-2, PsPIP2-3 were highly expressed in root and nodule G (Low-nitrate), whereas PsTIP1-4, PsTIP2-6, and PsNIP1-7 were only expressed in roots in comparison to other tissues. The result also demonstrated that PsPIP1-1 and PsNIP3-1 expressed more abundantly in leaf, tendril, and peduncle, whereas PsPIP2-2-2 and PsTIP1-1 showed high to moderate expressions in all the samples except for a few. Interestingly, PsTIP1-1 expression in many green tissues seemed to be oppressed by low-nitrate. In contrast, some AQPs such as PsTIP1-3, PsTIP1-7, PsTIP5-1, PsNIP1-5, PsNIP4-1, PsNIP5-1, and PsSIP2-1-1 showed higher expression only in the flower tissue. There were interesting developmental stage-dependent regulations of some AQPs in seeds (Fig. 4). For example, PsPIP2-1, PsPIP2-2-1, PsNIP1-6, PsSIP1-1, and PsSIP1-2 were more abundantly expressed in the Seed_12 dap (days after pollination;) tissue than in the Seed_5 dai (days after imbibition) tissue; reversely, PsPIP2-2-2, PsPIP2-4, PsTIP2-3, and PsTIP3-2 showed higher expression in seed_5 dai in compare to seed_12 dap tissues (Fig. 4). The AQP genes may have particular functional roles in the growth and development of the pea based on their tissue-specific expression.

    Figure 4.  Heatmap analysis of the expression of pea AQP gene expressions in different tissues using RNA-seq data (PRJNA267198). Normalized expression of aquaporins in terms of reads per kilobase of transcript per million mapped reads (RPKM) showing higher levels of PIPs, NIPs, TIPs SIPs, and XIP expression across the different tissues analyzed. (Stage A represents 7-8 nodes; stage B represents the start of flowering; stage D represents germination, 5 d after imbibition; stage E represents 12 d after pollination; stage F represents 8 d after sowing; stage G represents 18 d after sowing, LN: Low-nitrate; HN: High-nitrate.

    Expressions of plant AQPs in vegetative tissues under normal and stressed conditions have been extensively studied[15]; however, little is known about the transcriptional regulation of AQP genes in seeds/embryos. To provide insights into this specific area, wet-bench RNA-Seq was performed on the germinating embryo samples isolated from water (W)-imbibed seeds and those treated with mannitol (M, an osmotic reagent), mannitol, and mannitol plus fullerol (F, a nano-antioxidant). The phenotypic evaluation showed that M treatment had a substantial inhibitory effect on radicle growth, whereas the supplement of F significantly mitigated this inhibition at all concentrations, in particular, 100 mg/mL in MF3, which increased the radicle length by ~33% as compared to that under solely M treatment (Fig. 5). The expression values of PsAQP genes were removed from the RNA-Seq data, and pairwise comparisons were made within the Group 1: W vs M, and Group 2: W vs MF3, where a total of ten and nince AQPs were identified as differentially expressed genes (DEGs), respectively (Fig. 6). In Group 1, six DEGs were up-regulated and four DEGs down-regulated, whereas in Group 2, six DEGs were up-regulated and three DEGs down-regulated. Four genes viz. PsPIPs2-5, PsNIP6-3, PsTIP2-3, and PsTIP3-2 were found to be similarly regulated by M or MF3 treatment (Fig. 6), indicating that their regulation by osmotic stress couldn't be mitigated by fullerol. Three genes, all being PsNIPs (1-1, 2-1-2, and 4-2), were up-regulated only under mannitol treatment without fullerol, suggesting that their perturbations by osmotic stress were migrated by the antioxidant activities. In contrast, four other genes namely PsTIP2-2, PsTIP4-1, PsNIP1-5, and PsSIP1-3 were only regulated under mannitol treatment when fullerol was present.

    Figure 5.  The visual phenotype and radicle length of pea seeds treated with water (W), 0.3 M mannitol (M), and fullerol of different concentrations dissolved in 0.3 M mannitol (MF). MF1, MF2, MF3, and MF4 indicated fullerol dissolved in 0.3 M mannitol at the concentration of 10, 50, 100, and 500 mg/L, respectively. (a) One hundred and fifty grains of pea seeds each were used for phenotype analysis at 72 h after treatment. Radicle lengths were measured using a ruler in three replicates R1, R2, and R3 in all the treatments. (b) Multiple comparison results determined using the SSR-Test method were shown with lowercase letters to indicate statistical significance (P < 0.05).
    Figure 6.  Venn diagram showing the shared and unique differentially expressed PsAQP genes in imbibing seeds under control (W), Mannitol (M) and Mannitol + Fullerol (MF3) treatments. Up-regulation (UG): PsPIP2-5, PsNIP1-1, PsNIP2-1-2, PsNIP4-2, PsNIP6-3, PsNIP1-5, PsTIP2-2, PsTIP4-1, PsSIP1-3, PsXIP2-1; Down-regulation (DG): PsTIP2-3, PsTIP3-2, PsNIP1-7, PsNIP5-1, PsXIP2-1.

    As a validation of the RNA-Seq data, eight genes showing differential expressions in imbibing seeds under M or M + F treatments were selected for qRT-PCR analysis, which was PsTIP4-1, PsTIP2-2, PsTIP2-3, PsTIP3-2, PsPIP2-5, PsXIP2-1, PsNIP6-3 and PsNIP1-5 shown in Fig 6, the expression modes of all the selected genes but PsXIP2-1 were well consistent between the RNA-Seq and the qRT-PCR data. PsXIP2-1, exhibiting slightly decreased expression under M treatment according to RNA-Seq, was found to be up-regulated under the same treatment by qRT-PCR (Fig. 7). This gene was therefore removed from further discussions.

    Figure 7.  The expression patterns of seven PsAQPs in imbibing seeds as revealed by RNA-Seq and qRT-PCR. The seeds were sampled after 12 h soaking in three different solutions, namely water (W), 0.3 M mannitol (M), and 100 mg/L fullerol dissolved in 0.3 M mannitol (MF3) solution. Error bars are standard errors calculated from three replicates.

    This study used the recently available garden pea genome to perform genome-wide identification of AQPs[35] to help understand their functions in plant growth and development. A total of 39 putative full-length AQPs were found in the garden pea genome, which is very similar to the number of AQPs identified in many other diploid legume crops such as 40 AQPs genes in pigeon pea, chickpea, common bean[7,47,48], and 44 AQPs in Medicago[49]. On the other hand, the number of AQP genes in pea is greater compared to diploid species like rice (34)[4], Arabidopsis thaliana (35)[3], and 32 and 36 in peanut A and B genomes, respectively[8]. Phylogenetic analysis assigned the pea AQPs into all five subfamilies known in plants, whereas the presence of only one XIP in this species seems less than the number in other diploid legumes which have two each in common bean and Medicago[5,48,49]. The functions of the XIP-type AQP will be of particular interest to explore in the future.

    The observed exon-intron structures in pea AQPs were found to be conserved and their phylogenetic distribution often correlated with these structures. Similar exon-intron patterns were seen in PIPs and TIPs subfamily of Arabidopsis, soybean, and tomato[3,6,50]. The two conserved NPA motifs and the four amino acids forming the ar/R SF mostly regulate solute specificity and transport of the substrate across AQPs[47,51]. According to our analysis, all the members of each AQP subfamilies in garden pea showed mostly conserved NPA motifs and a similar ar/R selective filter. Interestingly, most PsPIPs carry double NPA in LB and LE and a hydrophilic ar/R SF (F/H/T/R) as observed in three legumes i.e., common bean[48], soybean[5] chickpea[7], showing their affinity for water transport. All the TIPs of garden pea have double NPA in LB and LE and wide variation at selectivity filters. Most PsTIP1s (1-1, 1-3, 1-4, and 1-7) were found with H-I-A-V ar/R selectivity filter similar to other species such as Medicago, Arachis, and common bean, that are reported to transport water and other small molecules like boron, hydrogen peroxide, urea, and ammonia[52]. Compared with related species, the TIPs residues in the ar/R selectivity filter were very similar to those in common bean[48], Medicago[49], and Arachis[8]. In the present study, the NIPs, NIP1s (1-3, 1-5, 1-6, and1-7), and NIP2-2-2 genes have G-S-G-R selectivity. Interestingly, NIP2s with a G-S-G-R selectivity filter plays an important role in silicon influx (Si) in many plant species such as Soybean and Arachis[6,8]. It was reported that Si accumulation protects plants against various types of biotic and abiotic stresses[53].

    The subcellular localization investigation suggested that most of the PsAQPs were localized to the plasma membrane or vacuolar membrane. The members of the PsPIPs, PsNIPs, and PsXIP subfamilies were mostly located in the plasma membrane, whereas members of the PsTIPs subfamily were often predicted to localize in the vacuolar membrane. Similar situations were reported in many other legumes such as common bean, soybean, and chickpea[5,7,48]. Apart from that, PsSIPs subfamily were predicted to localize to the plasma membrane or vacuolar membrane, and some AQPs were likely to localize in broader subcellular positions such as the nucleus, cytosol, and chloroplast, which indicates that AQPs may be involved in various molecular transport functions.

    AQPs have versatile physiological functions in various plant organs. Analysis of RNA-Seq data showed a moderate to high expression of the PsPIPs in either root or green tissues except for PsPIP2-4, indicating their affinity to water transport. In several other species such as Arachis[8], common bean[48], and Medicago[49], PIPs also were reported to show high expressions and were considered to play an important role to maintain root and leaf hydraulics. Also interestingly, PsTIP2-3 and PsTIP3-2 showed high expressions exclusively in seeds at 5 d after imbibition, indicating their specific roles in seed germination. Earlier, a similar expression pattern for TIP3s was reported in Arabidopsis during the initial phase of seed germination and seed maturation[54], soybean[6], canola[55], and Medicago[49], suggesting that the main role of TIP3s in regulating seed development is conserved across species.

    Carbon nanoparticles such as fullerol have a wide range of potential applications as well as safety concerns in agriculture. Fullerol has been linked to plant protection from oxidative stress by influencing ROS accumulation and activating the antioxidant system in response to drought[56]. The current study revealed that fullerol at an adequate concentration (100 mg/L), had favorable effects on osmotic stress alleviation. In this study, the radical growth of germinating seeds was repressed by the mannitol treatment, and many similar observations have been found in previous studies[57]. Furthermore, mannitol induces ROS accumulation in plants, causing oxidative stress[58]. Our work further validated that the radical growth of germinating seeds were increased during fullerol treatment. Fullerol increased the length of roots and barley seeds, according to Panova et al.[32]. Fullerol resulted in ROS detoxification in seedlings subjected to water stress[32].

    Through transcriptomic profiling and qRT-PCR, several PsAQPs that responded to osmotic stress by mannitol and a combination of mannitol and fullerol were identified. Most of these differentially expressed AQPs belonged to the TIP and NIP subfamilies. (PsTIP2-2, PsTIP2-3, and PsTIP 3-2) showed higher expression by mannitol treatment, which is consistent with the fact that many TIPs in other species such as GmTIP2;3 and Eucalyptus grandis TIP2 (EgTIP2) also showed elevated expressions under osmotic stress[54,59]. The maturation of the vacuolar apparatus is known to be aided by the TIPs, which also enable the best possible water absorption throughout the growth of embryos and the germination of seeds[60]. Here, the higher expression of PsTIP (2-2, 2-3, and 3-2) might help combat water deficiency in imbibing seeds due to osmotic stress. The cellular signals triggering such transcriptional regulation seem to be independent of the antioxidant system because the addition of fullerol didn’t remove such regulation. On the other hand, the mannitol-induced regulation of most PsNIPs were eliminated when fullerol was added, suggesting either a response of these NIPs to the antioxidant signals or being due to the mitigated cellular stress. Based on our experimental data and previous knowledge, we propose that the fullerol-induced up- or down-regulation of specific AQPs belonging to different subfamilies and locating in different subcellular compartments, work coordinatedly with each other, to maintain the water balance and strengthen the tolerance to osmotic stress in germinating pea seeds through reduction of ROS accumulation and enhancement of antioxidant enzyme levels. Uncategorized X intrinsic proteins (XIPs) Aquaporins are multifunctional channels that are accessible to water, metalloids, and ROS.[32,56]. Due likely to PCR bias, the expression data of PsXIP2-1 from qRT-PCR and RNA-Seq analyses didn’t match well, hampering the drawing of a solid conclusion about this gene. Further studies are required to verify and more deeply dissect the functions of each of these PsAQPs in osmotic stress tolerance.

    A total of 39 full-length AQP genes belonging to five sub-families were identified from the pea genome and characterized for their sequences, phylogenetic relationships, gene structures, subcellular localization, and expression profiles. The number of AQP genes in pea is similar to that in related diploid legume species. The RNA-seq data revealed that PsTIP (2-3, 3-2) showed high expression in seeds for 5 d after imbibition, indicating their possible role during the initial phase of seed germination. Furthermore, gene expression profiles displayed that higher expression of PsTIP (2-3, 3-2) in germinating seeds might help maintain water balance under osmotic stress to confer tolerance. Our results suggests that the biological functions of fullerol in plant cells are exerted partly through the interaction with AQPs.

    Under Bio project ID PRJNA793376 at the National Center for Biotechnology Information, raw data of sequencing read has been submitted. The accession numbers for the RNA-seq raw data are stored in GenBank and are mentioned in Supplemental Table S4.

    This study is supported by the National Key Research & Development Program of China (2022YFE0198000) and the Key Research Program of Zhejiang Province (2021C02041).

  • Pei Xu is the Editorial Board member of journal Vegetable Research. He was blinded from reviewing or making decisions on the manuscript. The article was subject to the journal's standard procedures, with peer-review handled independently of this Editorial Board member and his research group.

  • [1]

    Pereira-Caro G, Watanabe S, Crozier A, Fujimura T, Yokota T, et al. 2013. Phytochemical profile of a Japanese black–purple rice. Food Chemistry 141:2821−27

    doi: 10.1016/j.foodchem.2013.05.100

    CrossRef   Google Scholar

    [2]

    Zheng Y, Tian J, Kong X, Wu D, Chen S, et al. 2021. Proanthocyanidins from Chinese berry leaves modified the physicochemical properties and digestive characteristic of rice starch. Food Chemistry 335:127666

    doi: 10.1016/j.foodchem.2020.127666

    CrossRef   Google Scholar

    [3]

    Gonçalves AC, Nunes AR, Falcão A, Alves G, Silva LR. 2021. Dietary effects of anthocyanins in human health: a comprehensive review. Pharmaceuticals 14:690

    doi: 10.3390/ph14070690

    CrossRef   Google Scholar

    [4]

    Zhong Y, He F, Wang M, Zhang Y, Lan H, et al. 2023. Effects of stabilization combined with fermentation treatments on the volatile composition and flavor profile of cooked black rice. Food Bioscience 56:103377

    doi: 10.1016/j.fbio.2023.103377

    CrossRef   Google Scholar

    [5]

    Pang Y, Ahmed S, Xu Y, Beta T, Zhu Z, et al. 2018. Bound phenolic compounds and antioxidant properties of whole grain and bran of white, red and black rice. Food Chemistry 240:212−21

    doi: 10.1016/j.foodchem.2017.07.095

    CrossRef   Google Scholar

    [6]

    Zhang M, Zhou N, Zhao L, Zhao L. 2024. Black rice anthocyanins nanoparticles based on bovine serum albumin and hyaluronic acid: Preparation, characterization, absorption and intestinal barrier function protection in Caco-2 monolayers. International Journal of Biological Macromolecules 267:131325

    doi: 10.1016/j.ijbiomac.2024.131325

    CrossRef   Google Scholar

    [7]

    Tang R, He Y, Fan K. 2023. Recent advances in stability improvement of anthocyanins by efficient methods and its application in food intelligent packaging: A review. Food Bioscience 56:103164

    doi: 10.1016/j.fbio.2023.103164

    CrossRef   Google Scholar

    [8]

    Chen J, Fang W, Liu W, Liu J, Gong P. 2023. Microcapsules and nanoliposomes based strategies to improve the stability of blueberry anthocyanins. Molecules 28:7344

    doi: 10.3390/molecules28217344

    CrossRef   Google Scholar

    [9]

    Chi JP, Ge J, Yue X, Liang J, Sun Y, et al. 2019. Preparation of nanoliposomal carriers to improve the stability of anthocyanins. LWT 109:101−7

    doi: 10.1016/j.lwt.2019.03.070

    CrossRef   Google Scholar

    [10]

    Cheng Y, Liu J, Li L, Ren J, Lu J, et al. 2023. Advances in embedding techniques of anthocyanins: improving stability, bioactivity and bioavailability. Food Chemistry: X 20:100983

    doi: 10.1016/j.fochx.2023.100983

    CrossRef   Google Scholar

    [11]

    Wu H, Oliveira G, Lila MA. 2023. Protein-binding approaches for improving bioaccessibility and bioavailability of anthocyanins. Comprehensive Reviews in Food Science and Food Safety 22:333−54

    doi: 10.1111/1541-4337.13070

    CrossRef   Google Scholar

    [12]

    Khalifa I, Lorenzo JM, Bangar SP, Morsy OM, Nawaz A, et al. 2022. Effect of the non-covalent and covalent interactions between proteins and mono- or di-glucoside anthocyanins on β-lactoglobulin-digestibility. Food Hydrocolloids 133:107952

    doi: 10.1016/j.foodhyd.2022.107952

    CrossRef   Google Scholar

    [13]

    Wang Y, Zhang J, Zhang L. 2022. Study on the mechanism of non-covalent interaction between rose anthocyanin extracts and whey protein isolate under different pH conditions. Food Chemistry 384:132492

    doi: 10.1016/j.foodchem.2022.132492

    CrossRef   Google Scholar

    [14]

    Wang Y, Yang C, Zhang J, Zhang L. 2023. Interaction of preheated whey protein isolate with rose anthocyanin extracts in beverage model system: Influence on color stability, astringency and mechanism. Food Chemistry 412:135507

    doi: 10.1016/j.foodchem.2023.135507

    CrossRef   Google Scholar

    [15]

    Xu X, Hu J, Xue H, Hu Y, Liu Y, et al. 2023. Applications of human and bovine serum albumins in biomedical engineering: A review. International Journal of Biological Macromolecules 253:126914

    doi: 10.1016/j.ijbiomac.2023.126914

    CrossRef   Google Scholar

    [16]

    Spada A, Emami J, Tuszynski JA, Lavasanifar A. 2021. The Uniqueness of Albumin as a Carrier in Nanodrug Delivery. Molecular Pharmaceutics 18:1862−94

    doi: 10.1021/acs.molpharmaceut.1c00046

    CrossRef   Google Scholar

    [17]

    Hunt RW, Zavalin A, Bhatnagar A, Chinnasamy S, Das KC. 2009. Electromagnetic Biostimulation of Living Cultures for Biotechnology, Biofuel and Bioenergy Applications. International Journal of Molecular Sciences 10:4515−58

    doi: 10.3390/ijms10104515

    CrossRef   Google Scholar

    [18]

    Raja SO, Dasgupta AK. 2012. Magnetic field induced self assembly and optical memory of pi-ring containing fluorophores. Chemical Physics Letters 554:163−67

    doi: 10.1016/j.cplett.2012.10.040

    CrossRef   Google Scholar

    [19]

    Zhang J, Wang S, Xu B, Gao M. 2012. Effect of alternating magnetic field treatments on enzymatic parameters of cellulase. Journal of the Science of Food and Agriculture 92:1384−88

    doi: 10.1002/jsfa.4711

    CrossRef   Google Scholar

    [20]

    Silva FL, Zin G, Rezzadori K, Longo LC, Tiggemann L, et al. 2019. Changes in the physico-chemical characteristics of a protein solution in the presence of magnetic field and the consequences on the ultrafiltration performance. Journal of Food Engineering 242:84−93

    doi: 10.1016/j.jfoodeng.2018.08.016

    CrossRef   Google Scholar

    [21]

    Garrido L. 2010. Magnetic Orientation of Diamagnetic Amorphous Polymers. Journal of Polymer Science Part B-Polymer Physics 48:1009−15

    doi: 10.1002/polb.21989

    CrossRef   Google Scholar

    [22]

    Nita LE, Chiriac AP, Bercea M, Neamtu I. 2012. The magnetic field effect during preparation of an interpenetrated hybrid polymeric composite. Polymer Composites 33:1816−23

    doi: 10.1002/pc.22322

    CrossRef   Google Scholar

    [23]

    Behera PC, Rangra NK, Kant K, Ghosh M. 2016. Molecular docking analysis of Aerva lanata phyto constituents as lead for microbial inhibitors. 20 th international electronic conference on synthetic organic chemistry, Basel, Switzerland. MDPI, Basel, Switzerland. pp. 1−14.

    [24]

    Dias R, de Azevedo WF. 2008. Molecular Docking Algorithms. Current Drug Targets 9:1040−47

    doi: 10.2174/138945008786949432

    CrossRef   Google Scholar

    [25]

    Hurtado NH, Morales AL, González-Miret ML, Escudero-Gilete ML, Heredia FJ. 2009. Colour, pH stability and antioxidant activity of anthocyanin rutinosides isolated from tamarillo fruit (Solanum betaceum Cav.). Food Chemistry 117:88−93

    doi: 10.1016/j.foodchem.2009.03.081

    CrossRef   Google Scholar

    [26]

    Li X, Wang Y, Jiang Y, Liu C, Zhang W, et al. 2024. Microencapsulation with fructooligosaccharides and whey protein enhances the antioxidant activity of anthocyanins and their ability to modulate gut microbiota in vitro. Food Research International 181:114082

    doi: 10.1016/j.foodres.2024.114082

    CrossRef   Google Scholar

    [27]

    Hossein Razavizadegan Jahromi S, Farhoosh R, Hemmateenejad B, Varidi M. 2020. Characterization of the binding of cyanidin-3-glucoside to bovine serum albumin and its stability in a beverage model system: A multispectroscopic and chemometrics study. Food Chemistry 311:126015

    doi: 10.1016/j.foodchem.2019.126015

    CrossRef   Google Scholar

    [28]

    Lang Y, Li E, Meng X, Tian J, Ran X, et al. 2019. Protective effects of bovine serum albumin on blueberry anthocyanins under illumination conditions and their mechanism analysis. Food Research International 122:487−95

    doi: 10.1016/j.foodres.2019.05.021

    CrossRef   Google Scholar

    [29]

    MacLeod Carey D, Gomez T, Morales-Verdejo C, Muñoz-Castro A. 2015. Influence of Ag+ on the magnetic response of [2.2.2]paracyclophane: NMR properties of a prototypical organic host for cation binding based on DFT Calculations. Chemistryopen 4:651−55

    doi: 10.1002/open.201500106

    CrossRef   Google Scholar

    [30]

    Agyare KK, Damodaran S. 2010. pH-stability and thermal properties of microbial transglutaminase-treated whey protein isolate. Journal of Agricultural and Food Chemistry 58:1946−53

    doi: 10.1021/jf903530d

    CrossRef   Google Scholar

    [31]

    Rogers DM, Jasim SB, Dyer NT, Auvray F, Réfrégiers M, et al. 2019. Electronic circular dichroism spectroscopy of proteins. Chem 5:2751−74

    doi: 10.1016/j.chempr.2019.07.008

    CrossRef   Google Scholar

    [32]

    Mansour M, Elmorsy MA, Elkhedir A, Wu T, et al. 2024. Binding interaction between soy protein nanogel and red raspberry anthocyanin in acidic media: Spectroscopic characterization and molecular docking analysis. Journal of Molecular Structure 1305:137681

    doi: 10.1016/j.molstruc.2024.137681

    CrossRef   Google Scholar

    [33]

    Li D, Liu Y, Liu Y, Wang S, Guo Z, et al. 2023. Effects of different fatty acid ligands on the host-guest interaction of astaxanthin-bovine serum albumin: Thermodynamical analysis, binding site identification, and in vivo antioxidant evaluation. Food Hydrocolloids 134:108112

    doi: 10.1016/j.foodhyd.2022.108112

    CrossRef   Google Scholar

    [34]

    Jiang Z, Yu Q, Zhao Z, Song X, Zhang Y. 2023. Reason for the increased electroactivity of extracellular polymeric substances with electrical stimulation: Structural change of α-helix peptide of protein. Water Research 238:119995

    doi: 10.1016/j.watres.2023.119995

    CrossRef   Google Scholar

    [35]

    Ma Y, Wang Y, Cong J, Sun Y. 2019. Magnetic-field tuning of hydrogen bond order-disorder transition in metal-organic frameworks. Physical Review Letters 122:255701

    doi: 10.1103/PhysRevLett.122.255701

    CrossRef   Google Scholar

    [36]

    Shin YGK, Newton MD, Isied SS. 2003. Distance dependence of electron transfer across peptides with different secondary structures: The role of peptide energetics and electronic coupling. Journal of the American Chemical Society 125:3722−32

    doi: 10.1021/ja020358q

    CrossRef   Google Scholar

    [37]

    Wang Z, Zhang Y, Tu Z, Yu C, Liu R, et al. 2024. The degradation and antioxidant capacity of anthocyanins from eggplant peels in the context of complex food system under thermal processing. Food Bioscience 59:103914

    doi: 10.1016/j.fbio.2024.103914

    CrossRef   Google Scholar

    [38]

    Wang X, Jia L, Xie Y, He T, Wang S, et al. 2024. Deciphering the interaction mechanism between soy protein isolate and fat-soluble anthocyanin on experiments and molecular simulations. International Journal of Biological Macromolecules 266:131308

    doi: 10.1016/j.ijbiomac.2024.131308

    CrossRef   Google Scholar

    [39]

    Cheng Y, Chen X, Yang T, Wang Z, Chen Q, et al. 2024. Enhancing the storage stability of mulberry anthocyanin extract through ternary complex with whey protein isolate and ferulic acid at neutral pH: Investigation of binding mechanisms. Food Hydrocolloids 149:109560

    doi: 10.1016/j.foodhyd.2023.109560

    CrossRef   Google Scholar

    [40]

    Okubo S, Iwakuni K, Yamada KMT, Inaba H, Onae A, et al. 2017. Transition dipole-moment of the ν1+ν3 band of acetylene measured with dual-comb Fourier-transform spectroscopy. Journal of Molecular Spectroscopy 341:10−16

    doi: 10.1016/j.jms.2017.09.001

    CrossRef   Google Scholar

    [41]

    Li F, Chen Z, Chang M, Zhang X, Liu X, et al. 2023. Three anthocyanin-rich berry extracts regulate the in vitro digestibility of corn starch: Physicochemical properties, structure and α-amylase. International Journal of Biological Macromolecules 253:127484

    doi: 10.1016/j.ijbiomac.2023.127484

    CrossRef   Google Scholar

    [42]

    Diaconu A, Nita LE, Chiriac AP, Butnaru M. 2018. Investigation of the magnetic field effect upon interpolymeric complexes formation based on bovine serum albumin and poly(aspartic acid). International Journal of Biological Macromolecules 119:974−81

    doi: 10.1016/j.ijbiomac.2018.08.033

    CrossRef   Google Scholar

    [43]

    Jiang Y, Qi Z, Li J, Gao J, Xie Y, et al. 2024. Role of superfine grinding in purple-whole-wheat flour. Part I: Impacts of size reduction on anthocyanin profile, physicochemical and antioxidant properties. LWT 197:115940

    doi: 10.1016/j.lwt.2024.115940

    CrossRef   Google Scholar

    [44]

    Paul B, Han Q, Xie L, Rashwan AK, Yahia ZO, et al. 2024. Development and evaluation of guar gum-coated nano-nutriosomes for cyanidin-3-O-glucoside encapsulation. International Journal of Biological Macromolecules 271:132537

    doi: 10.1016/j.ijbiomac.2024.132537

    CrossRef   Google Scholar

  • Cite this article

    Zhang Z, Shen Y, Xin G, Deng W, Tan H, et al. 2024. The effect of static magnetic field on inducing the binding of bovine serum albumin and cyanidin-3-O-glucoside. Food Innovation and Advances 3(4): 449−456 doi: 10.48130/fia-0024-0042
    Zhang Z, Shen Y, Xin G, Deng W, Tan H, et al. 2024. The effect of static magnetic field on inducing the binding of bovine serum albumin and cyanidin-3-O-glucoside. Food Innovation and Advances 3(4): 449−456 doi: 10.48130/fia-0024-0042

Figures(6)  /  Tables(2)

Article Metrics

Article views(1091) PDF downloads(169)

ARTICLE   Open Access    

The effect of static magnetic field on inducing the binding of bovine serum albumin and cyanidin-3-O-glucoside

Food Innovation and Advances  3 2024, 3(4): 449−456  |  Cite this article

Abstract: Serum albumin can bind with a diverse range of small molecules. It could therefore serve a protective or carrier function, and effectively address the issue of anthocyanins' susceptibility to decomposition. The anisotropic effect of the magnetic field (MF) can influence their interaction, thereby playing a distinct role in molecular bonding. In this study, bovine serum albumin (BSA) and cyanidin-3-O-glucoside (C3G) were used as raw materials. The mechanism underlying the formation of BSA-C3G complexes induced by static magnetic field (SMF) was investigated through analyses of secondary structure, functional groups, dipole moment, crystal cell dimensions, and microstructural characteristics. BSA and C3G were treated with 50, 100, 150, and 200 mT, respectively. As the magnetic intensity increased, the secondary structure of the complex changed, the α-spiral content, β-corner content, and irregular curl content decreased, while, the β-folding content increased. The average grain size of the BSA-C3G composite was observed to decrease. Furthermore, alterations in the crystal cell dimensions of the BSA-C3G complex were noted, accompanied by a tendency for the microstructure to become more flattened. This study offers valuable insights into the influence of SMF on the assembly behavior and structural characteristics of proteins and anthocyanins.

    • Black rice is a rare variety of rice with a broad geographical distribution[1]. The content of trace elements manganese and zinc is 1−3 times higher than that of ordinary rice. Moreover, it encompasses distinctive components such as vitamin C, chlorophyll, and anthocyanins. As a result, black rice possesses a higher nutritional value compared to regular rice. Recent research has demonstrated that black rice possesses antioxidant, anti-inflammatory, and anti-tumor properties, as well as the ability to improve type 2 diabetes[2,3]. Additionally, it has been shown to prevent the occurrence of cardiovascular and cerebrovascular diseases, along with exhibiting other distinct biological activities[4]. The physiological functions of these compounds are likely attributable to their anthocyanin content[5]. However, their stability is relatively low and they are susceptible to degradation under external conditions. Anthocyanins in black rice are primarily comprised of centaurin-3-O-glucoside (C3G), which accounts for approximately 88% of the total anthocyanin content[6]. To improve the stability of anthocyanins, the structural modification and manipulation of environmental conditions have been used in recent studies[79]. The specific structural methods encompass copolymerization, acylation, and biosynthesis. Environmental approaches involve liposomes, microencapsulation, and encapsulation of nanoparticles[10]. However, these techniques are prone to certain limitations. For instance, acylation may introduce potentially detrimental residues, while, encapsulation has the potential to decrease water solubility.

      During the food production process, anthocyanins can interact with a variety of proteins. It is also essential for anthocyanins to form complexes with carrier proteins to facilitate normal metabolism, transportation, and absorption in vivo[11]. The interaction can be either non-covalent or covalent, depending on the chemical structure of the reactants and the reaction conditions[12], which further influences the conformation of carrier proteins[13]. Consequently, the investigation of exploration between anthocyanins and proteins is indispensable for understanding the in vivo transport and metabolism of anthocyanins at a molecular level. Currently, protein binding has been demonstrated to be an effective approach for the stabilization of anthocyanins[14]. The enhancement of stability is related to the molecular structure of the complex. At present, the stability of anthocyanins can be improved by changing the structure of the complex, but the mechanism of action is not yet clear. Bovine serum albumin (BSA), as one of the predominant transport proteins in plasma, plays a crucial role in maintaining the stability of plasma colloid osmotic pressure, facilitating material exchange with interstitial fluid[15]. It also possesses a distinct hydrophobic cavity that serves as a binding site for anthocyanins, facilitating their interaction[16]. Consequently, it is of great significance to investigate the binding mechanism between BSA and anthocyanins.

      External static magnetic fields (SMF) have been approved to affect chemical or biological molecular interaction via regulating molecular binding[17]. From a microscopic perspective, all the molecules are composed of atoms. When the number of protons or neutrons is odd, the nucleus becomes a magnetic nucleus and the spin of the magnetic nucleus forms a current loop. It results in the generation of a magnetization vector with specific magnitude and direction, as depicted in Fig. 1. In solution systems, the SMF induces molecular binding among proteins, small molecules, and solvents[18]. The effects of SMF on proteins include the changes of secondary bonds, peptide bonds, and distribution of electrons and molecules[19]. For example, the spatial structure of proteins is primarily maintained by secondary bonds. SMF can lead to the exposure of a distinct number of tryptophan groups, internal tyrosine groups, and aliphatic groups on the protein surface by affecting secondary bonds, such as the disruption of certain disulfide bonds[20]. Secondly, the diamagnetic anisotropy of proteins is contributed by peptide bonds, such as the α-helix structure. Thirdly, the SMF induces alterations in the distribution of electrons and molecules, resulting in the polarization and displacement of atoms and molecules. This subsequently leads to modifications in electron transition probability, dipole moment transition, and molecular vibration state, while maintaining the atomic and molecular composition unchanged[19]. These effects may result in the formation of protein clusters in SMF, commonly denominated as magnetic domains, which significantly enhance the efficiency of protein binding to small molecules. In addition, the effects of the SMF on small molecules mainly encompass molecular distortions, increased interactions, and changes in bond angles. The physico-chemical properties of the reaction solution can be affected by the SMF. Firstly, the viscosity and surface tension of the solution could be affected by the changes in molecular interactions under the inducement of SMF. Secondly, SMF causes the changes in the hydrated ion layer and the hydrated water structure which further influences the water conductivity[20]. For polar compounds with high diamagnetism, the SMF have distinct advantages for inducing intermolecular binding. It can transfer energy to the microstructure of matter without direct contact, which is attributed to the influence of SMF on the mutual transformation of electron triplets and singlets of free radicals. Due to the reason of energy, free radicals in triplets are less prone to Gemini recombination[21]. Moreover, SMF have the capability to alter bond arrangement and orientation. Thus, it could provide superior control over microstructure control through adjusting the direction and intensity of the magnetic field[22].
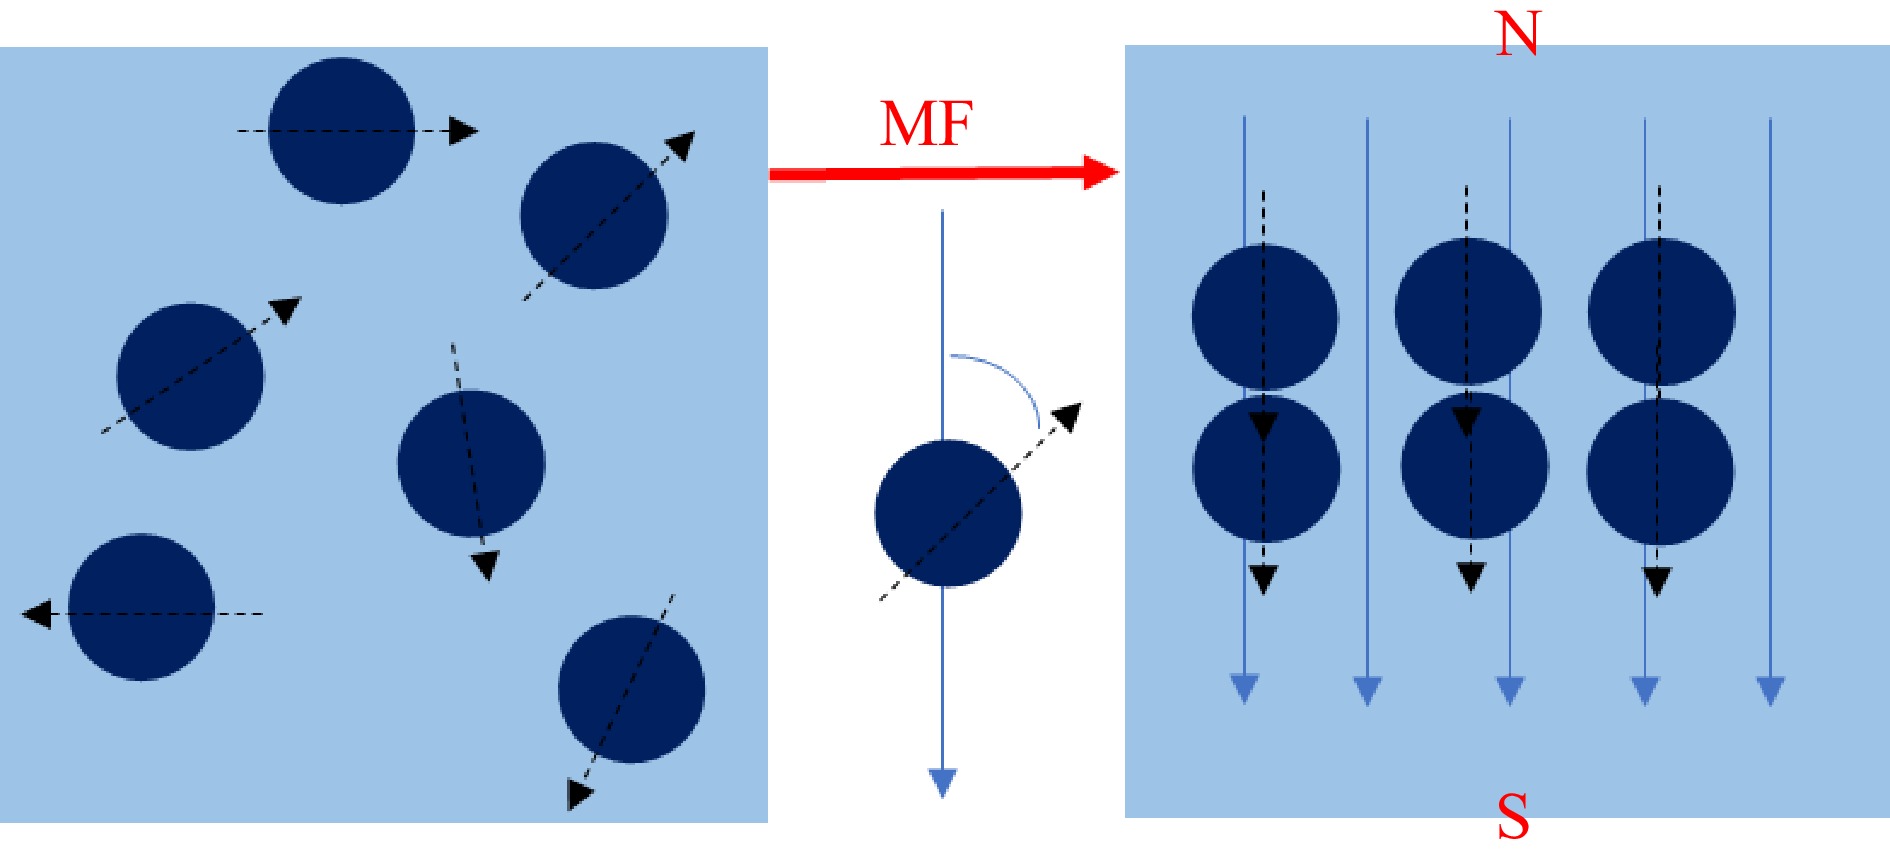
      Figure 1. 

      The spin of a magnetic nucleus produces a magnetization vector (MF: magnetic field, N: magnetic north, S: magnetic south).

      In previous experiments conducted by the research group, the SMF had an impact on stability. In this paper, the formation and structural changes of composites during magnetic processing were further explored, and delve into the mechanism of the influence of SMF on the structure of composites. Currently, while the interactions between proteins and small molecules have been documented, the impact of SMF induction on the binding mode between BAS and C3G remains inadequately explored. Therefore, the related mechanism would be revealed by the analysis of secondary structure, functional groups, dipole moment, unit cell size, and microstructure of the complex.

    • BSA ( purity ≥ 97%, GENVIEW), C3G (purity ≥ 98%, Vicky Biotechnology Co., Ltd), potassium bromide (spectrally pure, Tianjin Damao), trimethylol aminomethane (Tris, purity ≥ 99%, Amresco), HCl (Tianjin Damao), anhydrous ethanol (Tianjin Damao), NaCl (Tianjin Damao). All other reagents were domestic analytical pure. The water used in the experiment was tertiary ultra-clean water.

    • A Tris-HCl buffer (0.05 mol/L, pH 7.4) of 0.10 mol/L NaCl was prepared to maintain the ionic strength and pH of the solution. A BSA solution (1 × 10⁻⁶ mol/L) was prepared with the Tris-HCl buffer and stored at 4 °C for later use. A stock solution of C3G (3 × 10⁻³ mol/L) was prepared in anhydrous ethanol and stored at 4 °C for later use.

    • Schrodinger molecular docking software was used to predict the molecular binding conformation of BSA and C3G[23]. First, protein macromolecular file was prepared. In File-Get PDB, the molecular file of BSA was loaded through the functions provided by maestro. The PDB ID was entered as 4F5S and downloaded. The Protein Preparation Wizard module was selected, and the Fill in missing side chains using the Prime option checked under the Import and Process processing box. The conserved water molecules were retained and charged. The hydrogen bond network of amino acid residues were optimized and the energy was minimized. After running, the prepared protein molecular file was obtained. Second, the file of the ligand small molecule was prepared. The CAS number 7084-24-4 of C3G was searched in Pubchem, the 2D structure file (sdf type) downloaded, and then the downloaded file uploaded into maestro. The small molecule file in the LigPrep module was selected, OPLS3e chosen in the Force field, and 'Generate possible states at target pH' chosen when setting the ionization state: 7.0+/−0.5, the following were checked: Epik, Desalt, Generate tautomers, Retain specified chiralities (vary other chiral centers), the 'Generate at most' was set to 32 per ligand, the format set and then perform the operation. After running, the prepared ligand molecular file was obtained. Third, a SiteMap was run on a protein molecule to look for pockets of activity. The option for the whole macromolecule was set in the SiteMap module. The precision setting requires at least 15 site points per reported site, Report up to 5 sites (site-point groupings), and Crop site maps at 4 Atoms come from nearest site point and run. Fourth, Receptor pocket files were generated under the Receptor Grid Generation module and molecular Docking performed under the Ligand Docking module.

    • The SMF required for the experiment was provided by a 100 mm × 100 mm × 20 mm Ndfeb magnet, which was purchased from Shanyang District, Jiaozuo City, Xin Heng strong magnetic hardware store (China). The two Ndfeb magnets were fixed in parallel, and the SMF strength changed by changing the distance between the two magnets. The required magnetic induction intensity (50 mT-200 mT) was determined by the Tesla meter. BSA solution (1 × 10⁻⁶ mol/L) and C3G solution (3 × 10⁻³ mol/L) were mixed with a volume ratio of 1:1. The samples were then treated in a SMF of 50, 100, 150, and 200 mT for 4 h, respectively.

    • The secondary structure changes of the samples were determined by circular dichroism. The experimental instrument is a circular dichrometer (Chirascan V100, applied photophysics, UK). The response time was 0.5 s, the scanning rate was 100 nm/min, the slit width was 2 nm, and the step size was 1 nm. Then, the circular dichrograms of each sample were collected. The secondary structure of polypeptide was calculated, and the content and proportion of each sample were obtained.

    • The samples were ground to less than 200 mesh and dried in a drying oven for 4 h until no clumping appeared. Appropriate amount of powders (1−2 mg) were ground with 200 mg potassium bromide, mixed, and pressed into a tablet. The samples with the treatments of 0 and 200 mT were tested, and the absorption spectra were determined by a Fourier infrared spectrometer. The experimental instrument used was a Fourier transform infrared spectrometer (IRAffinity-1, Shimadzu, Japan). The parameters included a wall-number range of 4,000 to 400 cm−1, 64 scans with an average resolution of 4 cm−1, and an ambient temperature of 25 °C.

    • The experimental instrument was a X-ray diffractometer (ADVANCE, Brook, Germany). Three grams of the lyophilized sample was ground to a particle size of 40 μm and pressed into tablets. The parameters were as follows: the emission current was 25 mA; the working temperature was 25 °C. The time/step length: 1 s/step length; Interval: 2θ = 4−40°; Scan step size: 0.01. The diffraction peak of the results was smoothed, the back and bottom were subtracted, and the instrument was widened.

    • The experimental instrument was a Field emission scanning electron microscope (SIGMA500, Zeiss, Germany). Freeze-dried samples were uniformly fixed on the glue-attached electron microscope injection stage and sprayed gold under vacuum conditions. They were then fixed on the stage to adjust the best field of view and magnification for observation.

    • Each experiment was repeated three times. The experimental data were processed and analyzed by Excel and Origin 2022b, and the correlation analysis was performed by SPSS 26.0, and the significance level was p < 0.05.

    • Molecular docking is a computer simulation program used to predict the conformation of receptor-ligand complexes[24]. Molecular docking technology can simulate the binding between C3G and BSA, which helps to understand the ligand-receptor interaction better and further verify the experimental conclusions. It has been reported that the degree of hydroxylation on the B-ring of anthocyanins determines the hue and color stability of anthocyanins[25]. The antioxidant capacity of anthocyanins is associated with the number of hydroxyl groups in the B ring. The hydroxyl group at position 4 of the B ring is the most active group[26]. Figure 2 showed that C3G was mainly bound to the II and III domains of BSA, and six amino acid residues docked with C3G molecule. ASP108, LYS114, ARG144, ARG185, and LEU454 interacted with C3G through hydrogen bonding, resulting in the loss of hydrogen donor which further limited its antioxidant properties. Meanwhile, ARG458 was docked to C3G through cation-π interaction. Hence, the hydrogen bond and cation-π interaction are the main force types in the binding process of C3G to BSA. Recent studies have revealed that the predominant binding mechanism between the two entities is non-covalent binding[27,28], which aligns with our initial prediction. The calculated minimum binding energy of the molecular model was determined to be −7.291 kcal/mol (30.52 kJ/mol). These findings suggest that application of a magnetic field may influence the cation-π interaction and subsequently alter the binding conformation of the two entities[29].
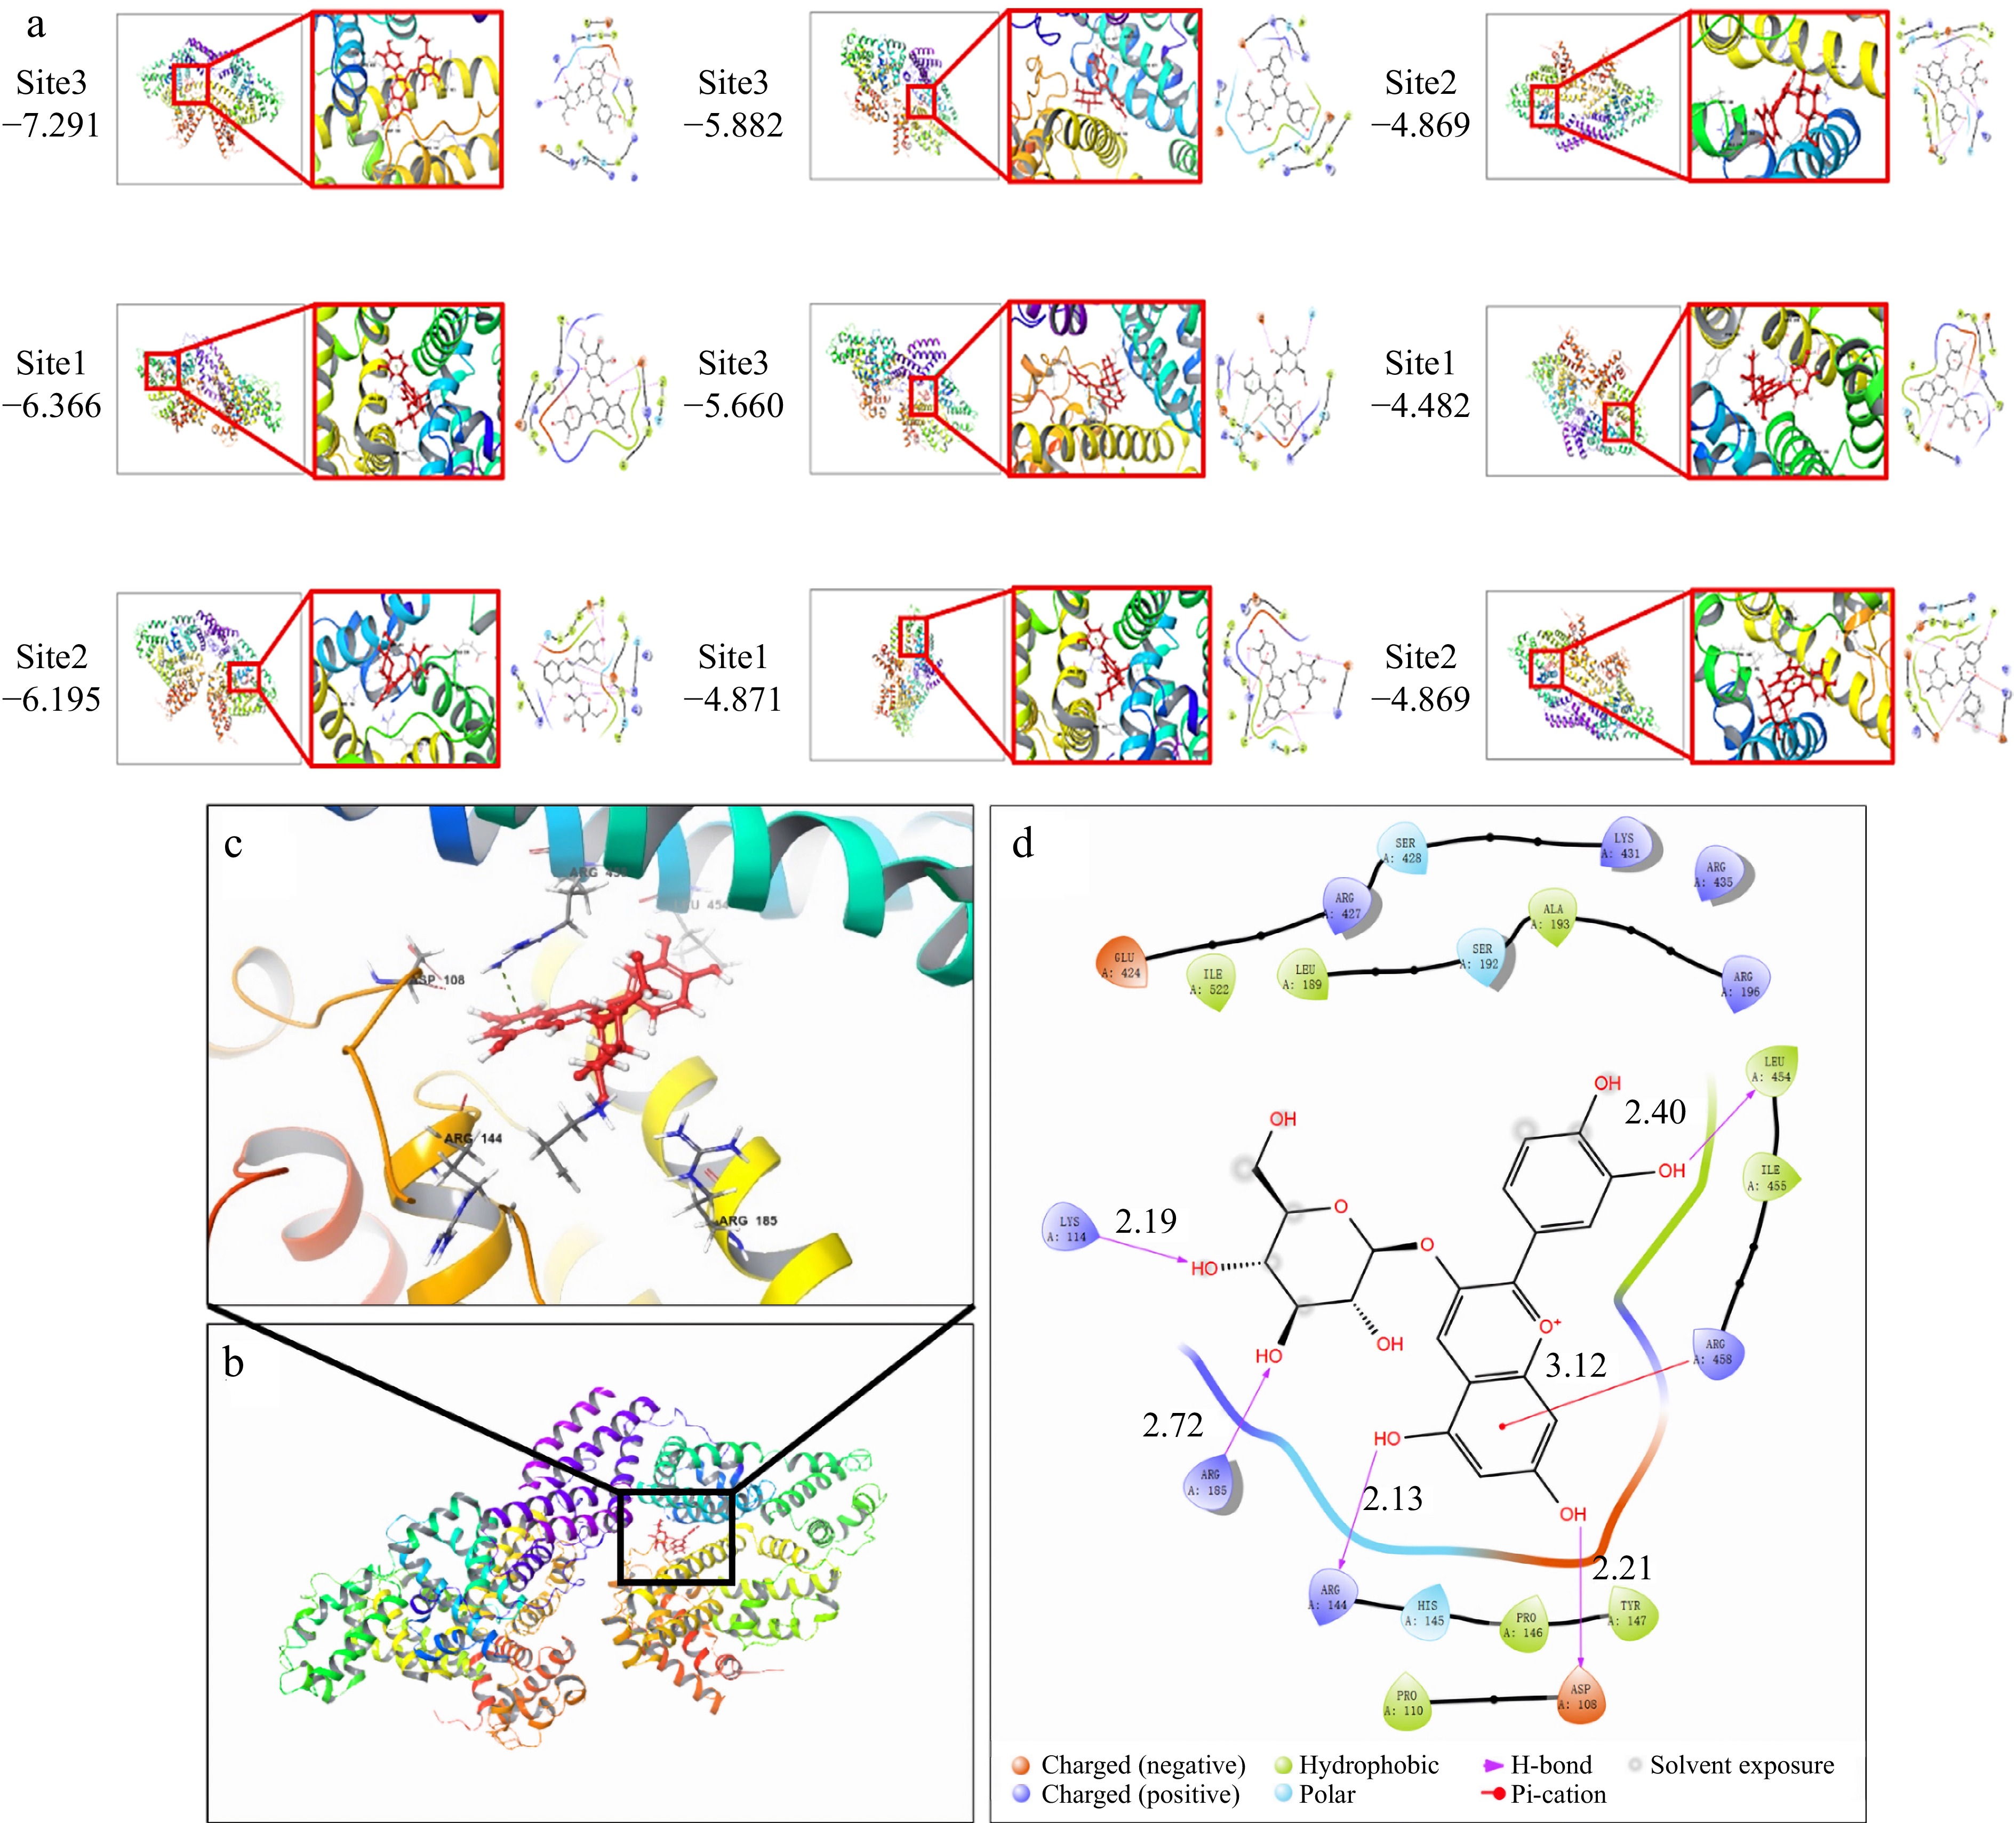
      Figure 2. 

      Molecular docking of simulated BSA-C3G conjugates, (a) nine simulation results, (b) BSA-C3G conjugate model, (c) BSA-C3G binding site detail diagram, (d) main force type.

    • Circular dichroism (CD) spectroscopy is employed to further investigate the impact of SMF treatment on the binding of C3G-BSA complex (Fig. 3). The complexes subjected to different magnetic fields exhibited two distinct negative absorption peaks at 208 and 221 nm, respectively, indicating the characteristic α-helix structure in the secondary conformation[30,31]. As the intensity of SMF increased, distinct changes were exhibited in the CD of BSA. It suggested that the magnetic field disrupted the protein structure, causing BSA more susceptible to binding with anthocyanins[32]. The experimental results demonstrate that the alterations in absorbance and secondary structure are reverse reactions. Research has found that sometimes the changes in absorbance are small, while the changes in structure are large[33]. In this experiment, this might be attributed to the magnetic field acting on the composite, causing it to form a special structure that influences the absorption of light. As shown in Table 1, an escalation in SMF induction intensity led to a decrease in α-helix content from 32.6% to 23.4%, an increase in β-fold content from 5.5% to 39.6%, a decrease in β-angle content from 22.1% to 8.4%, and a reduction in random coil content from 39.8% to 28.6%. The decrease in α-helix content from 32.6% to 23.4% can be attributed to several factors. For example, the C=O bond of the amide group is capable of forming hydrogen bonds with other functional groups, thereby contributing to the overall secondary structure of the protein complex. The typical α-helix structure is a helical conformation constituted by a hydrogen bond between the C=O of the amino acid at position X and the N-H of the amino acid at position X-4 in the peptide backbone[34]. Magnetic fields can effectively facilitate the transition of hydrogen bonds from disordered to ordered states[35]. In a randomly coiled polypeptide chain, the dipole moment of a single backbone amide group is oriented randomly, resulting in neighboring helices neutralizing each other's dipoles in opposite directions. In α-helices, the hydrogen bond neutralizes their horizontal dipole moments, and the vertical dipole moments point in the same direction[36]. The dipoles of the individual peptides within the helix were combined to form large dipoles. Meanwhile, the amino-terminal pole of the helix becomes positive and the carboxyl-terminal pole becomes negative. Therefore, the charge distribution is asymmetric in the high helical structure of BSA, which reduces the alpha-helical content under the applied magnetic field. The change in the secondary structure of BSA, suggested that C3G bound with amino acids on the main chain of BSA and destroyed the hydrogen bond network.
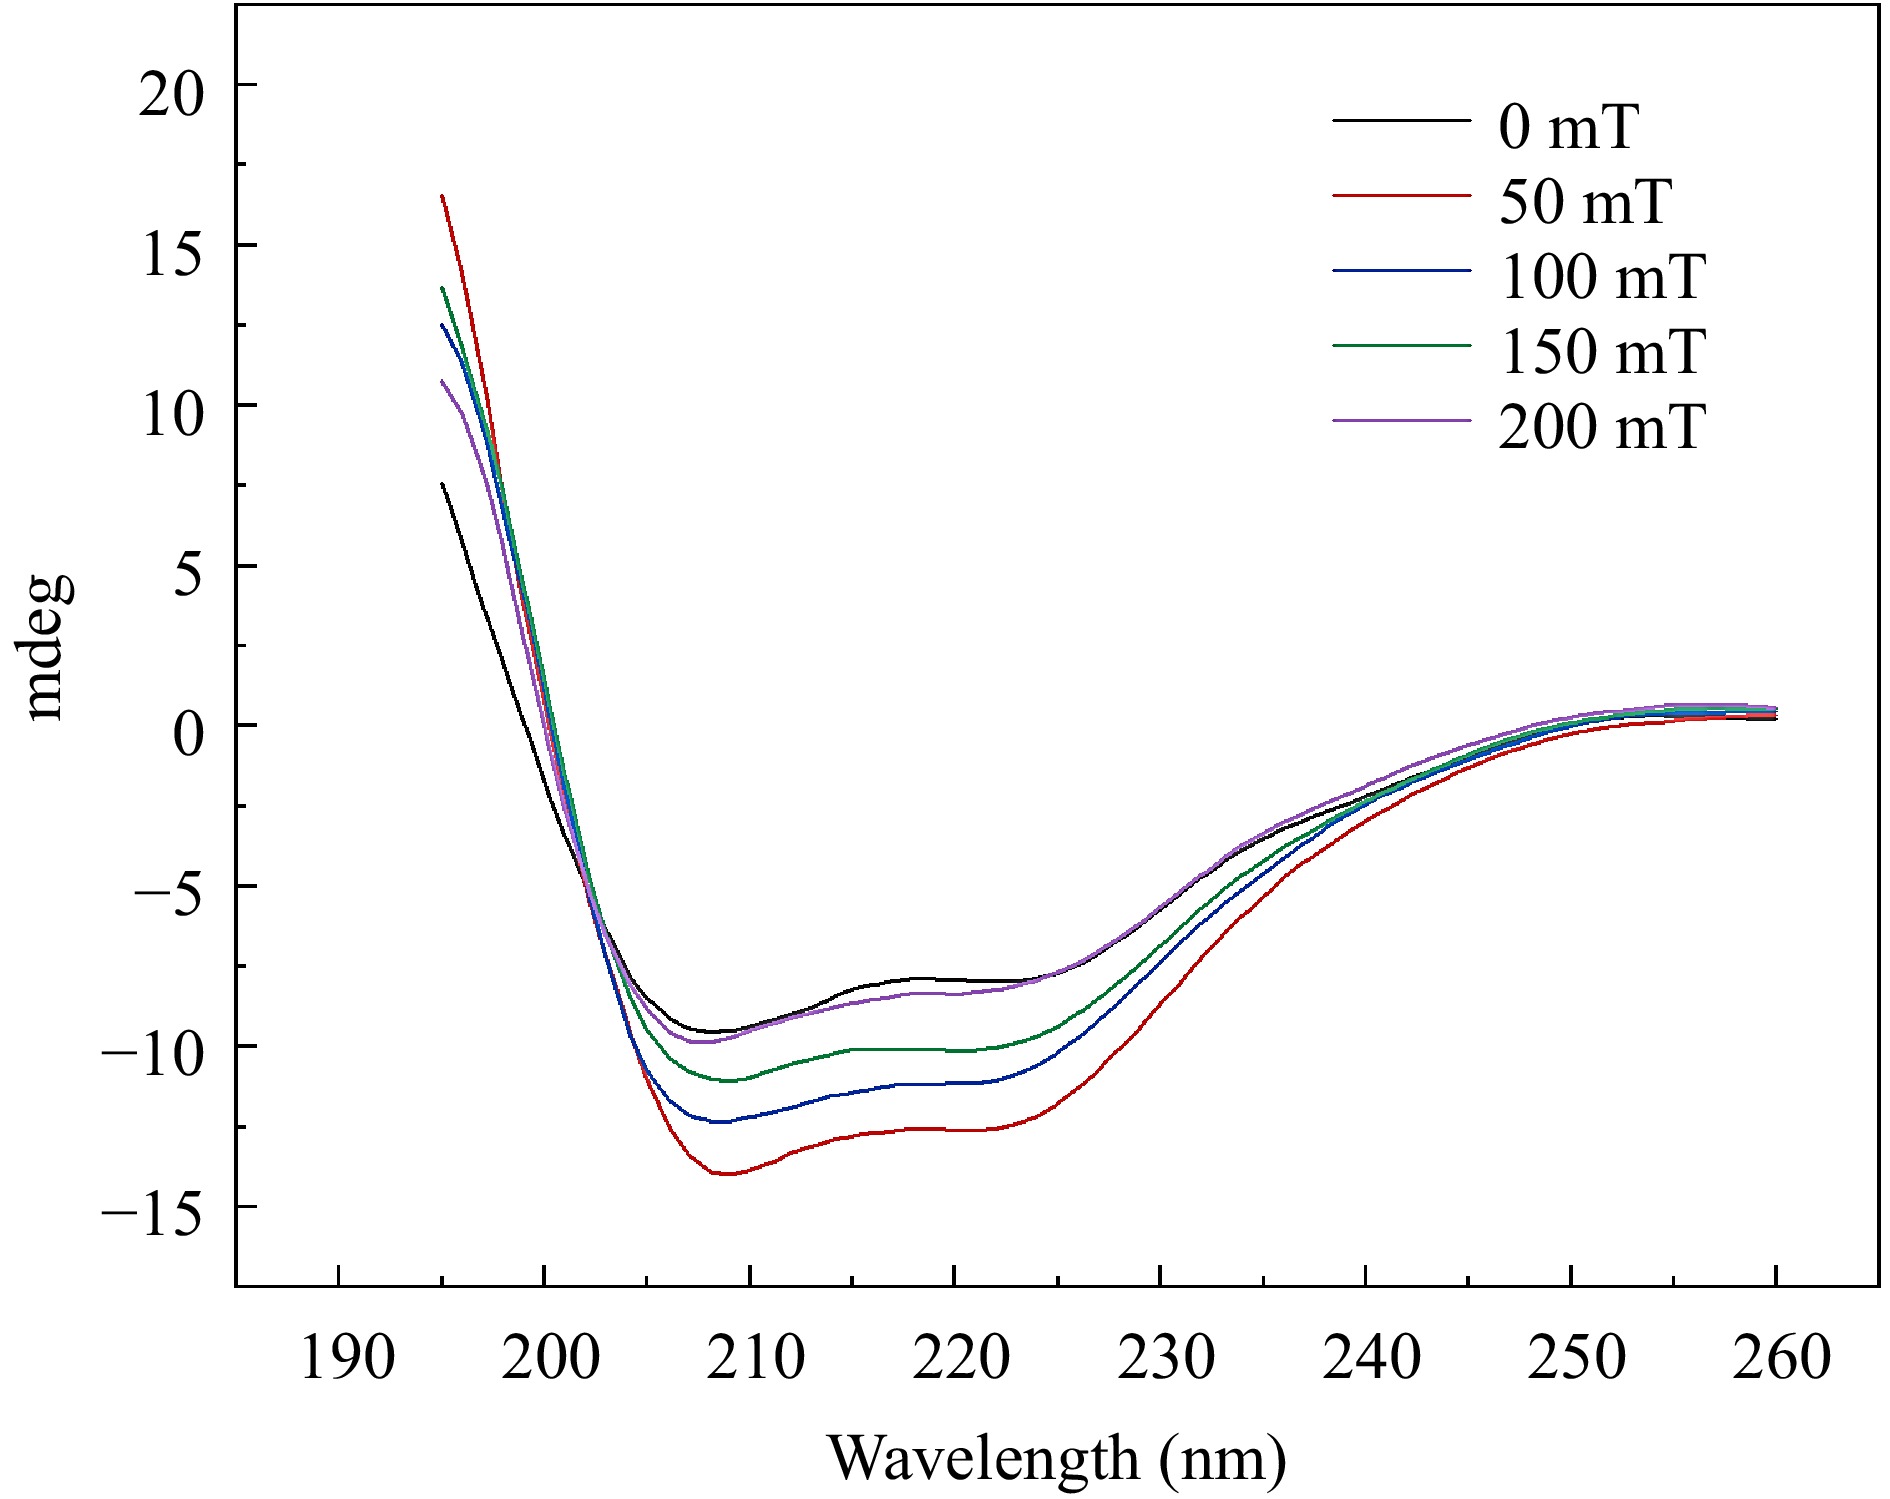
      Figure 3. 

      Circular dichroism spectra of BSA-C3G conjugates at different magnetic sensing intensities.

      Table 1.  Changes in secondary structure content of BSA-C3G conjugates at different magnetic sensing strengths.

      Magnetic intensity α-helix β-sheet β-turn Random coil
      0 mT 32.6% 5.5% 22.1% 39.8%
      50 mT 29.3% 23.7% 16.9% 30.1%
      100 mT 25.0% 30.9% 12.1% 31.9%
      150 mT 24.3% 35.8% 10.7% 29.2%
      200 mT 23.4% 39.6% 8.4% 28.6%
    • To investigate the potential re-dissociation of the complex into individual BSA and C3G molecules in solution with exposure to an SMF, the solution is analyzed using the infrared spectroscopy[37,38]. Based on the result of Fourier infrared spectroscopy, no separation of the complex after binding was observed (Fig. 4). Furthermore, the position and number of absorption peaks in the complexes different magnetic induction treatments remained unchanged. It was indicated that the chemical bond between BSA and C3G was not influenced by the SMF[39]. However, the transmittance underwent a distinct change, which could potentially be ascribed to the dipole moment of the conjugate[40]. With the increasing intensity of the SMF, the infrared spectral transmittance of the sample increased. It may be related to the change of the molecular force of the SMF, resulting in the change of the dipole moment of the sample. The dipole moment changed greatly and the transmittance of the absorption peak increased greatly. The greater the electronegativity difference between the two ends of the bond and the greater the polarity, the greater the transmission is observed. It is concluded that the SMF treatment did not change the chemical bond, but also changed the dipole moment of the bond (the distance between different atoms), then changed the binding effect of the two molecules. Thus, the stronger the magnetic induction intensity of the static field resulted in the greater change of the dipole moment.
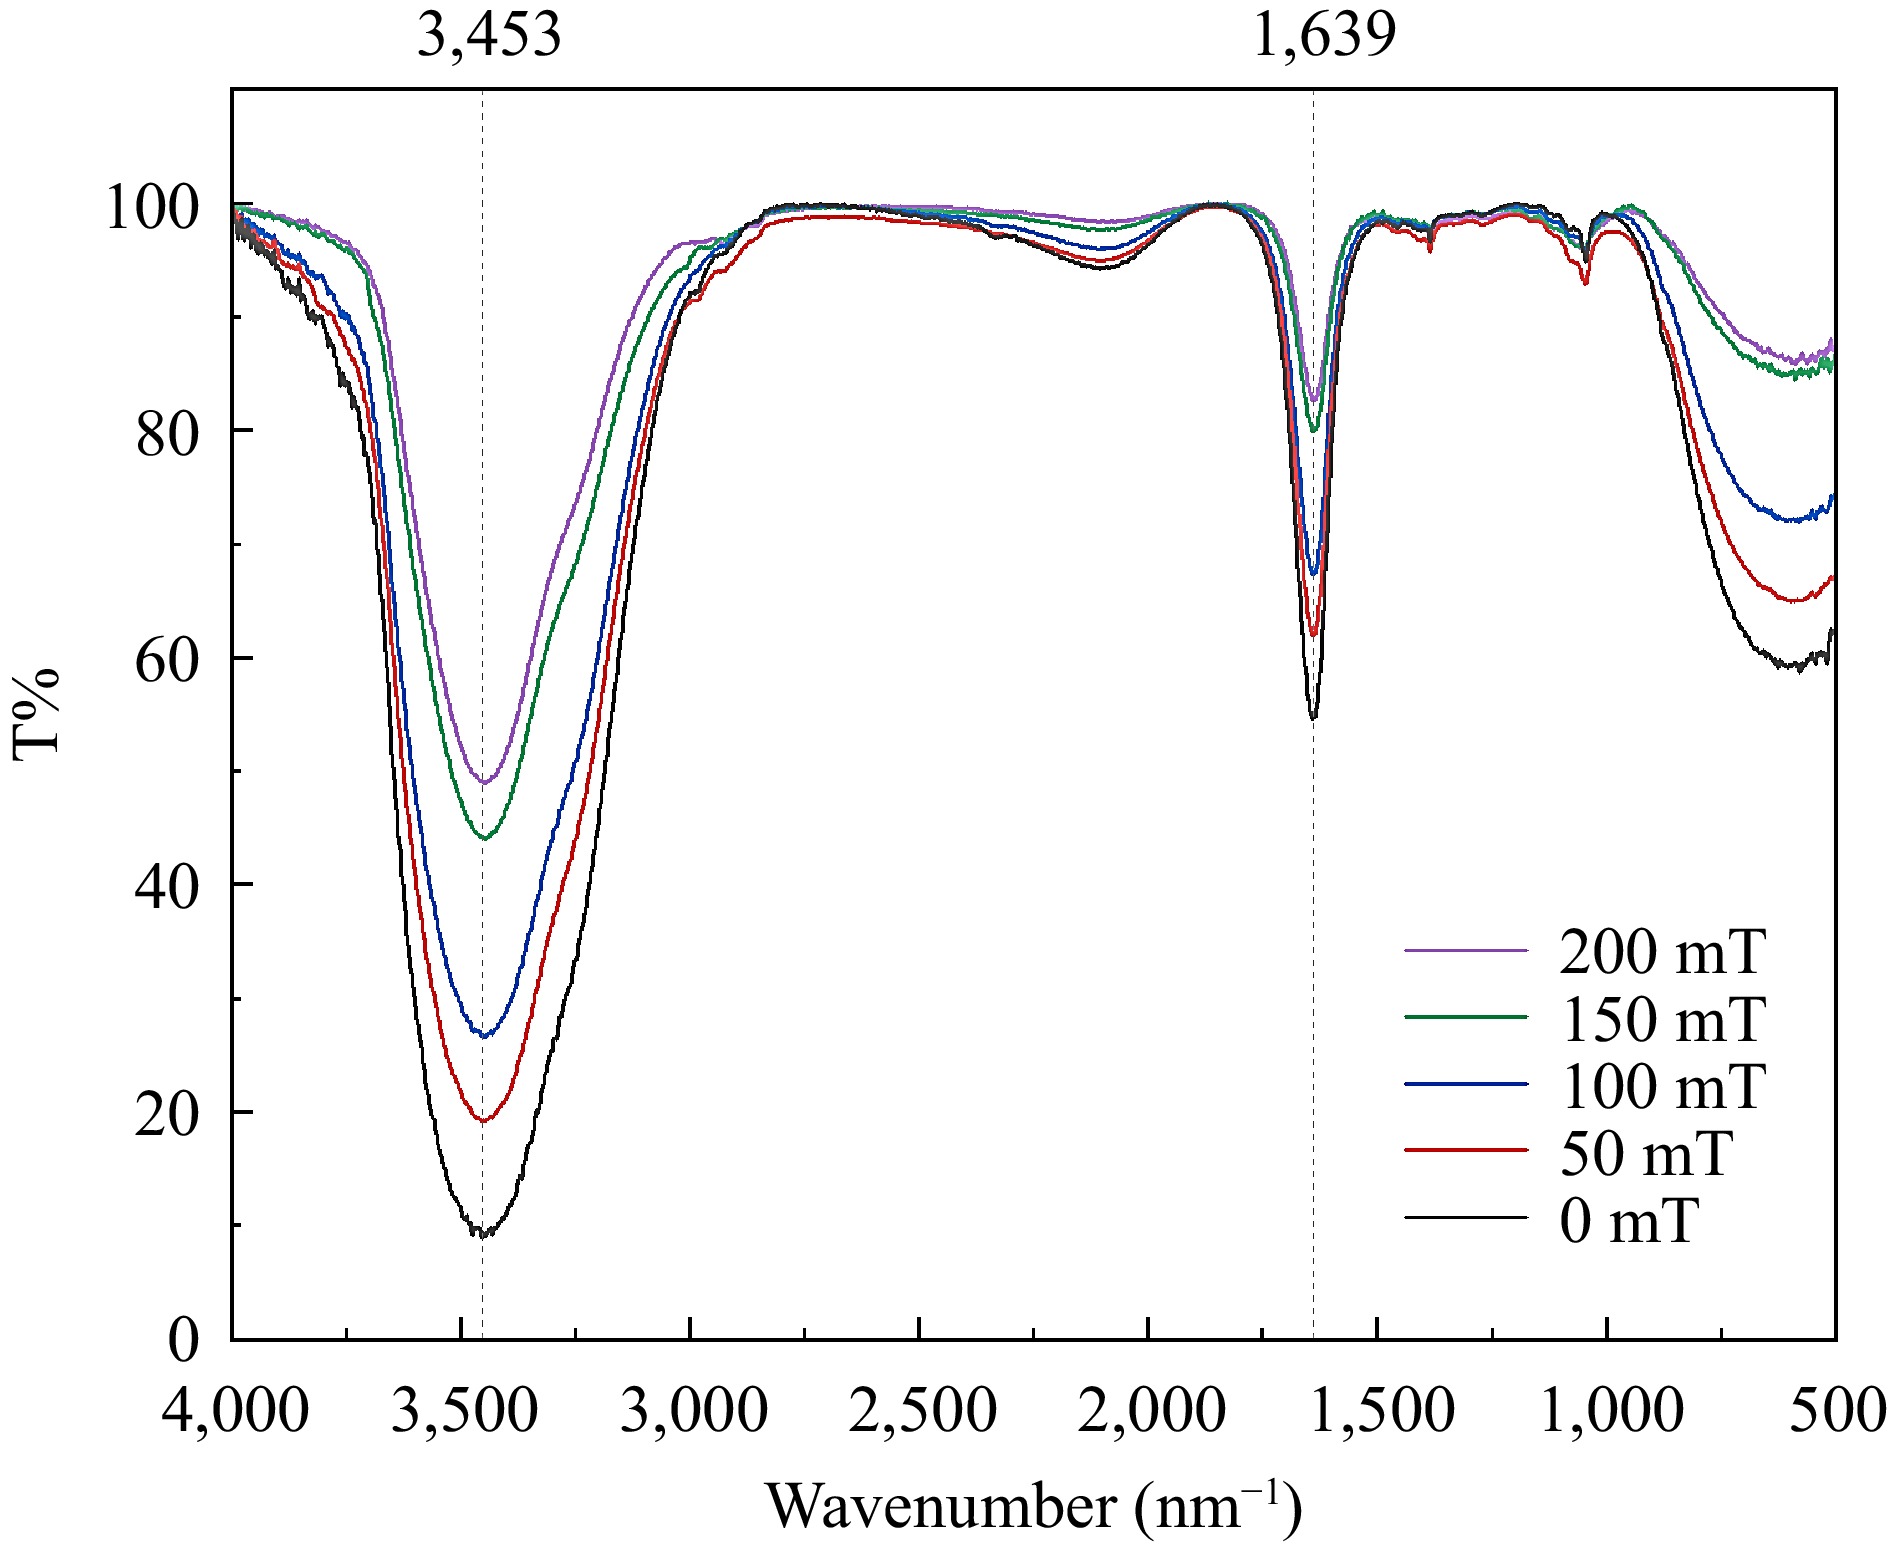
      Figure 4. 

      FTIR of BSA-C3G conjugates under different MF conditions.

    • The characteristic diffraction pattern included two primary components: the spatial distribution of diffraction, reflected in the peak position within the characteristic diffraction pattern and the intensity of the characteristic diffraction peaks. The distribution of diffraction peaks is predominantly governed by the size, shape, and orientation of the unit cell. Meanwhile, the intensity is mainly determined by both the type of atoms and their positions within the unit cell. As depicted in Fig. 5, all samples exhibited sharp diffraction peaks indicative of a crystalline structure[41]. The peak heights of samples with SMF treatment were observed to be remarkably high, sharp, and narrow at 11° and 22° compared with the control group. Conversely, the height of the above two peaks decreased clearly in SMF treatment and the peak width was slightly wider than that of 0 mT samples. The alteration in average grain size was also attributed to changes in the peaks at 11° and 22°. According to Diaconu et al.[42], these peaks can be identified as randomly oriented helical structures, suggesting that the influence of SMF on these structures was distinct. This can be attributed to the flexibility of the protein, which allows the restructuring of the structure due to exposure to magnetic forces of different strengths and allowed the two helices to unravel. Generally, maintaining the helical structure mainly depends on hydrogen bonds. After the helix unraveled, more hydrogen bond exposure increased the efficiency of small molecules to bind. Table 2 shows the results of peak position, full width at half maxima (FWHM), and crystaline size. Based on Table 2, the grain size of the samples subjected to the SMF generally decreased. This phenomenon may be attributed to the influence of the SMF on the magnetic dipole moment, with a minimum effect observed at 50 mT and a maximum effect at 200 mT. The treatment of 200 mT showed the highest degree of helix unwinding and the highest efficiency of binding. These results were in accordance with the experimental conclusion of circular binary chromatography.
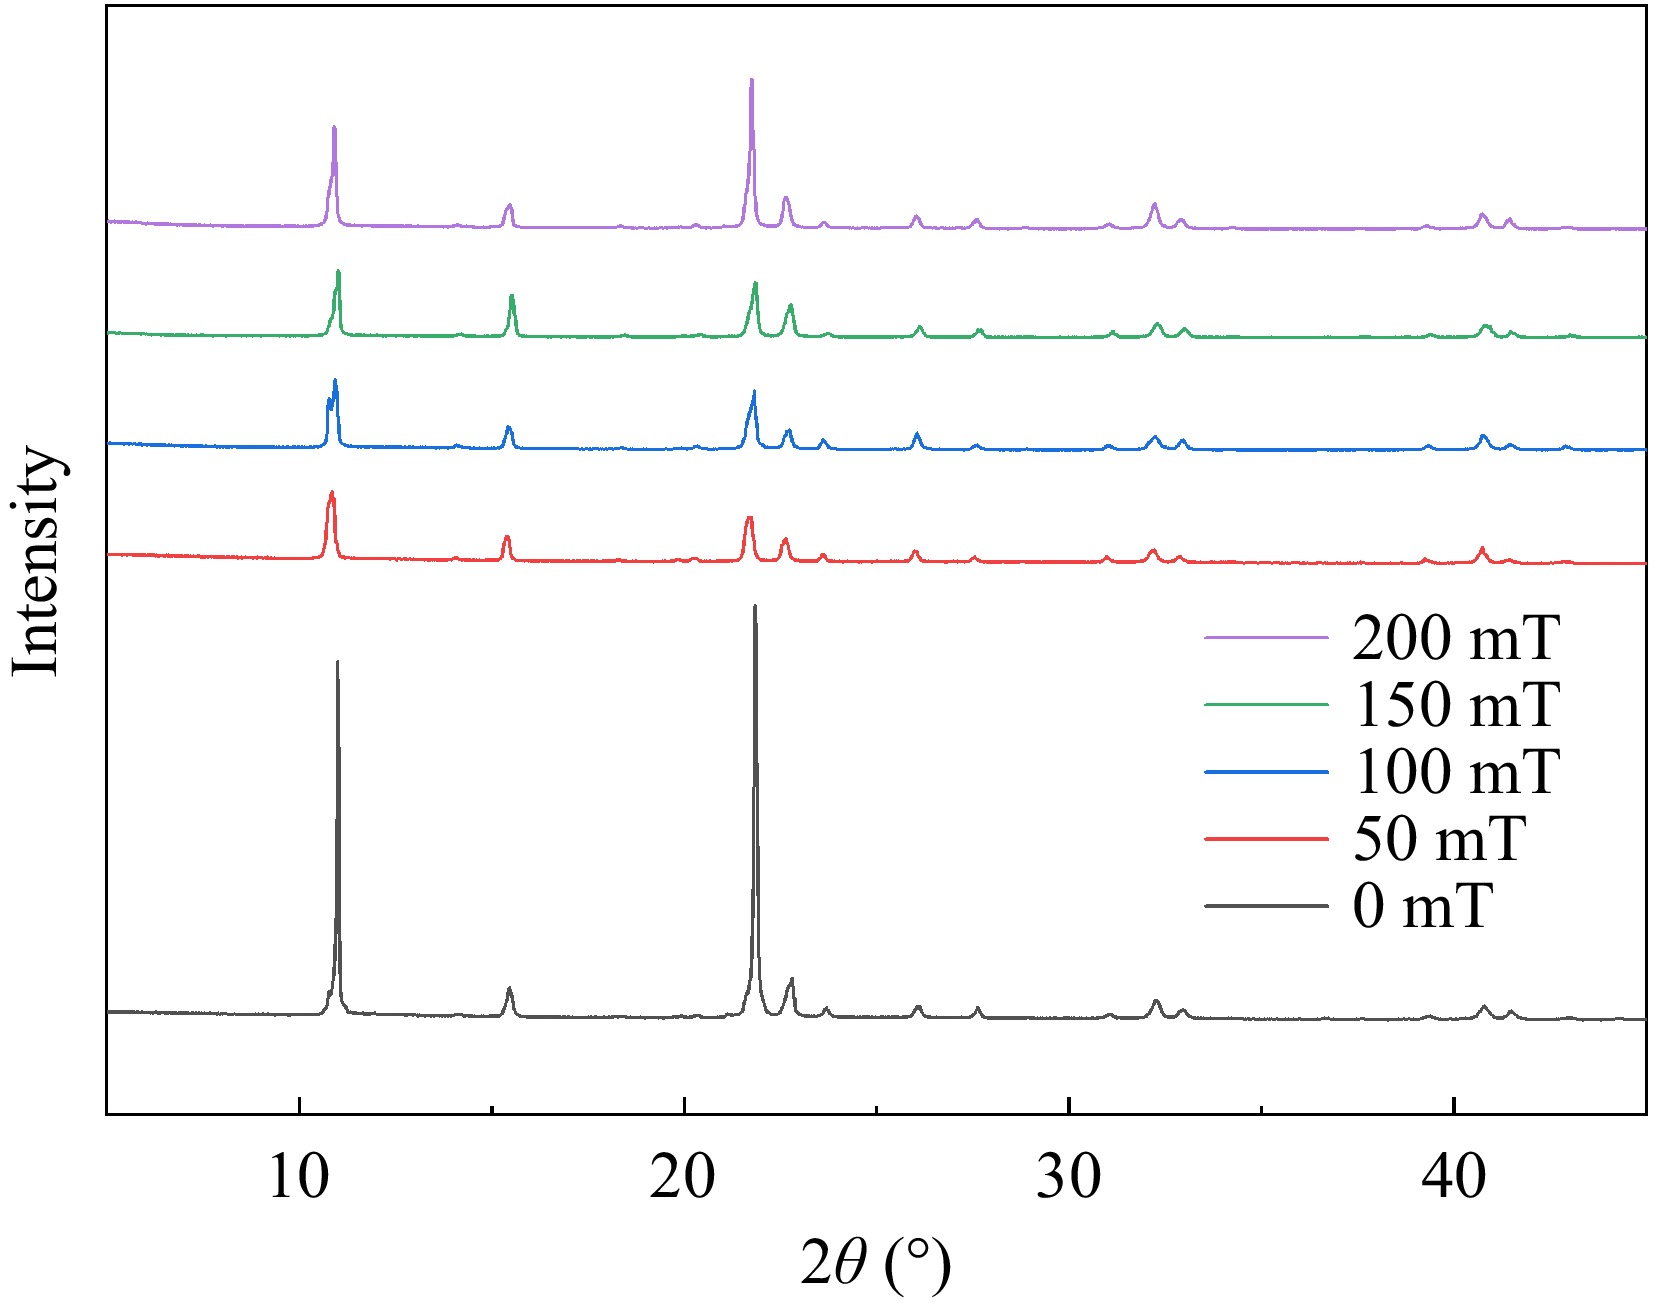
      Figure 5. 

      XRD patterns of BSA-C3G conjugates under different magnetic field conditions.

      Table 2.  Peak position, FWHM, crystaline size, and average size of conjugates.

      Compound Peak position
      (2 Theta)
      FWHM Crystaline
      size D (nm)
      Average D
      (nm)
      0 mT 11.00 0.07 115.30 52.44
      15.46 0.20 40.99
      21.84 0.11 71.56
      22.74 0.25 31.90
      23.68 0.19 43.76
      27.62 0.15 55.92
      32.26 0.24 34.82
      32.94 0.20 41.16
      40.78 0.23 36.55
      50 mT 10.89 0.26 31.14 37.36
      21.72 0.27 30.07
      23.64 0.16 51.99
      26.05 0.18 44.46
      31.02 0.20 41.07
      32.22 0.30 26.95
      32.92 0.20 41.55
      40.77 0.27 31.61
      100 mT 10.97 0.18 43.81 39.70
      15.42 0.16 51.03
      21.81 0.23 34.66
      22.73 0.24 34.45
      27.66 0.19 42.07
      31.12 0.19 44.53
      32.28 0.26 31.66
      32.99 0.23 35.41
      150 mT 10.82 0.22 36.57 40.63
      15.39 0.17 46.43
      20.26 0.17 46.86
      21.68 0.23 35.73
      22.61 0.21 38.63
      25.99 0.18 46.48
      30.98 0.18 45.67
      32.17 0.25 33.19
      40.73 0.23 36.14
      200 mT 10.89 0.18 44.21 41.30
      21.74 0.15 52.58
      26.03 0.20 41.67
      32.90 0.24 34.85
      40.74 0.26 33.20
    • To provide a more intuitive observation of the microstructure of the BSA-C3G complex, scanning electron microscopy was applied[43]. In Fig. 6, the microstructure was observed under different magnetic field strengths and magnified by different observation factors, which shows a more comprehensive and intuitive trend of the composite under a static magnetic field. In the control sample (0 mT), the microscopic surface of the sample revealed aggregated particles in the plane at a magnification of 1 K. In addition to prominent uplift and depression structures, the sample exhibited a rough layer state with fine fracture structures, primarily located at joints within the laminated structure. However, as the magnetic field increased, there was a gradual flattening of the overall structure and an emergence of cavity structures with spherical formations within them.
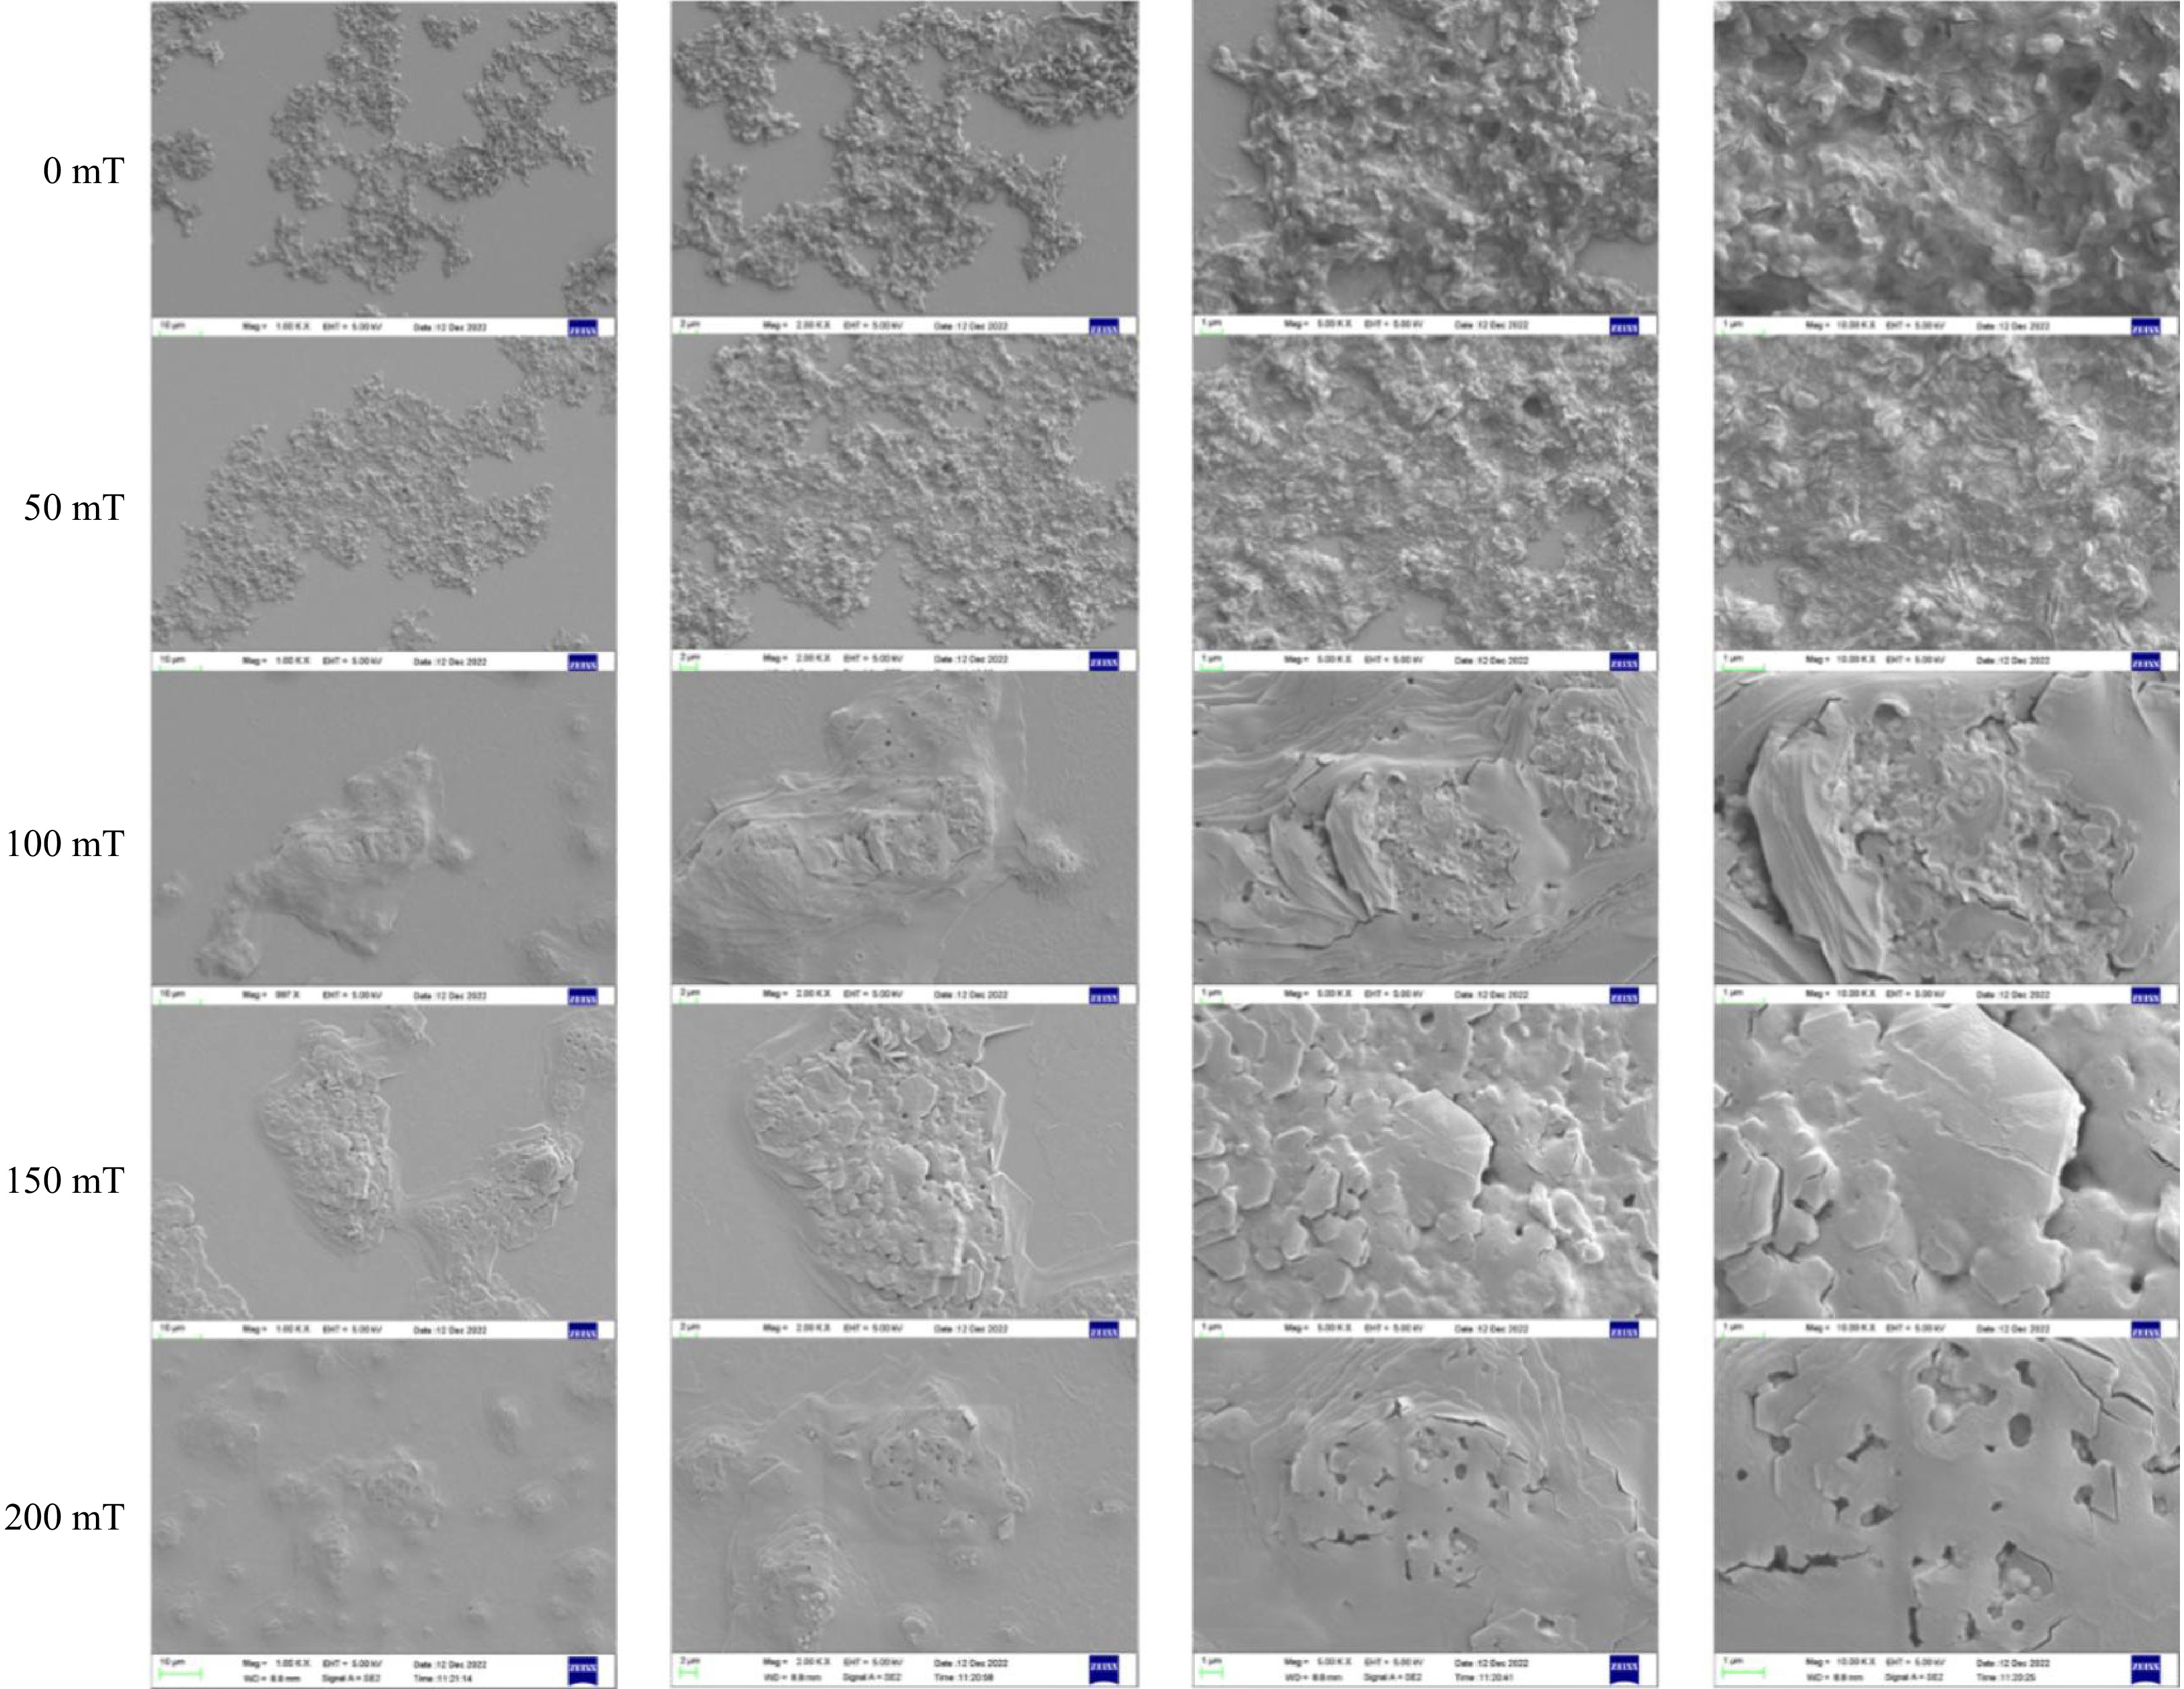
      Figure 6. 

      SEM patterns of BSA-C3G conjugates under different magnetic field conditions.

      Scanning electron microscopy revealed the presence of small spherical anthocyanin molecules at magnifications ranging from 1,000 to 10,000 times[44]. After SMF treatment, the previously disordered stacked structure was reorganized into a more regular arrangement. Furthermore, an increase in the magnetic induction intensity of the SMF resulted in a smoother microstructure of the sample.

    • In the present study, the effect and mechanism of SMF on the interaction between BSA and C3G was investigated. The SMF can affect the secondary structure and unit cell size of the complex, induce the interaction between BSA and C3G molecules, and increase the influence of magnetic induction intensity on the complex. This may be due to the higher magnetic induction intensity, the greater the dipole moment between molecules, and the greater the degree of directional rearrangement of complex molecules. These findings provide insights into the mechanism by which SMF interacts with proteins and anthocyanins, provide a basis for SMF to promote their binding, and point out a new possible pathway for improving anthocyanin stability. In future research, the reaction pathway of this complex in vivo can be further explored to investigate its wide targeted reaction process in living organisms.

      • This research was partially supported by the Natural Science Foundation of Liaoning Province, China (2023-MS-205).

      • The authors confirm contribution to the paper as follows: conceptualization: Li D, Zhang Z; methodology: Zhang Z, Shen Y; data curation: Zhang Z, Xin G; formal analysis and visualization: Zhang Z, Deng W; writing - original draft: Zhang Z; writing-review & editing: Zhang Z, Deng W, Adel Ashour A, Tan H; funding acquisition and supervision: Li D. All authors reviewed the results and approved the final version of the manuscript.

      • All data generated or analyzed during this study are included in this published article and its supplementary information files.

      • The authors declare that they have no conflict of interest.

      • Copyright: © 2024 by the author(s). Published by Maximum Academic Press on behalf of China Agricultural University, Zhejiang University and Shenyang Agricultural University. This article is an open access article distributed under Creative Commons Attribution License (CC BY 4.0), visit https://creativecommons.org/licenses/by/4.0/.
    Figure (6)  Table (2) References (44)
  • About this article
    Cite this article
    Zhang Z, Shen Y, Xin G, Deng W, Tan H, et al. 2024. The effect of static magnetic field on inducing the binding of bovine serum albumin and cyanidin-3-O-glucoside. Food Innovation and Advances 3(4): 449−456 doi: 10.48130/fia-0024-0042
    Zhang Z, Shen Y, Xin G, Deng W, Tan H, et al. 2024. The effect of static magnetic field on inducing the binding of bovine serum albumin and cyanidin-3-O-glucoside. Food Innovation and Advances 3(4): 449−456 doi: 10.48130/fia-0024-0042

Catalog

  • About this article

/

DownLoad:  Full-Size Img  PowerPoint
Return
Return