-
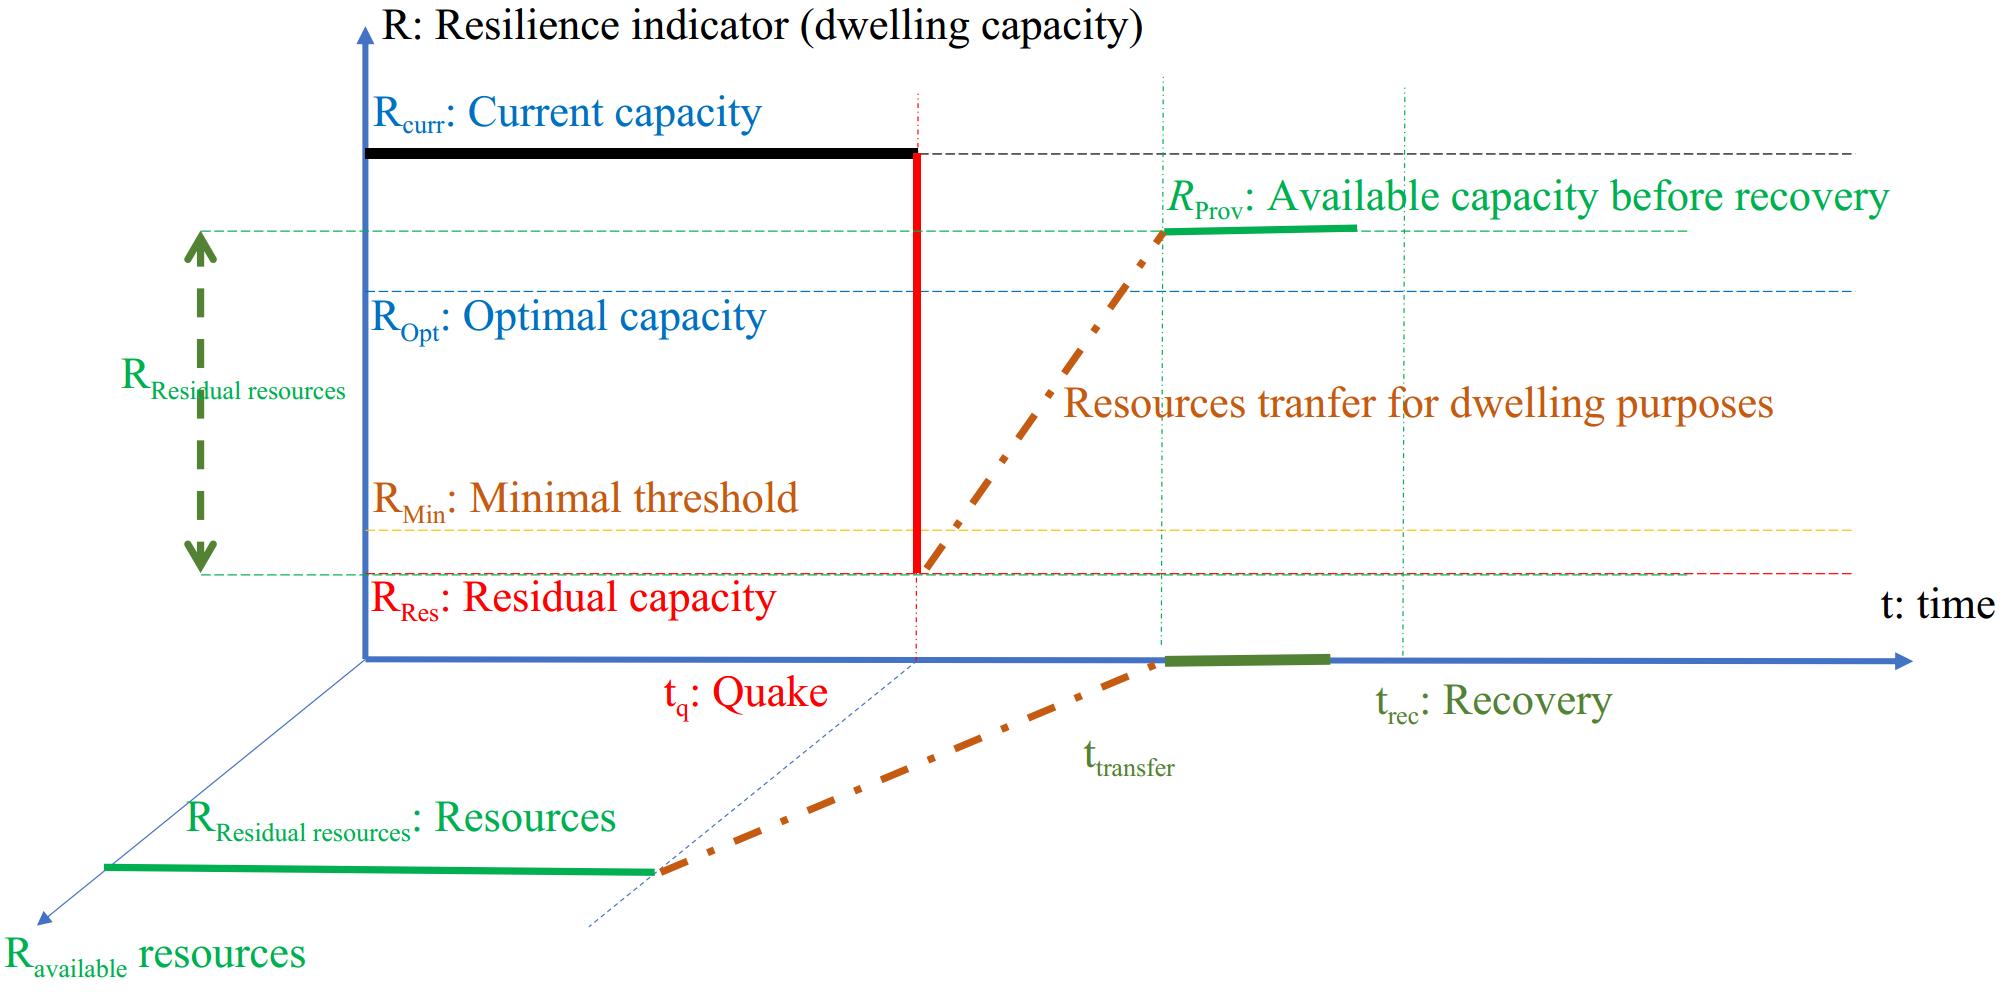
Figure 1.
Resilience indicator: dwelling and sheltering capacity as a utility function.
-
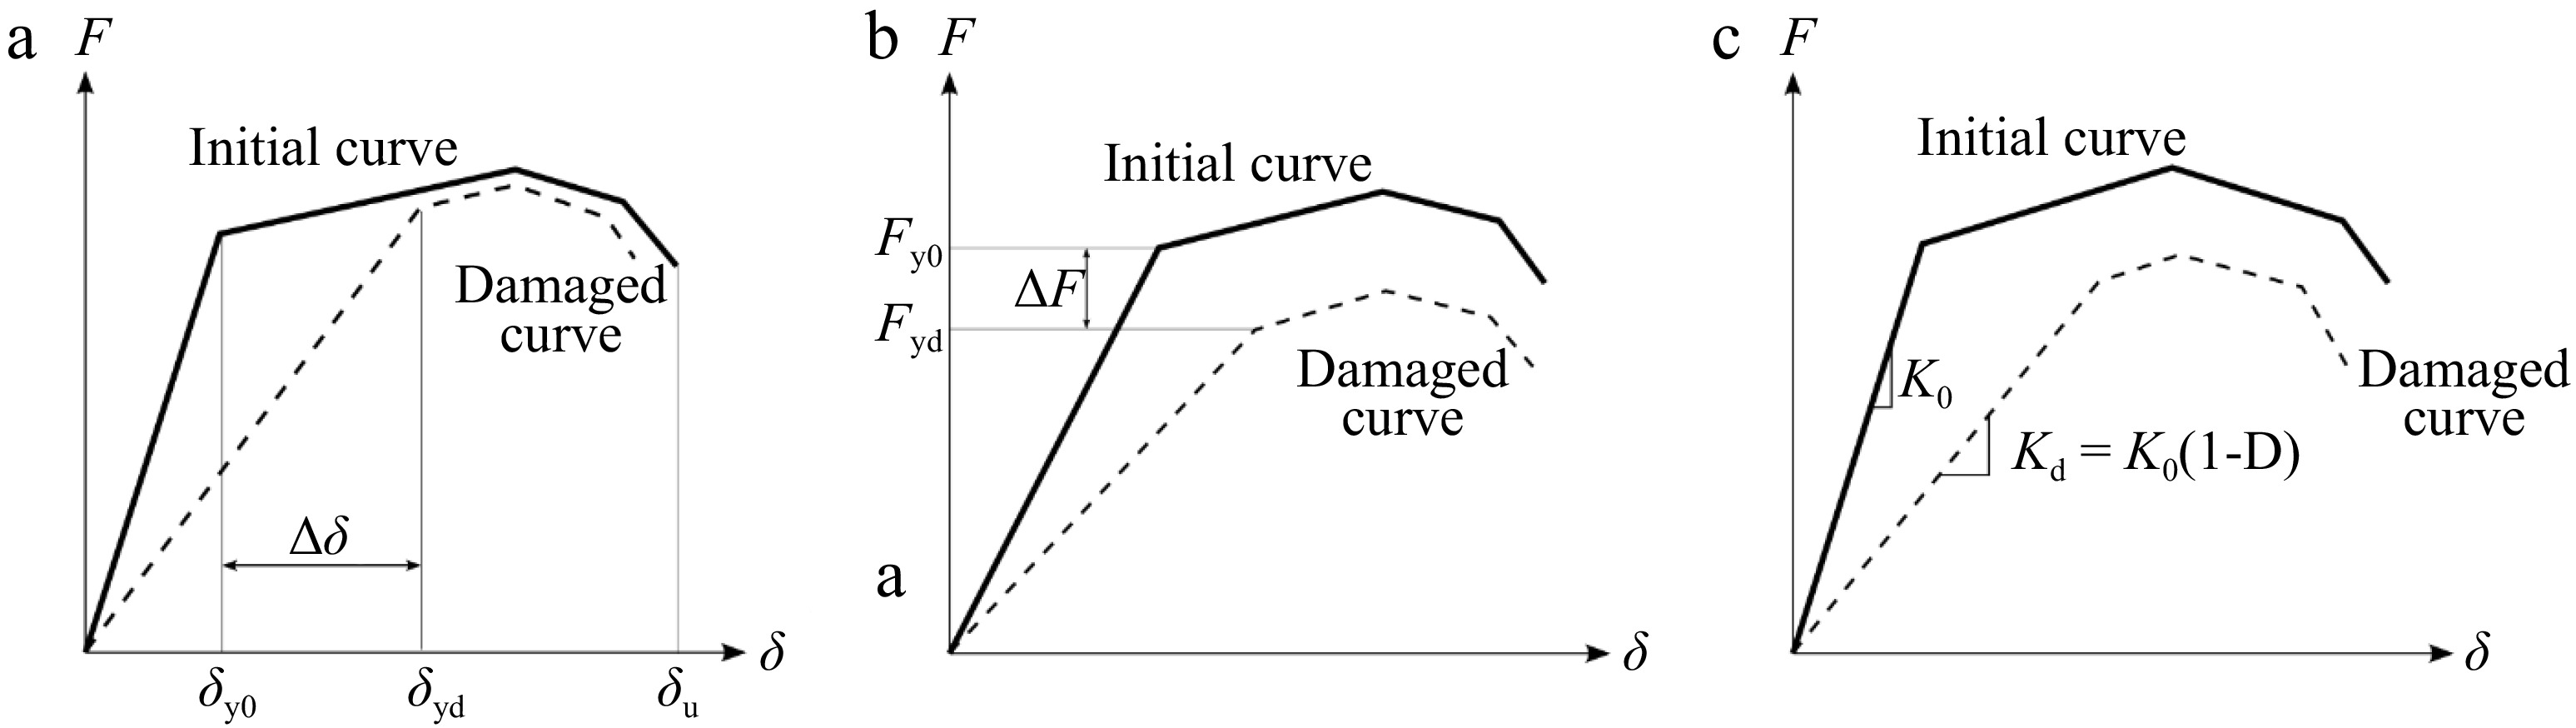
Figure 2.
Different strategies for damage identification. (a) Change in displacement patterns; (b) Reduction in bearing capacity; (c) Reduction in stiffness.
-
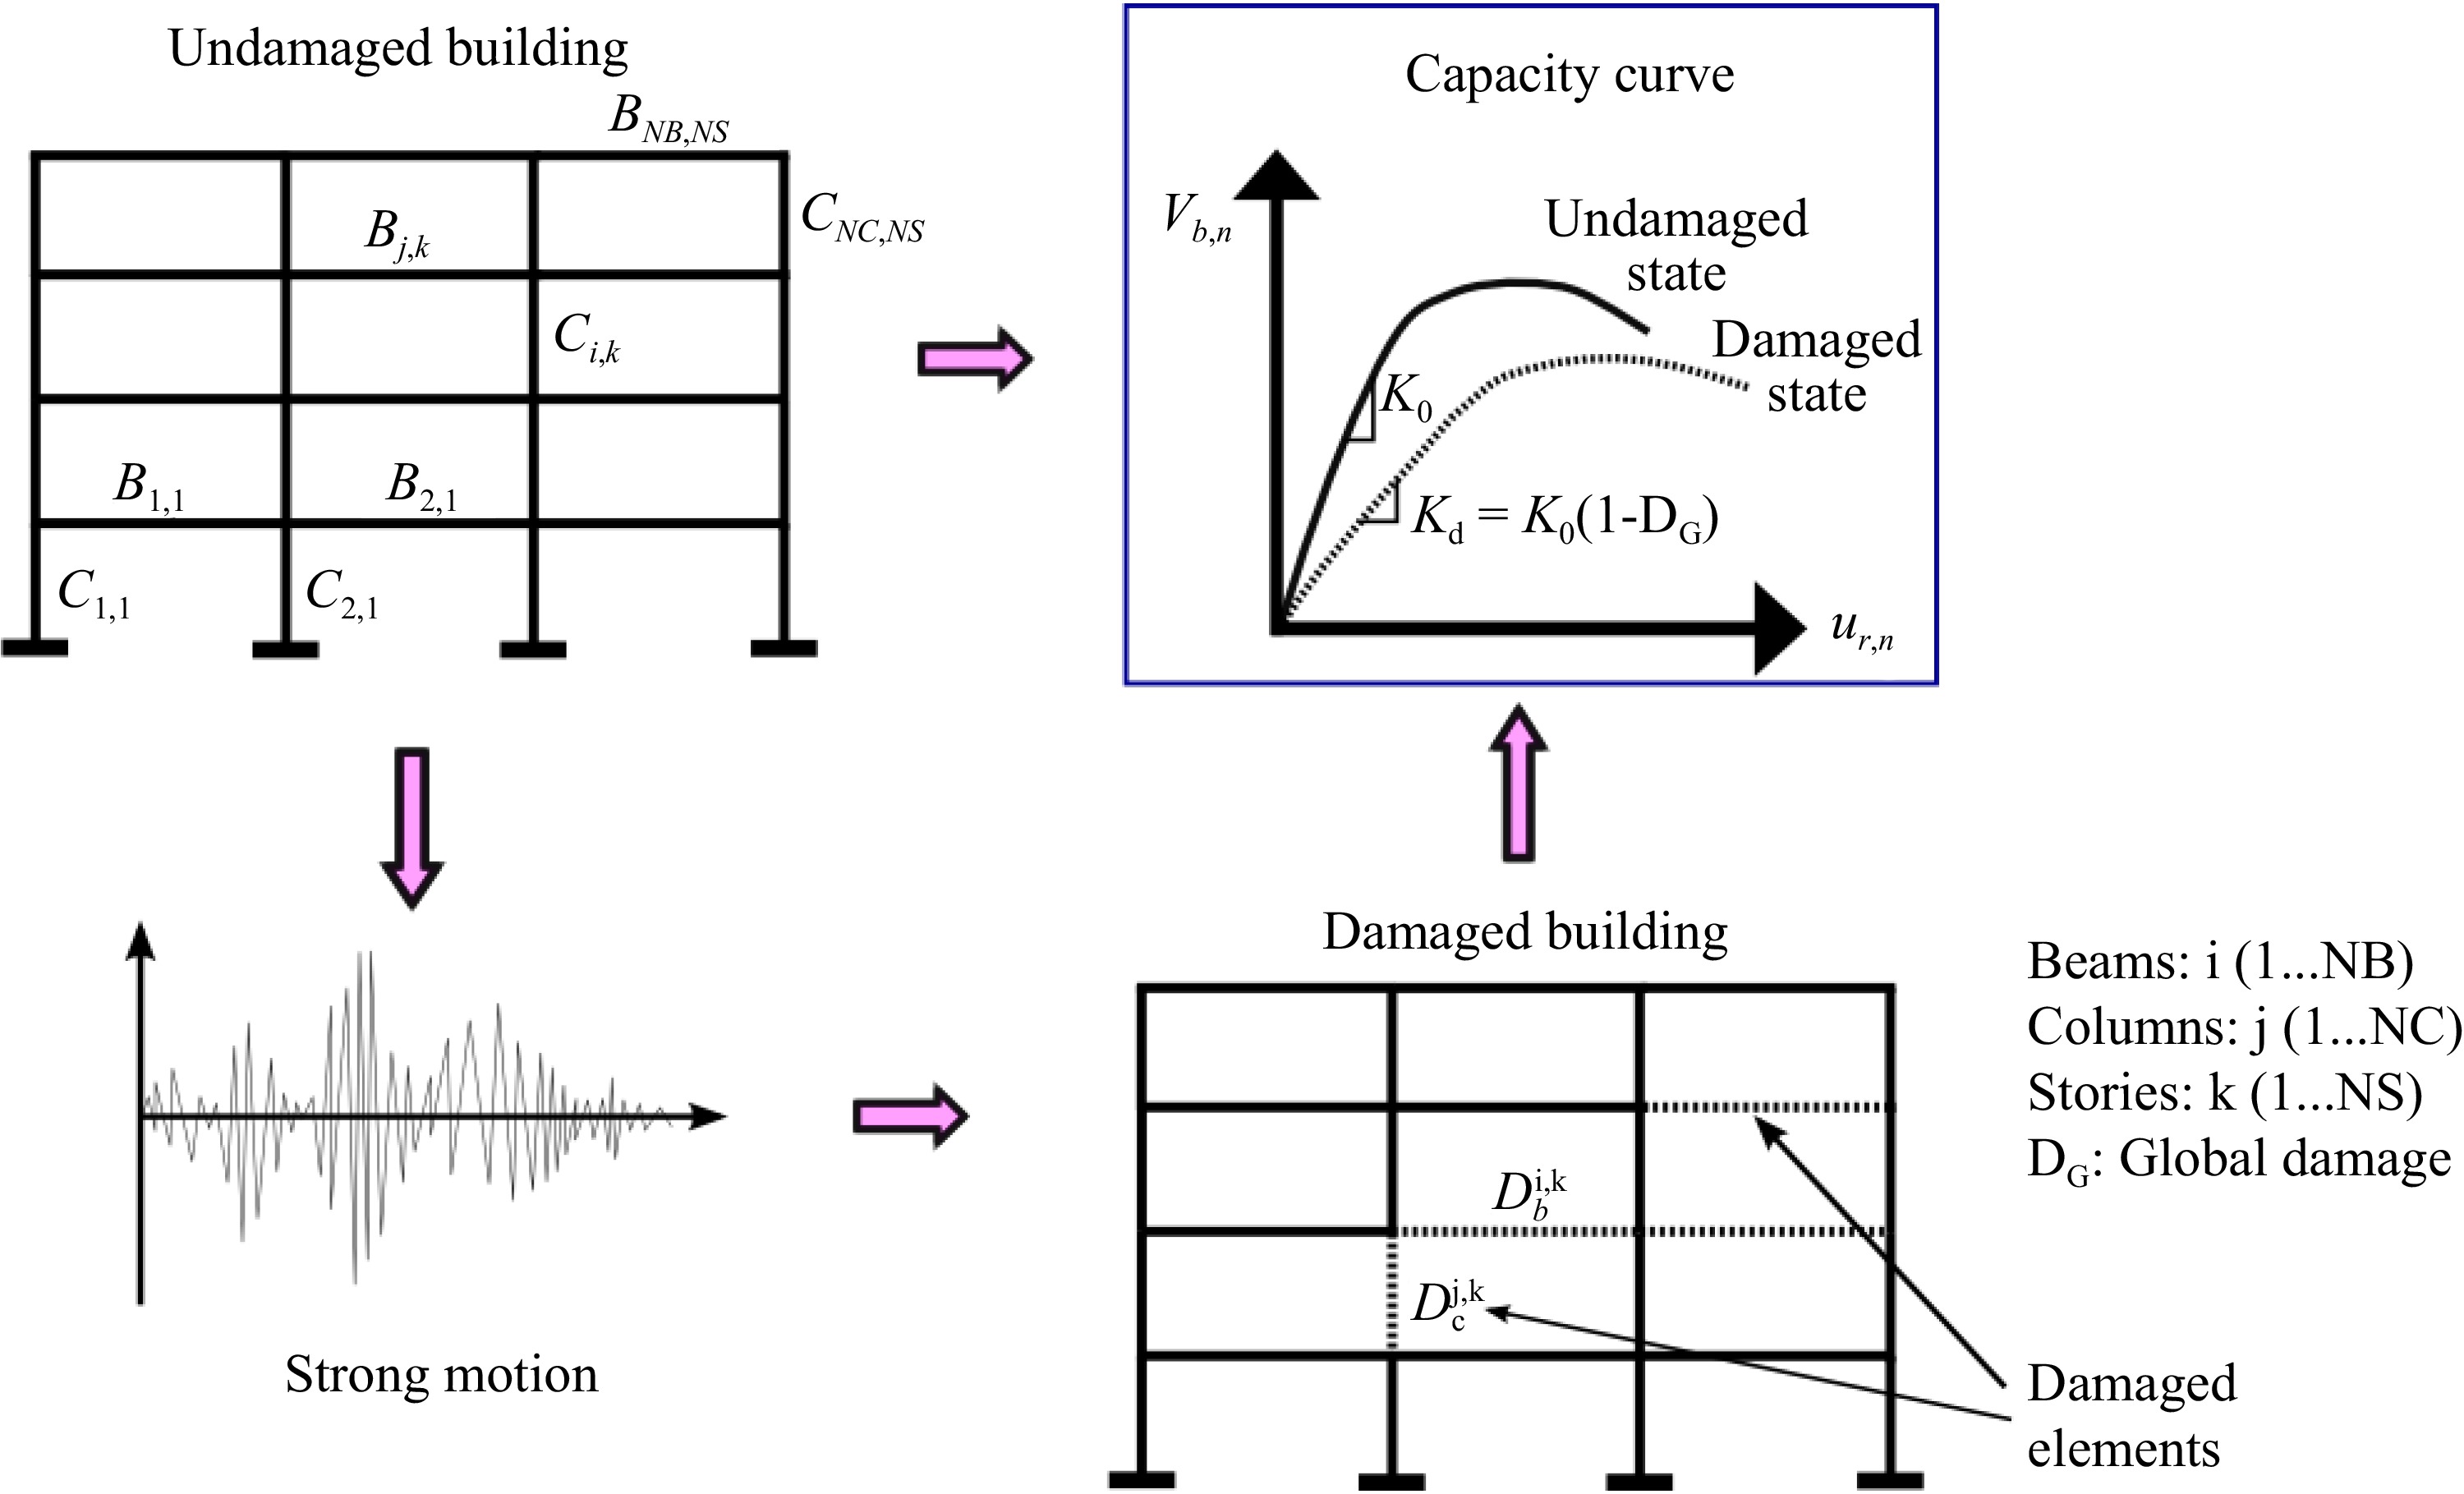
Figure 3.
Evaluation of global damage through the changes in the capacity curve stiffness.
-
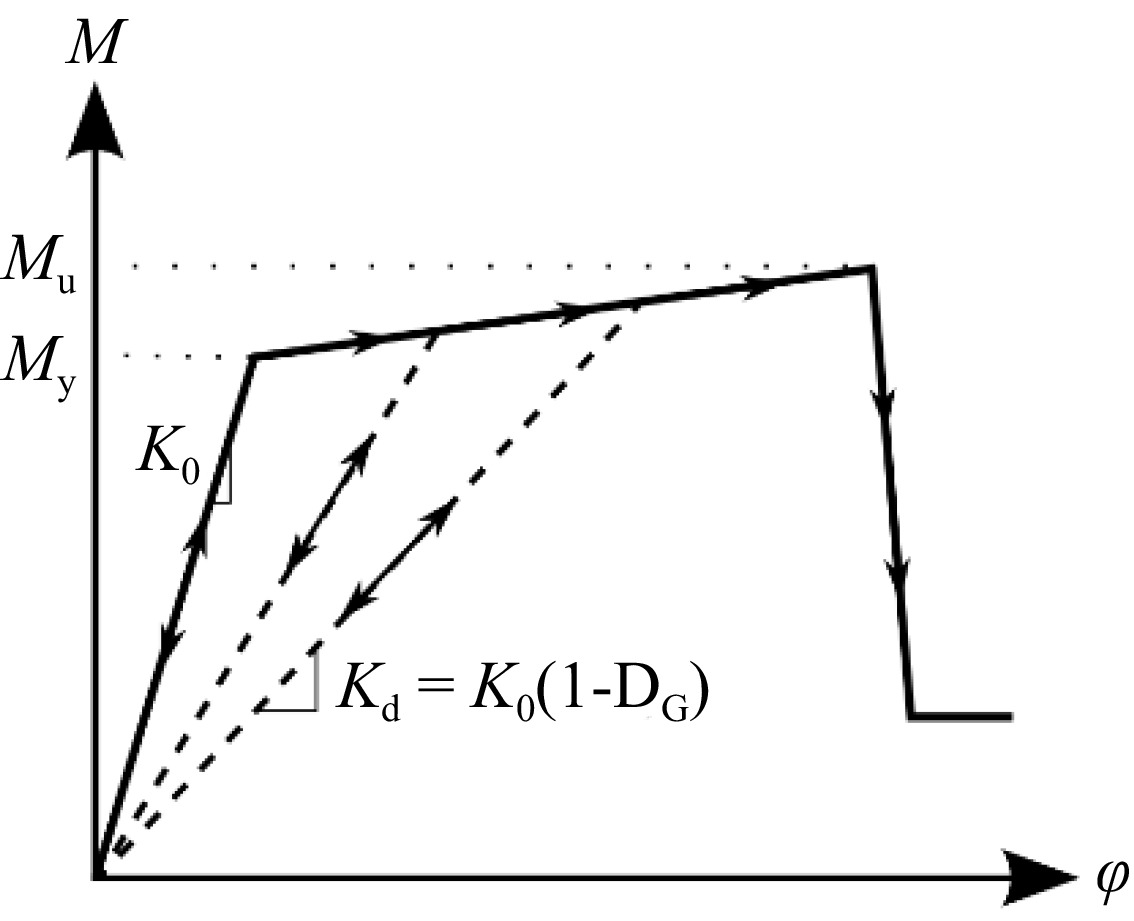
Figure 4.
Nonlinear degrading model used to simulate damage on beams and columns.
-
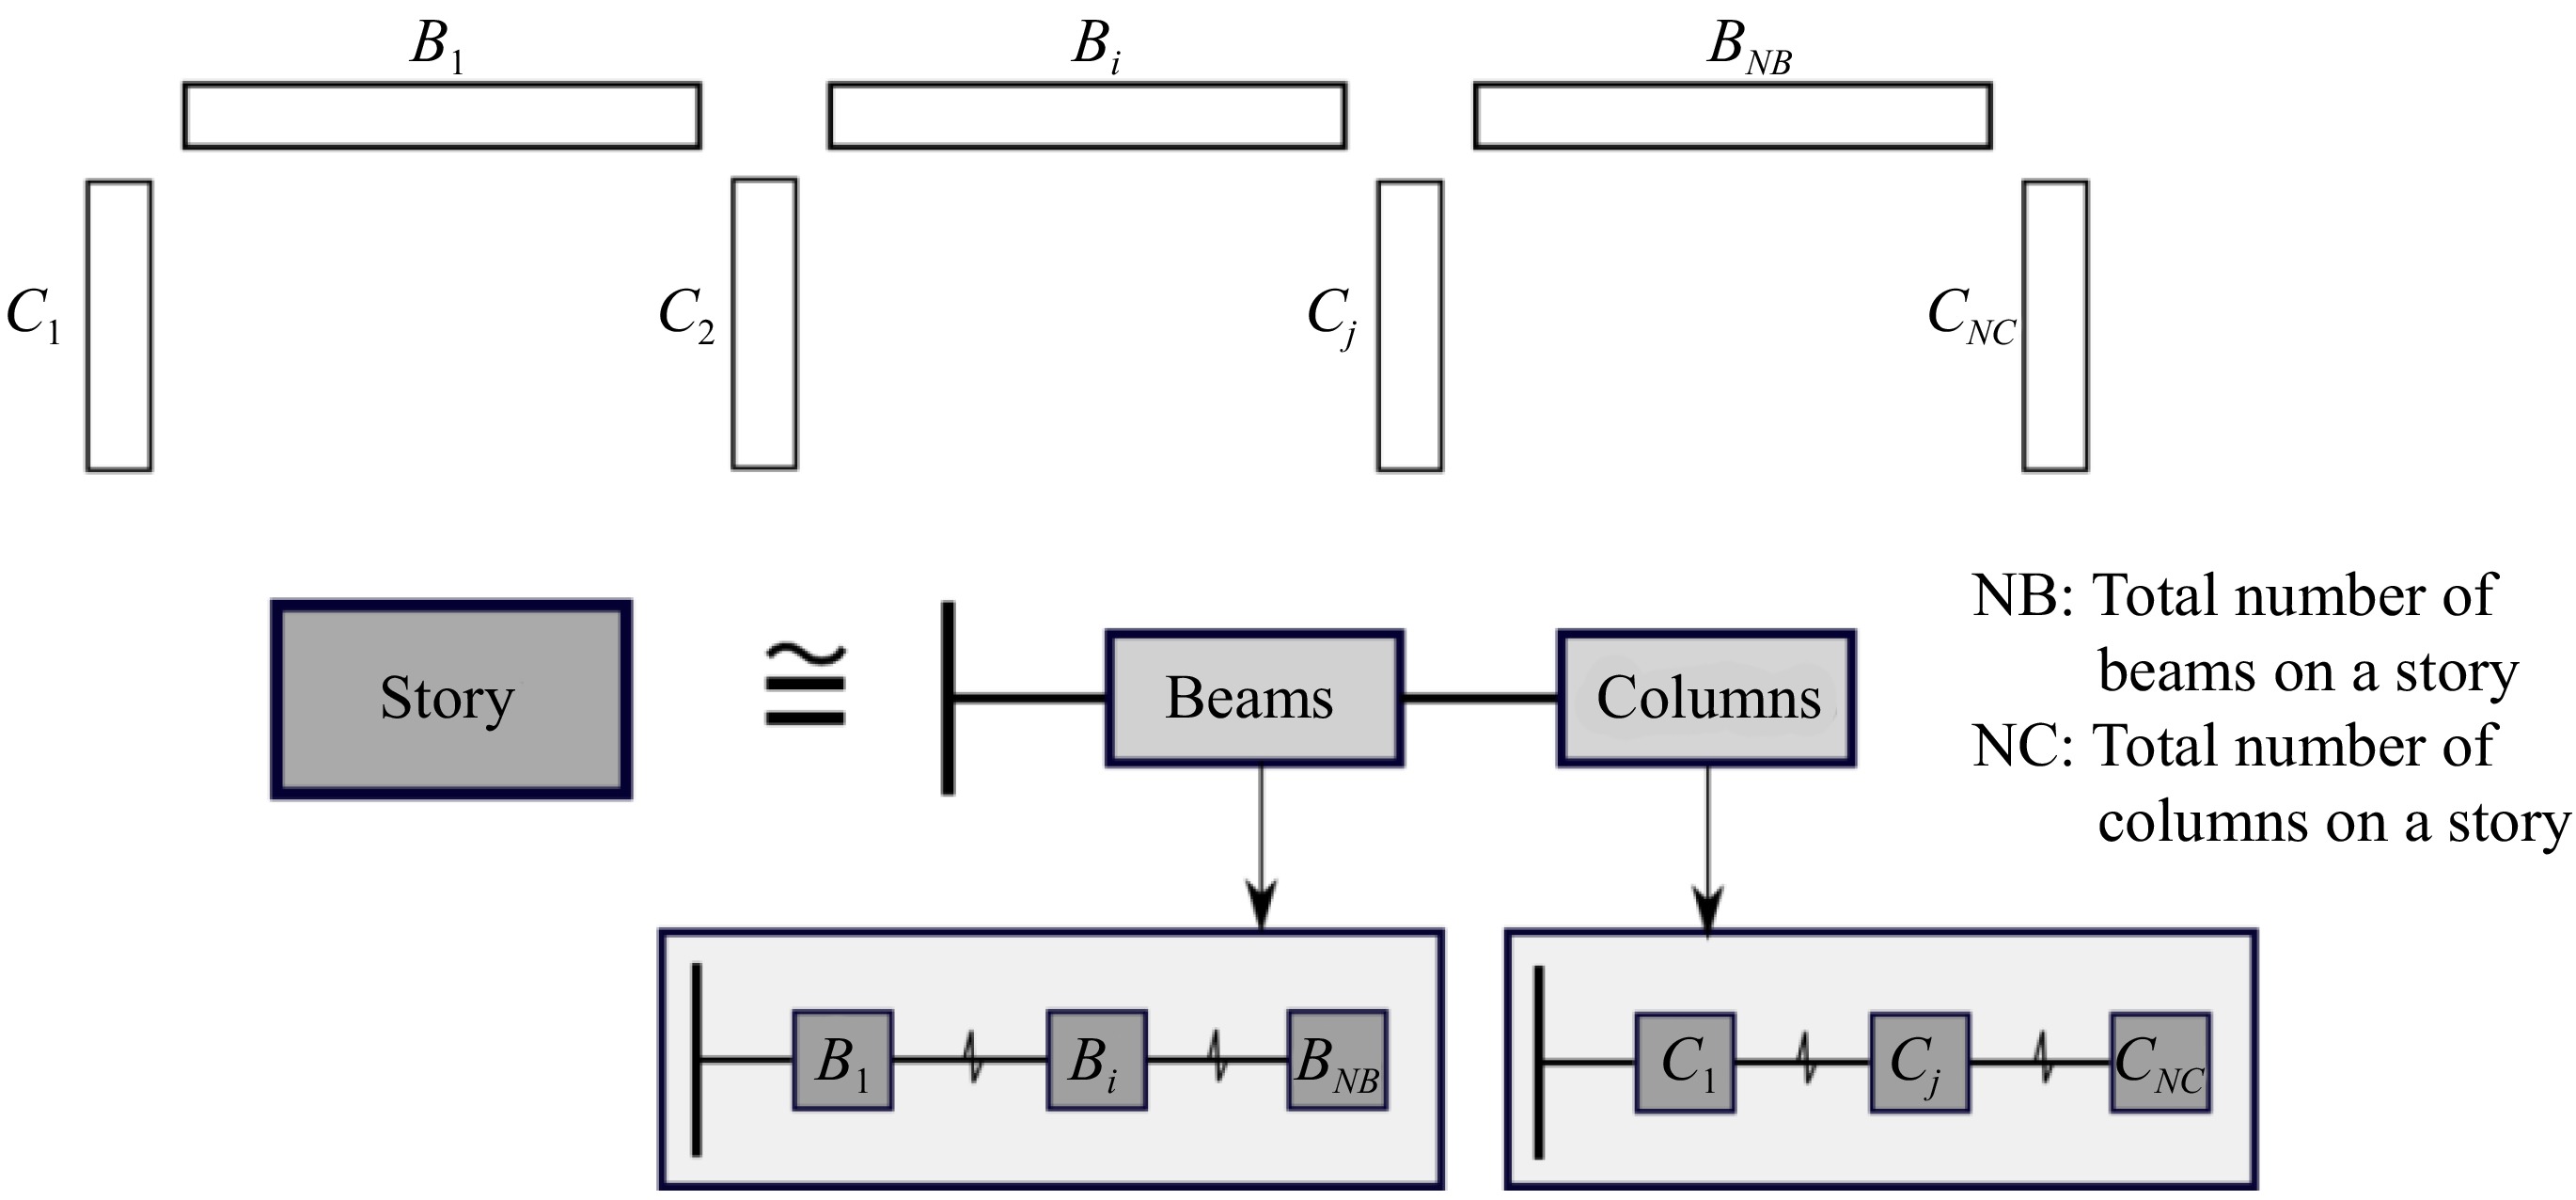
Figure 5.
Story series system of NB beams and NC columns.
-
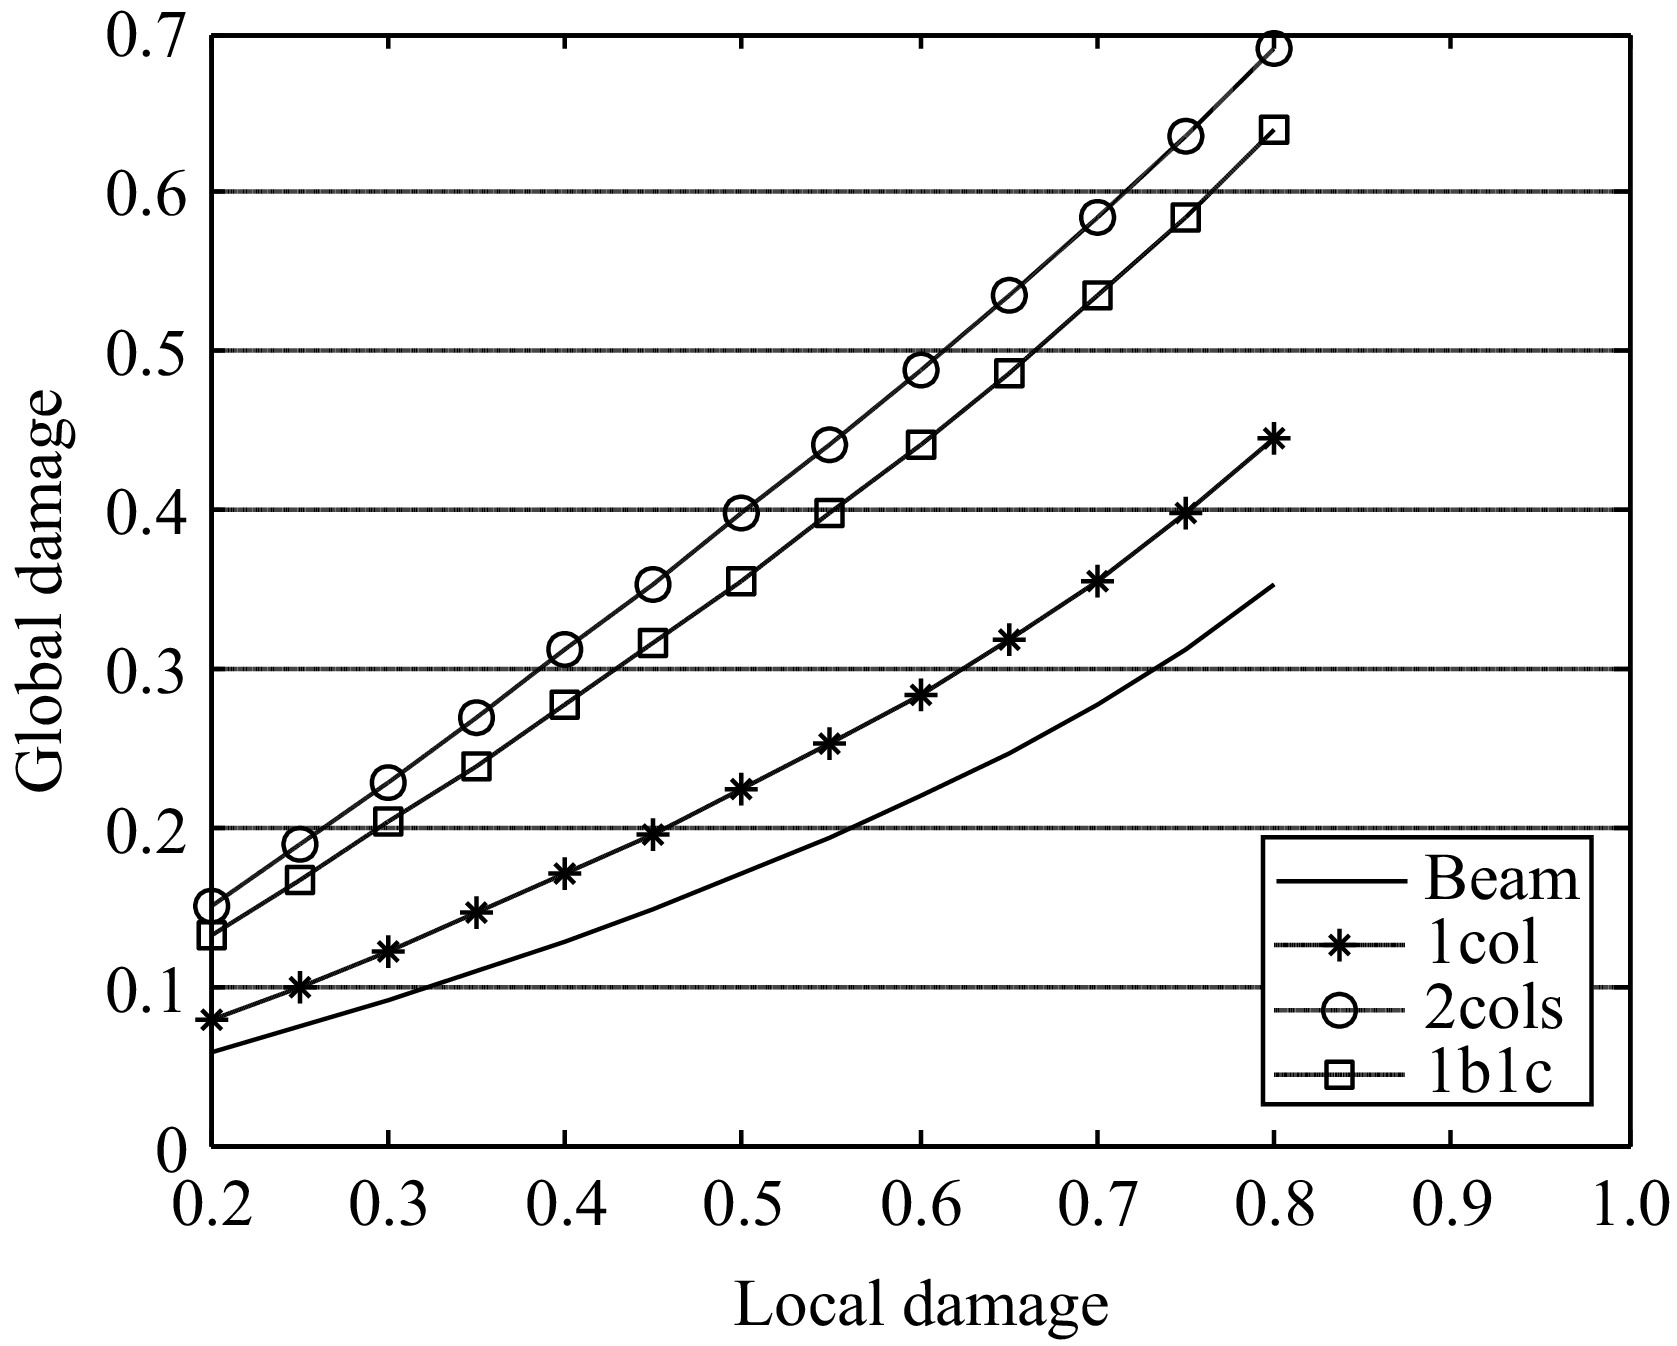
Figure 6.
Influence of local damage at each element on a 1-bay, 1-story frame.
-
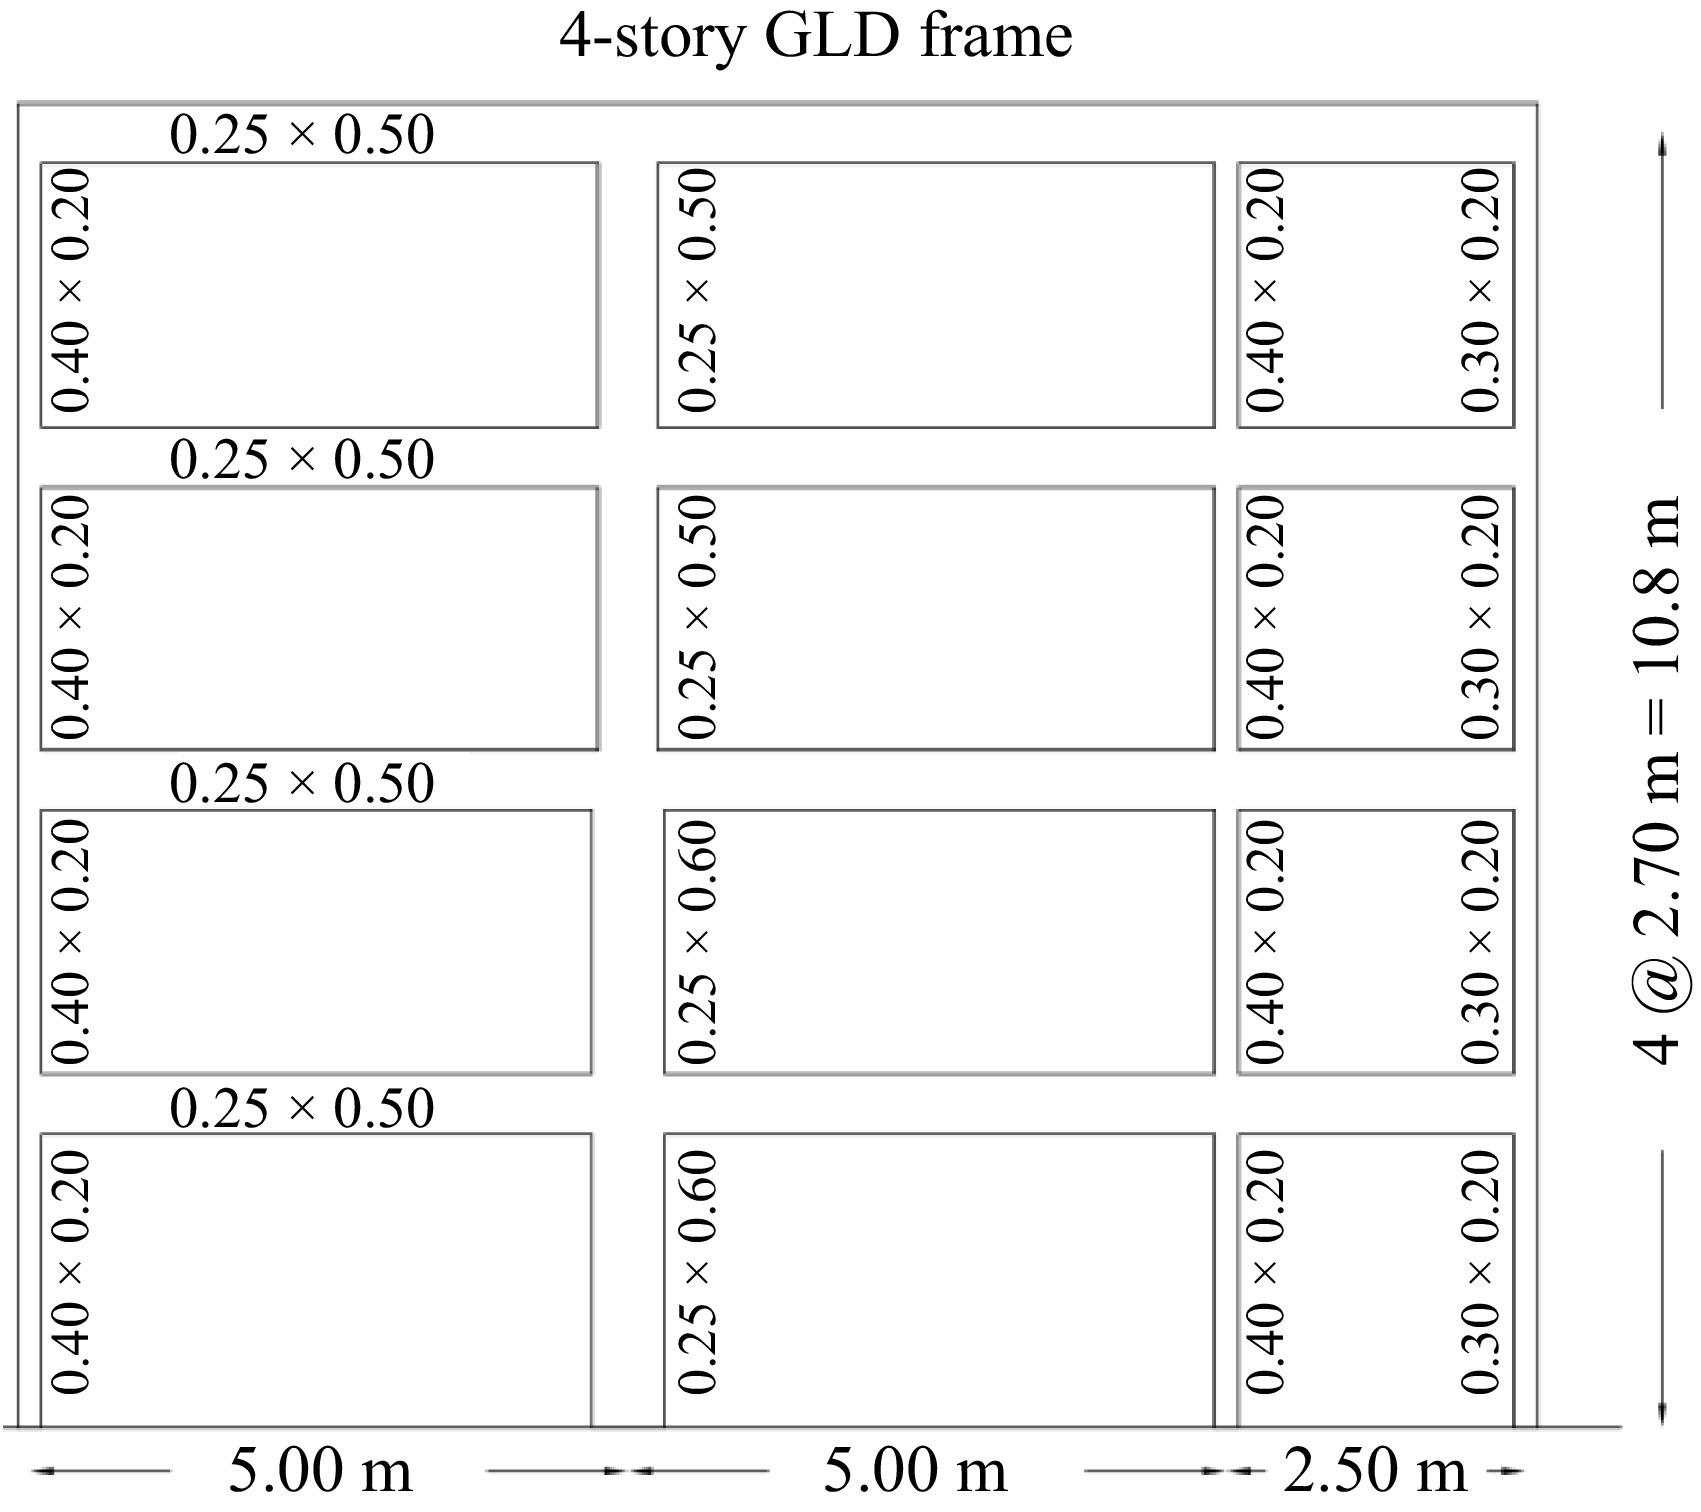
Figure 7.
Elevation view of the 4 GLD building.
-
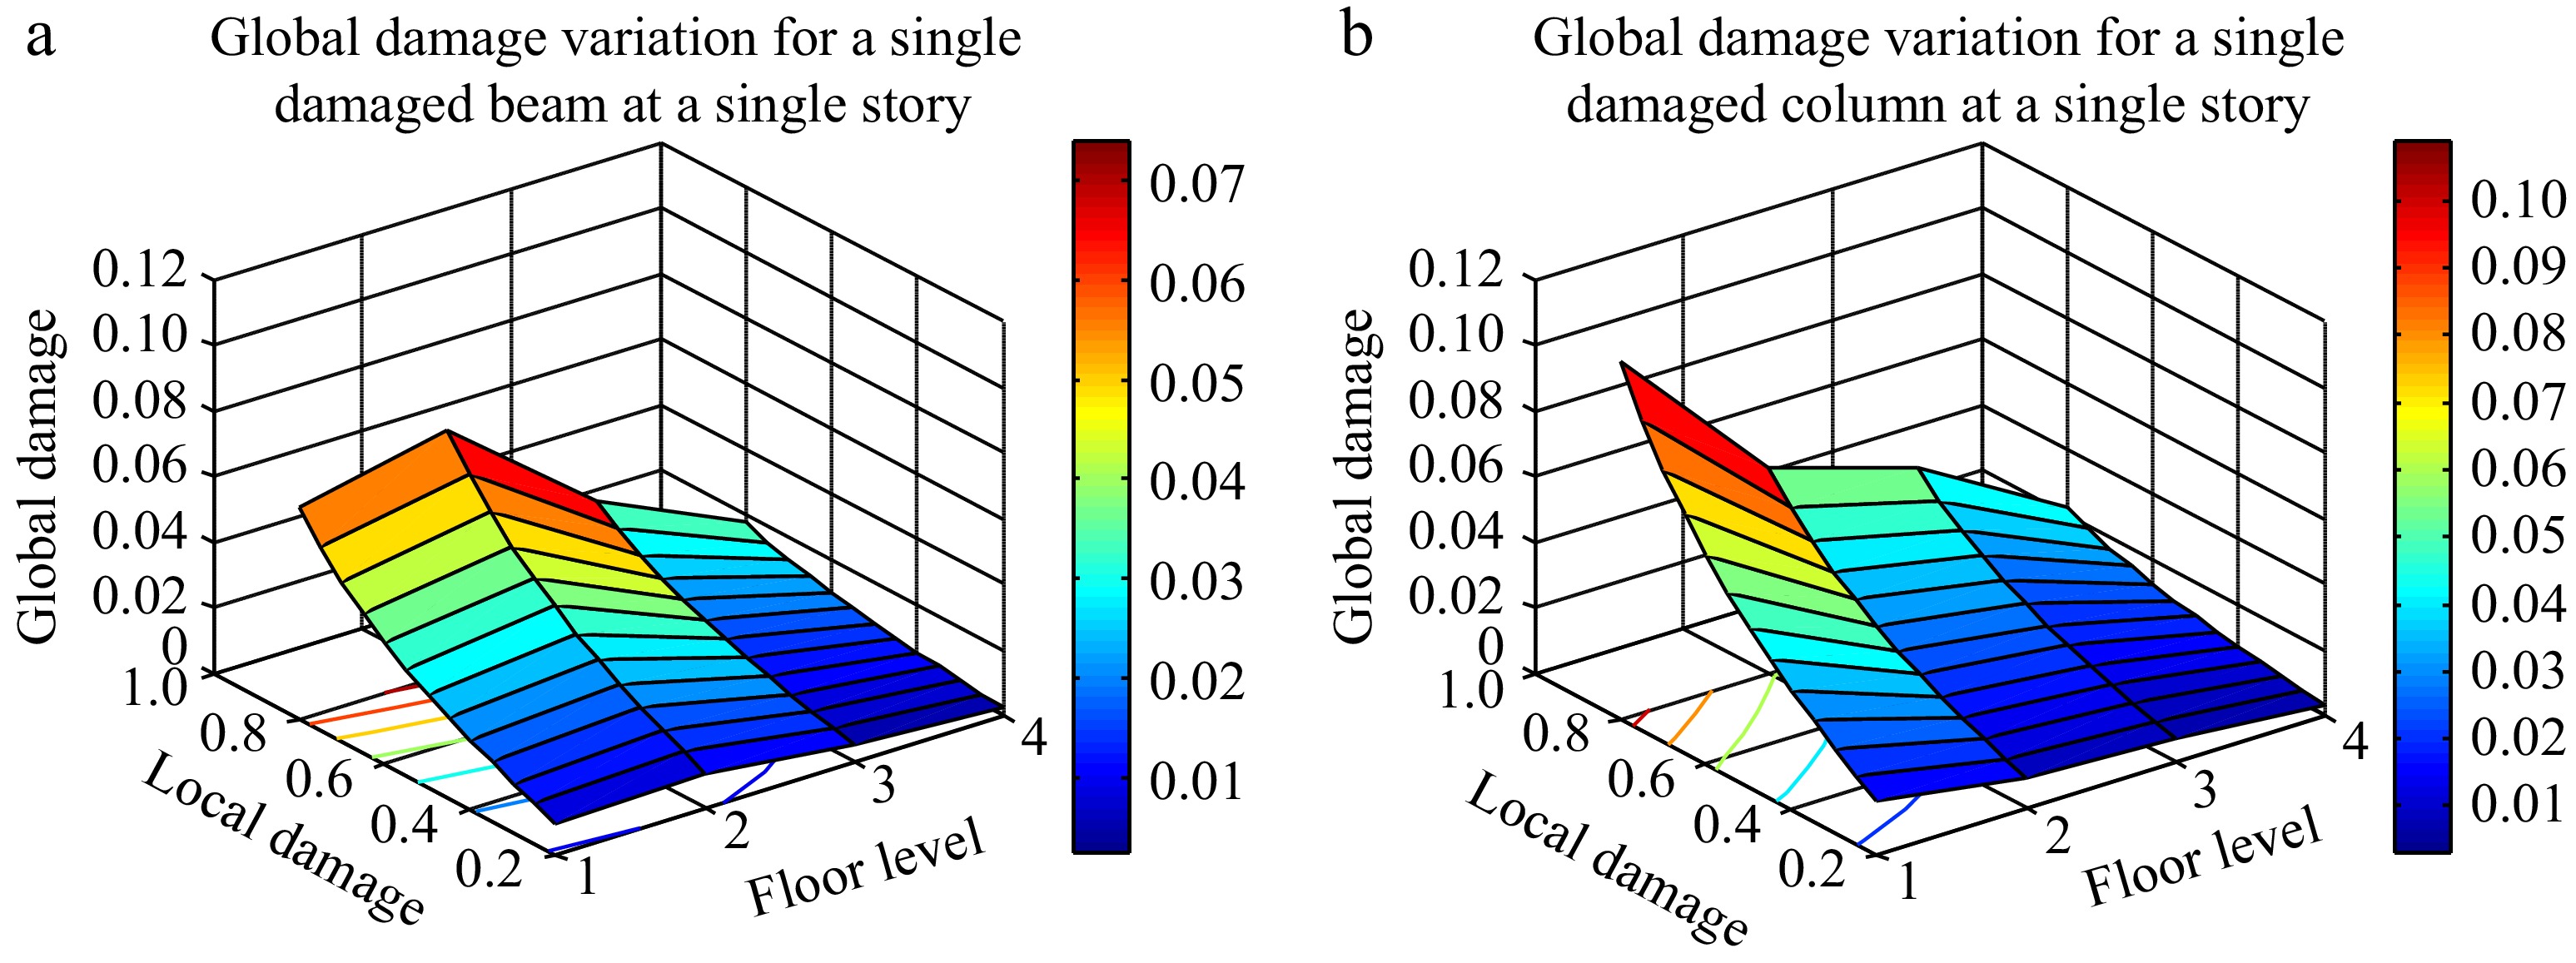
Figure 8.
Global damage index when a single element is damaged: (a) beams, (b) columns.
-
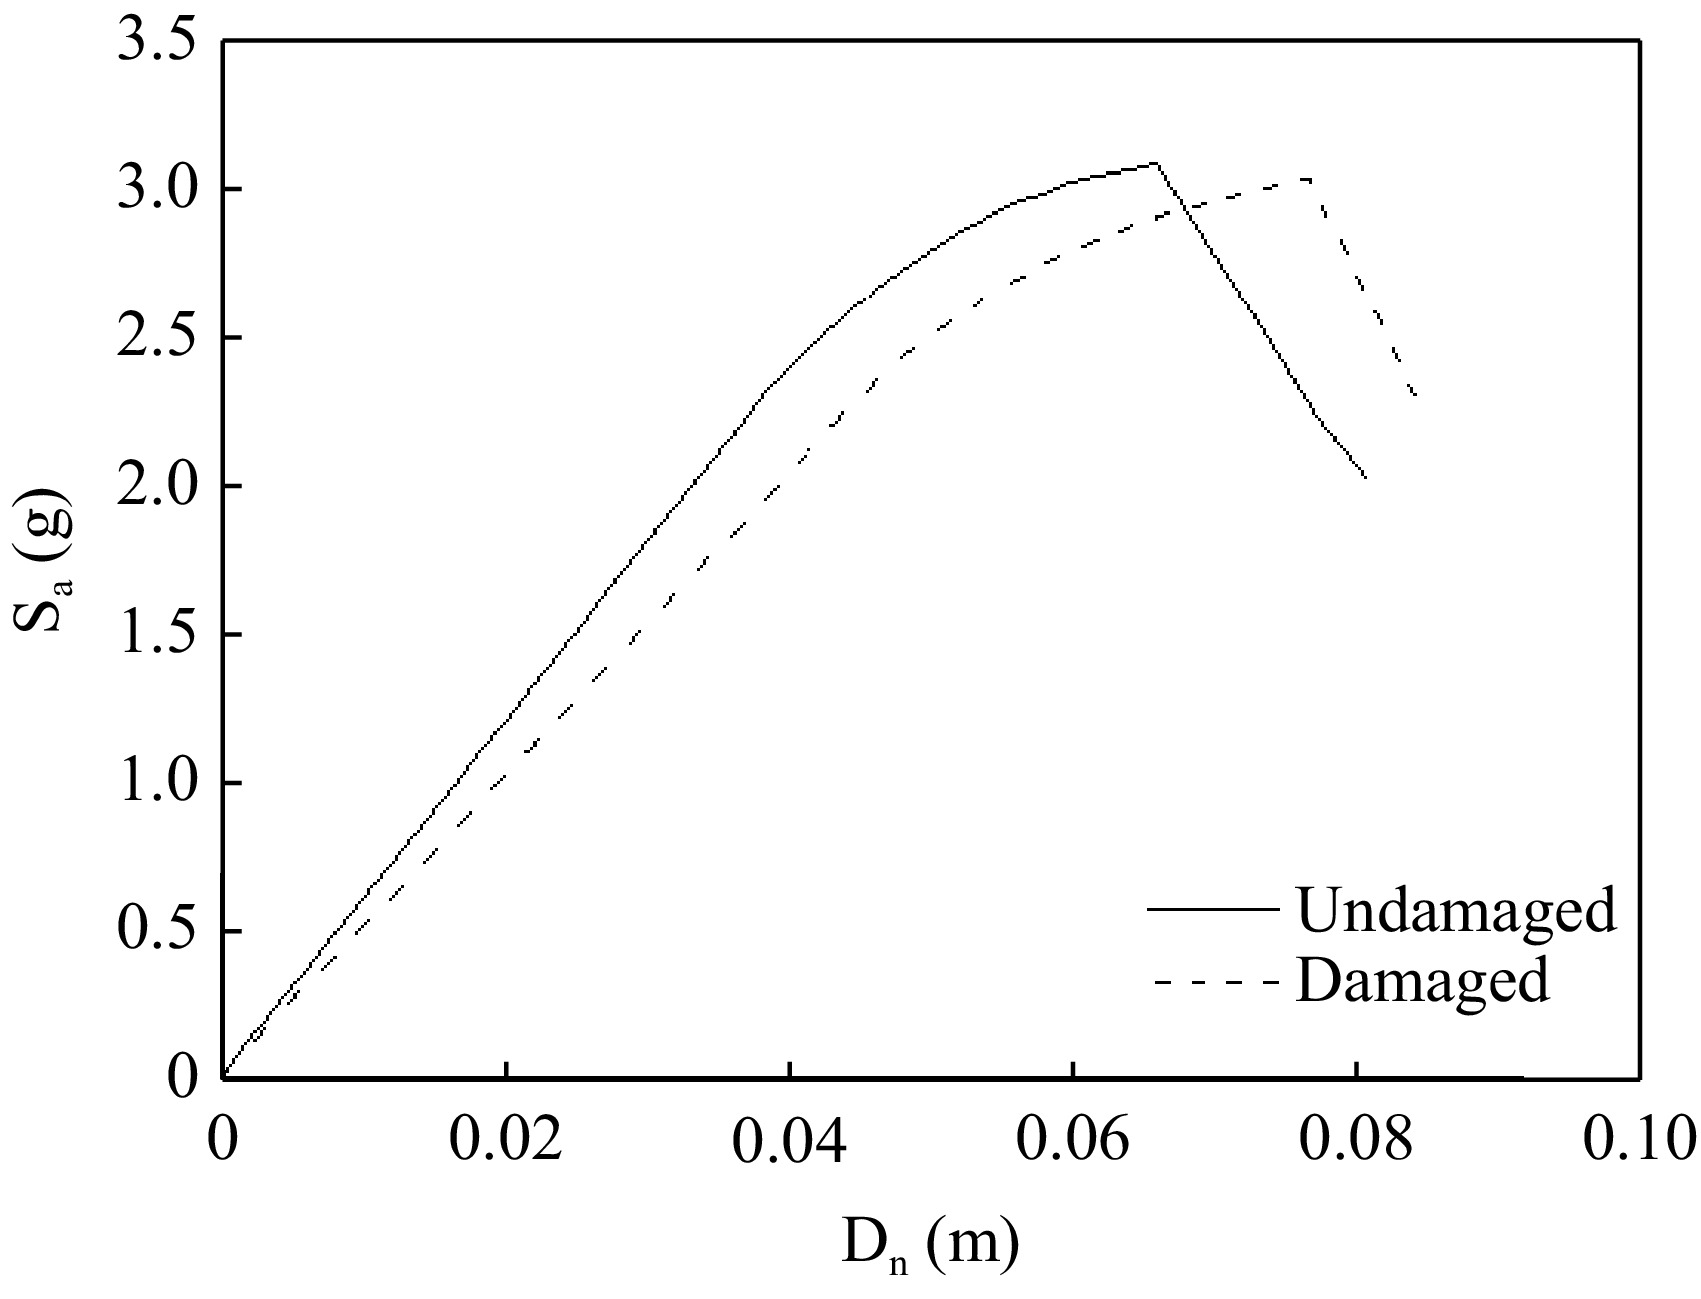
Figure 9.
Capacity spectra of the 4-story GLD frame.
-
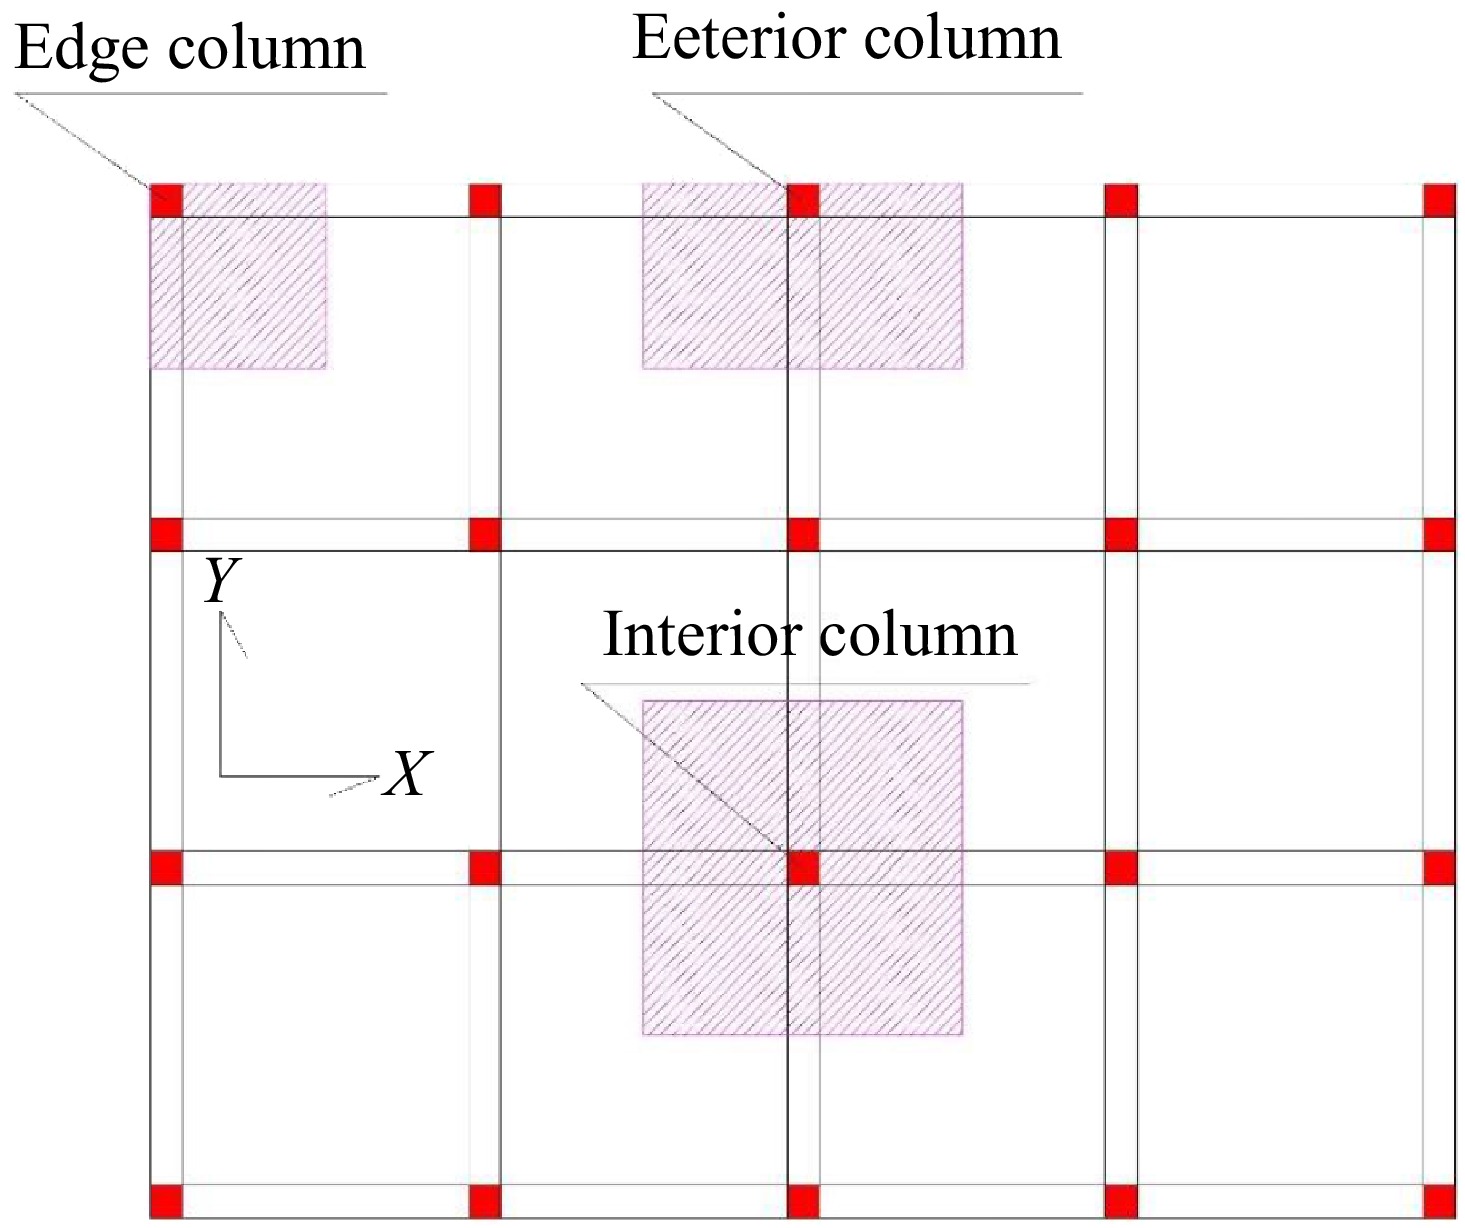
Figure 10.
Tributary areas for columns: "Edge, exterior and interior" column.
-
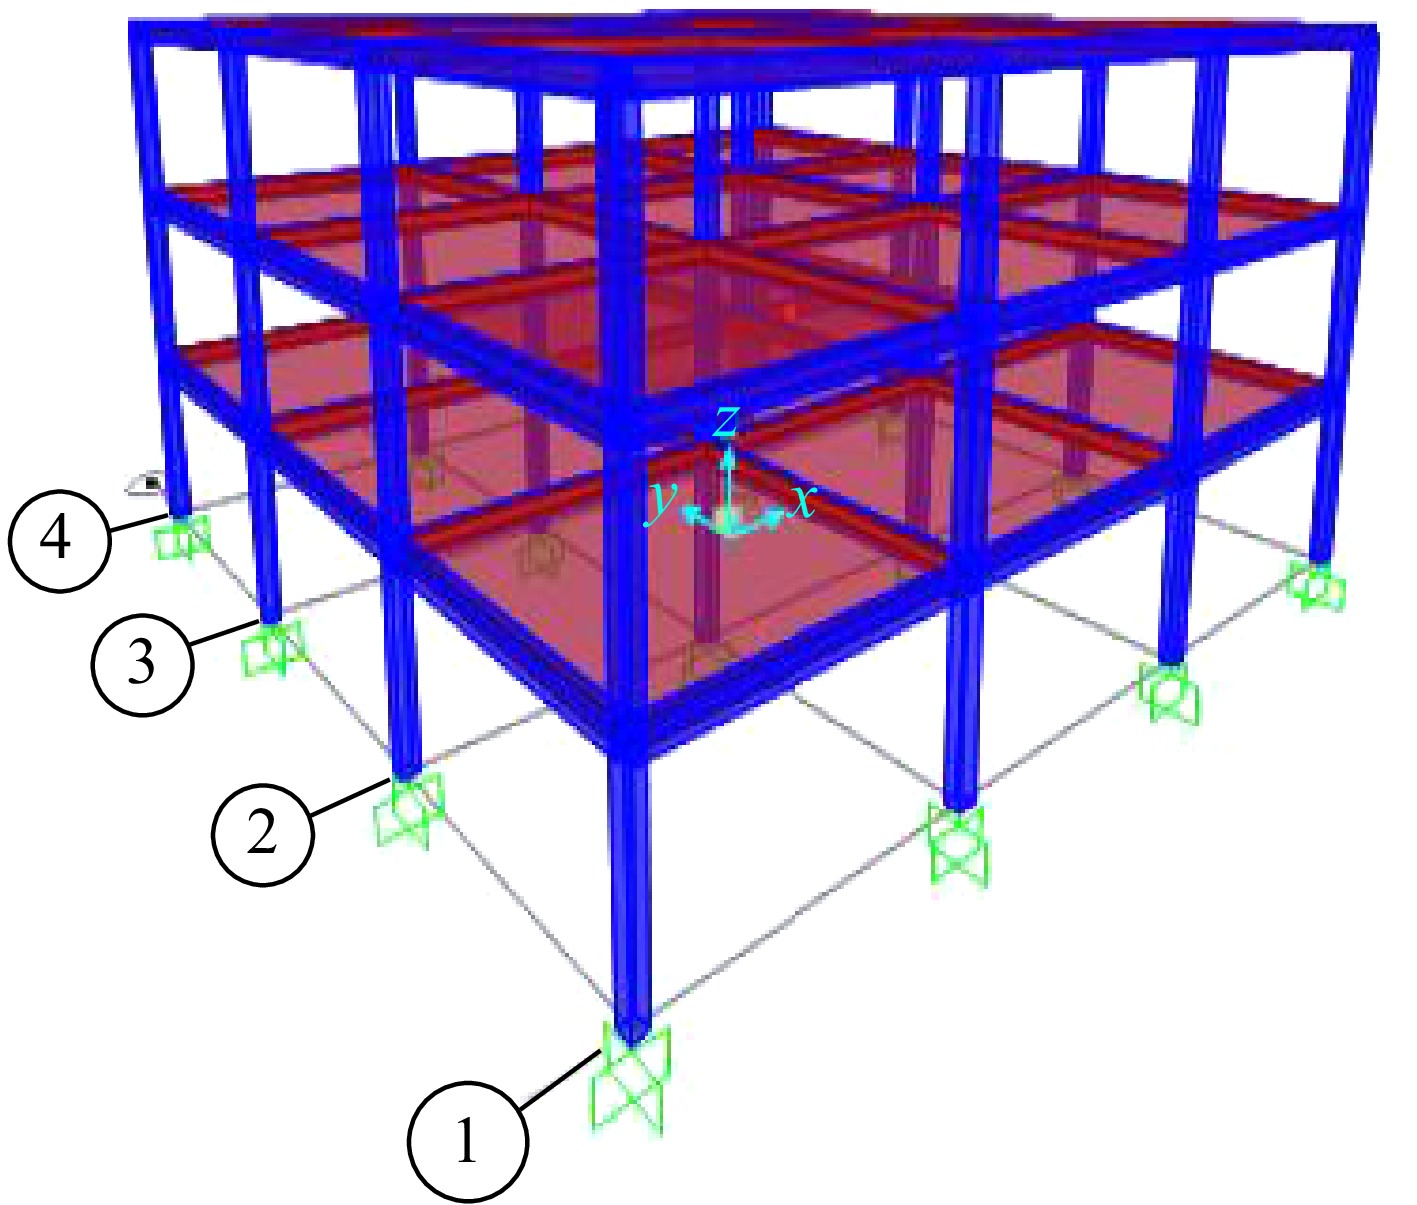
Figure 11.
The 3D building.
-
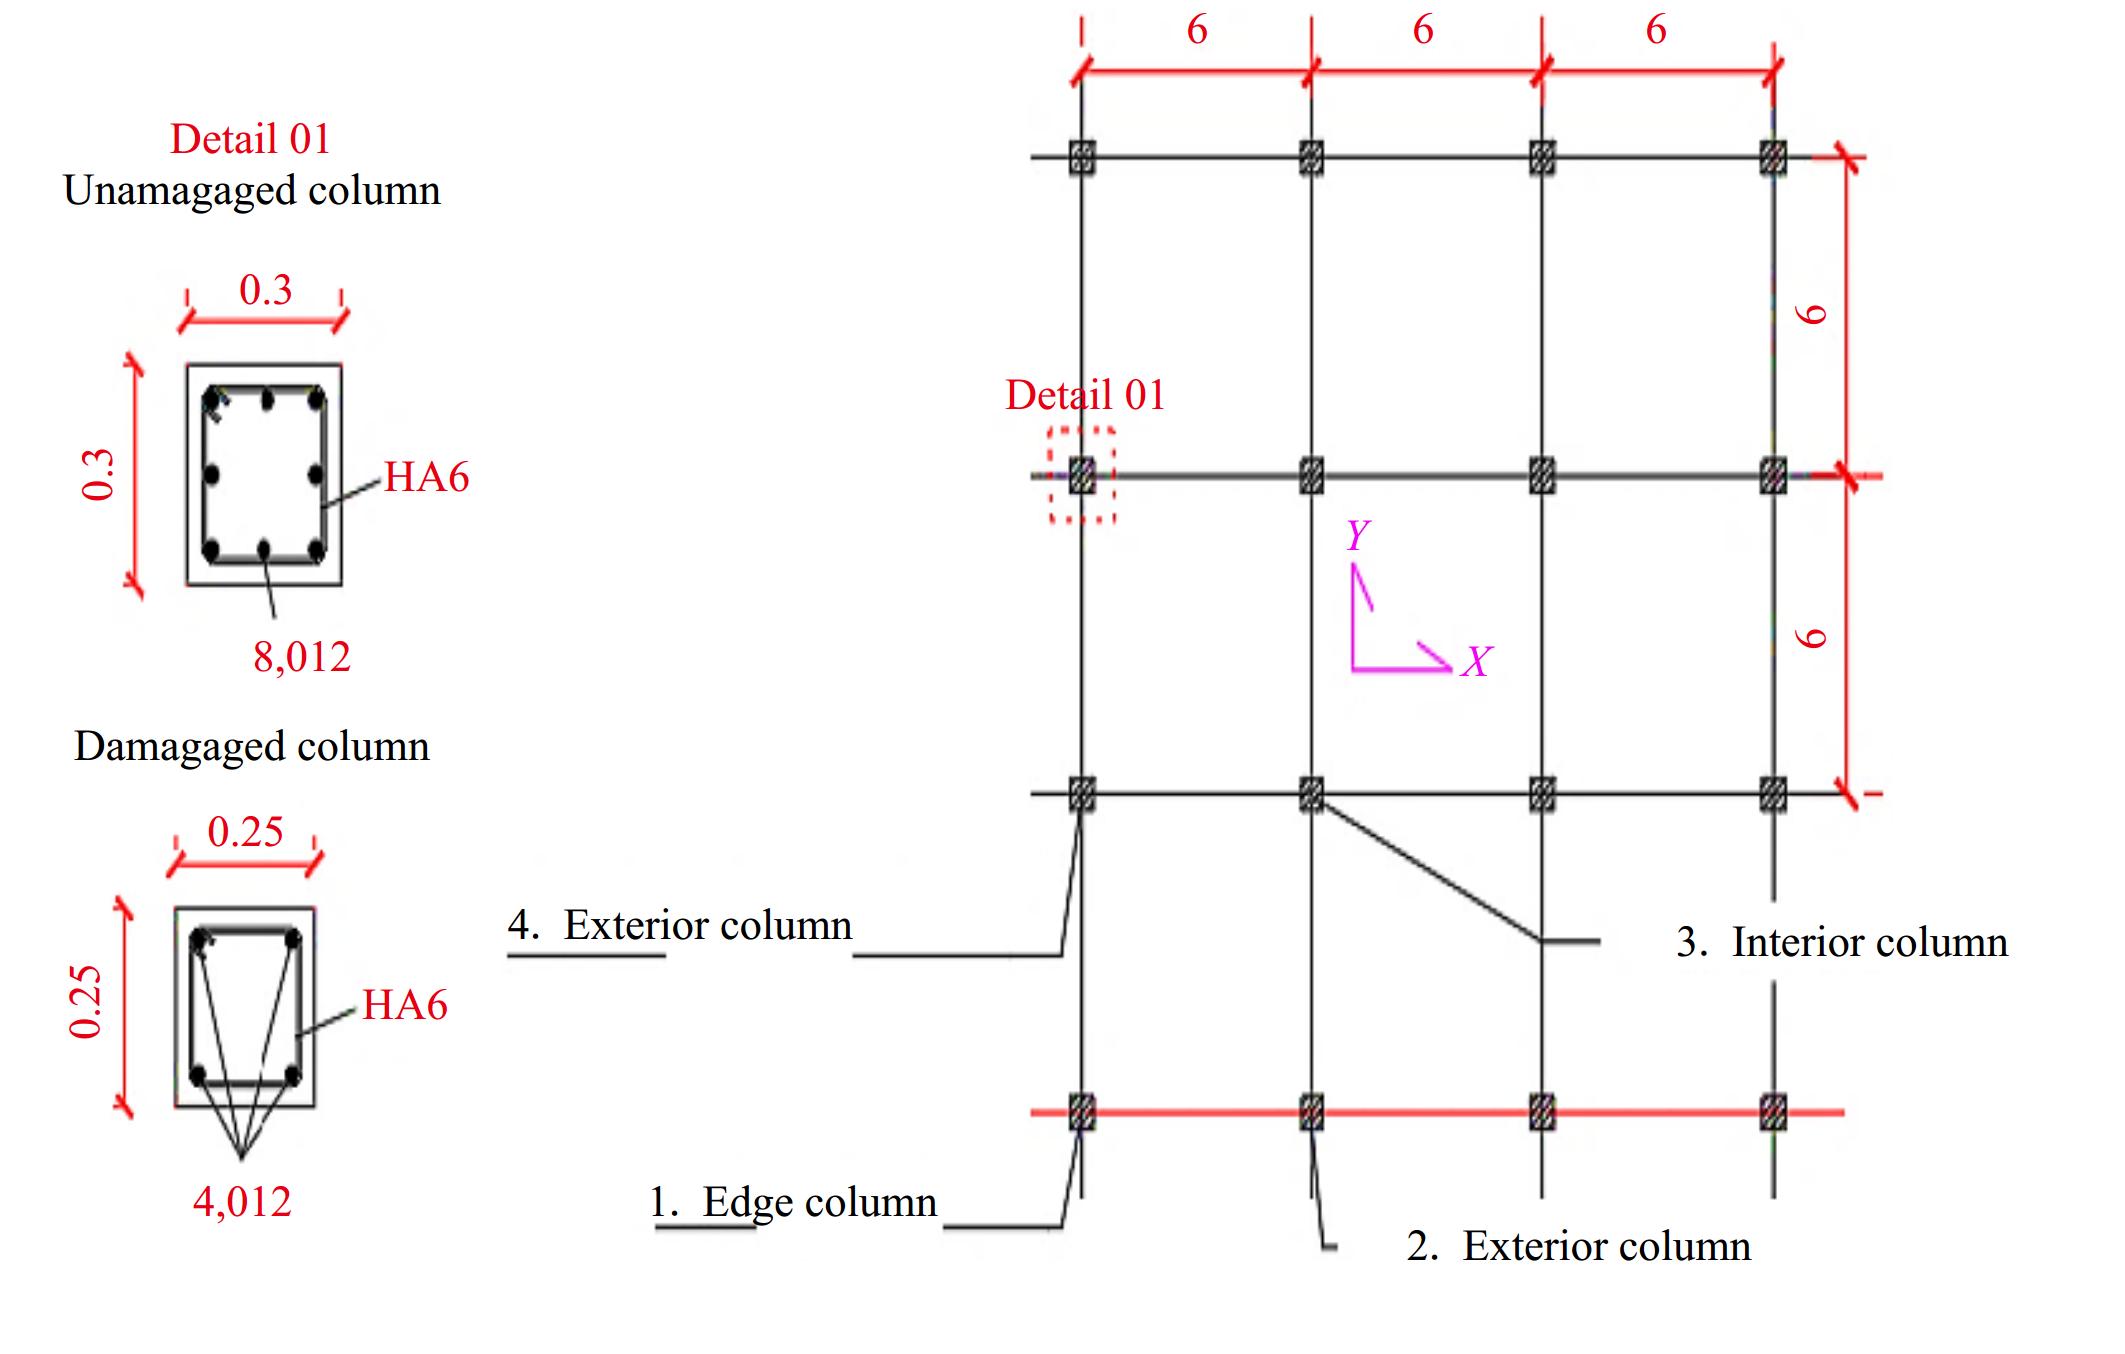
Figure 12.
The building's layout (x-y plan) and the cross section of 'undamaged and damaged column'.
-
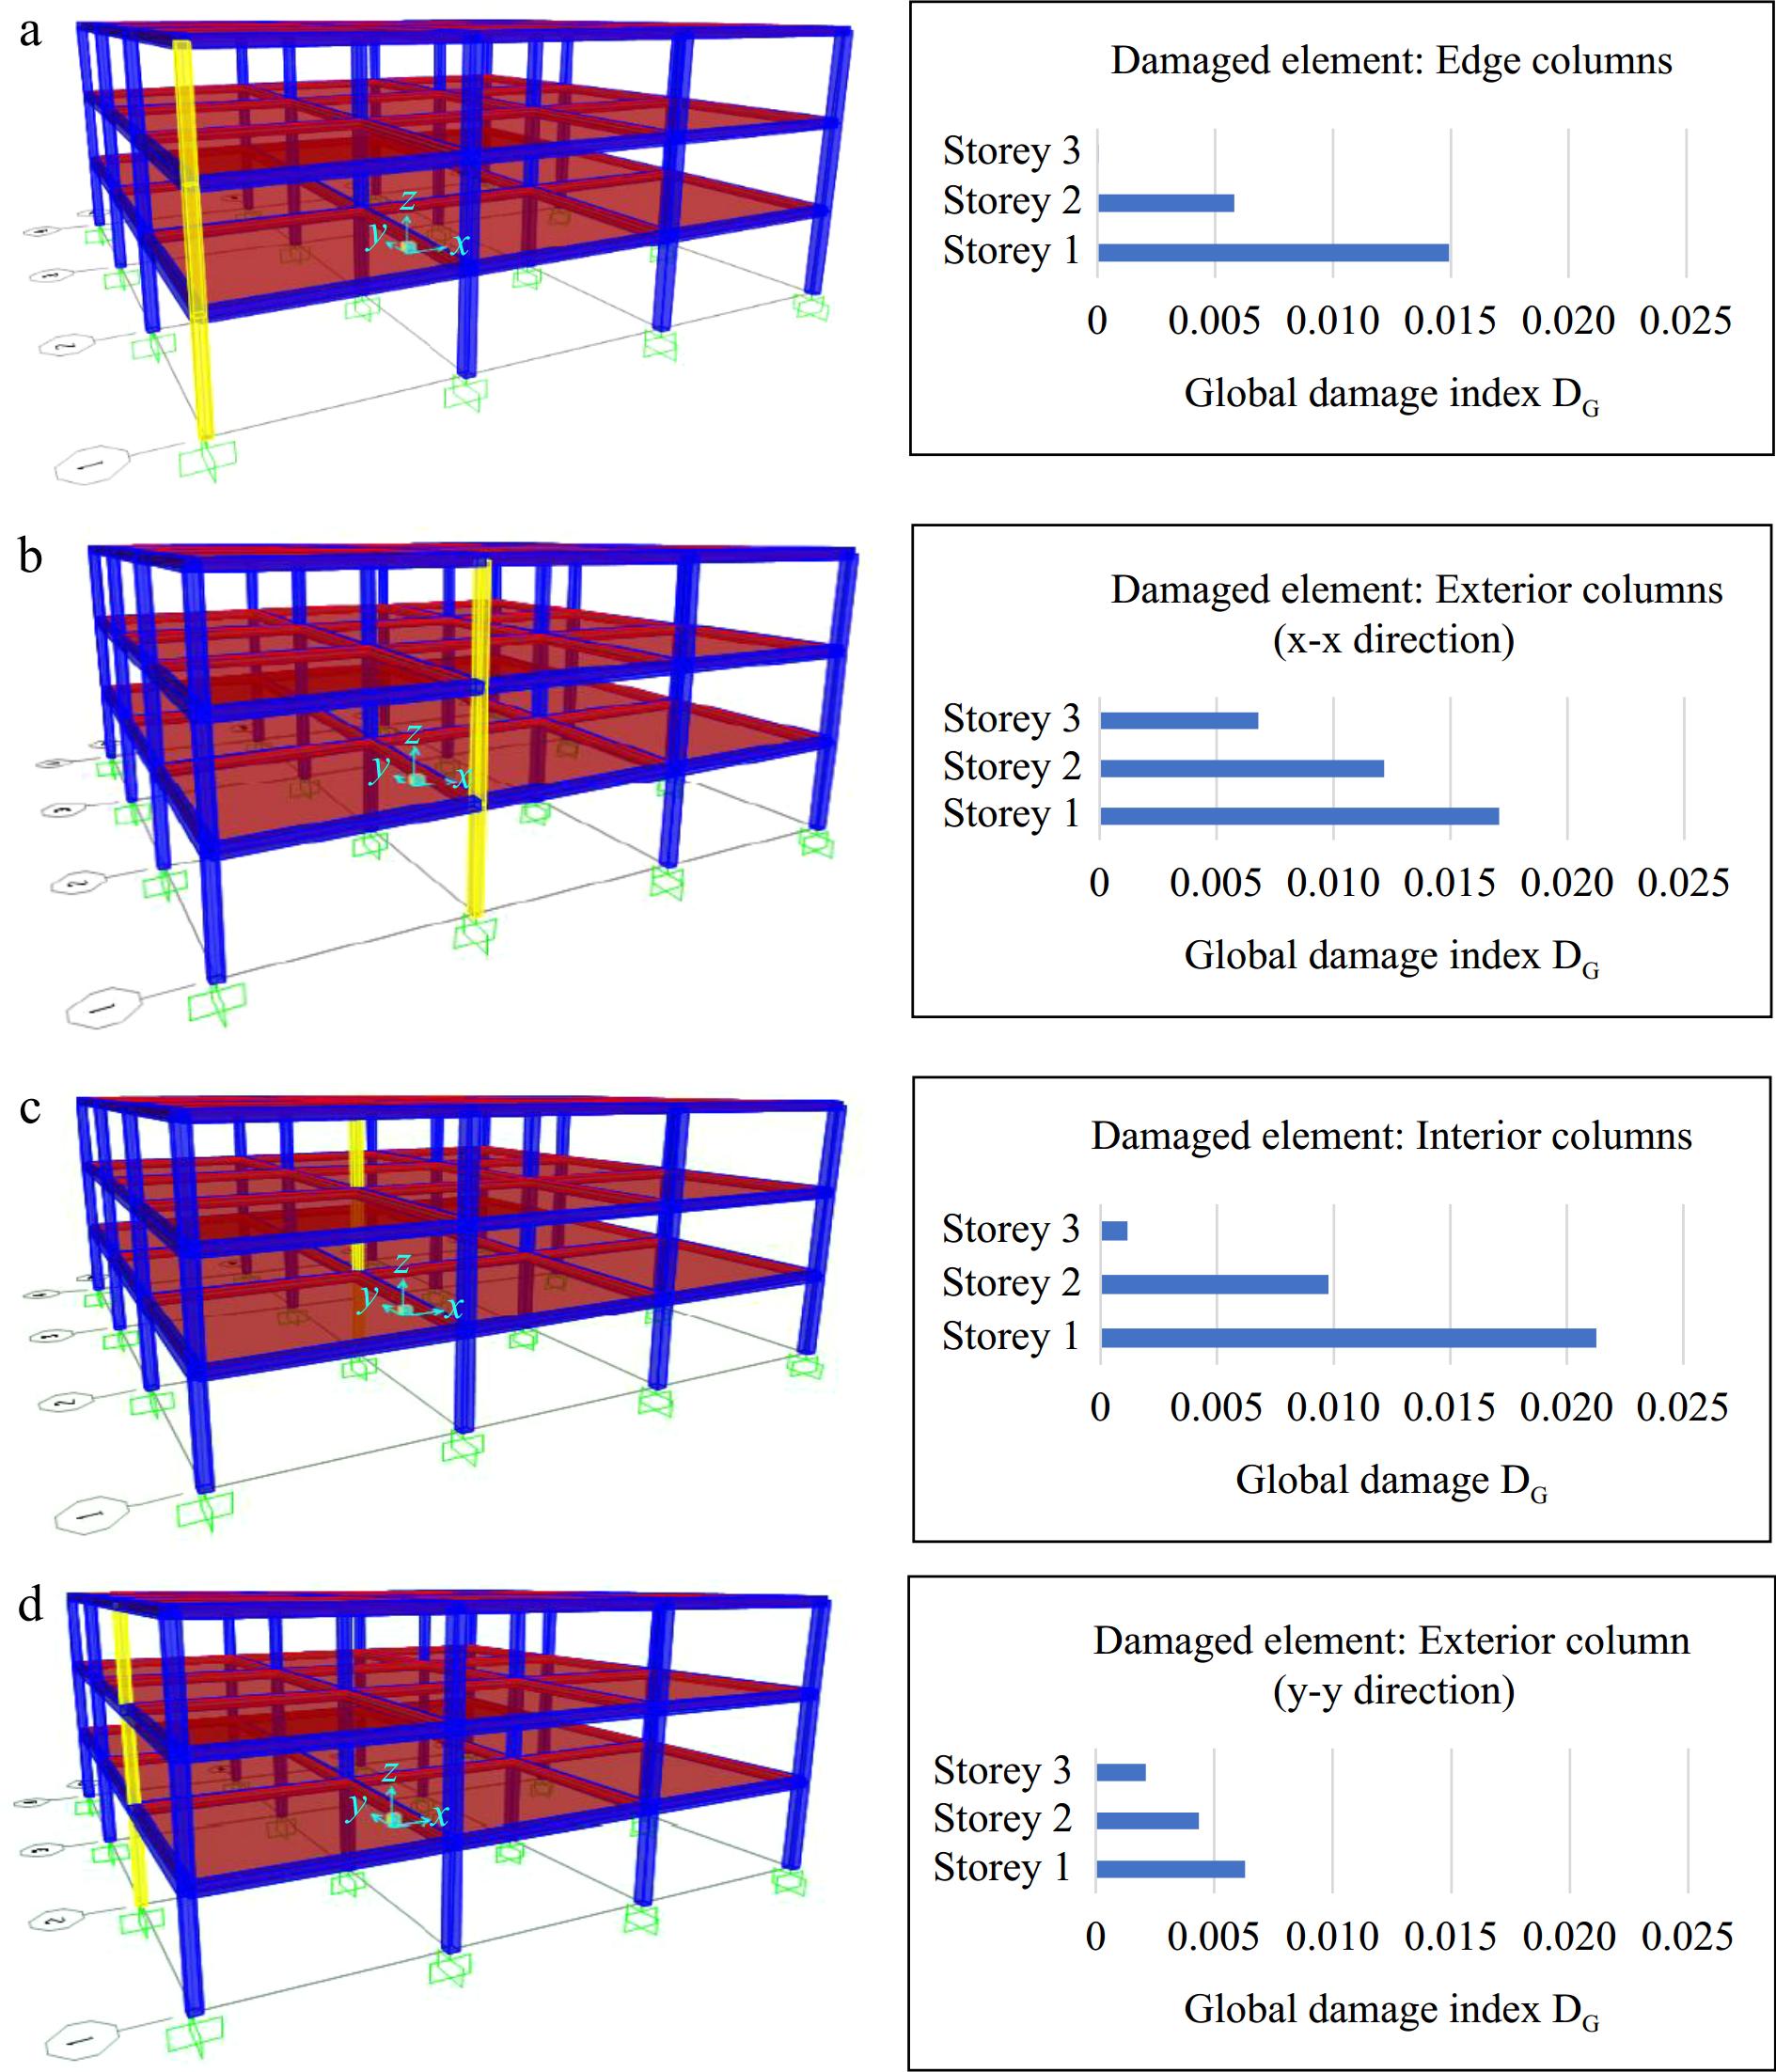
Figure 13.
The effect of the damaged column's position on the global damage index DG: (a) Edge columns, (b) Exterior columns (x-x), (c) Interior columns, (d) Exterior columns (y-y).
-
Story Individual damages Importance factors Damage Beam Columns Beam Column Story Story Global 1 2 3 1 2 3 4 αb,i αc,j βk DS,k DG 1 0.3 0.3 0.3 0.2 0.2 0.2 0.2 0.10 0.17 0.41 0.23 0.146 2 0.15 0.15 0.15 0.15 0.15 0.15 0.15 0.16 0.13 0.30 0.15 3 0.12 0.16 0.09 0.00 4 0.12 0.16 0.09 0.00 Table 1.
Damage pattern and global damage estimation of the 4-story GLD frame.
Figures
(13)
Tables
(1)