-

Figure 1.
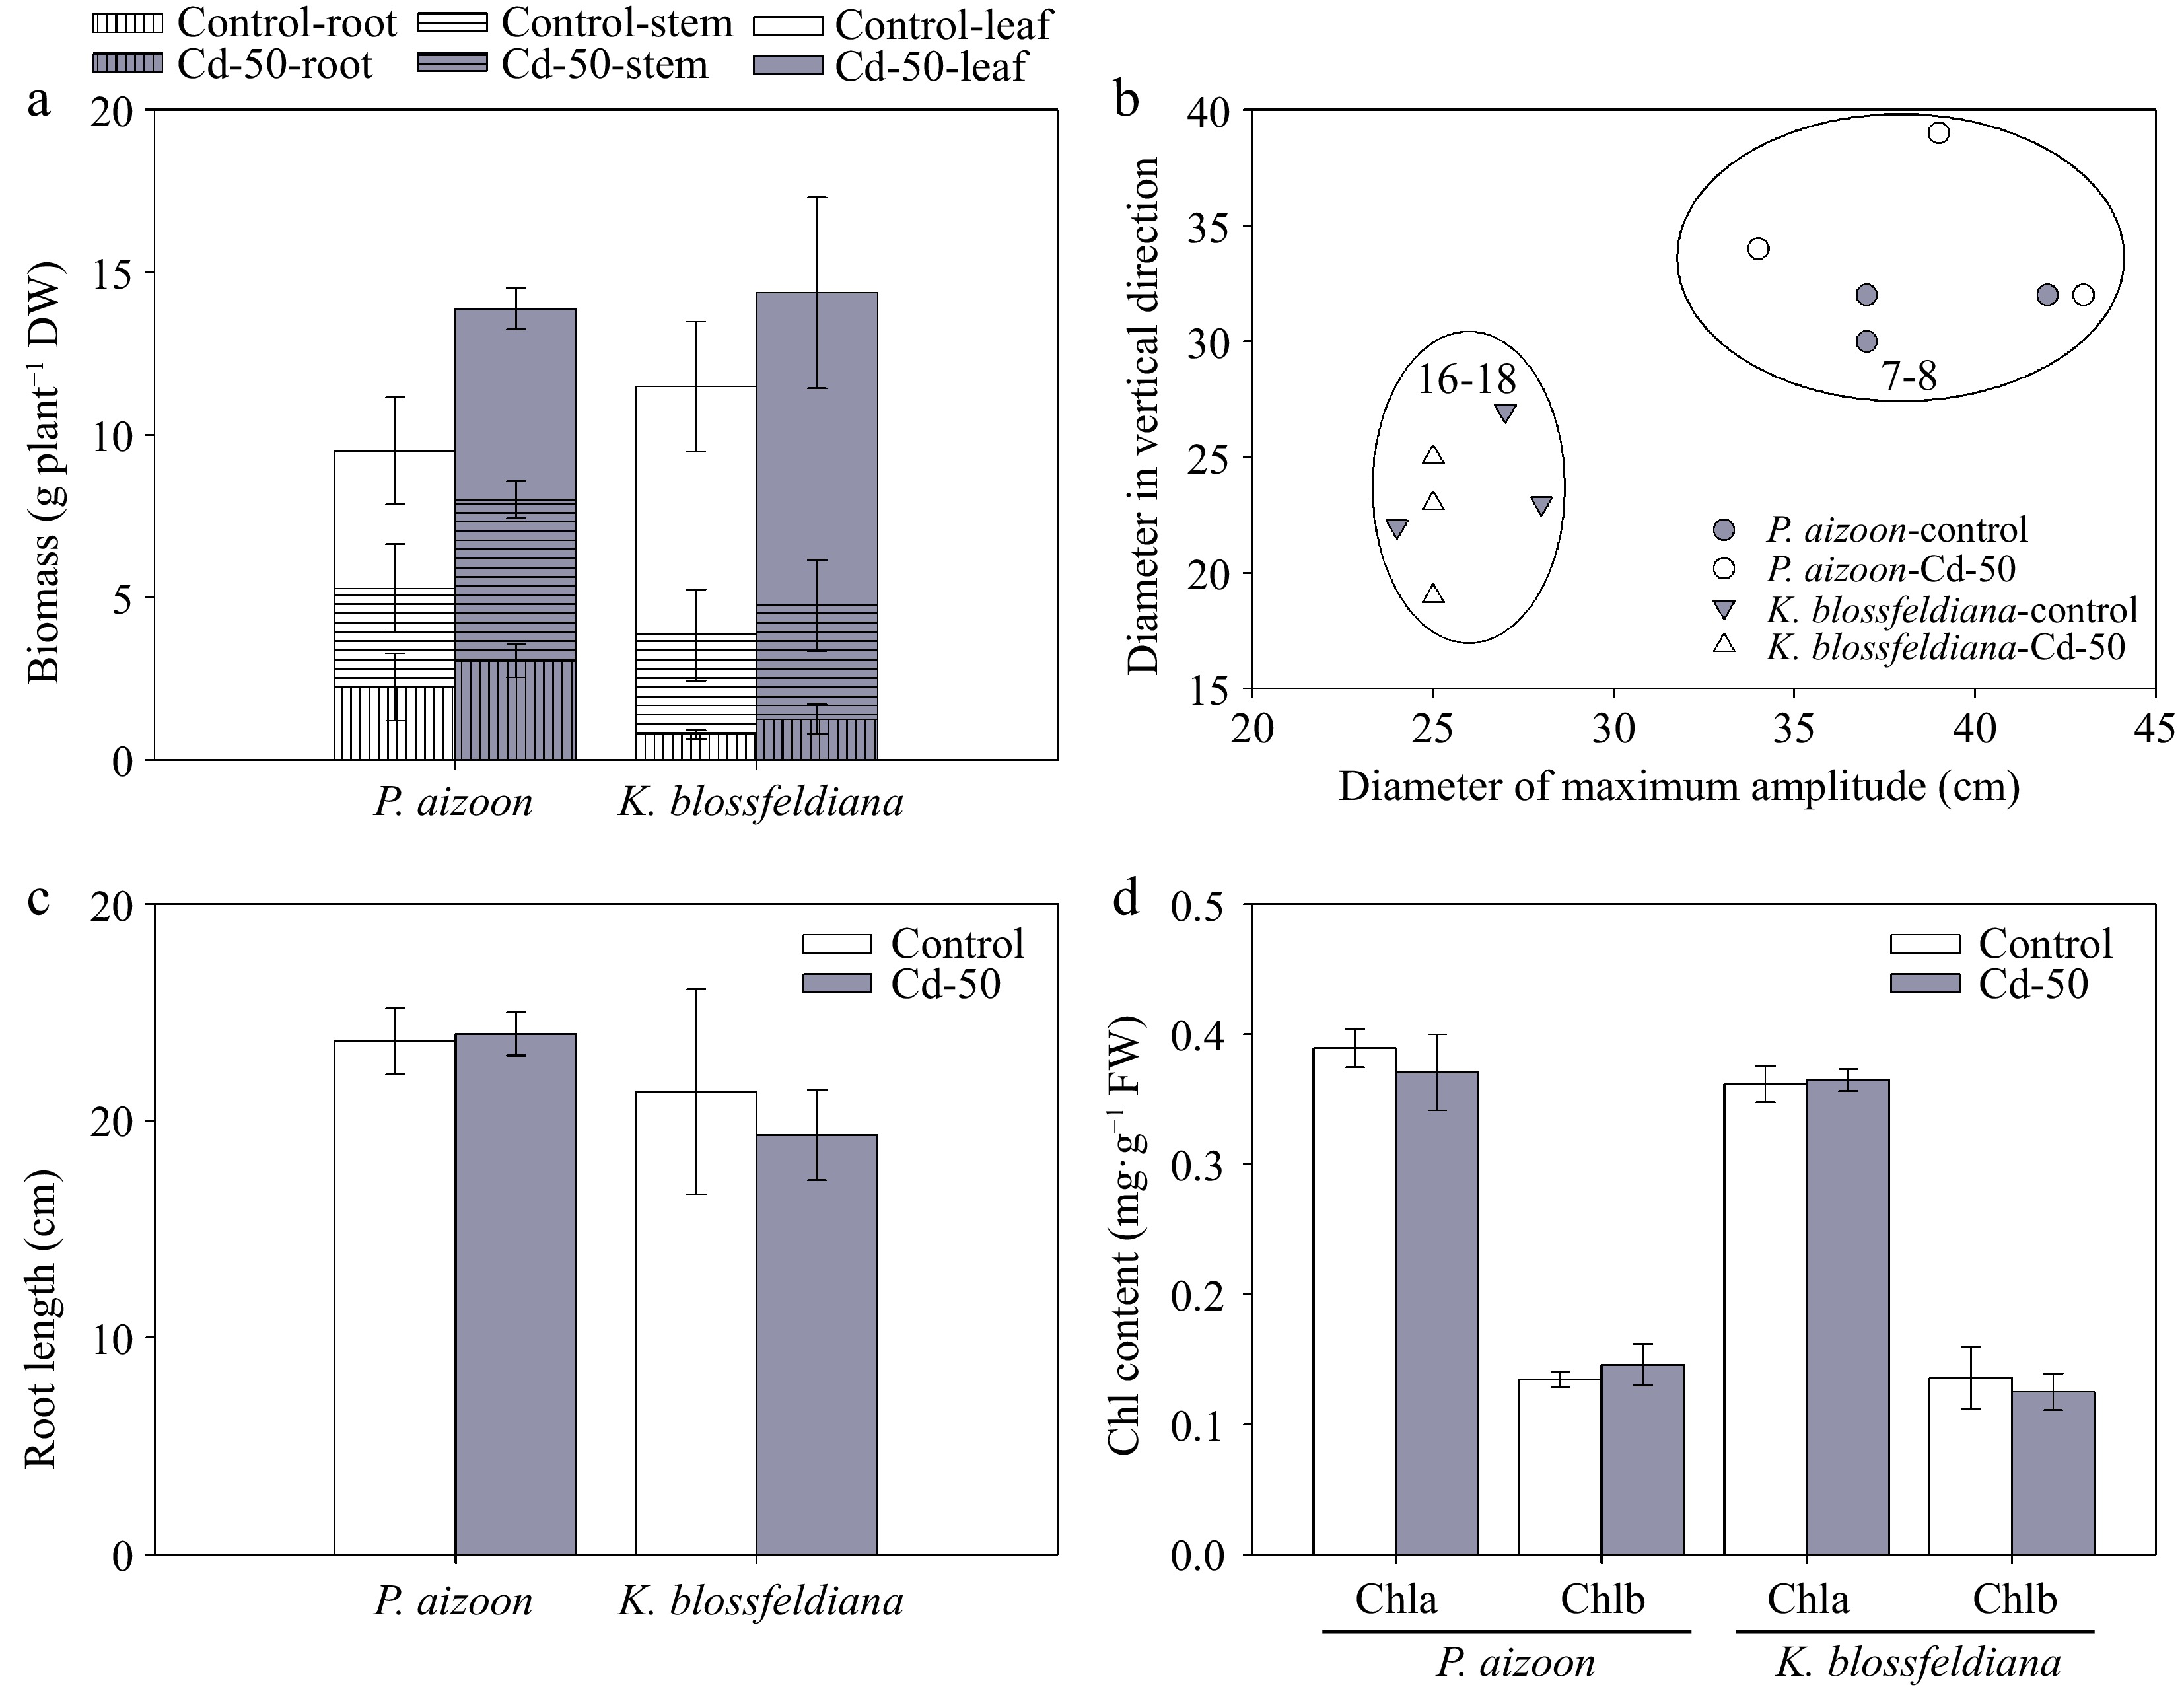
Plant growth and chlorophyll content of P. aizoon and K. blossfeldiana under control and Cd treatment (50 mg·kg−1) conditions. (a) Dry biomasses of roots, stems, and leaves. (b) Plant size. The data represent the estimated optimum planting density for each species. (c) Root length. (d) Chlorophyll a (Chla) and chlorophyll b (Chlb) contents. Data represent means ± standard deviations (n = 3).
-

Figure 2.
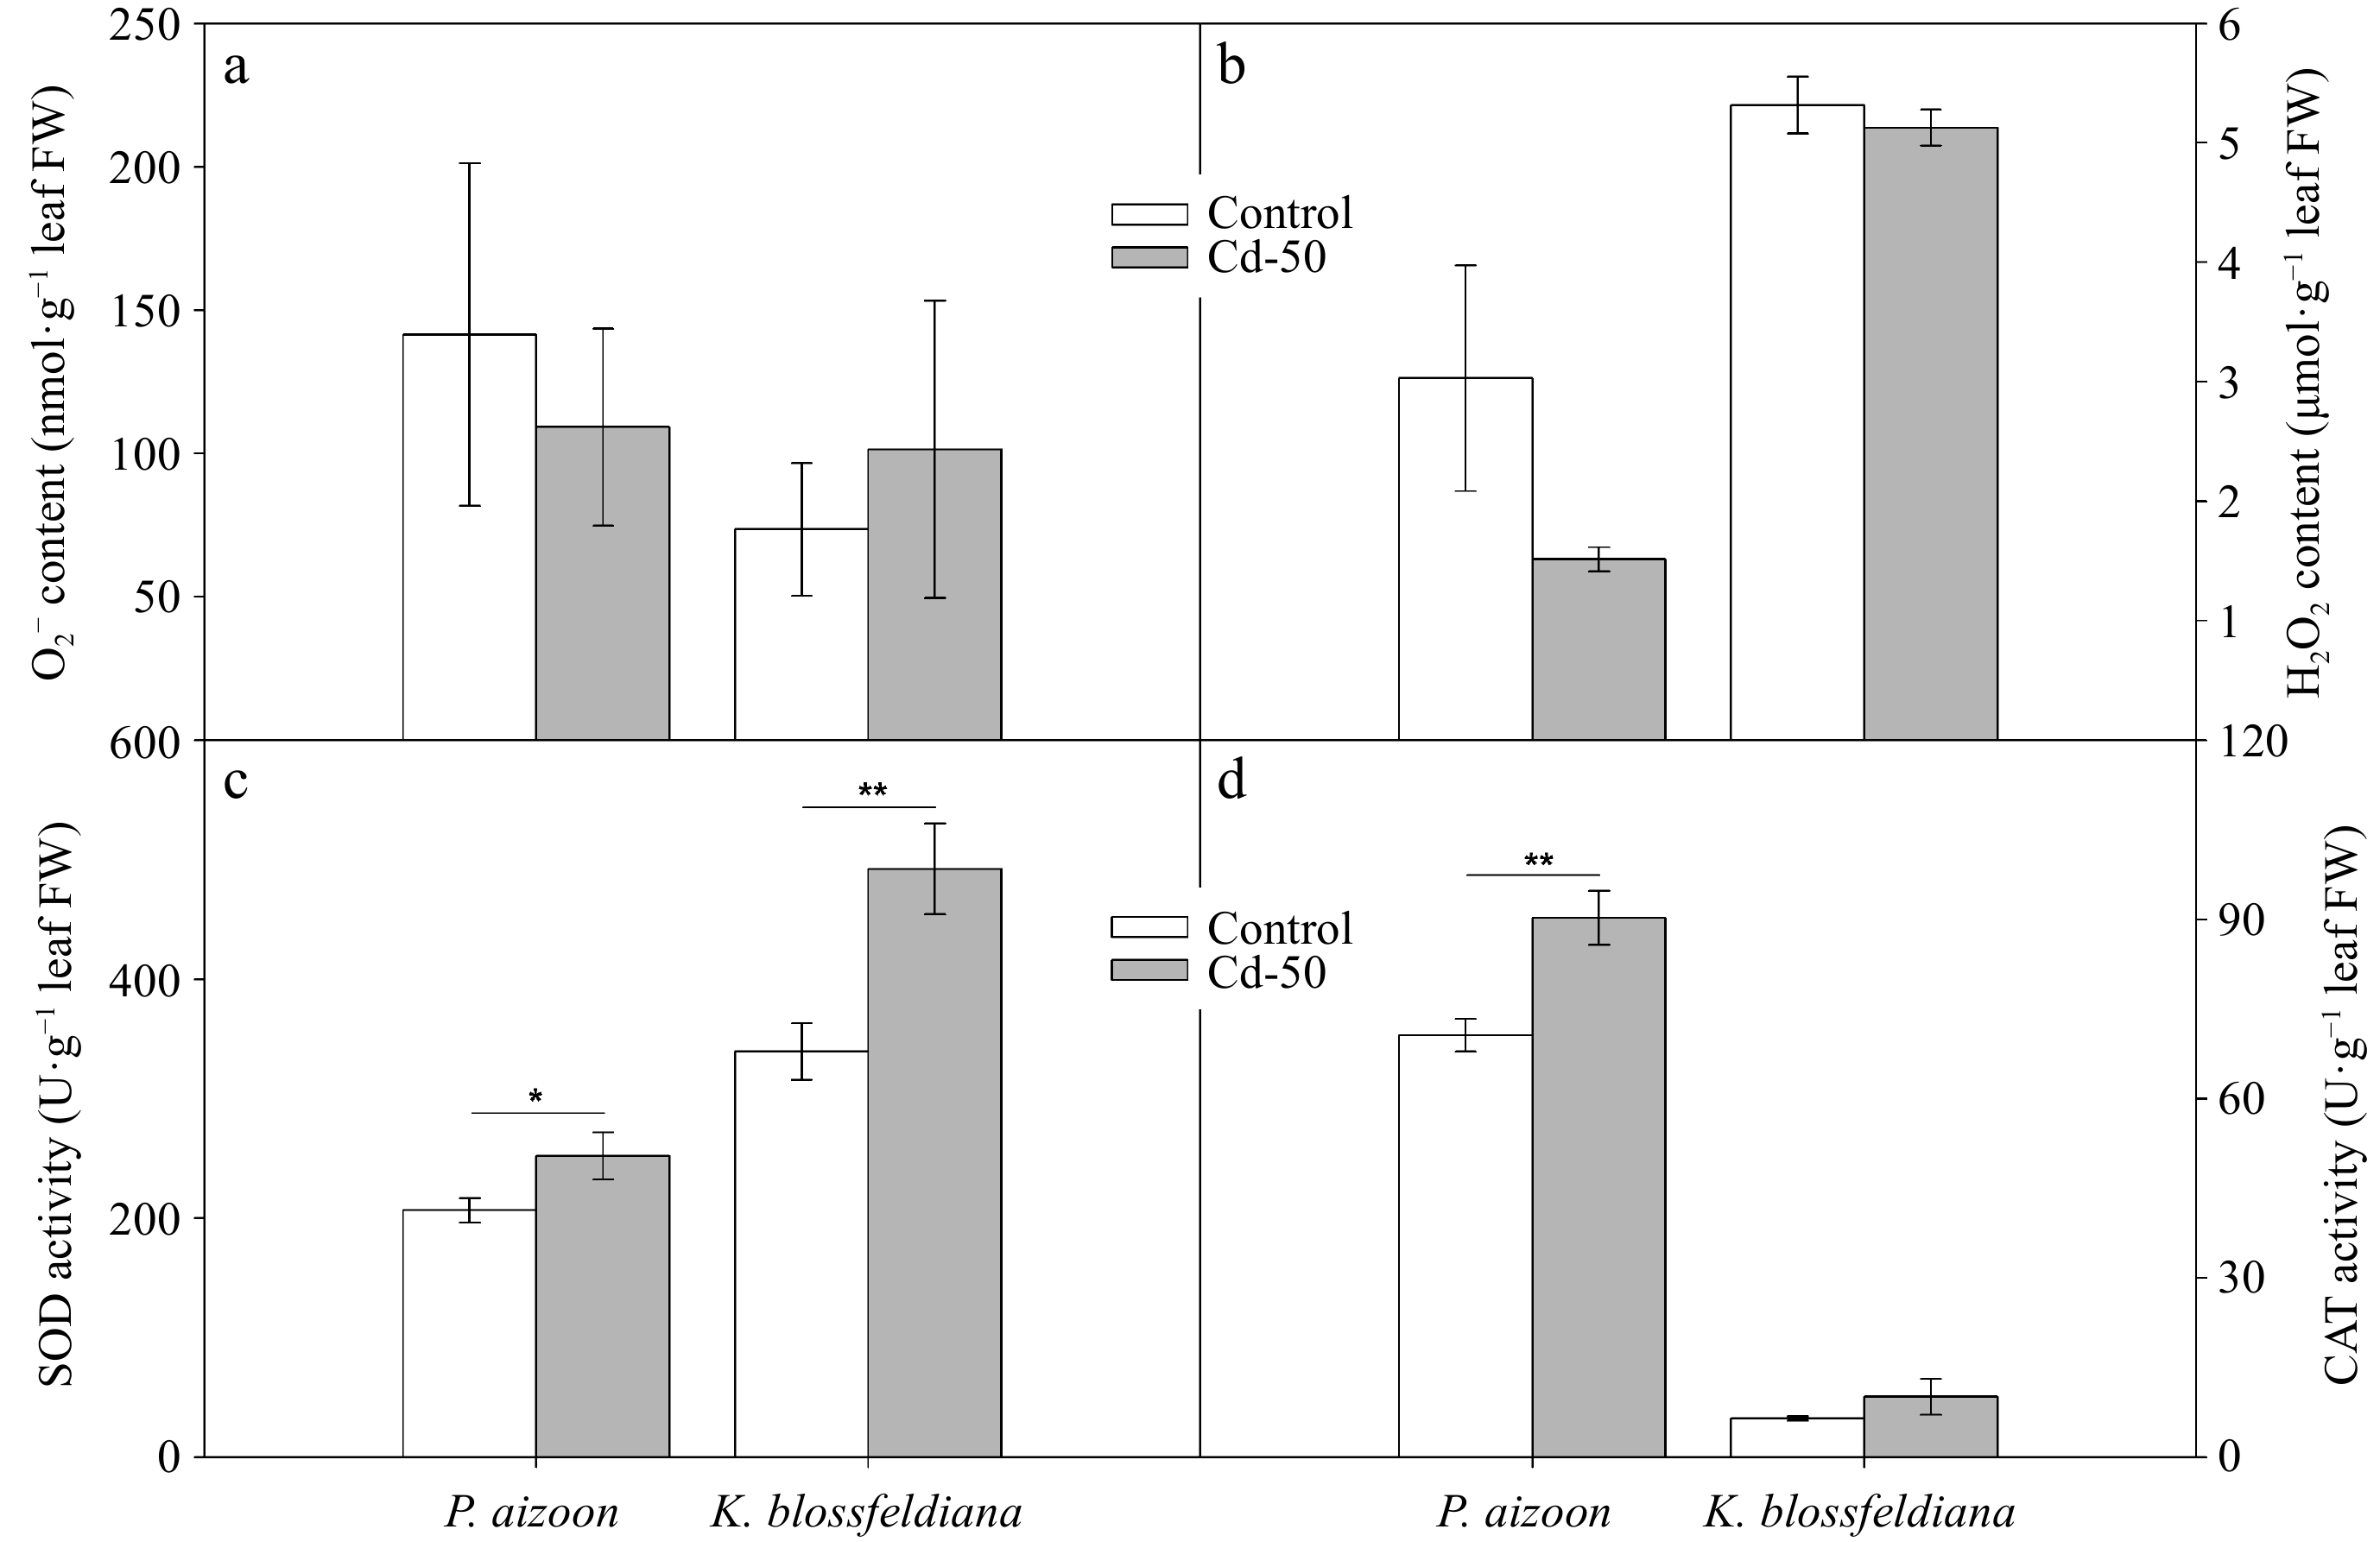
Reactive oxygen species and antioxidant enzyme activities of P. aizoon and K. blossfeldiana under control and Cd treatment (50 mg·kg−1) conditions. (a) Superoxide anion (O2−) content. (b) H2O2 content. (c) SOD activity. (d) CAT activity. Data represent means ± standard deviations (n = 3). * and ** indicate significant differences between two groups at 0.01 < p < 0.05 and 0.001 < p < 0.01, respectively. FW: fresh weight.
-

Figure 3.
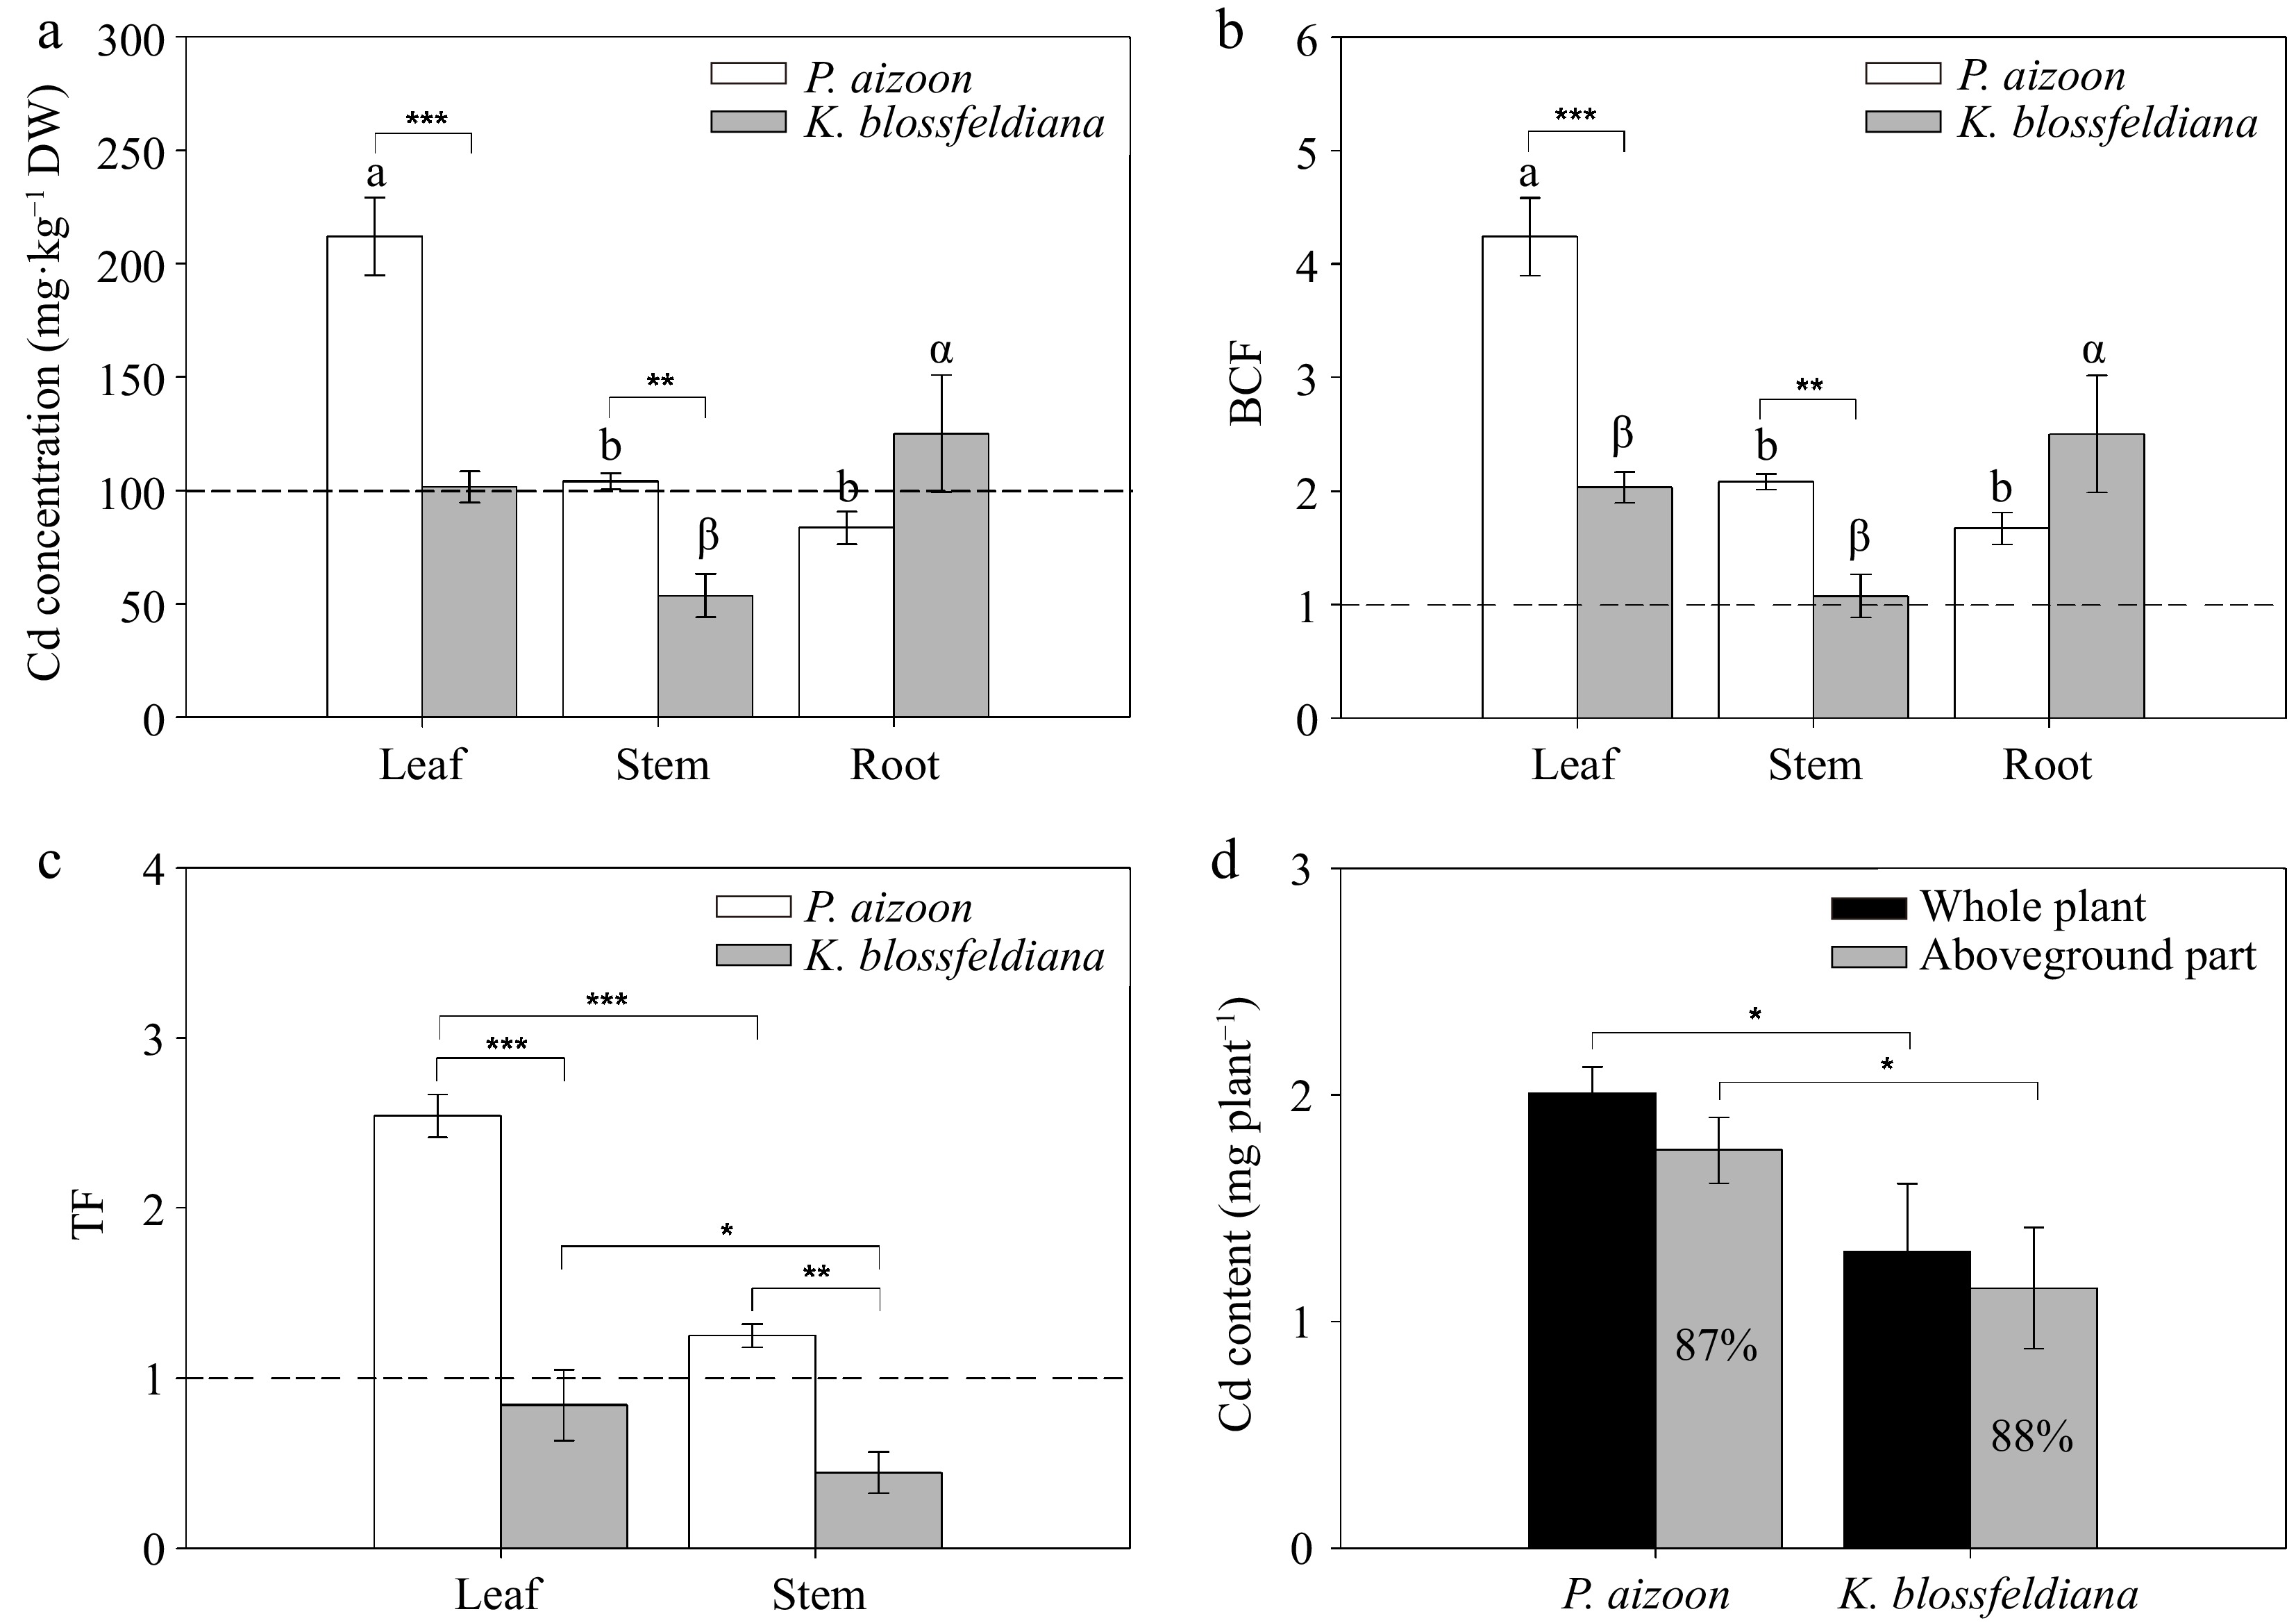
Cd accumulation indices of P. aizoon and K. blossfeldiana under Cd treatment (50 mg·kg−1). (a) Cd concentrations in leaves, stems, and roots. (b) Bioconcentration factor (BCF) of three plant parts. (c) Translocation factor (TF) of the leaf and stem. (d) Cd accumulation contents in individual plants and their aboveground parts. (a) and (b) The bars distinguished by different letters (a, b, α, or β) significantly vary among the tissues of P. aizoon or K. blossfeldiana at a significance level of 0.05. (a)−(c) The dashed lines indicate the threshold values of Cd hyperaccumulators. Data represent means ± standard deviations (n = 3). *, **, and *** represent significant differences between two groups at 0.01 < p < 0.05, 0.001 < p < 0.01, and p < 0.001 levels, respectively. DW: dry weight.
-

Figure 4.
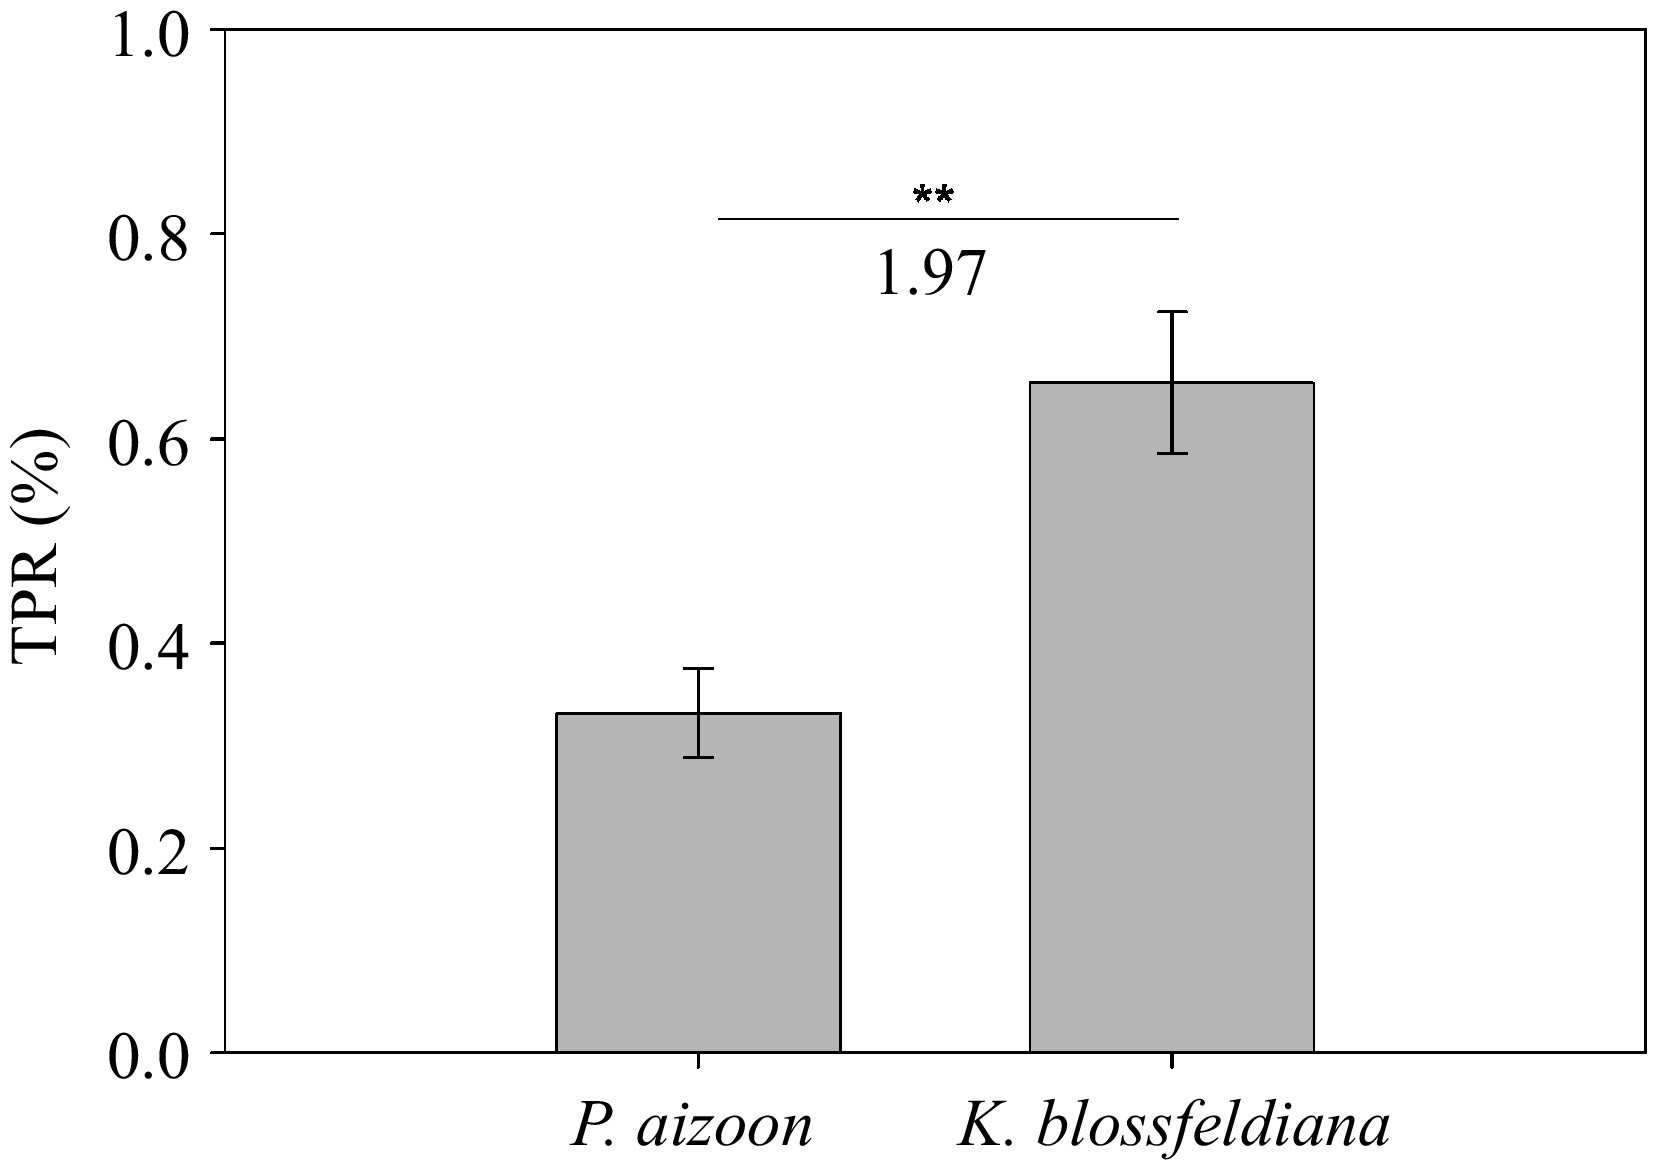
Theoretical phytoextraction rates (TPRs) of Cd by P. aizoon and K. blossfeldiana growing in soils supplemented with 50 mg·kg−1 Cd for three months. Data represent means ± standard deviations (n = 3). ** represents significant difference between two groups at 0.001 < p < 0.01.
Figures
(4)
Tables
(0)