-

Figure 1.
Potassium release from potassium feldspar induced by the bacterial strains isolated from Lespedeza floribunda rhizosphere soil. (a) Potassium release induced by the strains from the isolated strains after 7 d of culturing. Control indicates the group with no addition of the bacterial strains in the potassium feldspar medium. (b) Time-dependent potassium release by the P. putida strain KT2440. The error bars indicate the standard errors of each group (n = 3). The asterisks (*) indicate significant difference between the NKK10 group and other groups (p < 0.05).
-
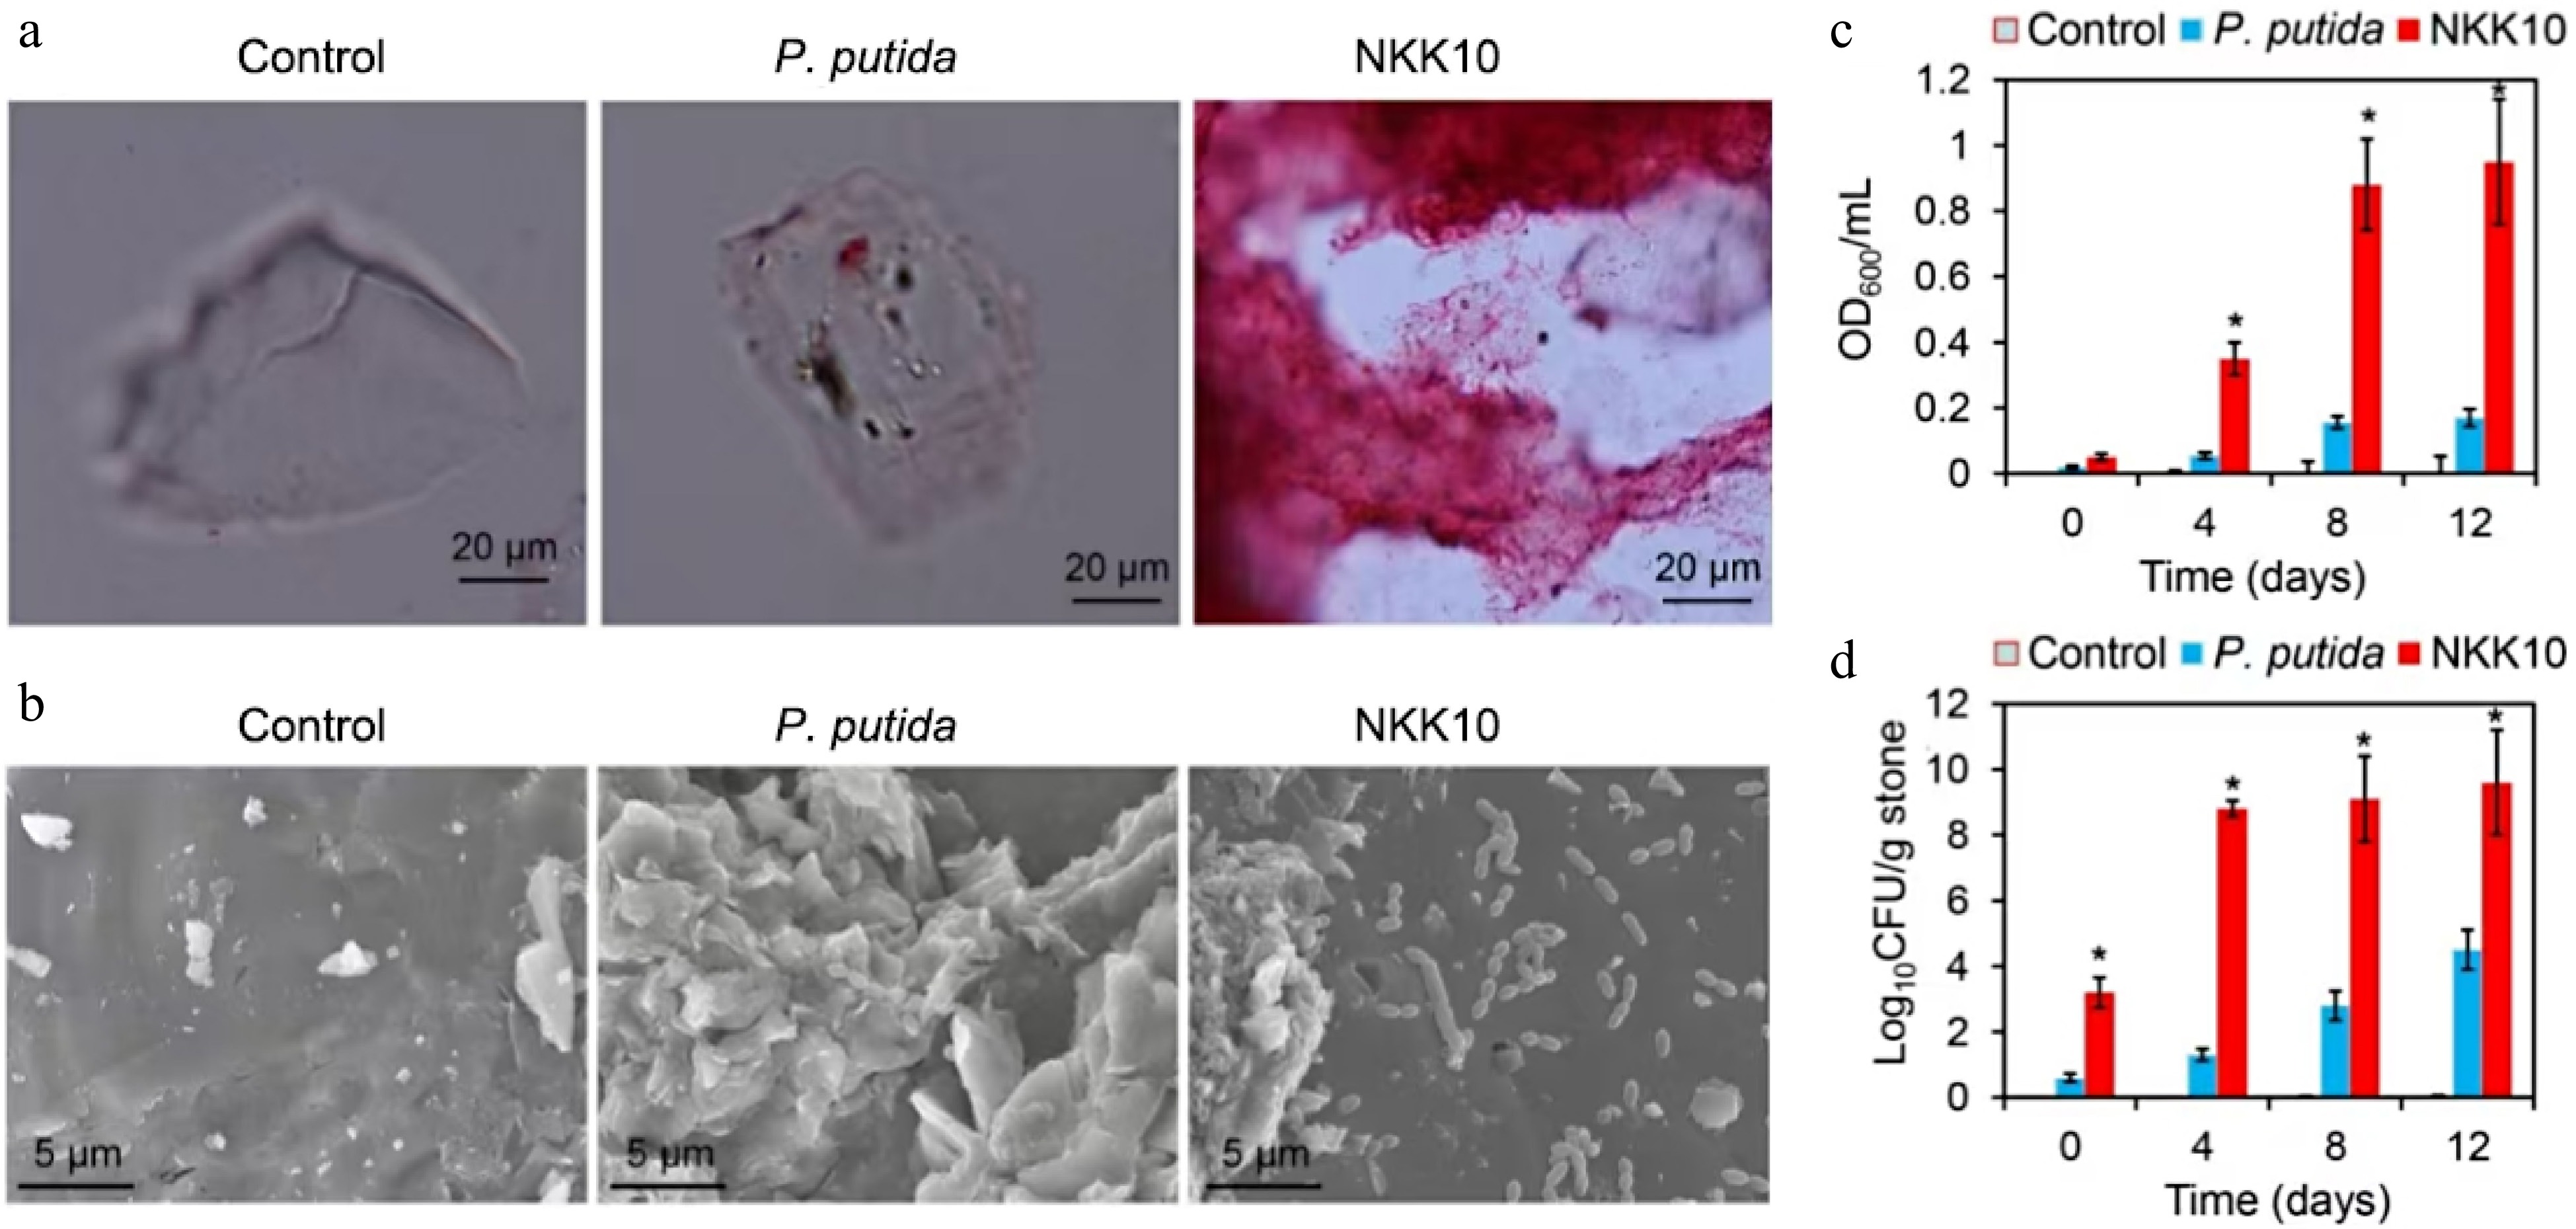
Figure 2.
Effect of potassium feldspar on growth of the P. putida KT2440 and NKK10. (a) Microscope images of feldspars after co-incubation of the strains for 7 d. The strains were incubated in the potassium feldspar medium, the feldspars were then sampled, and stained by safranine O for microscopy. (b) Scanning Electron Microscope (SEM) images of the feldspar after 7 d of treatment by the bacterial cells. The blue arrows indicate the distribution of bacterial cells on the feldspar surface. (c) Optical density of the cultures after 10 min of standing at the room temperature. (d) The number of viable bacterial cells on the feldspar stones at different time points. The error bars indicate the standard errors of each group (n = 3). (*) indicate significant difference between the NKK10 group and other groups (p < 0.05).
-

Figure 3.
Phylogenetic tree of NKK10 constructed by the MEGA11.0 software with the Neighbor-Joining method.
-

Figure 4.
Altered transcriptional profiling of the NKK10 cells cultured in feldspar medium vs in the control K+-rich medium. (a) Heat map of the transcription profiling. The samples CK1-CK3 indicate the control samples in which the NKK10 cells were cultured in the K+-rich medium, while the samples FD1-FD3 indicate the treated samples in which the cells were cultured in the feldspar medium. (b) Volcano mapping of the expressed genes.
-
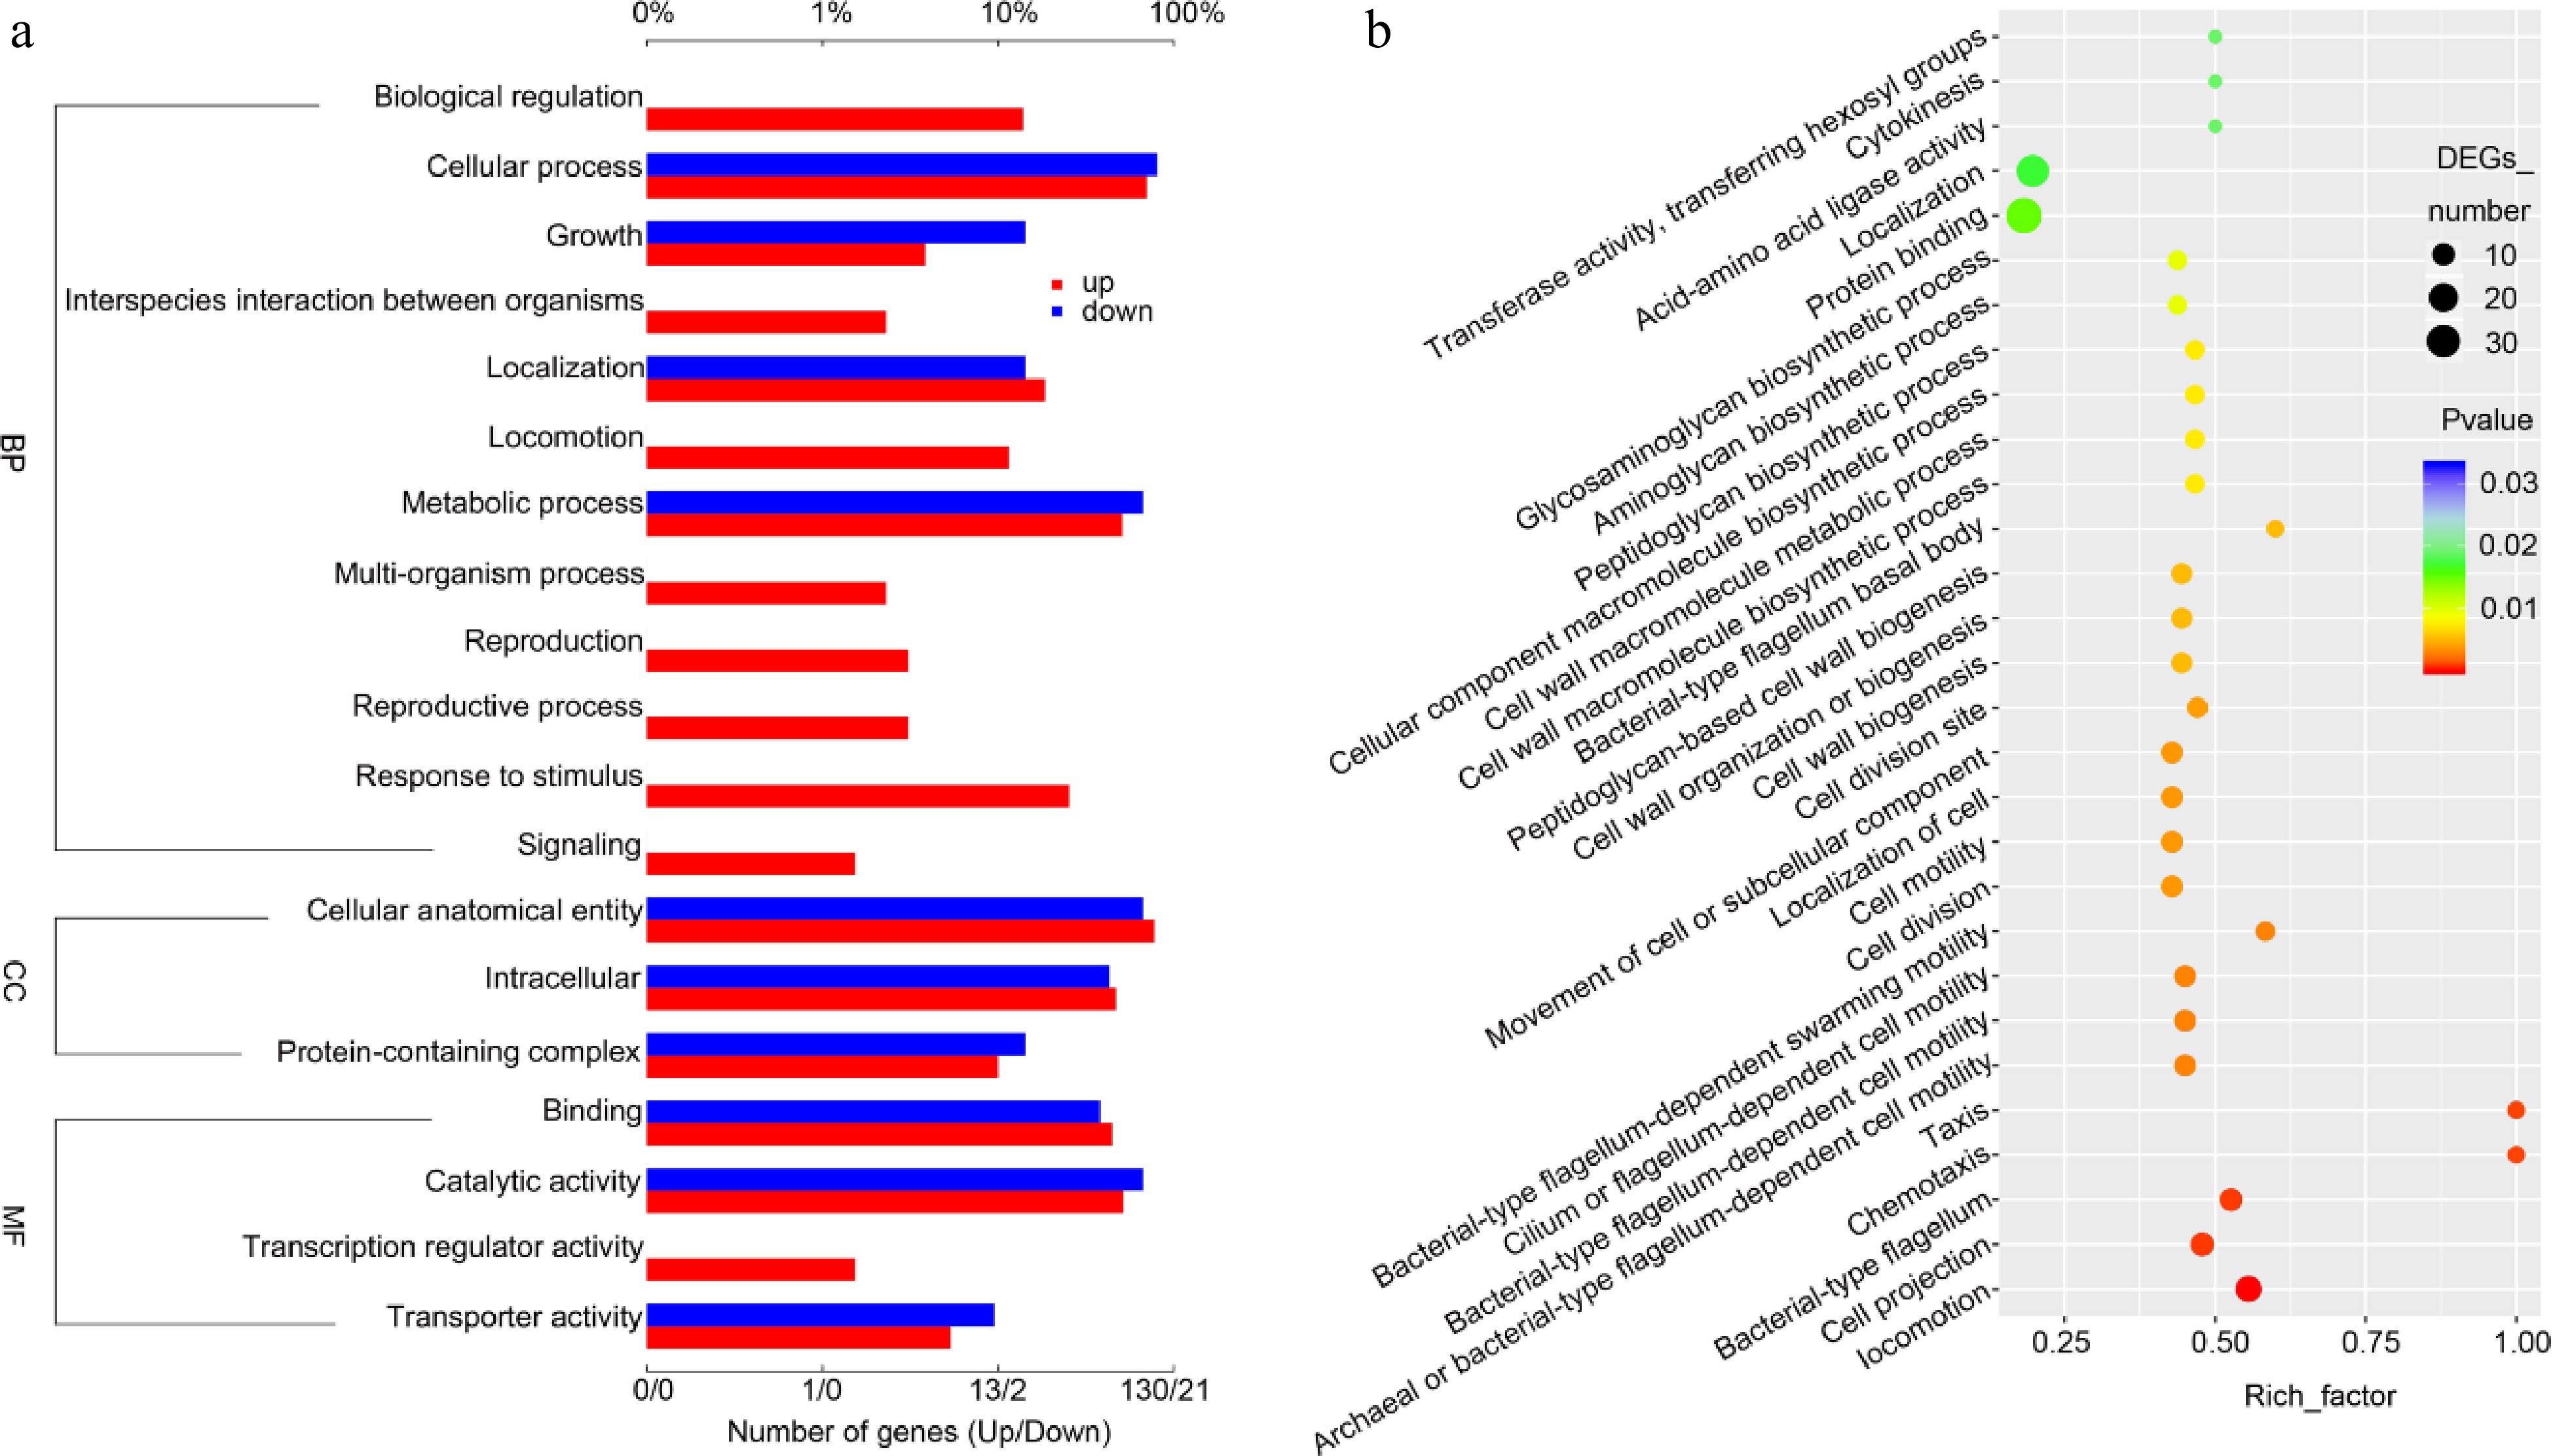
Figure 5.
Gene Ontology analysis (GO analysis) of the NKK10 transcriptional profiling in feldspar medium versus in the control K+-rich medium. (a) Bar chart of GO analysis showing the gene groups with changed expression levels. (b) Dot map of GO analysis showing the gene groups with changed expression levels.
-

Figure 6.
KEGG analysis of the NKK10 transcriptional profiling in feldspar medium vs in the control K+-rich medium. (a) Dot map of KEGG analysis showing the gene groups with changed expression levels. (b) The proteins with up-regulated expression (indicated by red color) in the pathway of peptidoglycan biosynthesis. The numbers in the brackets indicate the Log2(fold change) values of the corresponding genes. (c) The proteins with up-regulated expression (indicated by red color) in the pathway of biofilm formation.
Figures
(6)
Tables
(0)