-
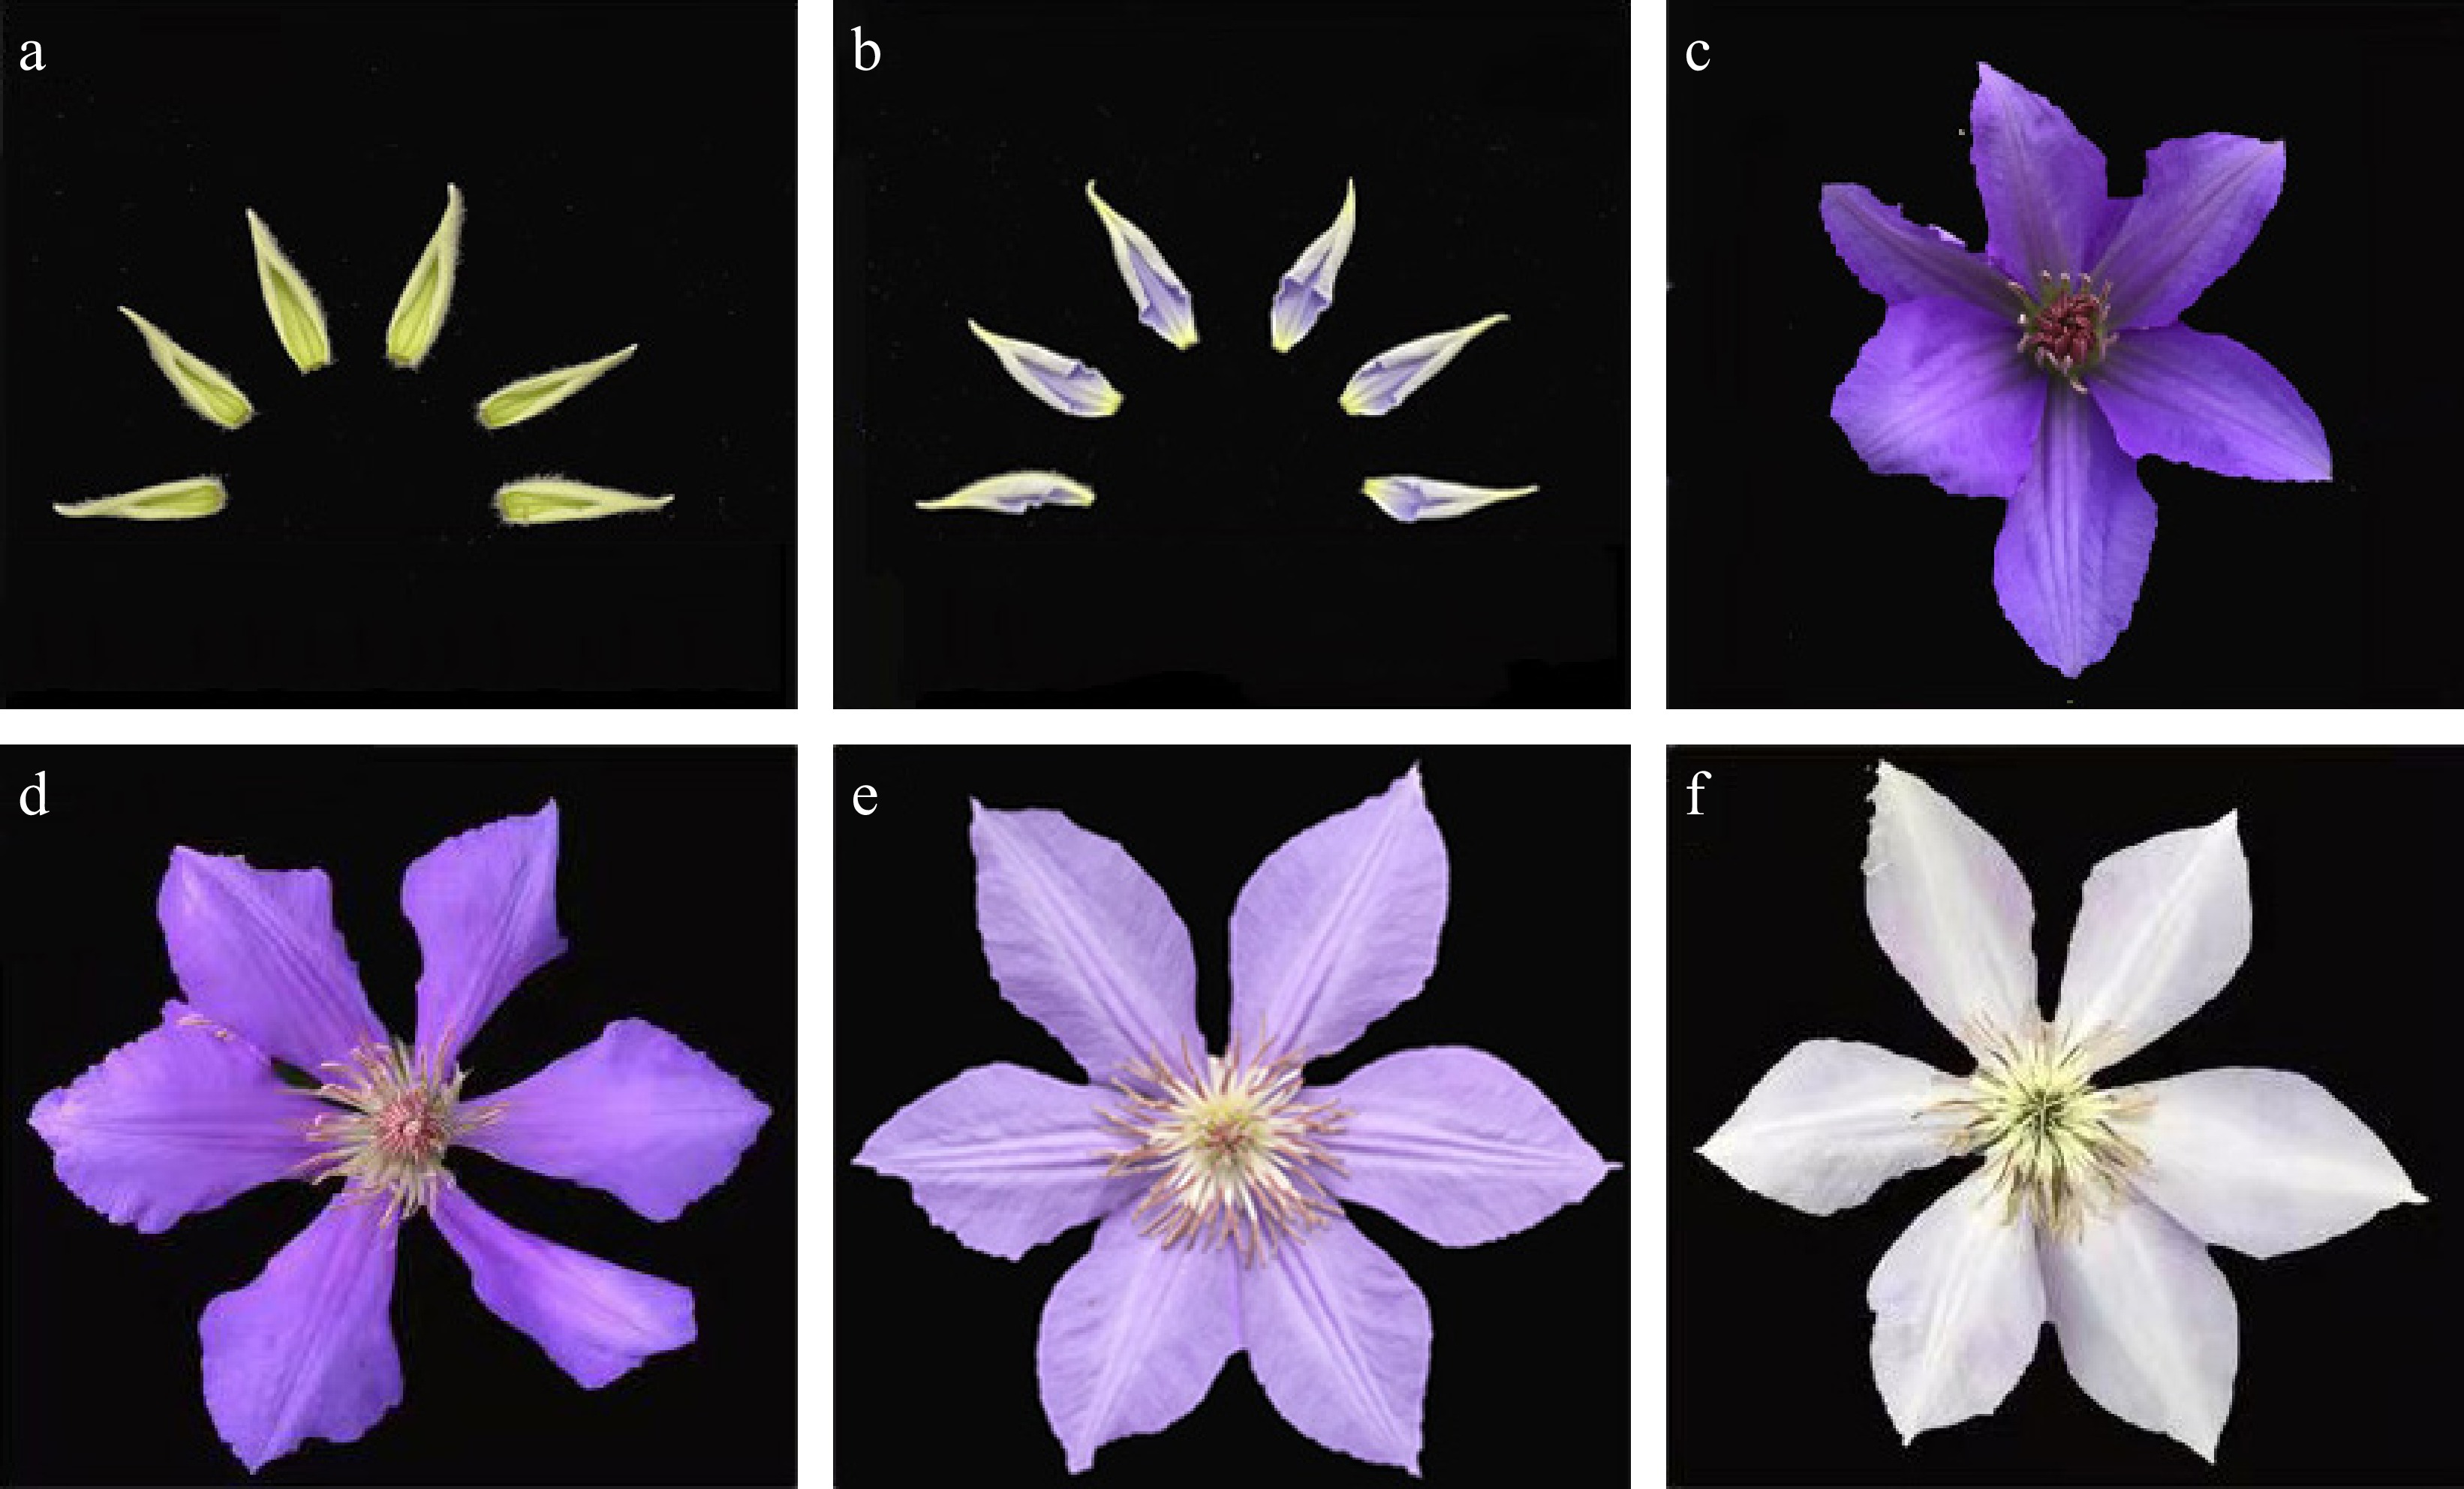
Figure 1.
Different stages of C. lanuginosa flower development. (a) Bud stage (myfs1, yellow‒green, N144D); (b) Colouring stage (myfs2, light blue‒purple, light blue‒purple, N88C); (c) Early flowering stage (myfs3, dark purple, N88B); (d) Flowering stage (myfs4, bright blue‒purple, 90D); (e) After the flowering stage (myfs5, lilac purple stage, 91B); (f) End flowering stage (myfs6, extremely lilac purple stage, 91C).
-
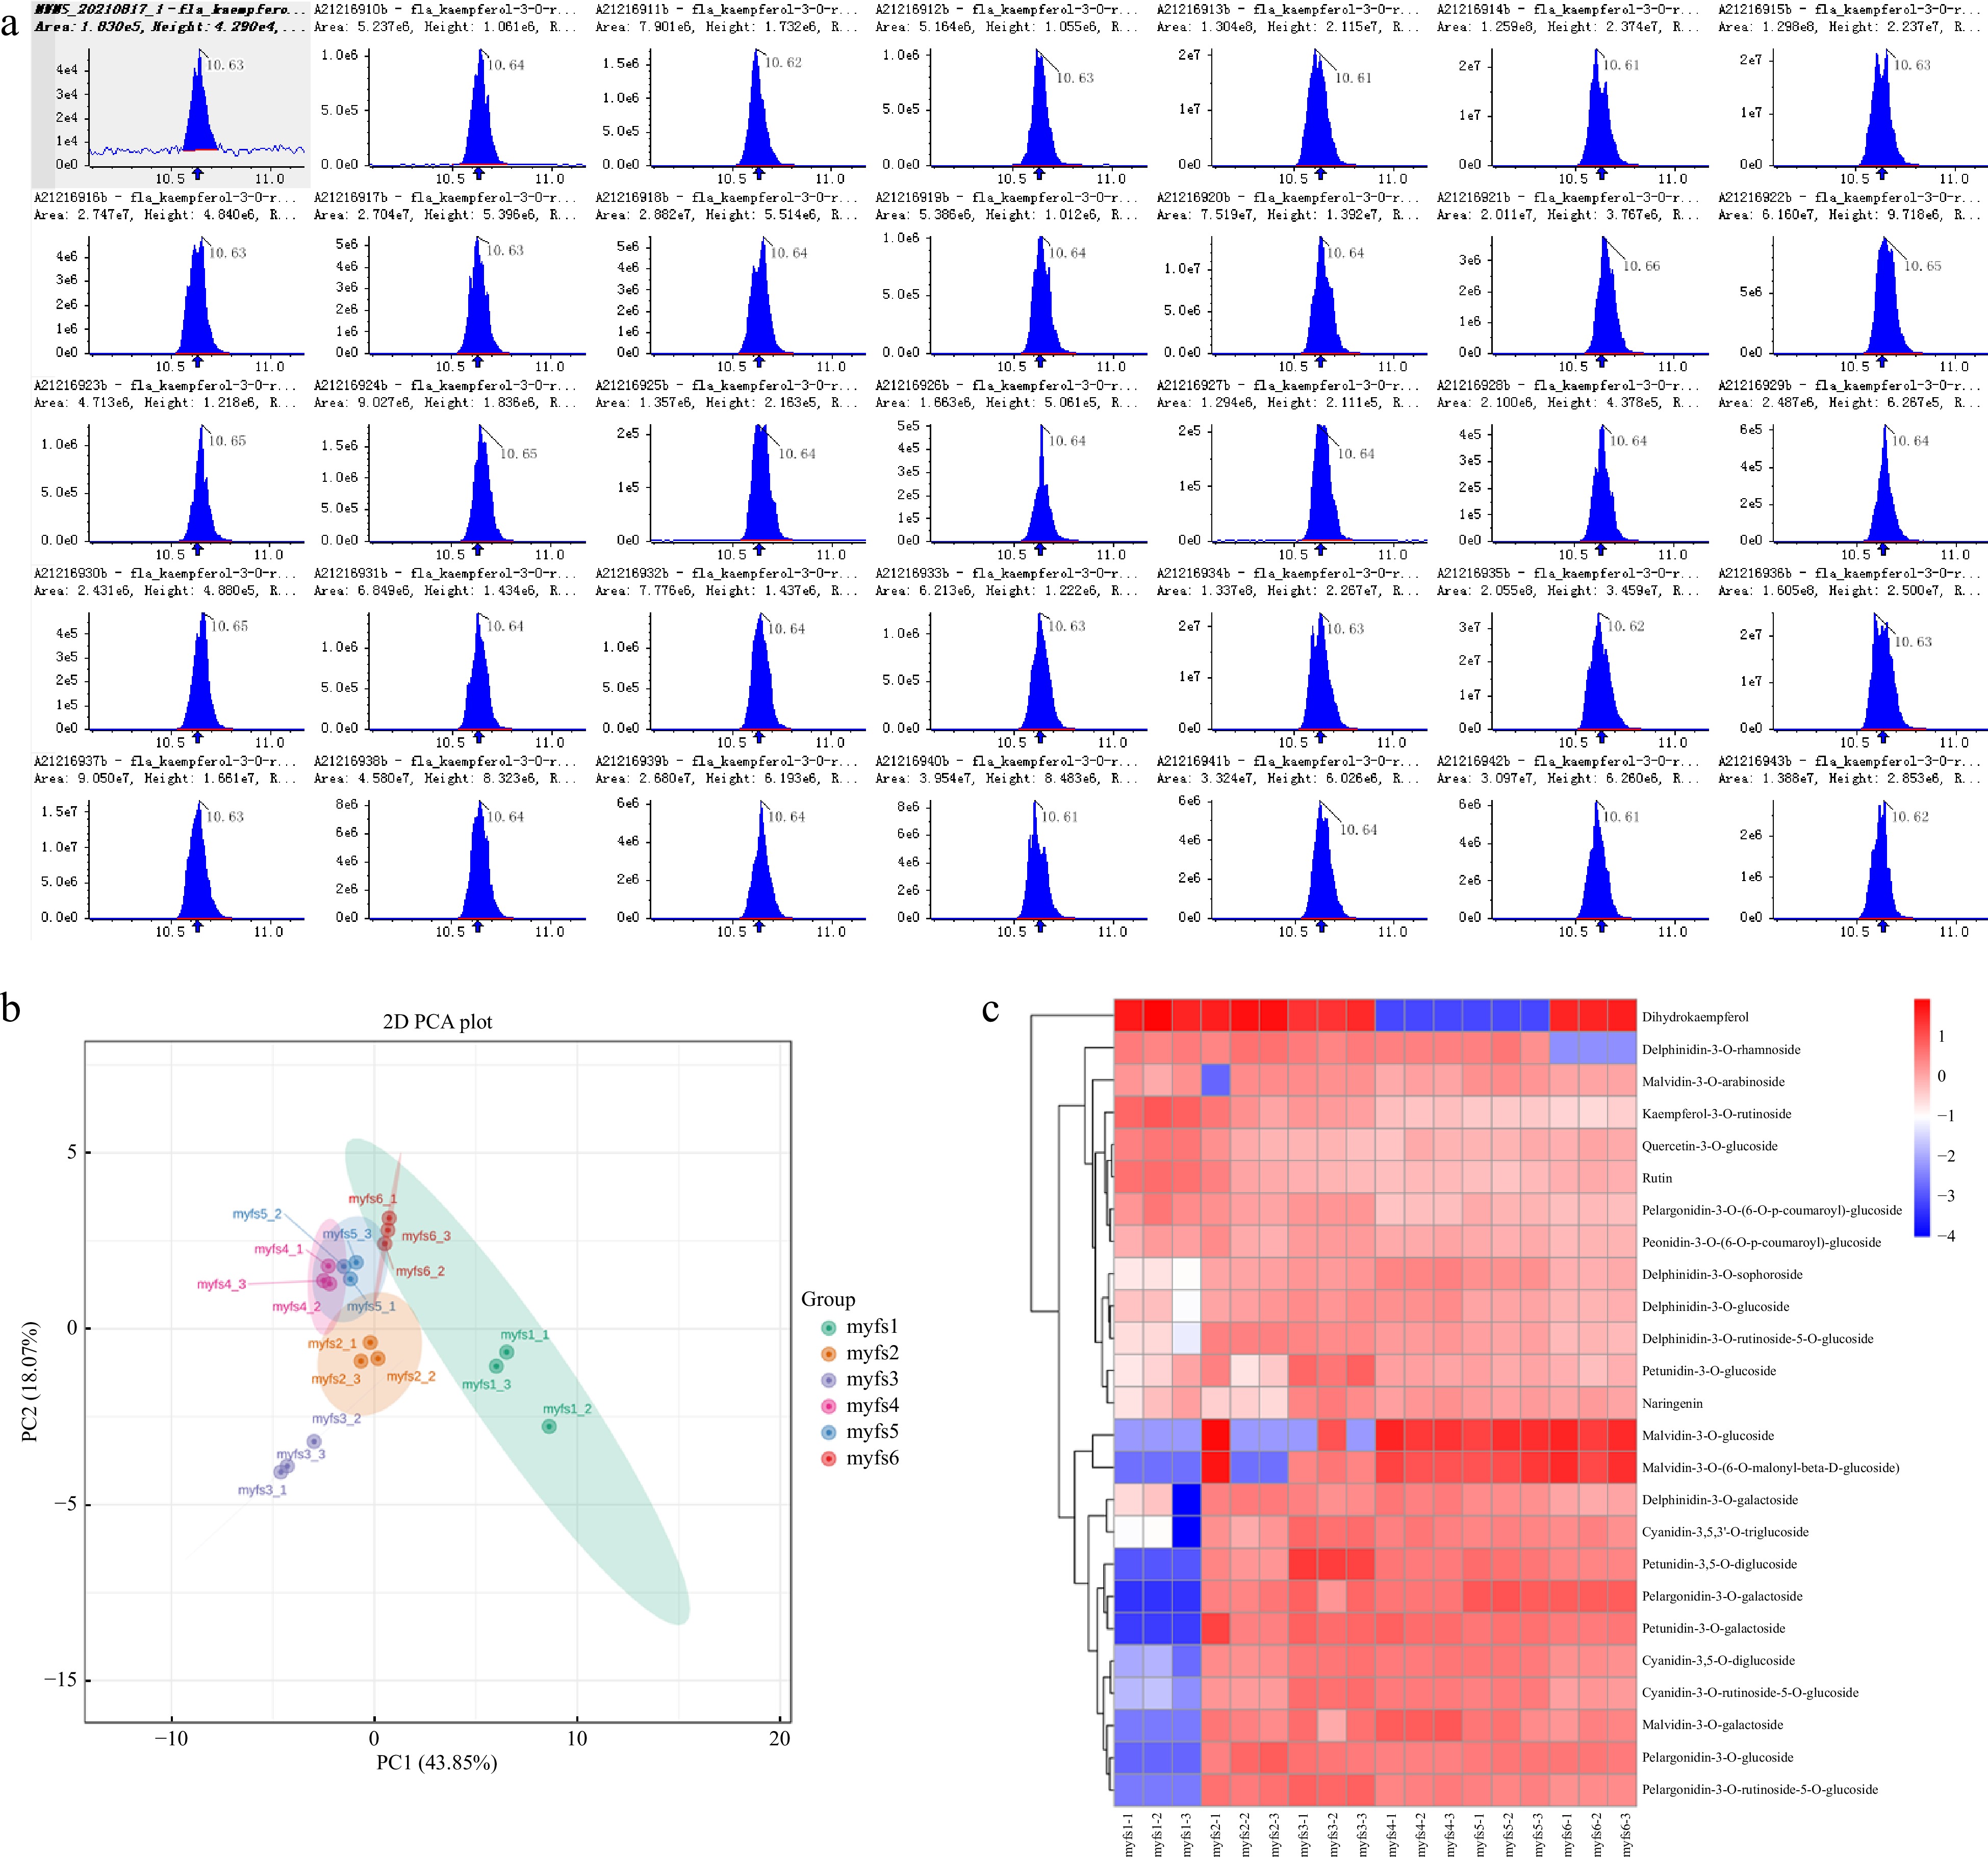
Figure 2.
Metabolomic analysis of the different flowers of C. lanuginosa. (a) Total ion current (TIC) plots of all the samples. (b) Principal component analysis (PCA) plots. Different groups are represented by different colours. (c) Heatmap of metabolites. Different groups are represented by different colours. The X-axis shows the different samples, and the Y-axis shows the metabolites in the different flowers of C. lanuginosa. The upregulated and downregulated genes are shown in red and blue, respectively.
-
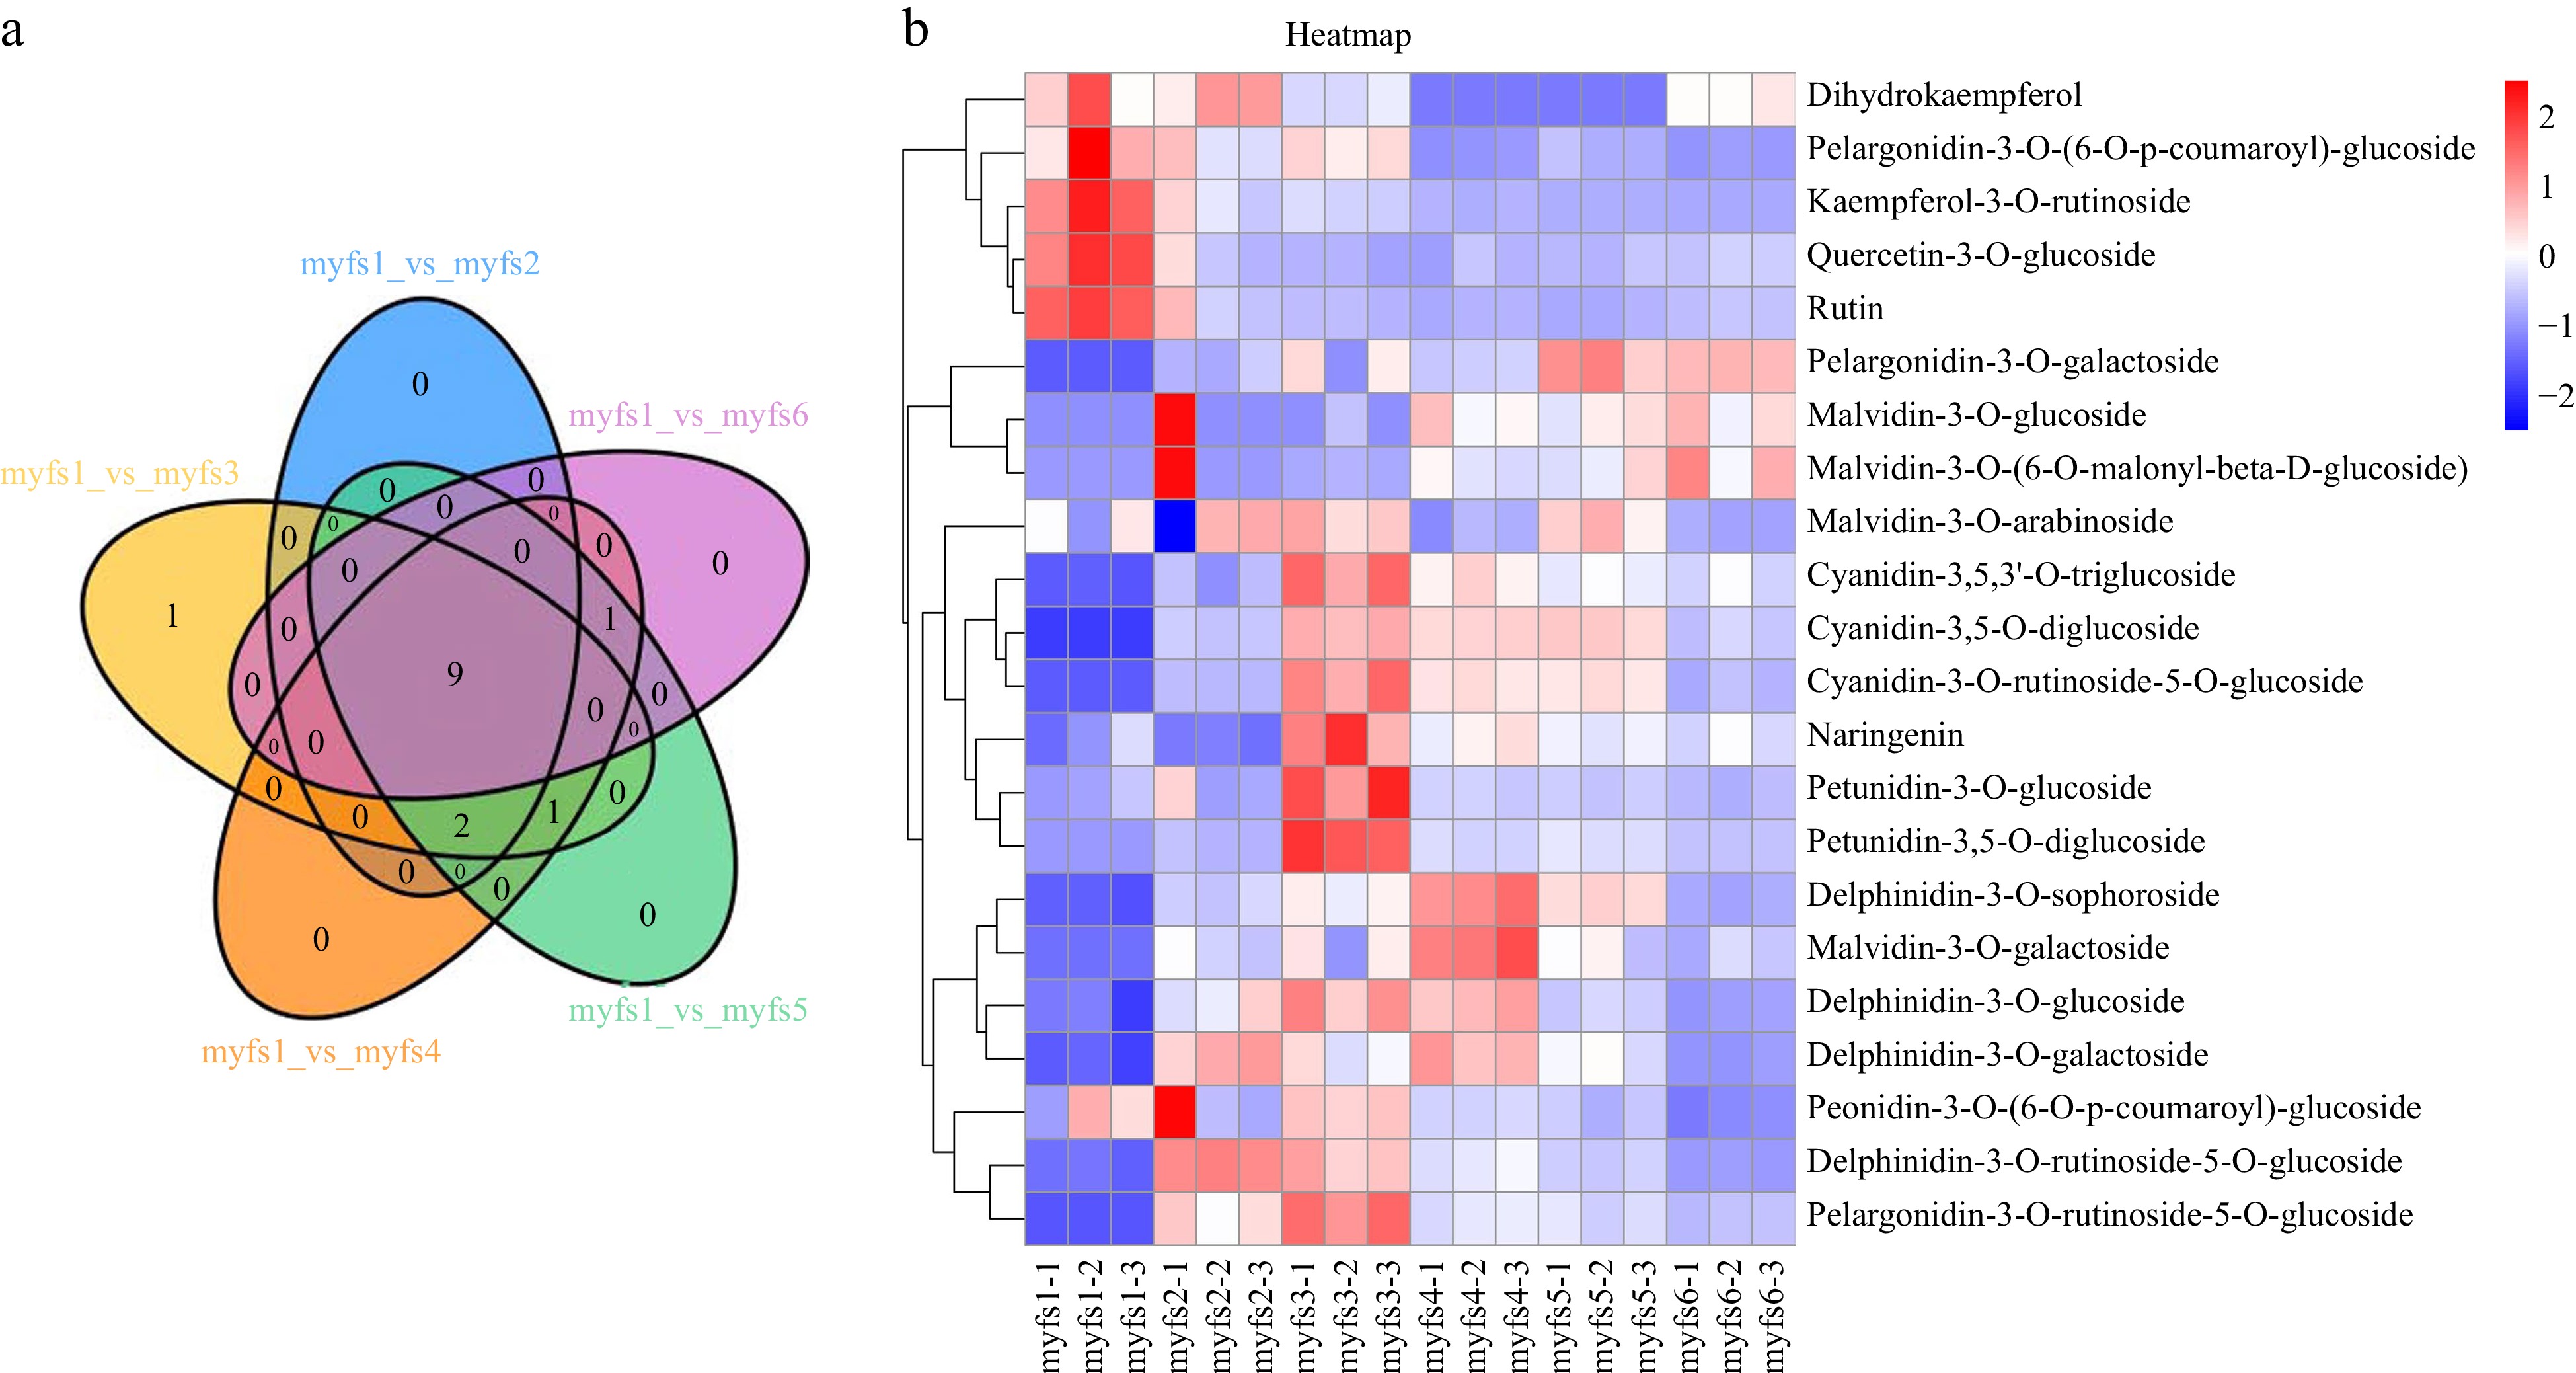
Figure 3.
Analysis of differentially expressed metabolites in flowers of C. lanuginosa. (a) Venn diagram of differentially expressed metabolites. Different comparison groups are represented by different colours. (b) Heatmap of differentially expressed metabolites. Different groups are represented by different colours. The X-axis shows the different samples, and the Y-axis shows the metabolites. The upregulated and downregulated genes are shown in red and blue, respectively.
-
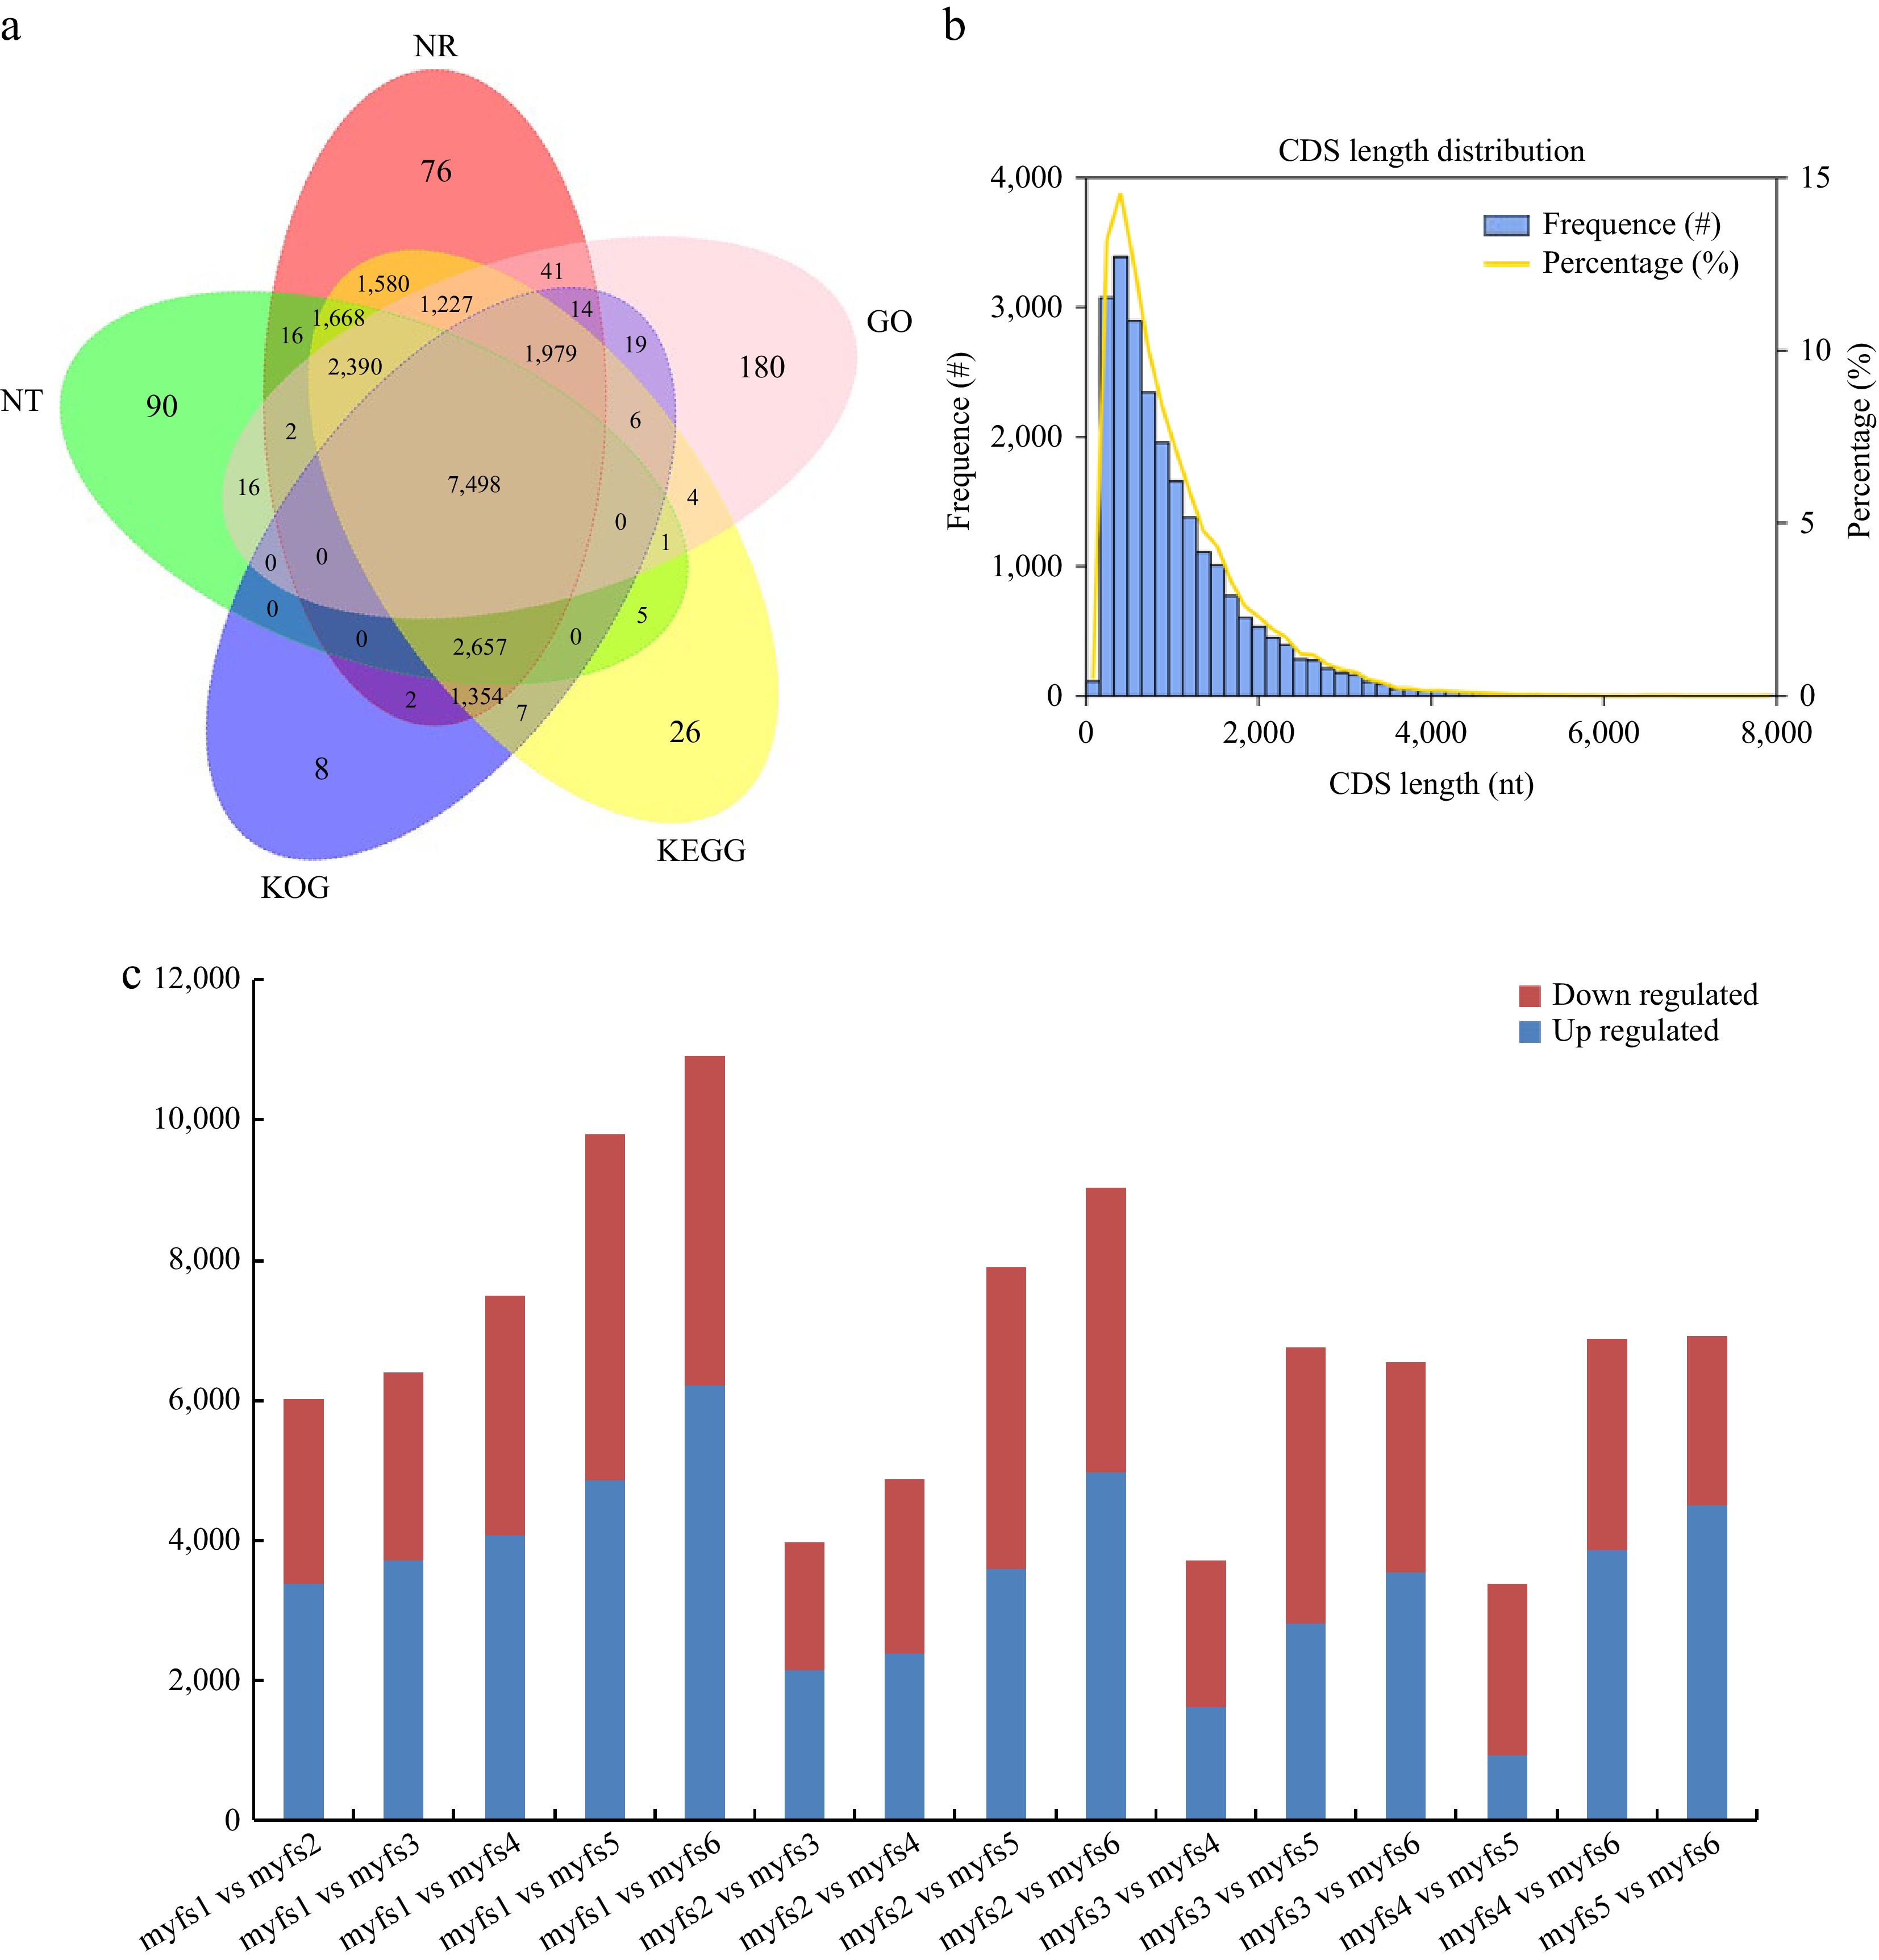
Figure 4.
Transcript annotation and CDS prediction. (a) Venn diagram of the full-length transcriptome annotation results; different comparison groups are represented by different colours. (b) CDS prediction in the full-length transcriptome. The X-axis shows the CDS length, the left Y-axis shows the occurrence frequency of the CDSs of different lengths, and the right Y-axis shows the proportion of CDSs of different lengths. (c) DEGs during C. lanuginosa flower development. Red bars represent upregulated DEGs, and blue bars represent downregulated DEGs.
-
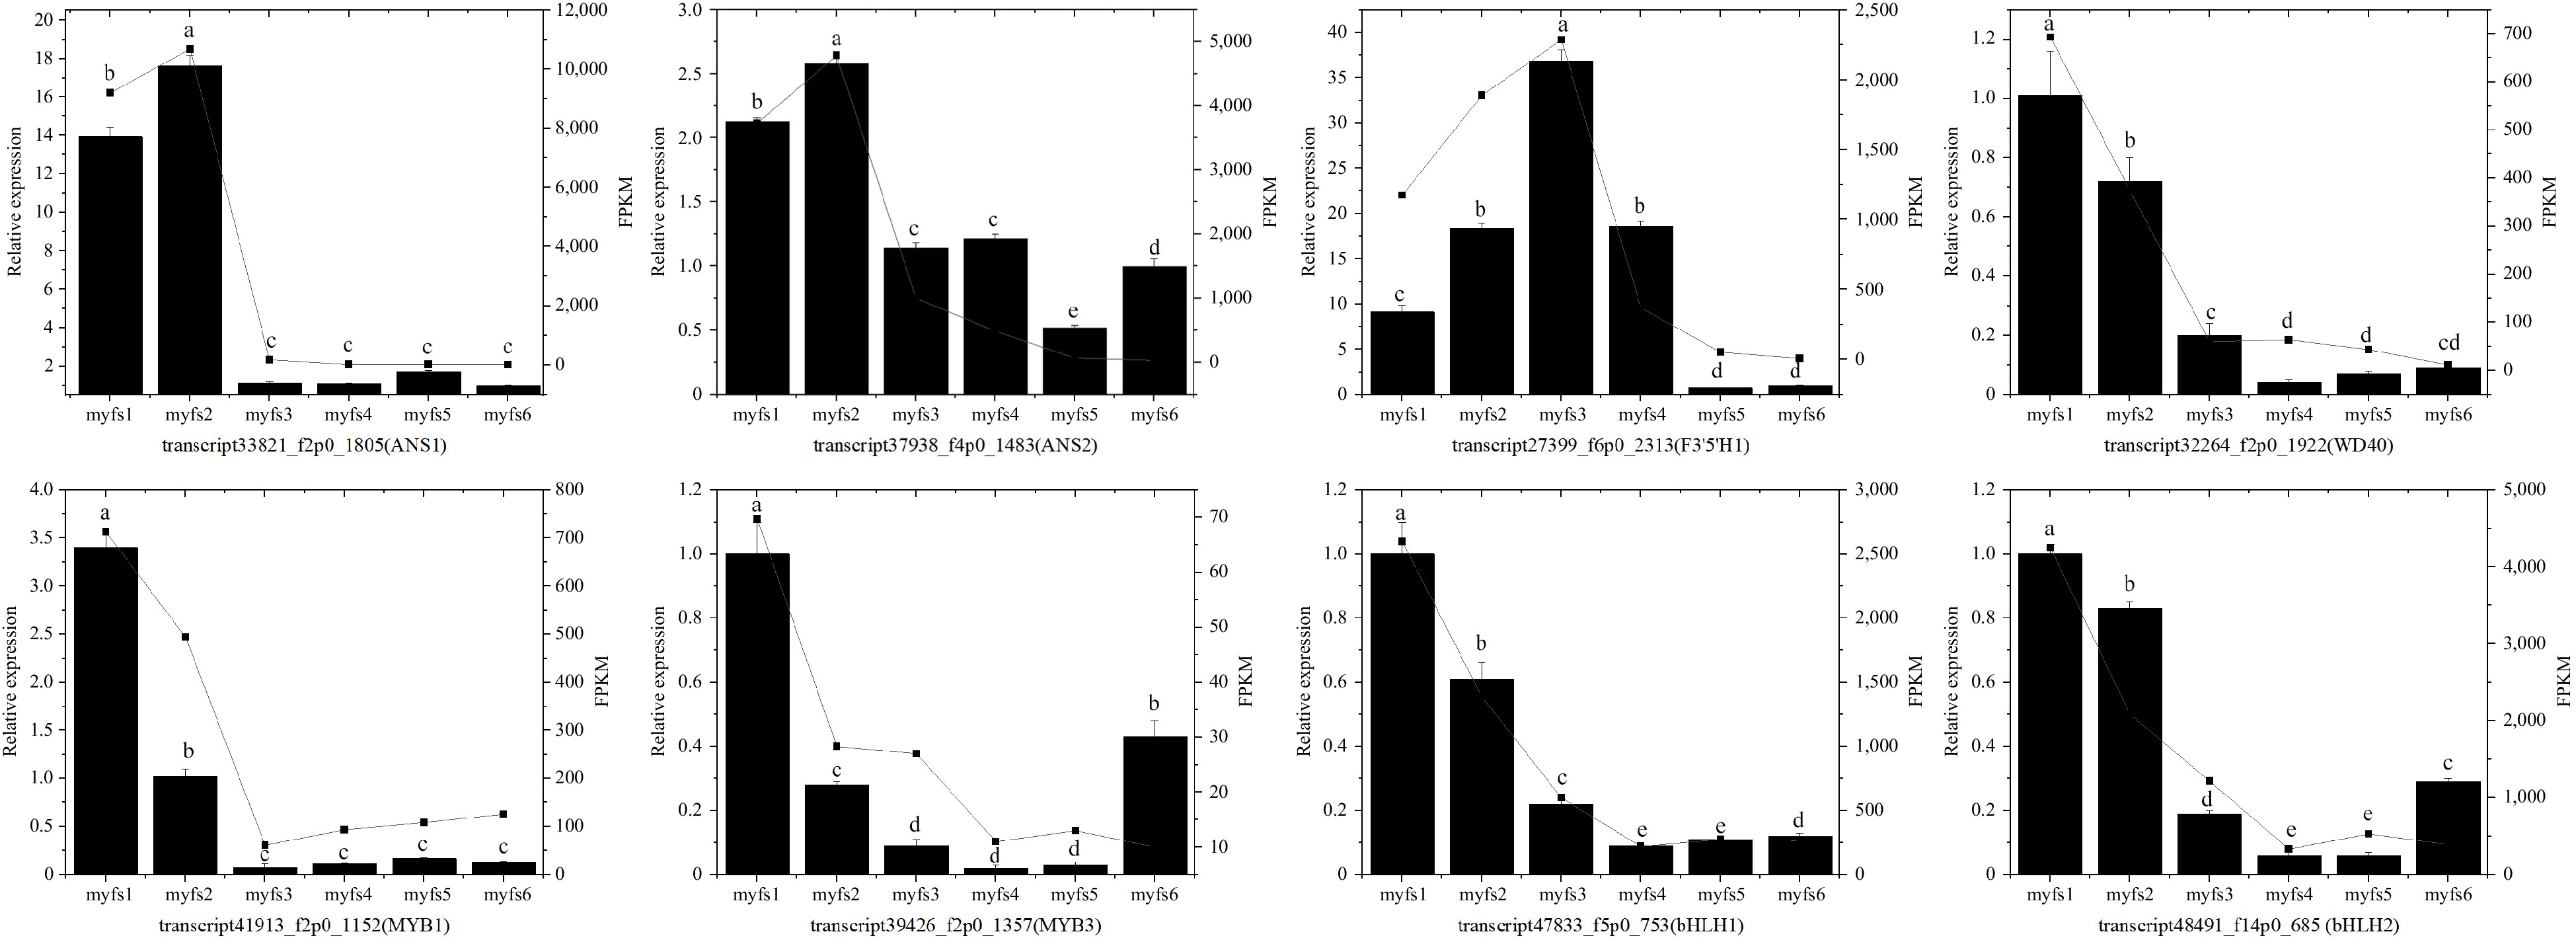
Figure 5.
Identification of the expression profiles of eight unigenes in C. lanuginosa. The bar chart presents the relative expression levels of the genes, and the point line diagram presents the FPKM values of the unigenes. The left Y-axis represents the relative expression, whereas the right Y-axis represents the FPKM values of the unigenes. (a)−(e) Indicate statistical significance.
-
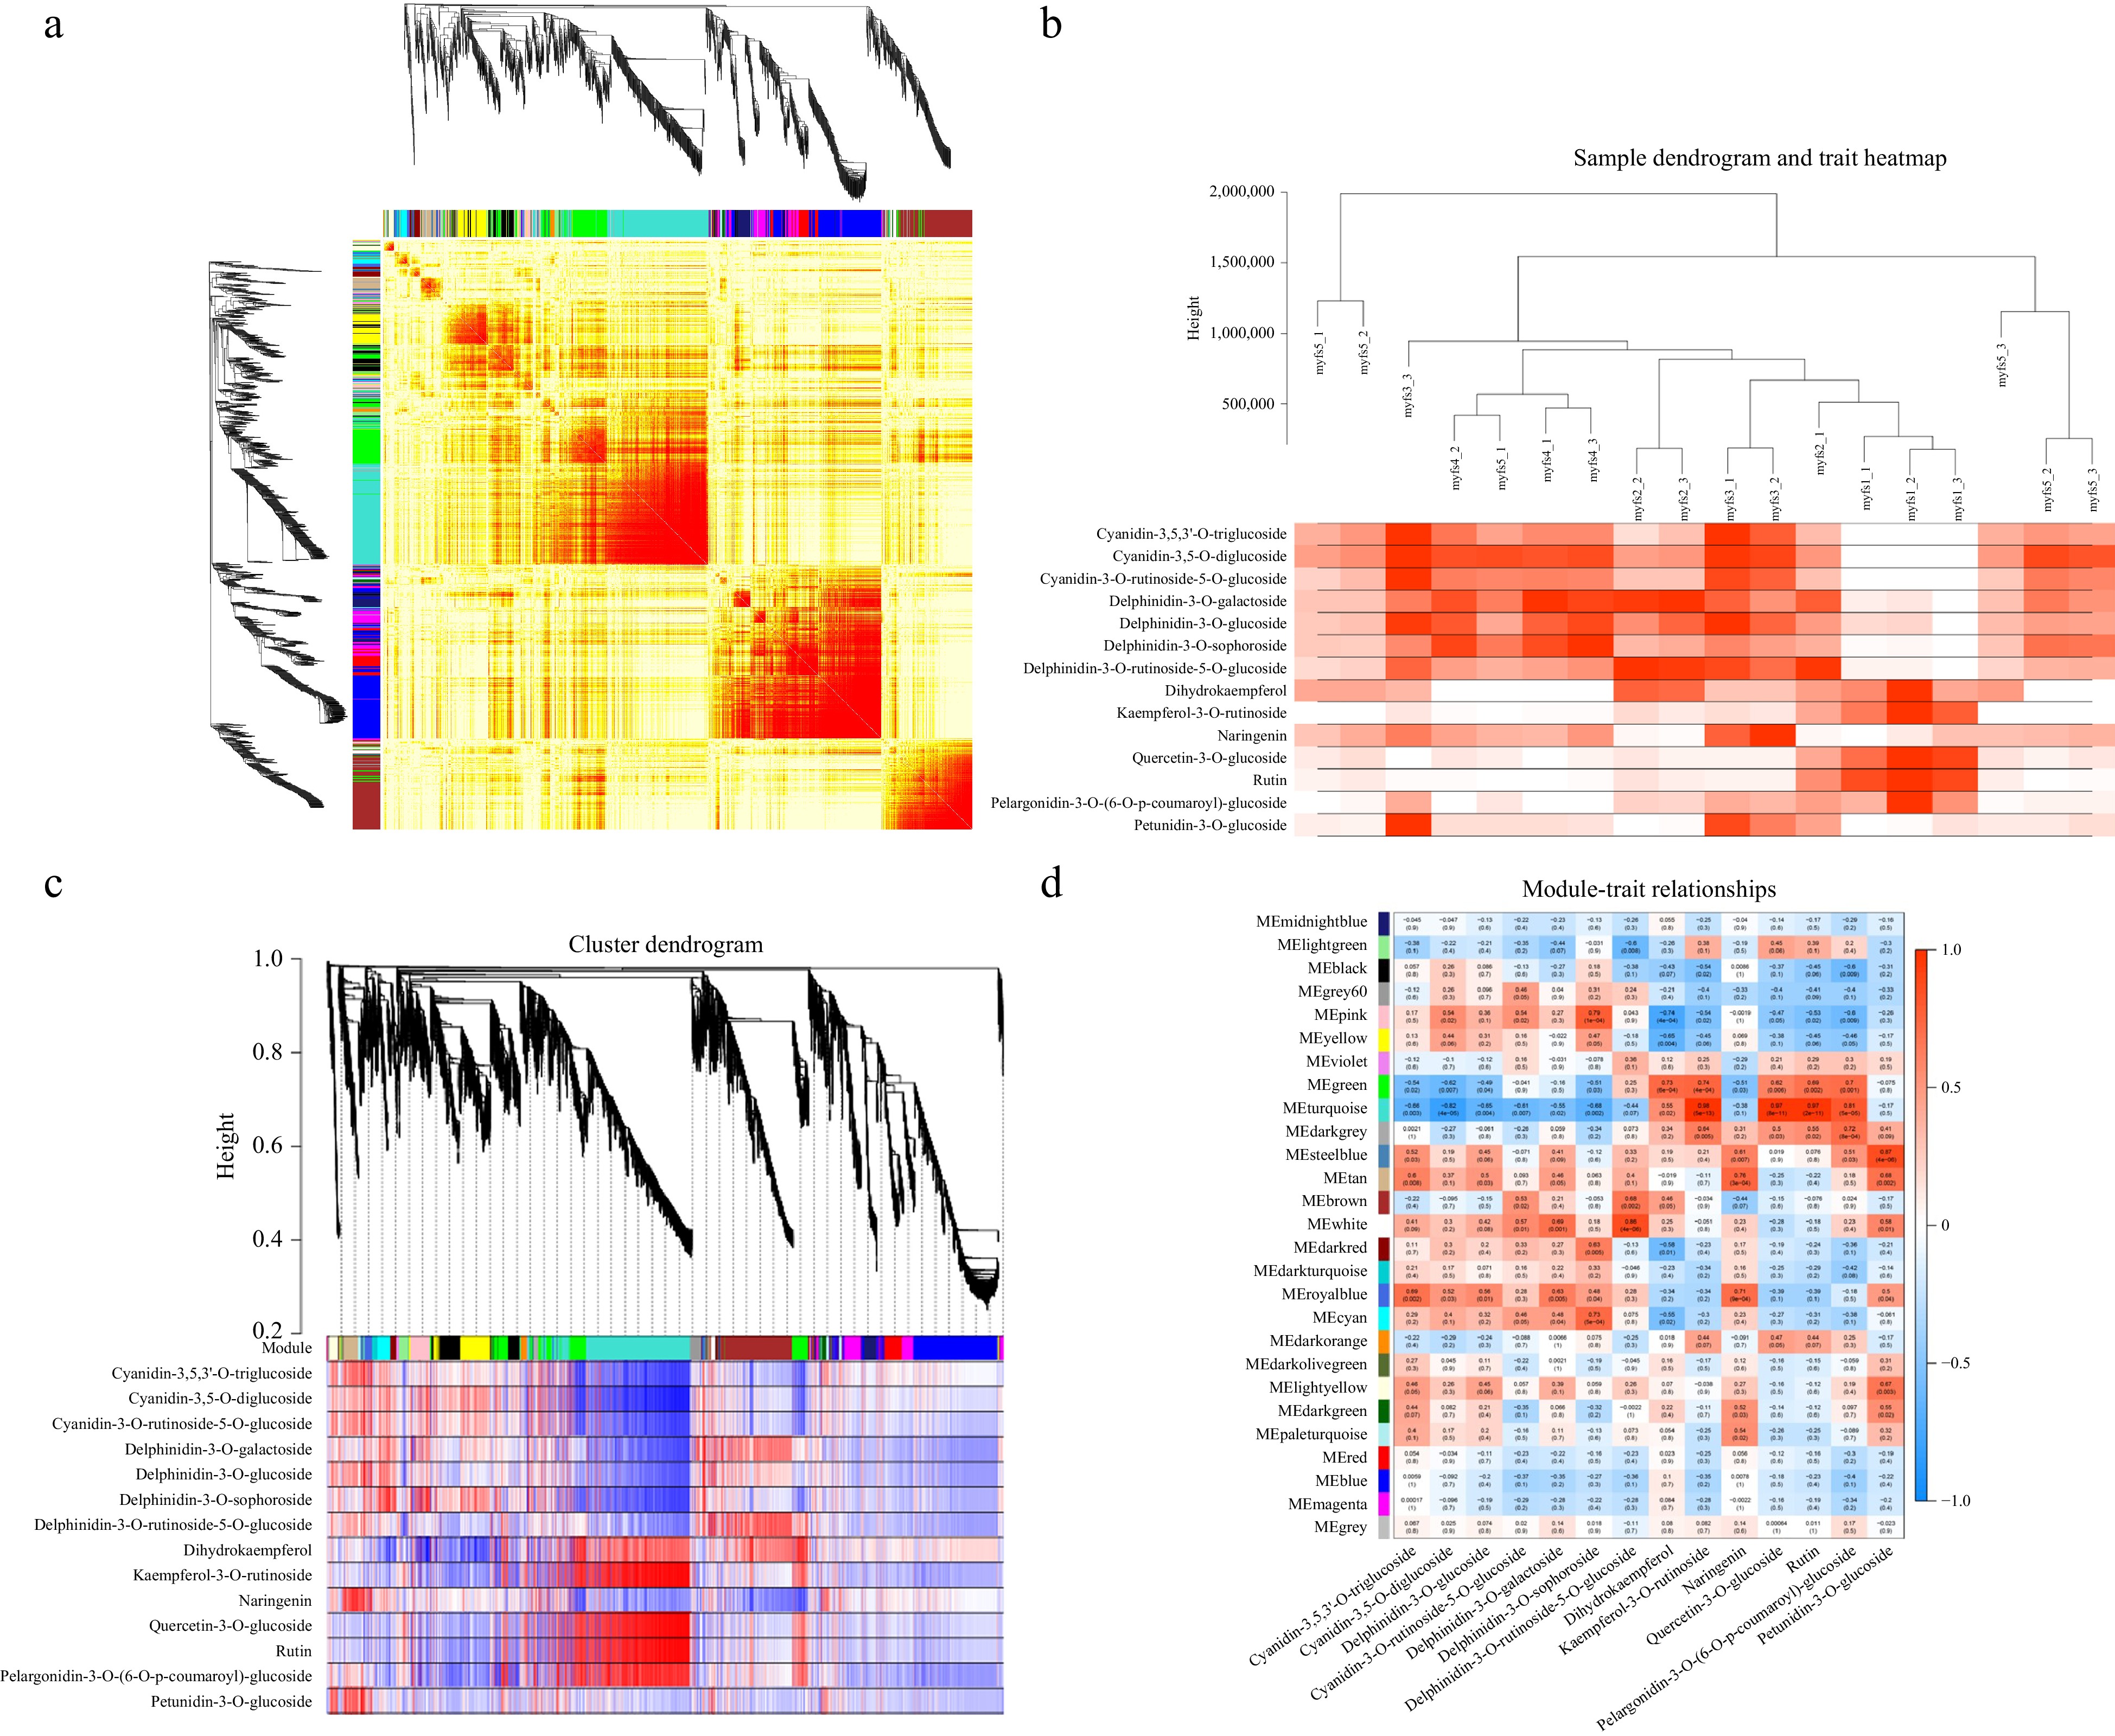
Figure 6.
Coexpression patterns of metabolism-related genes. (a) Cluster dendrogram and network heatmap of the genes calculated by the coexpression module. (b) Modular trait heatmap of the sample dendrograms at each developmental stage. (c) Hierarchical clustering showing the 11 modules with coexpressed genes. (d) Module‒trait associations based on Pearson correlation. The colours from green to red represent −1 to1.
-
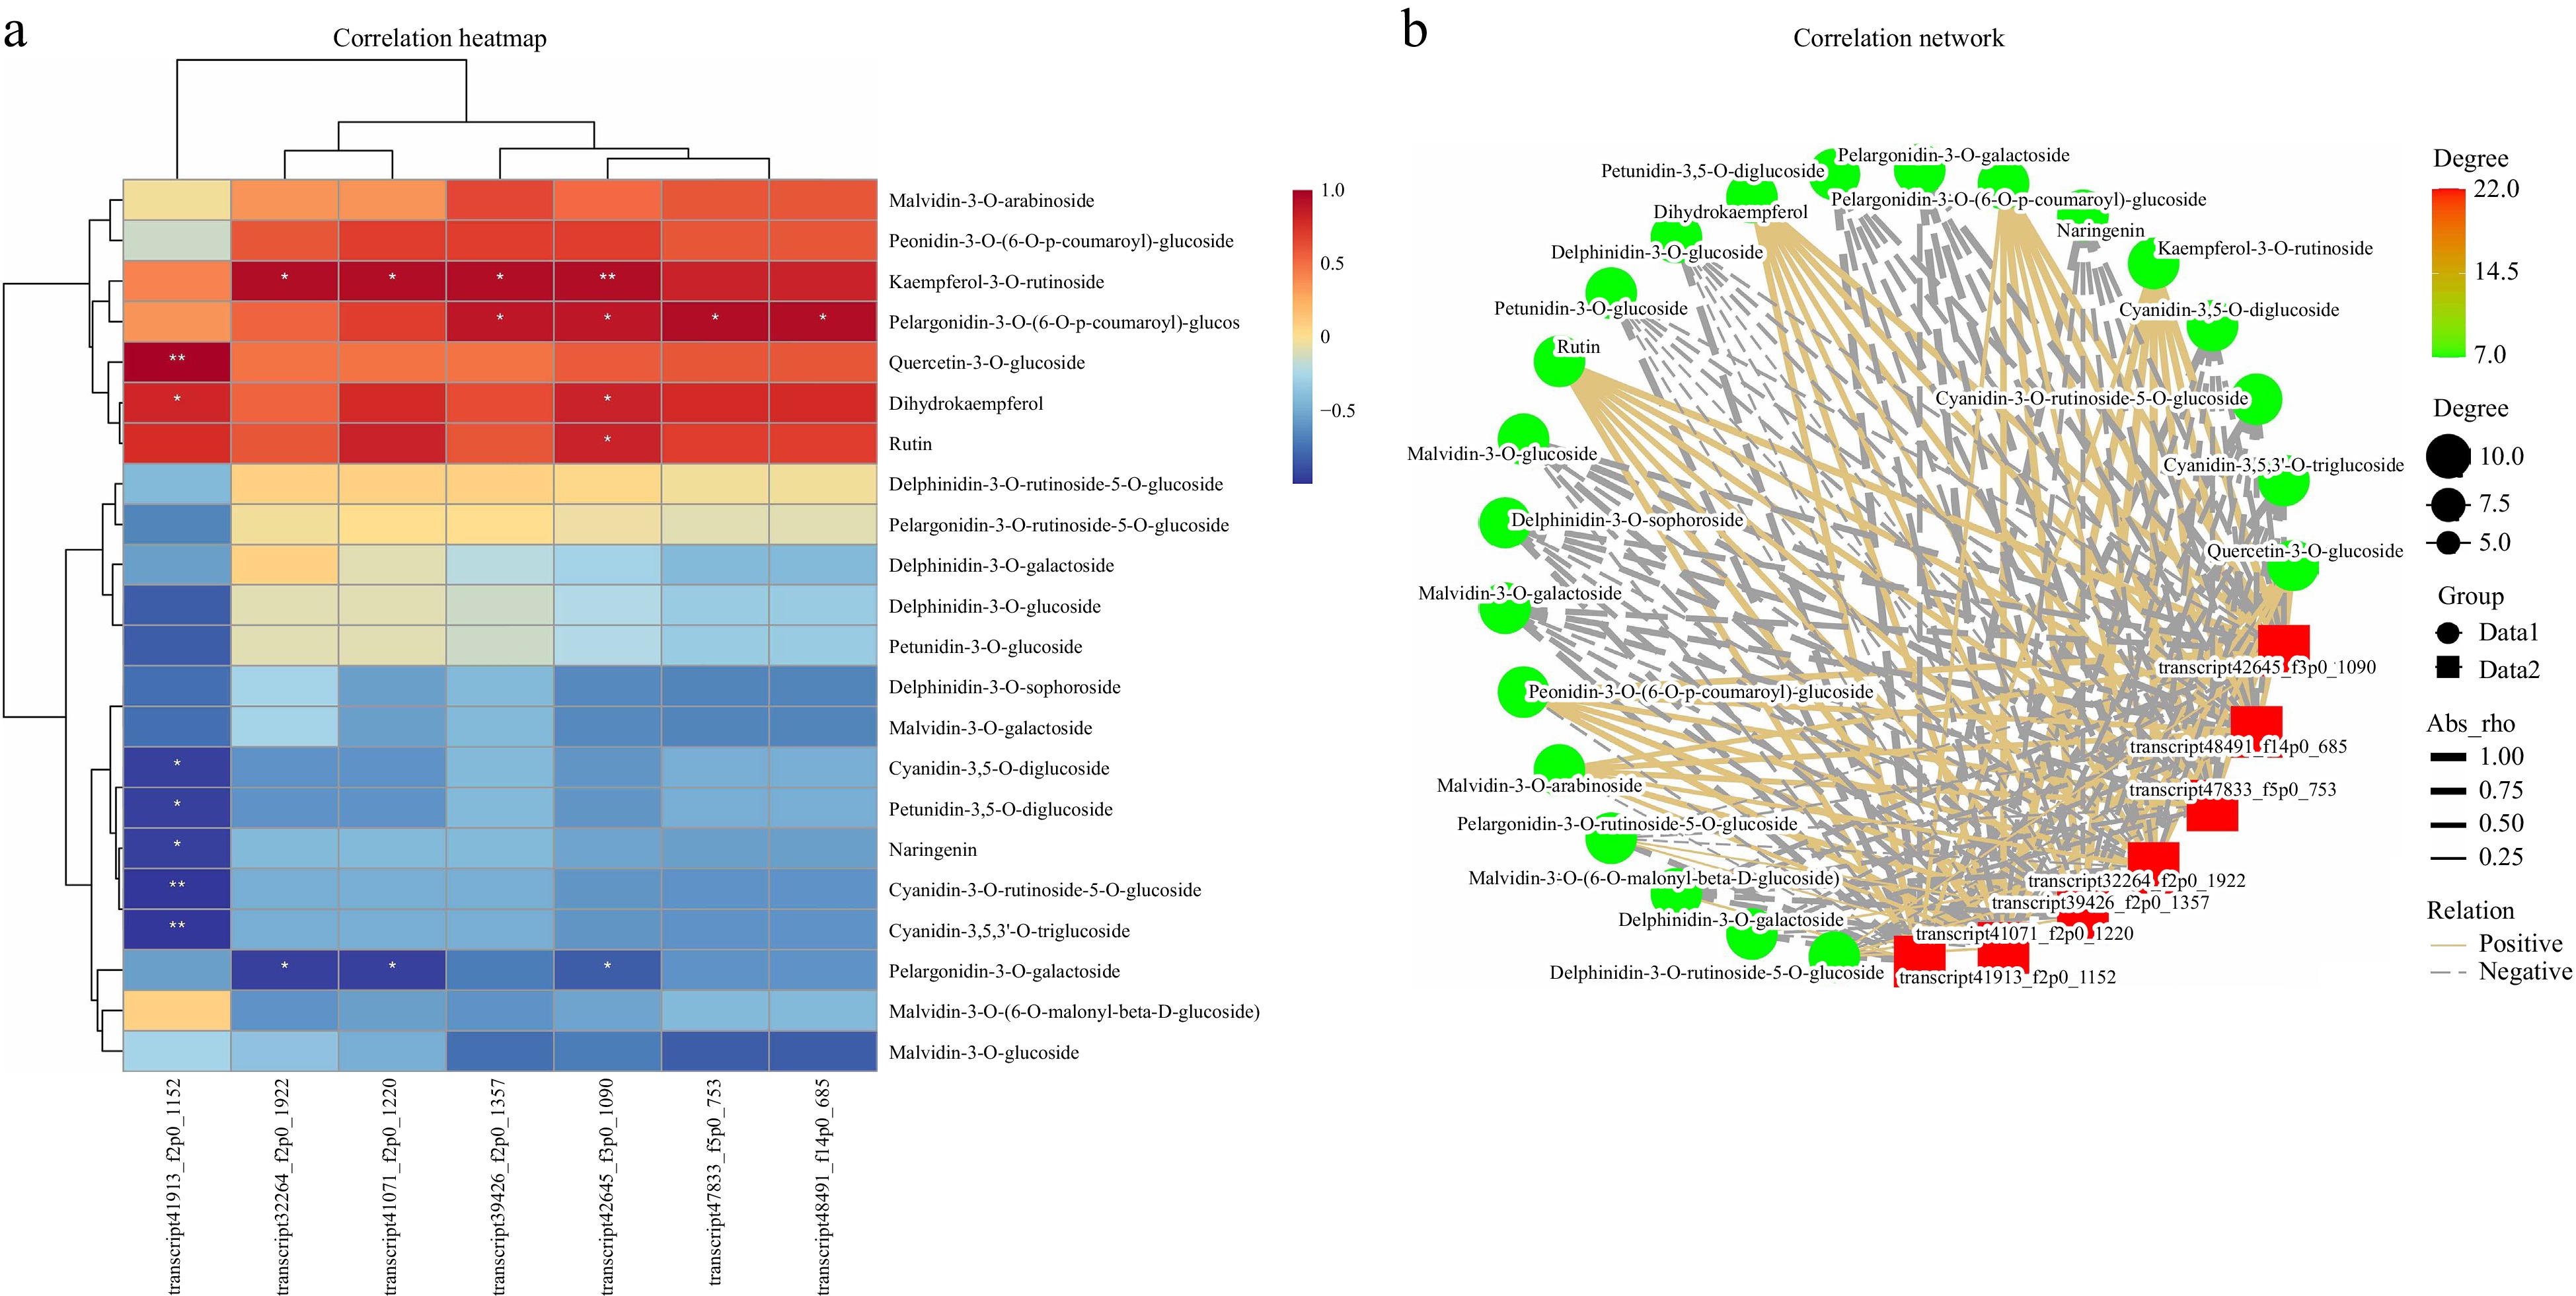
Figure 7.
Correlation analysis of transcription factors and differentially expressed metabolites. (a) Heatmap of transcription factors and differentially expressed metabolites; the X-axis represents transcription factors, and the Y-axis represents differentially expressed metabolites. (b) Network plots of transcription factors and differentially expressed metabolites. Red represents transcription factors, and green circles represent differentially expressed metabolites.
-
Gene Primer-F Primer-R GAPDH AACCCCTGAGGAGATTCCA CACCACCCTTCAAGTGAGCAG ANS1 ATTGTGCACATCGGTGACAC CGACTCACTGACAAGTTCTG ANS2 TGCCTGGTCTCCAAGTGTAC CTAGCCCTCTATGCAGTATAC F3'H1 TCTTGTTGAGTACATCTTGG GACACTAGGTGGCAAGCGTG WD40 ATGAGCGAGAATTGCTGAGC TGCTACTGTGCATCCATCTG MYB1 AAGGCCGTTGGGATACGTTA ATCCTAGACCACCTGTTGCC MYB2 CACTGTTACCTCCGACGAGA CAGGTCTGTATCCTCGCTGT bHLH1 TGAAGACACCTGAAGGGCAA TCGTTGGAGCAAGATTCGGT bHLH2 TGCGAAGGAGTTCTGGTGAA ATGGCAAGAGAAGTCCCGAA Table 1.
Primers for qRT-PCR.
-
Sequencing number Flower stage RSHCC Colour myfs1 Bud stage N144D yellow‒green myfs2 Coloration stage N88C light blue‒purple myfs3 Early flowering stage N88B dark purple myfs4 Flowering stage 90D bright blue‒purple myfs5 Post flowering stage 91B lilac purple stage myfs6 End flowering stage 91C extremely lilac purple stage Table 2.
Flower color identification of C. lanuginosa.
Figures
(7)
Tables
(2)