-

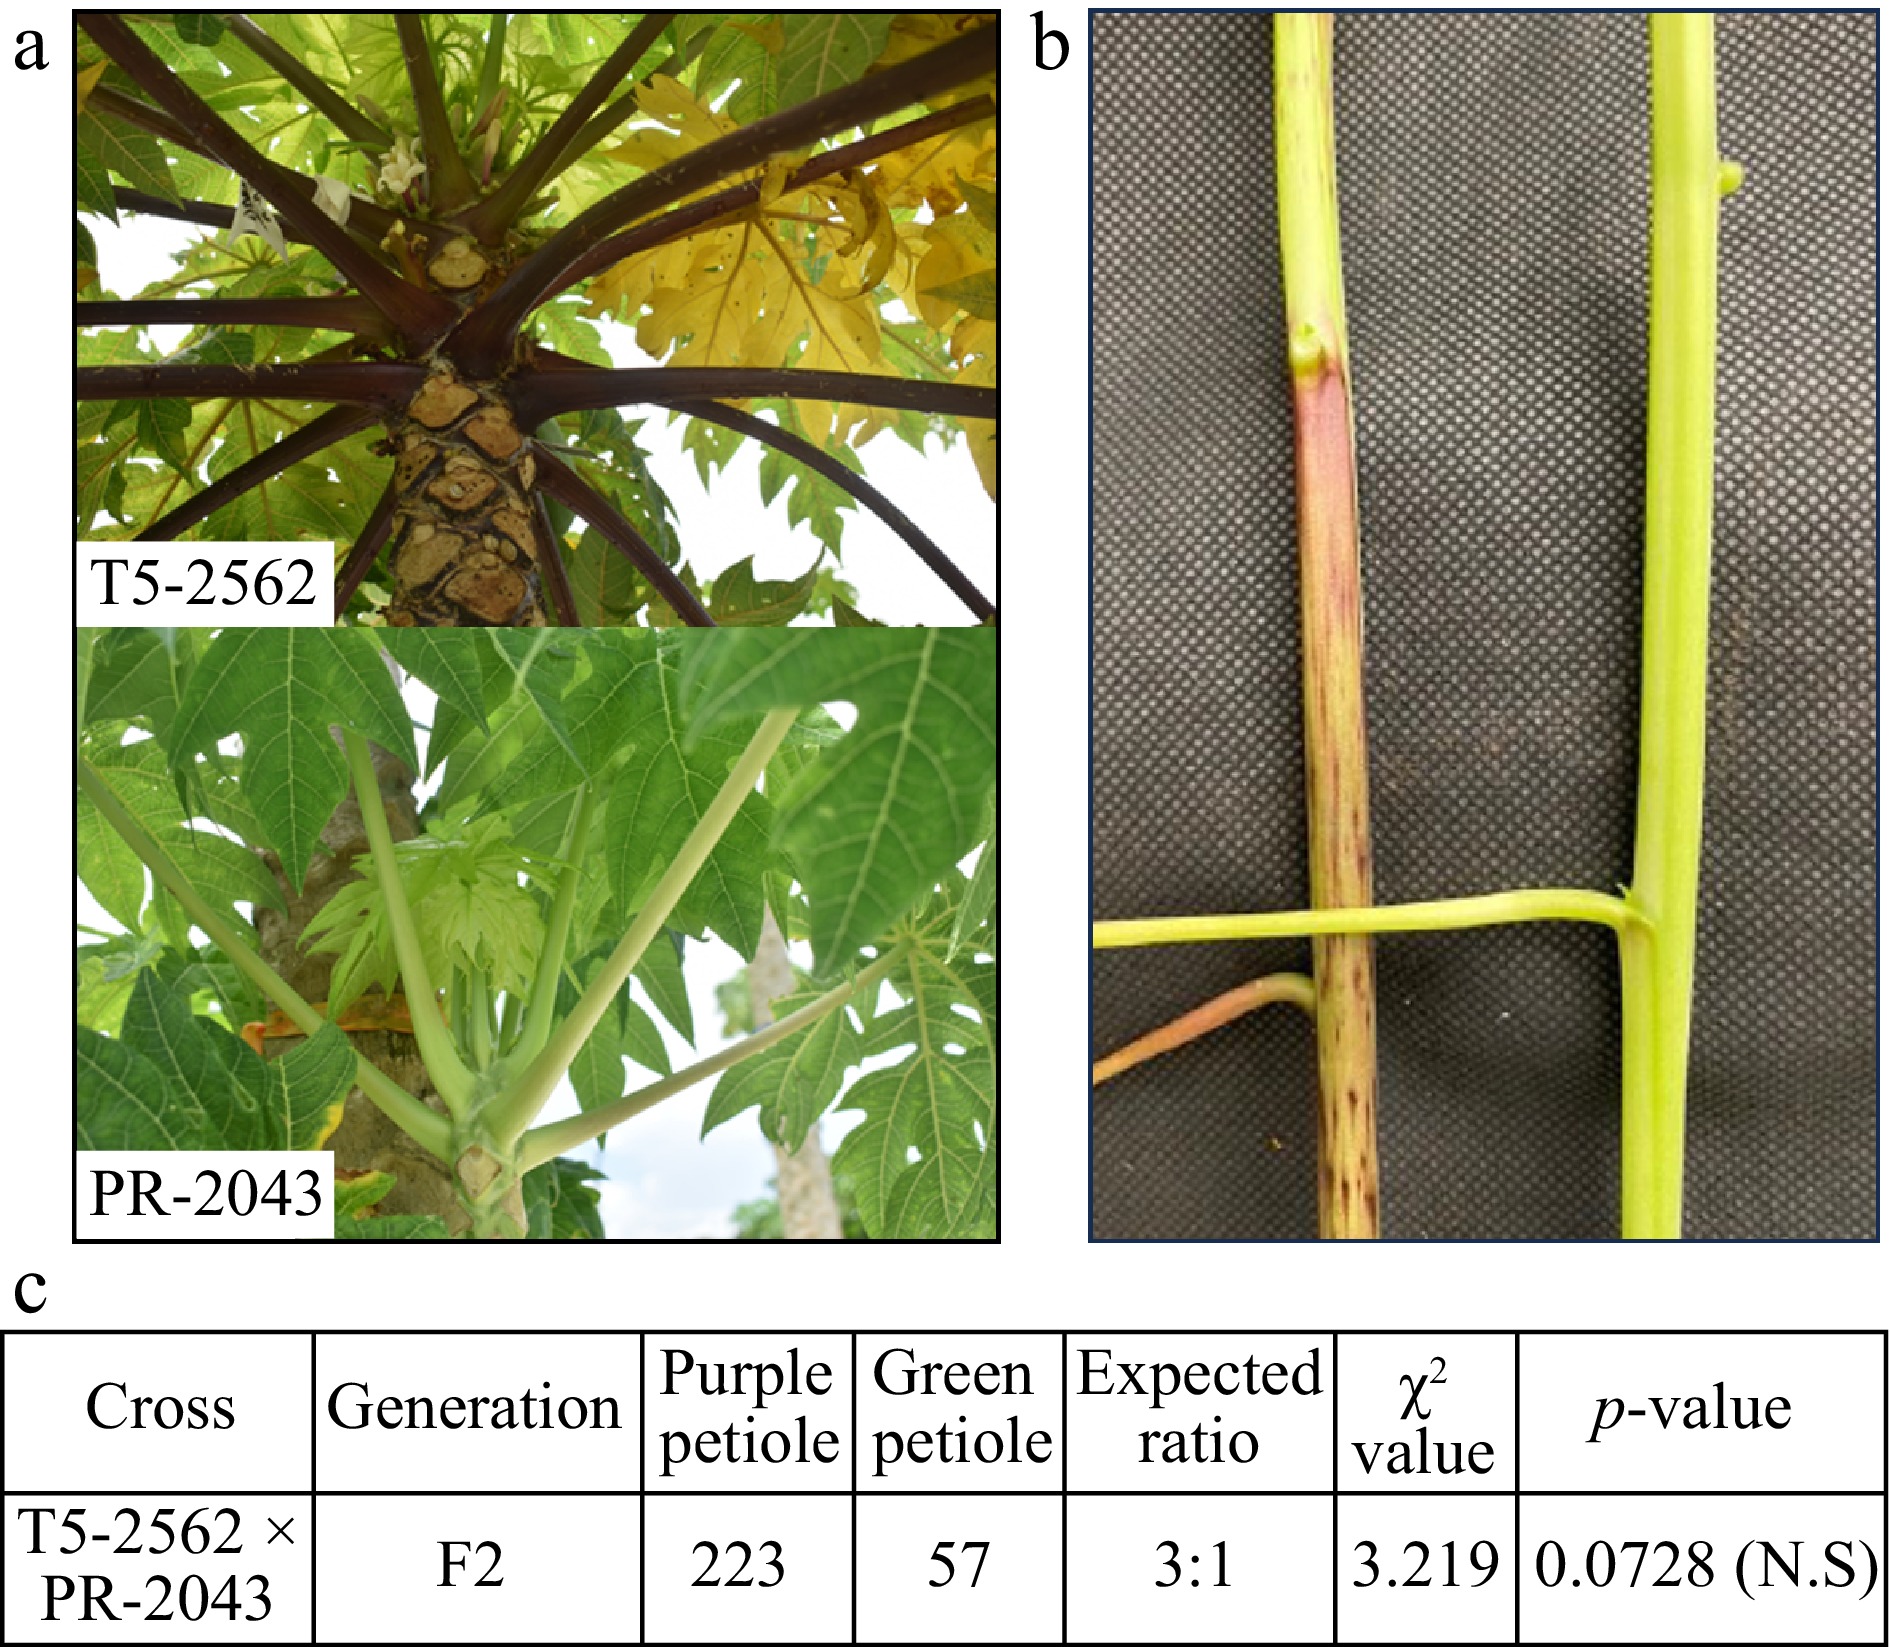
Figure 1.
Phenotypes of papaya petioles. (a) Petiole color of PR-2043 and T5-2562 parents. (b) Purple and green petioles of papaya F2 population. (c) Segregation of petiole color in the F2 population.
-

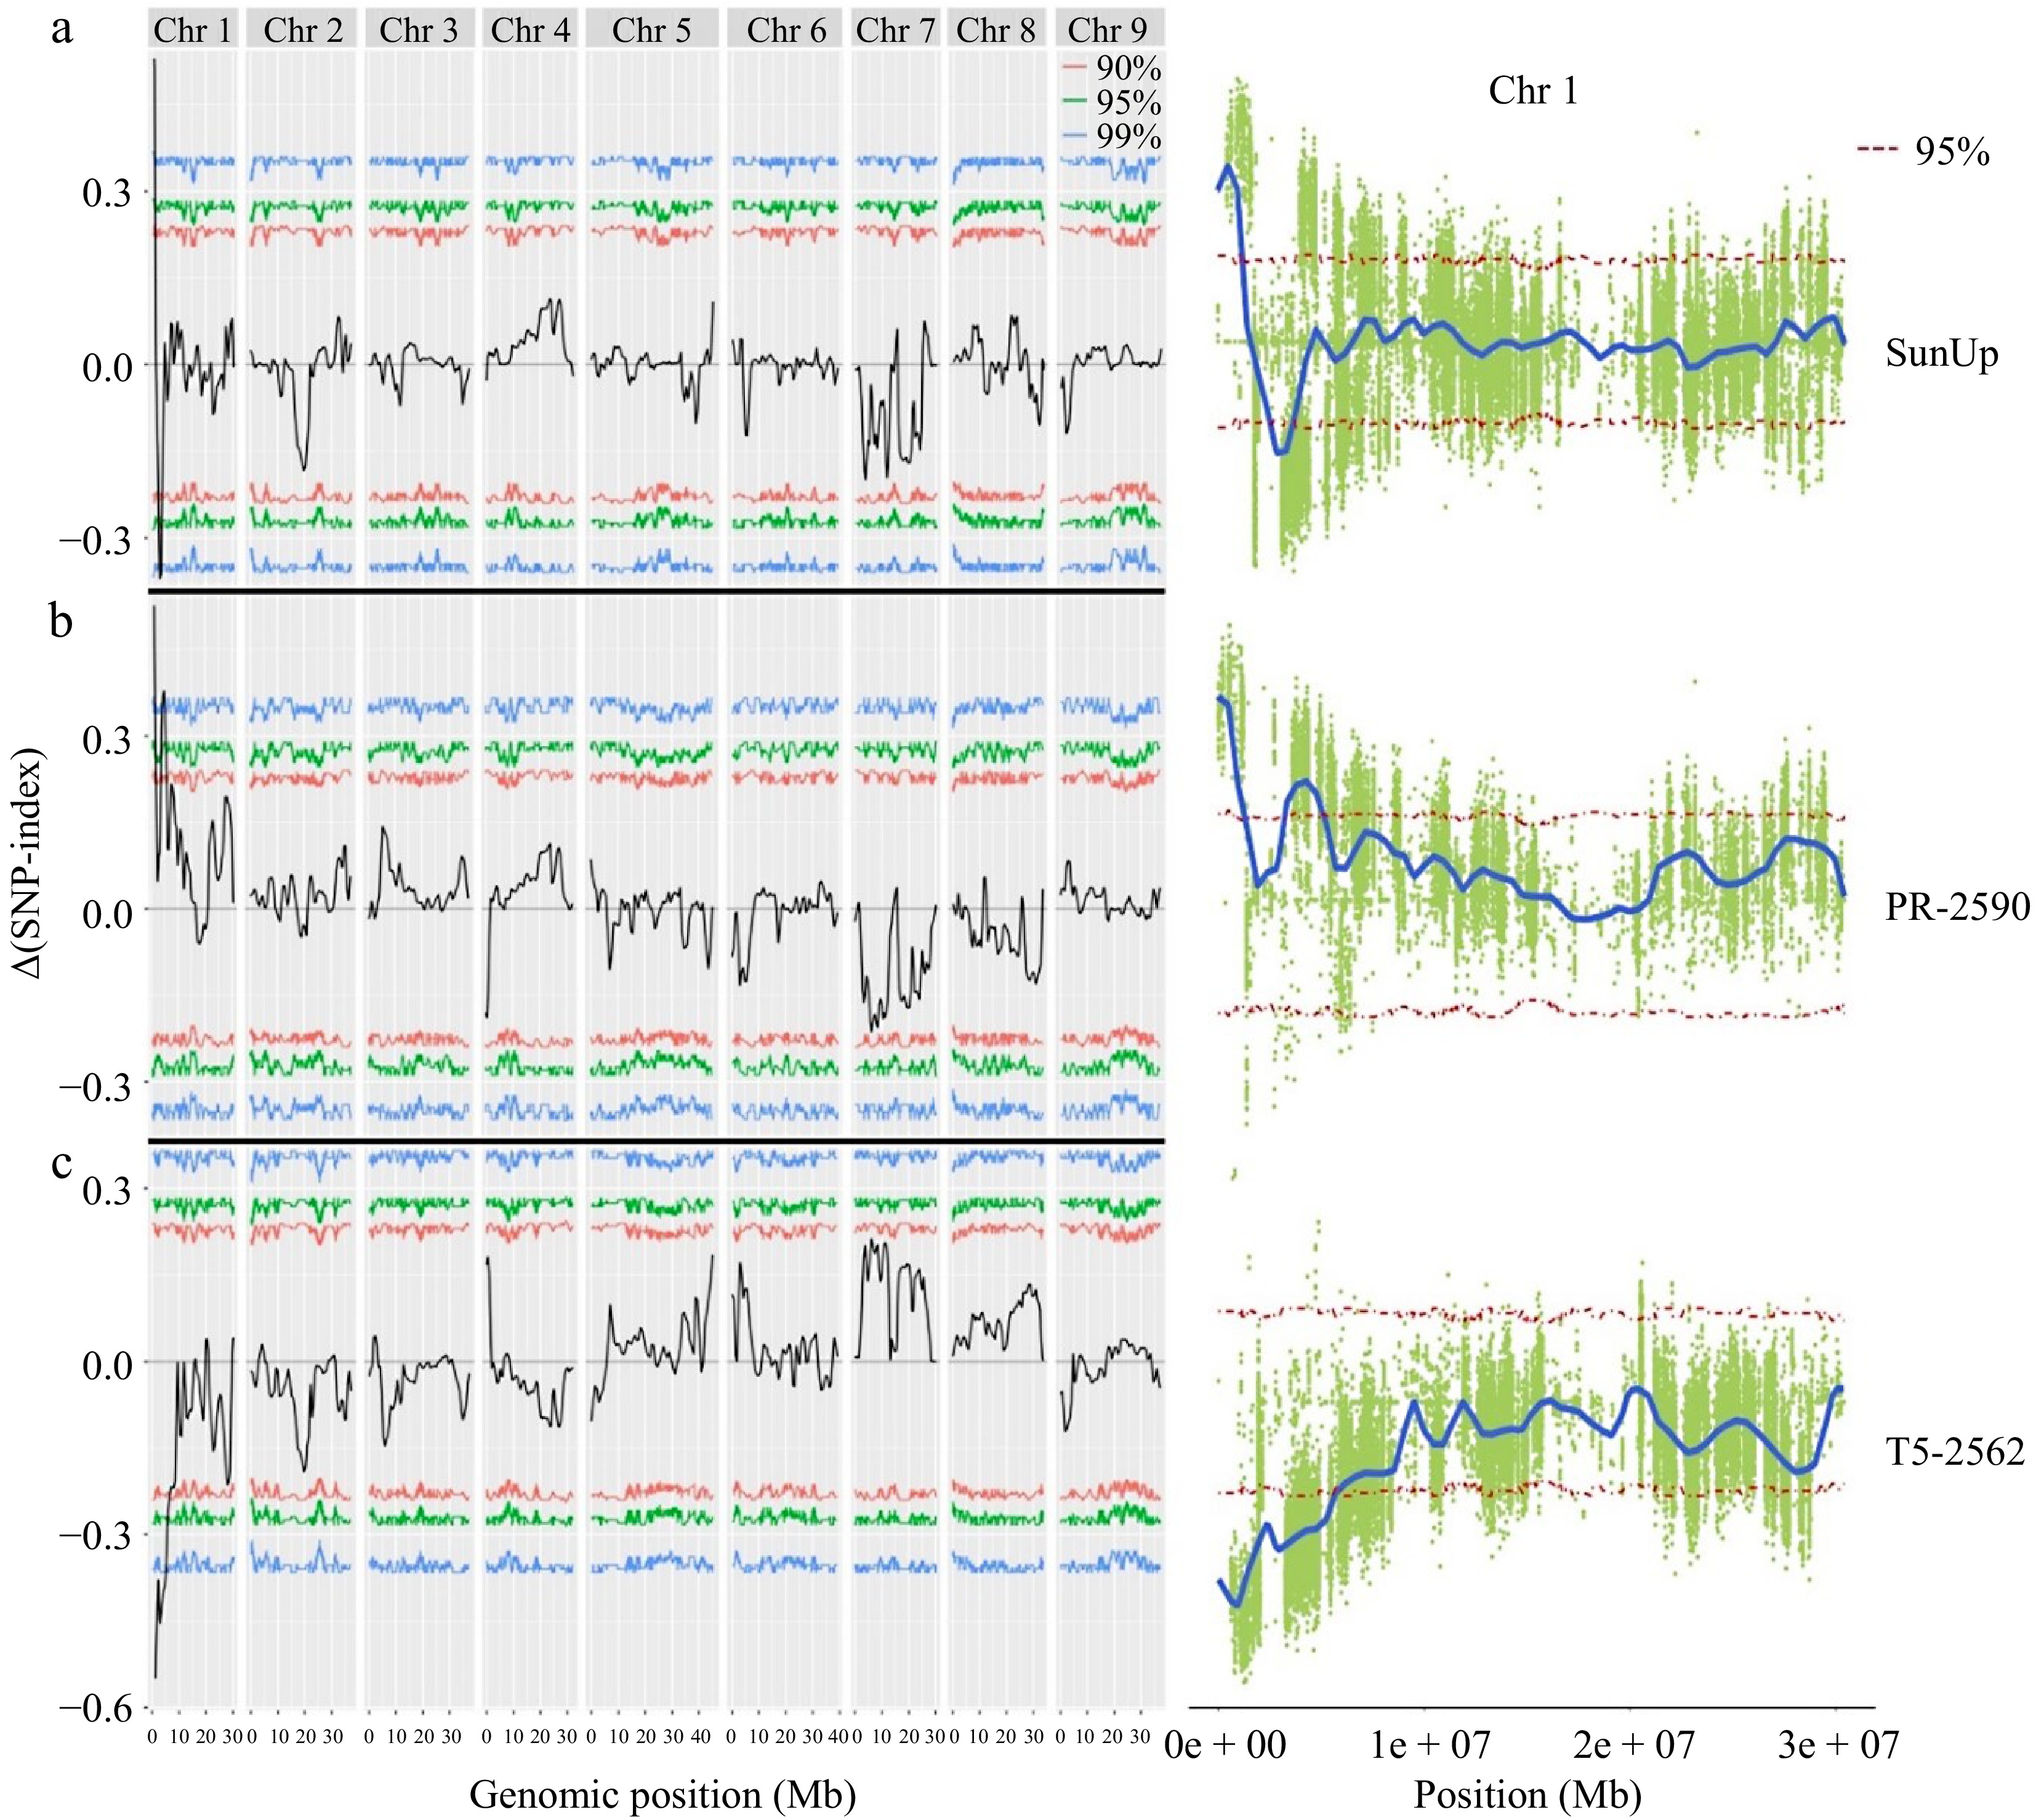
Figure 2.
QTL regions associated with papaya petiole color in three genomes, (a) SunUp, (b) PR-2590, and (c) T5-2562.
-

Figure 3.
Candidate genes associated with anthocyanin accumulation in papaya petiole. (a) The statistical information of candidate genes expression in different material. (b) The expression level validation of CHS and MYB20 in purple and green papaya petiole by q-PCR.
-
Sample Raw reads Raw data Sequencing
depthEffective (%) GC (%) T5-2562 149366802 22.4 63.87 99.12 37.36 PR-2590 194642908 29.2 83.23 98.40 37.26 F2P 142694068 21.4 61.02 98.03 37.05 F2G 194944976 29.2 83.36 98.29 36.89 Table 1.
Sequencing information of parental lines and two bulks.
Figures
(3)
Tables
(1)