-
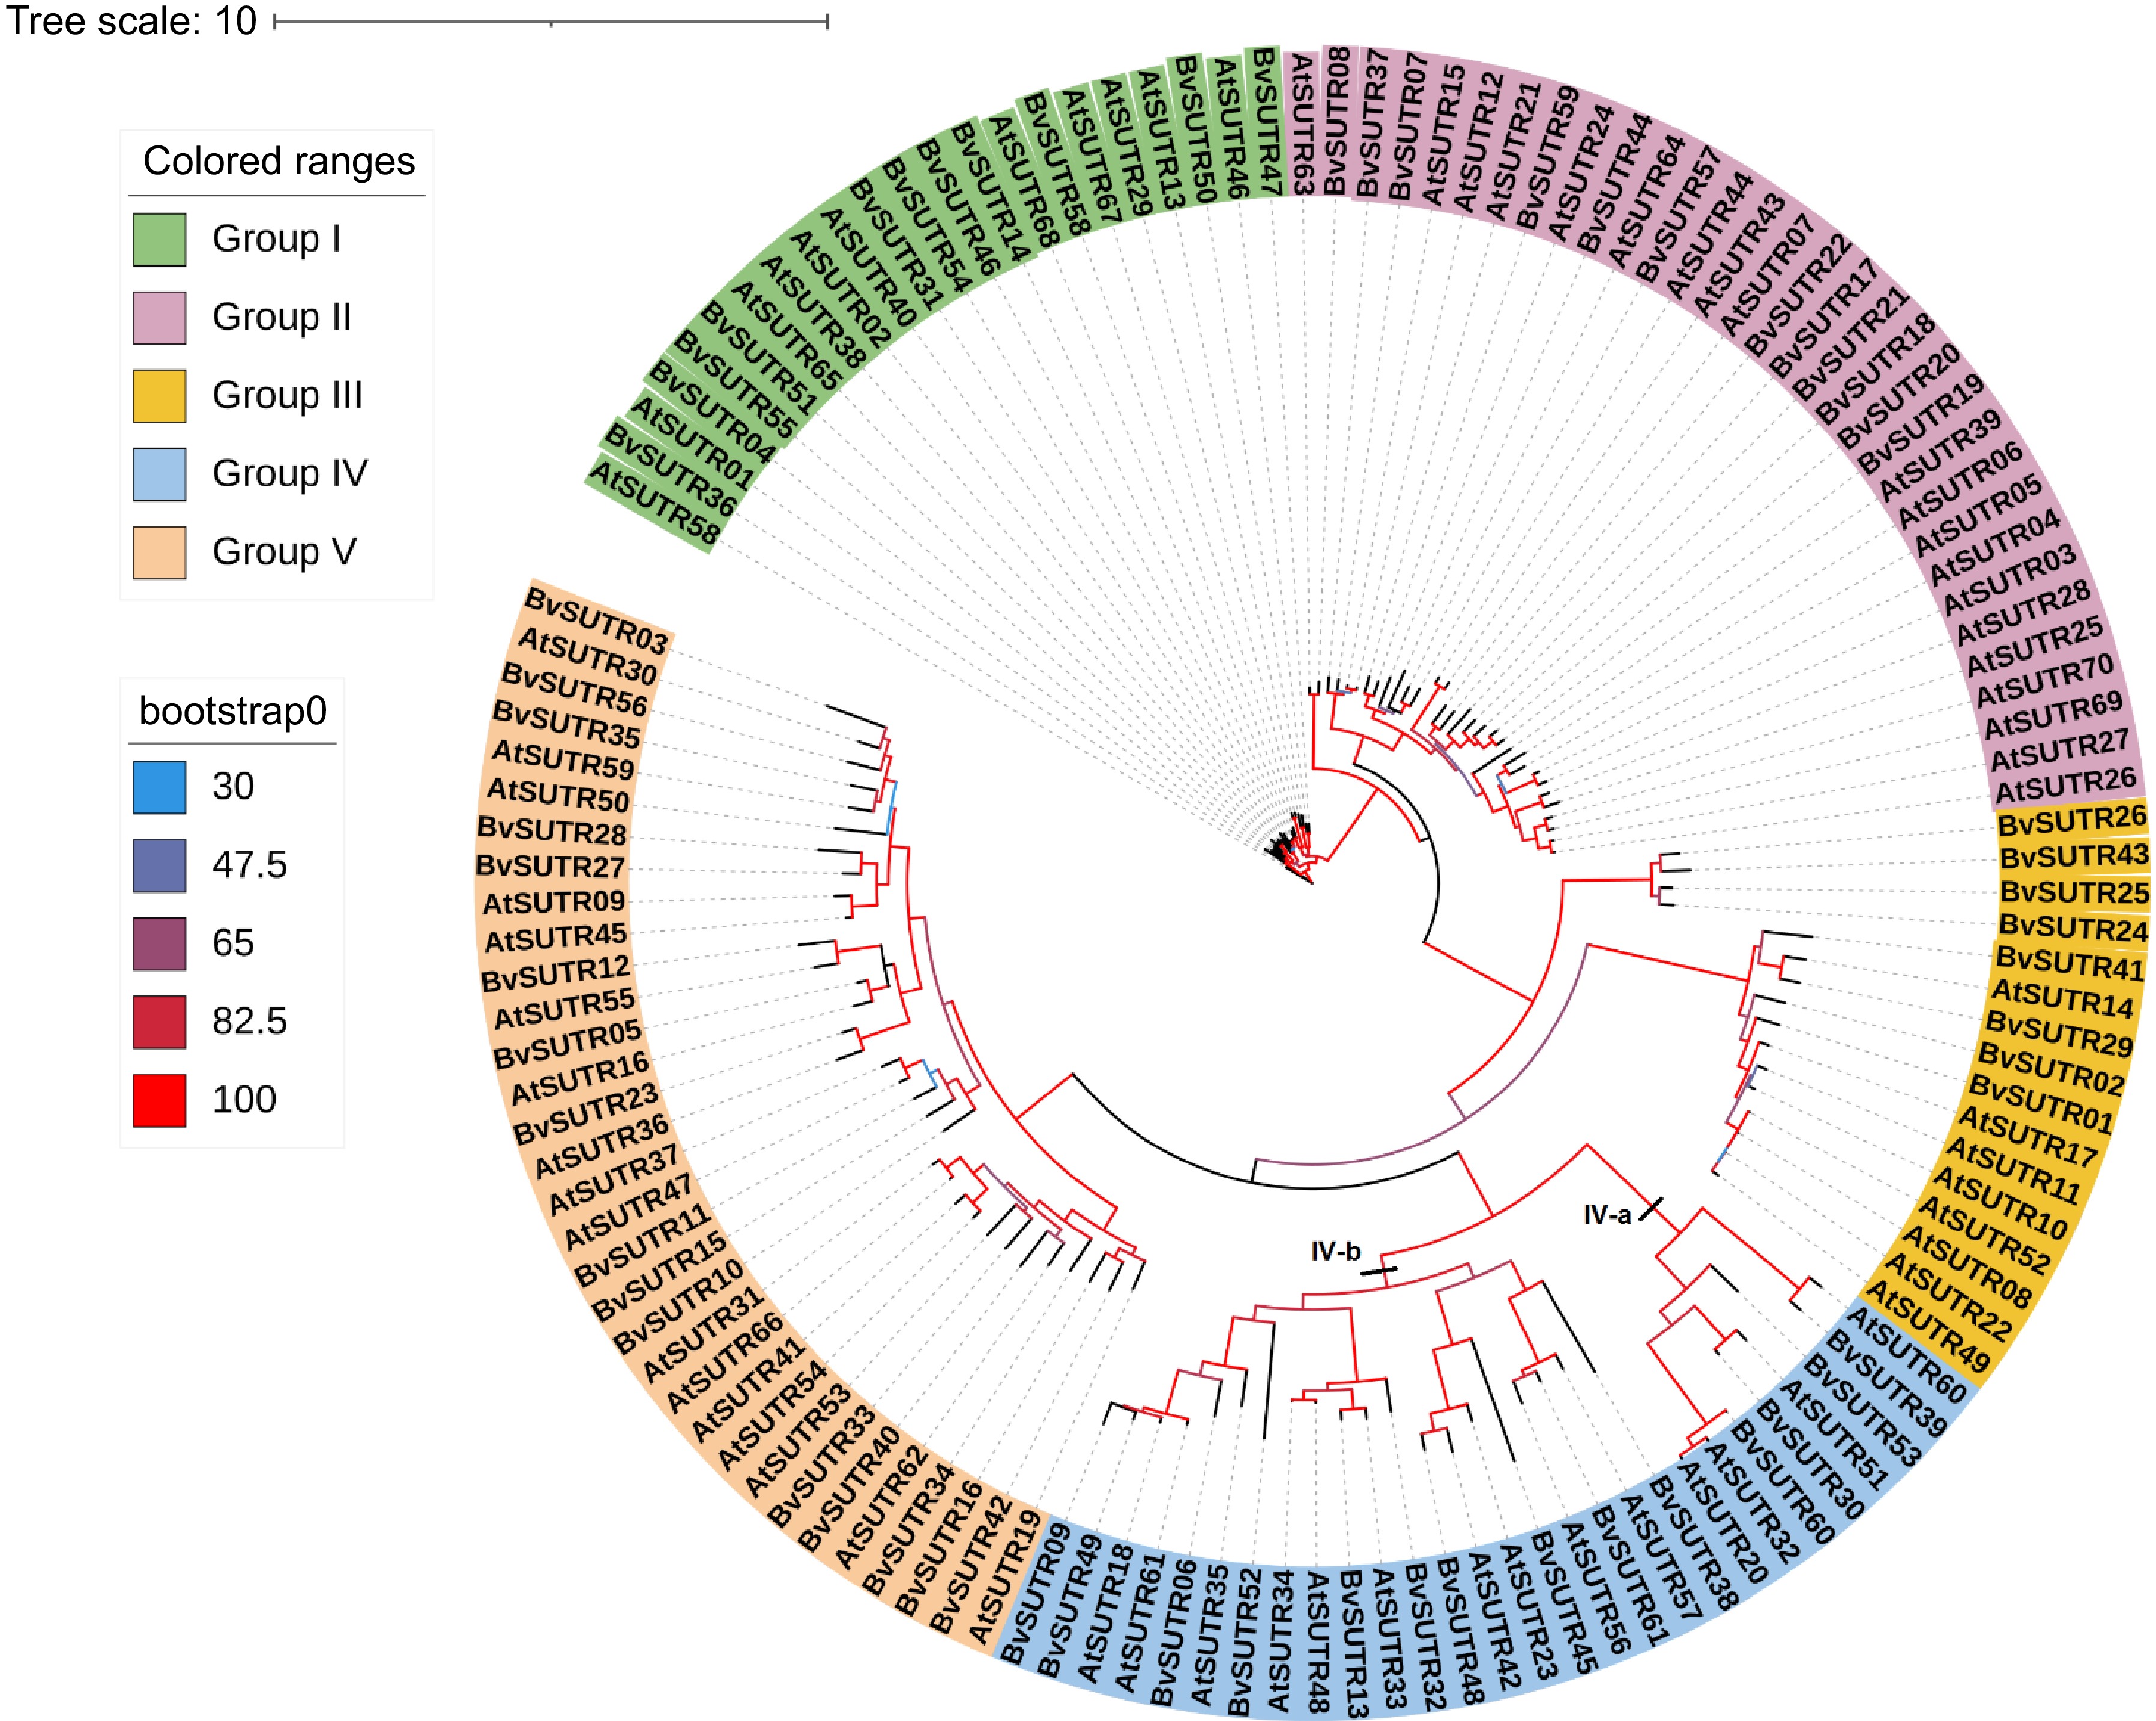
Figure 1.
Phylogeny tree of the SUTR family in Beta vulgaris (starting with Bv) and the dicot model plant Arabidopsis thaliana (starting with At).
-
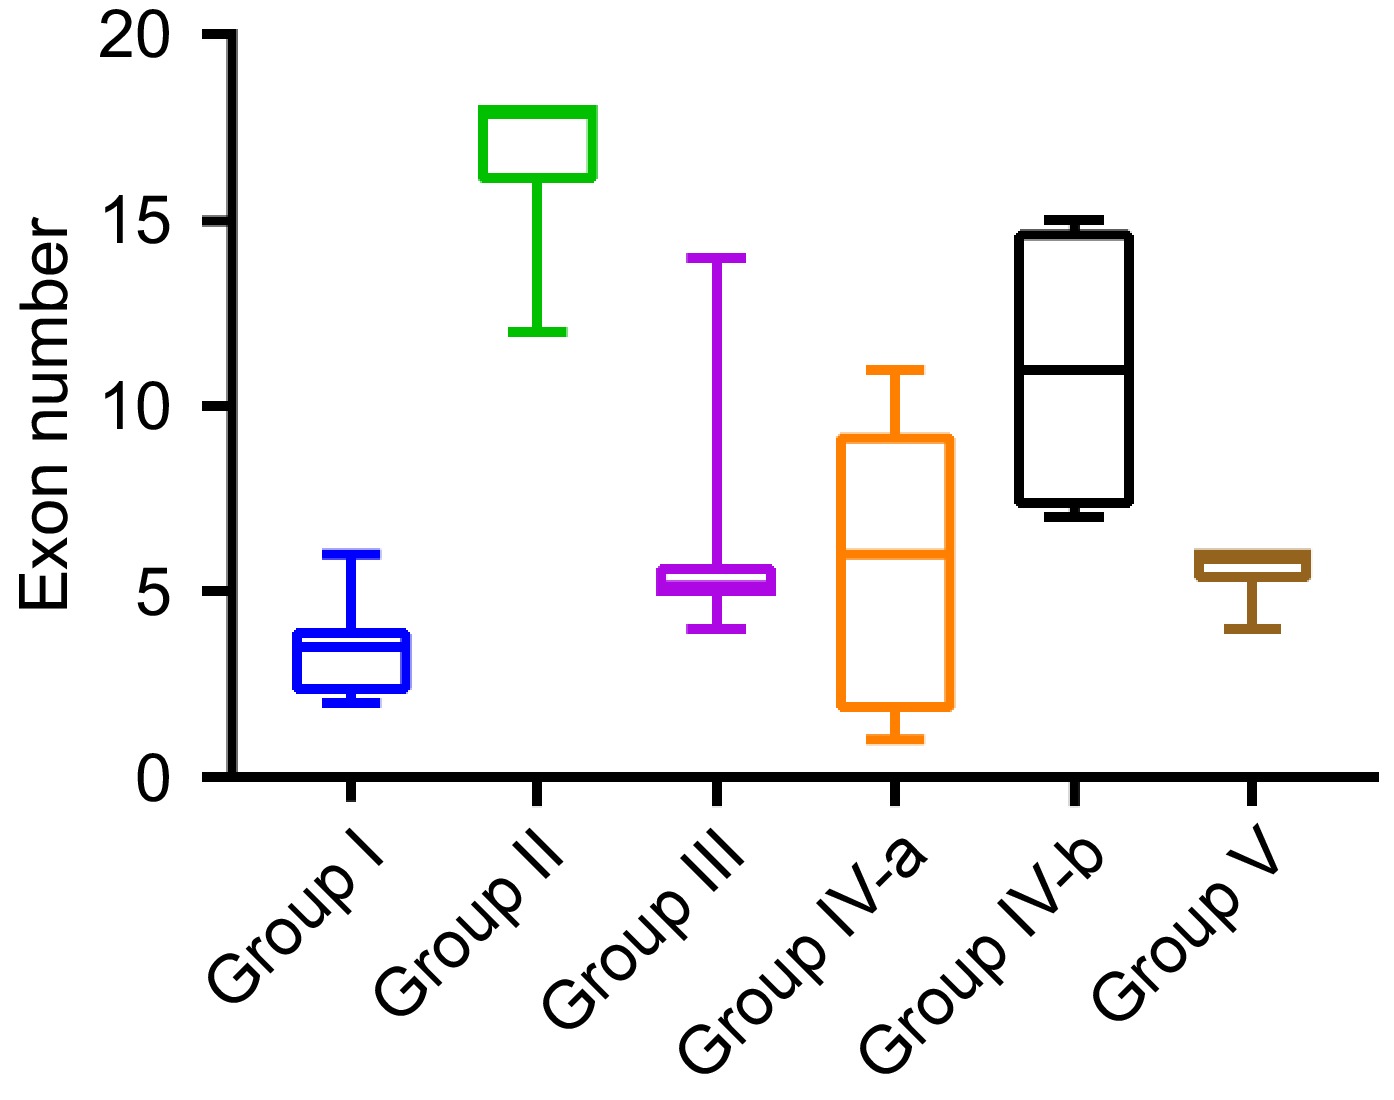
Figure 2.
Range of exon numbers in BvSUTR genes based on phylogenetic analysis.
-
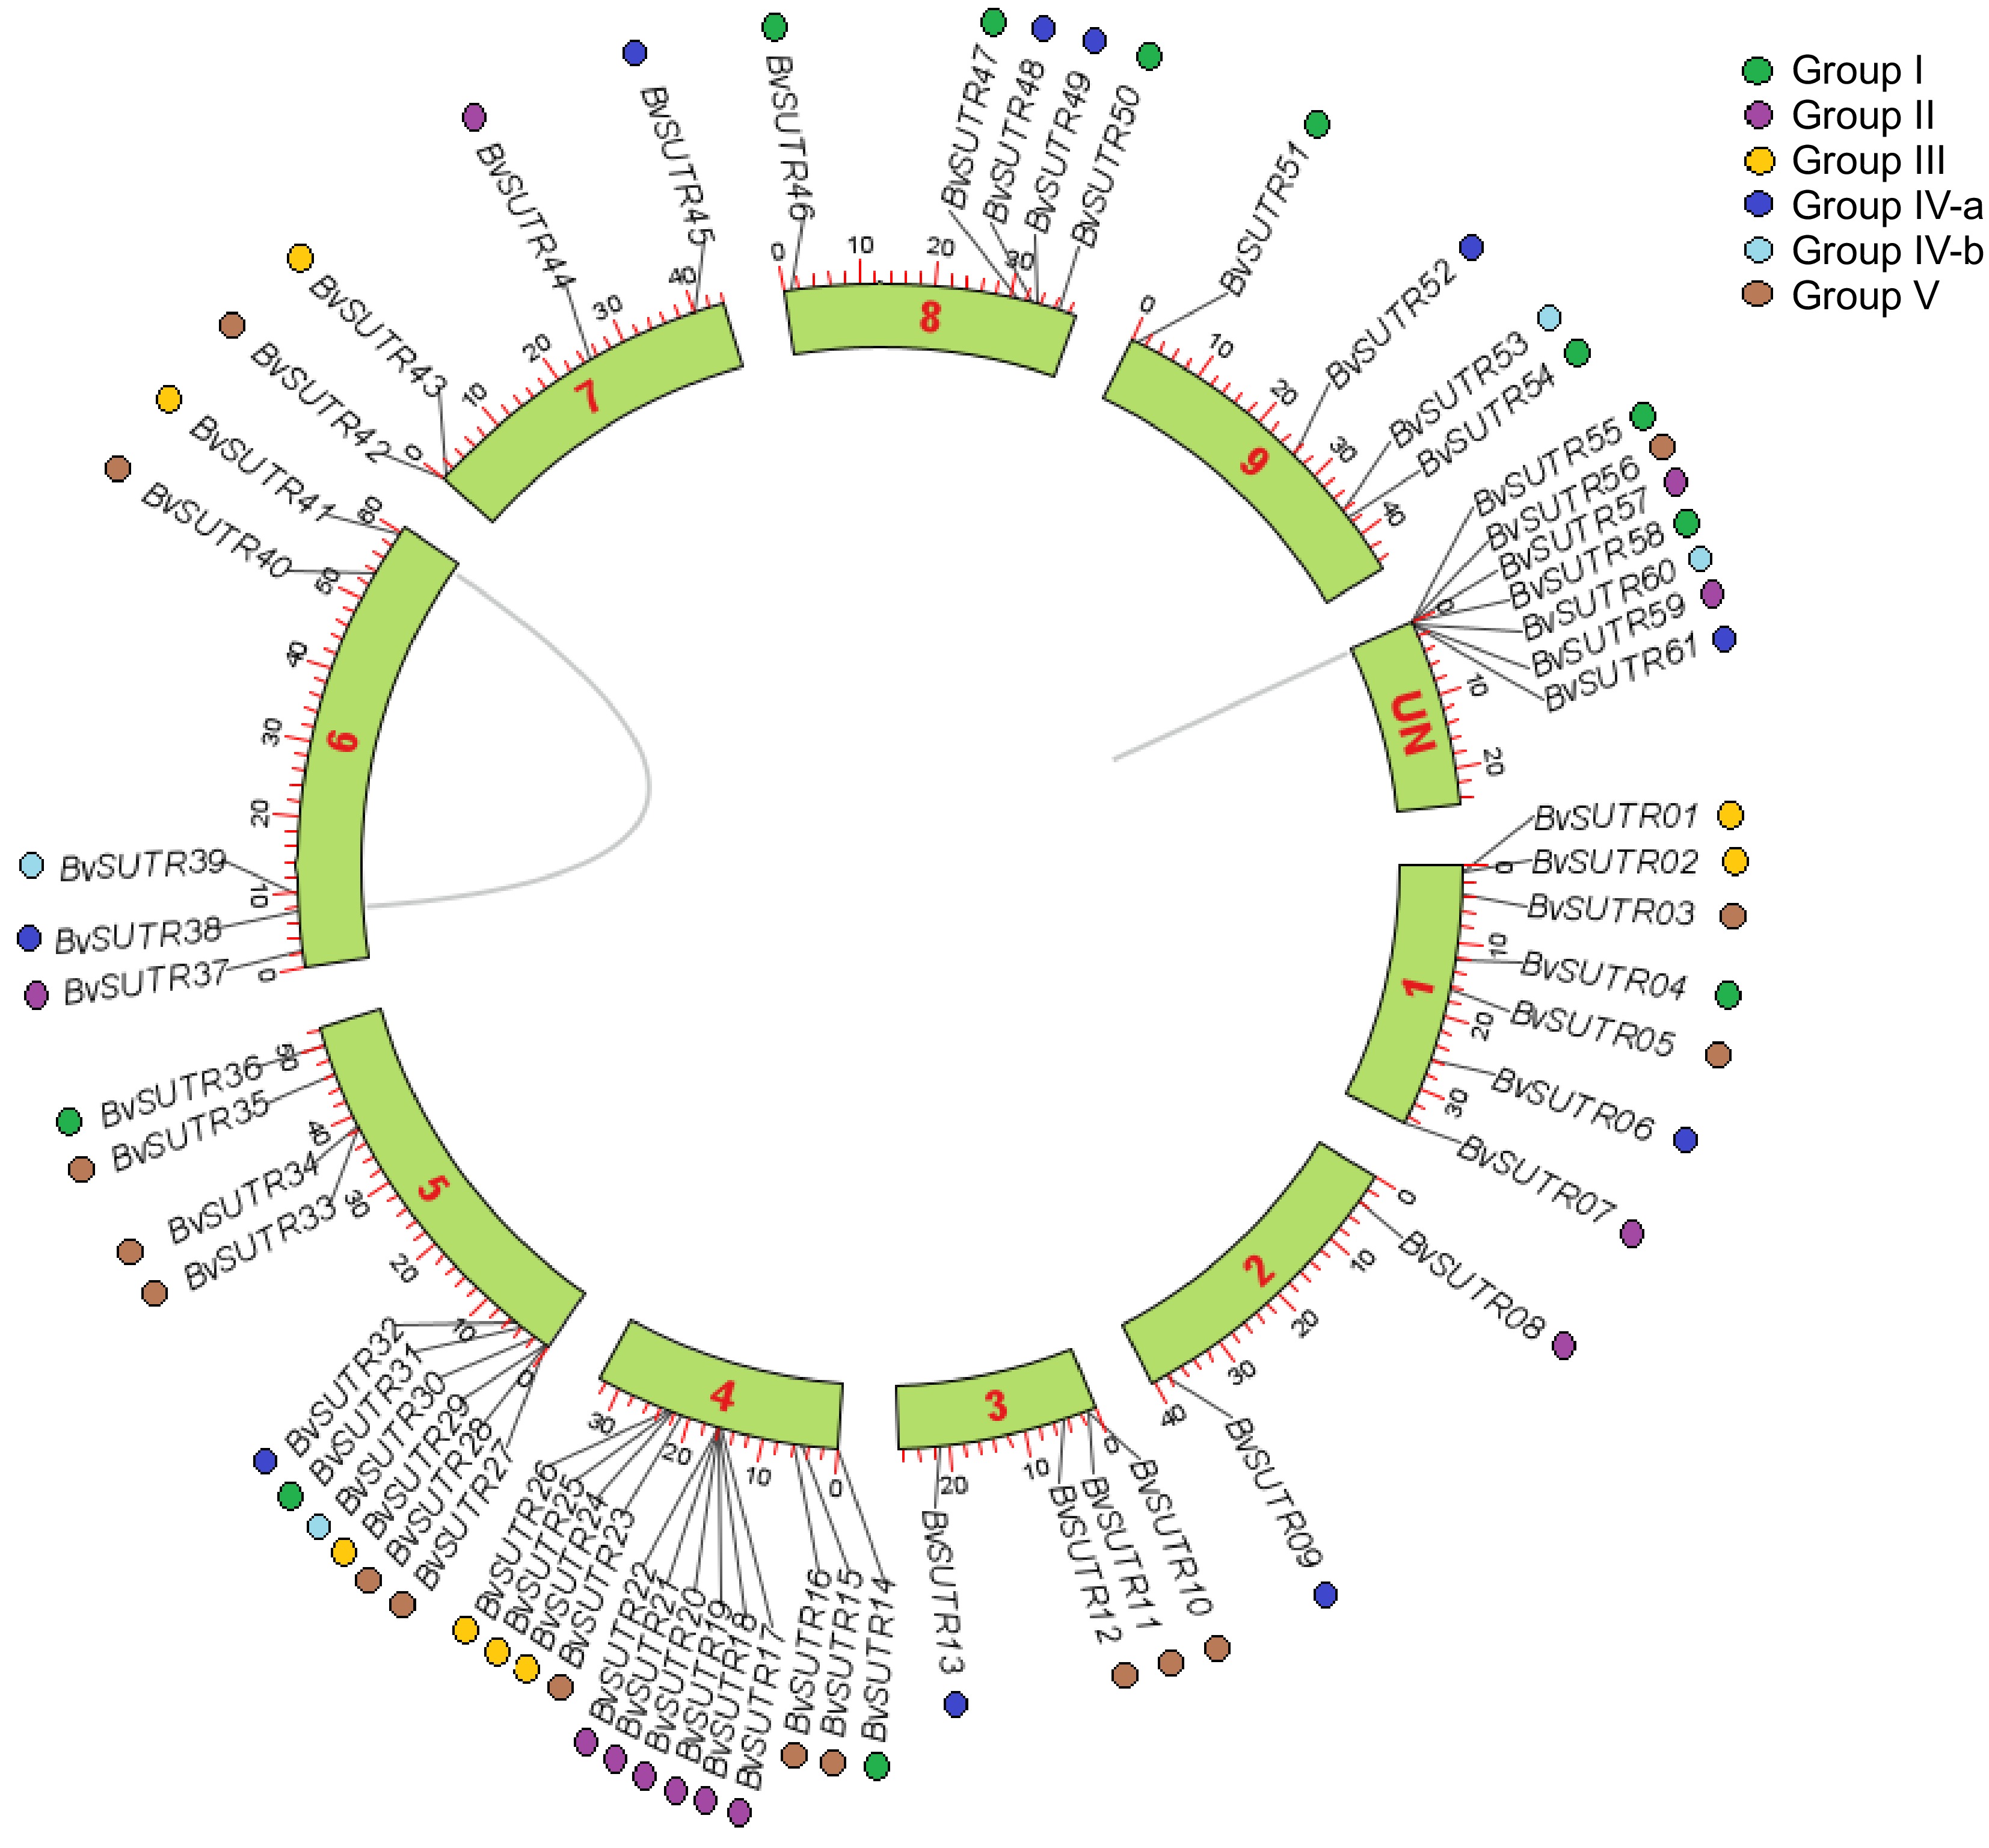
Figure 3.
Distribution of BvSUTR genes in the genome of Beta vulgaris.
-
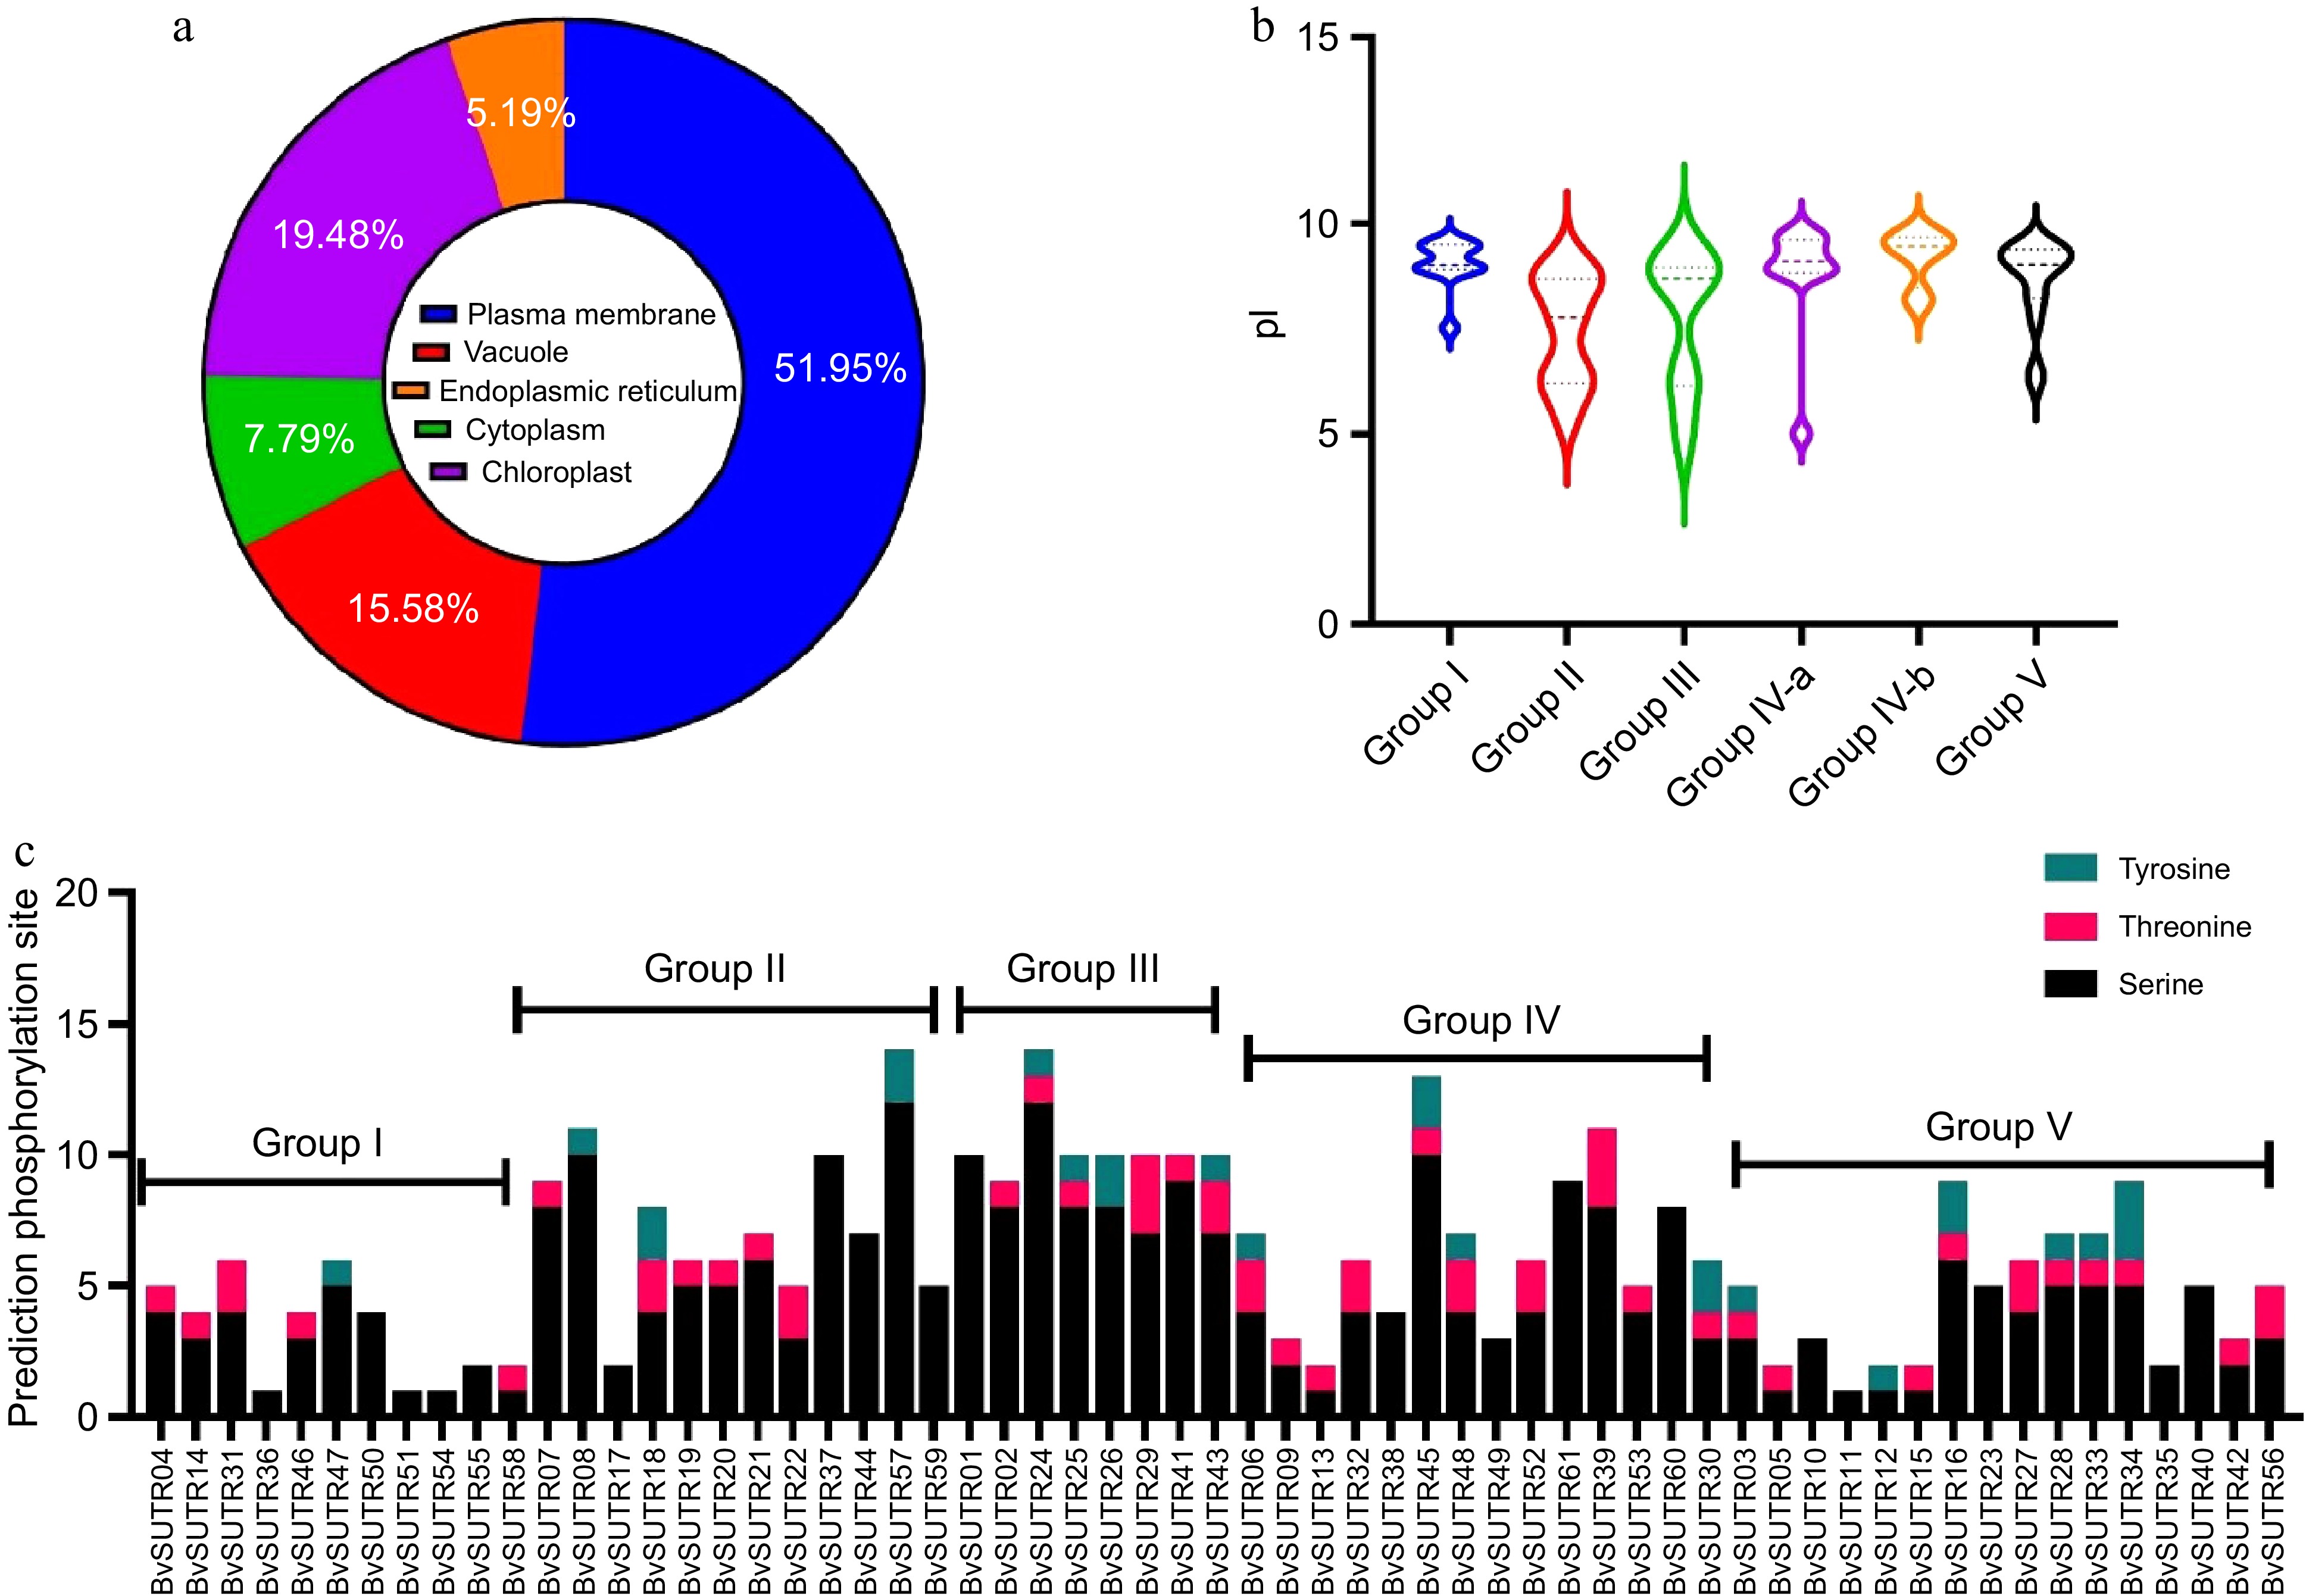
Figure 4.
Prediction of the subcellular localization of (a) BvSUTRs, (b) the range of isoelectric points (pIs), five groups of BvSUTRs, (c) and the prediction of phosphorylation sites in BvSUTRs.
-
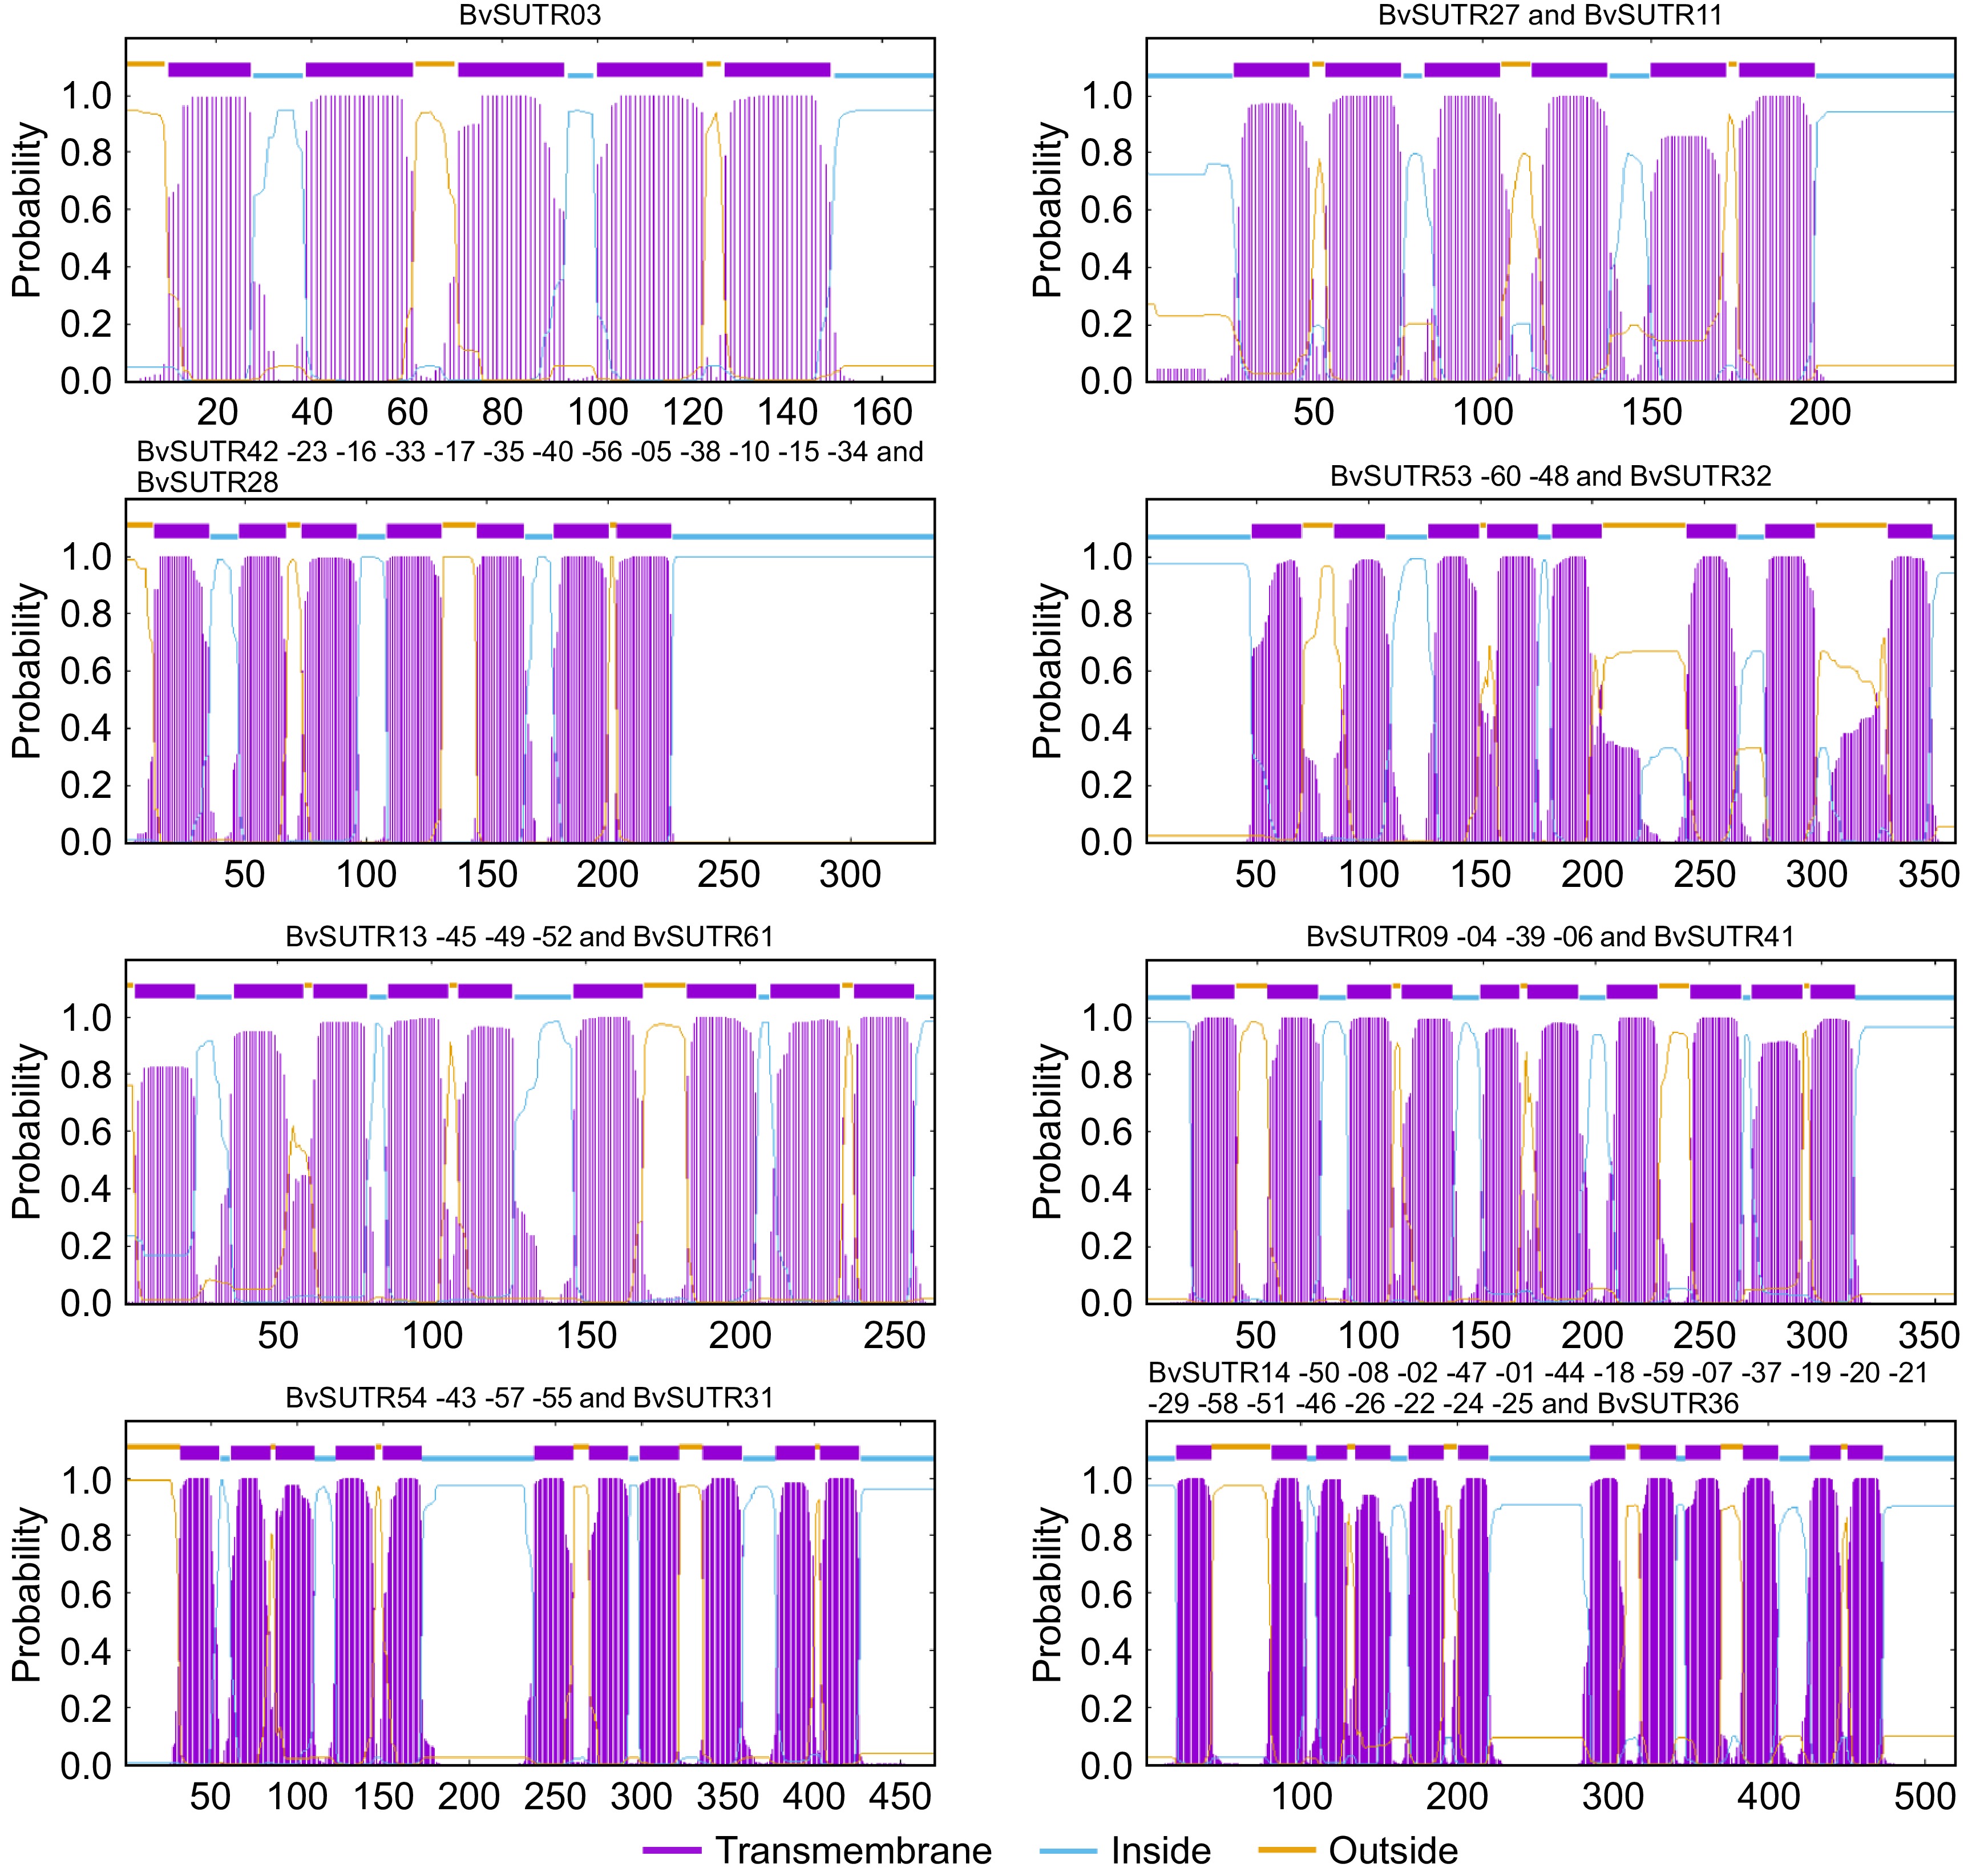
Figure 5.
Transmembrane helical structure of BvSUTRs.
-
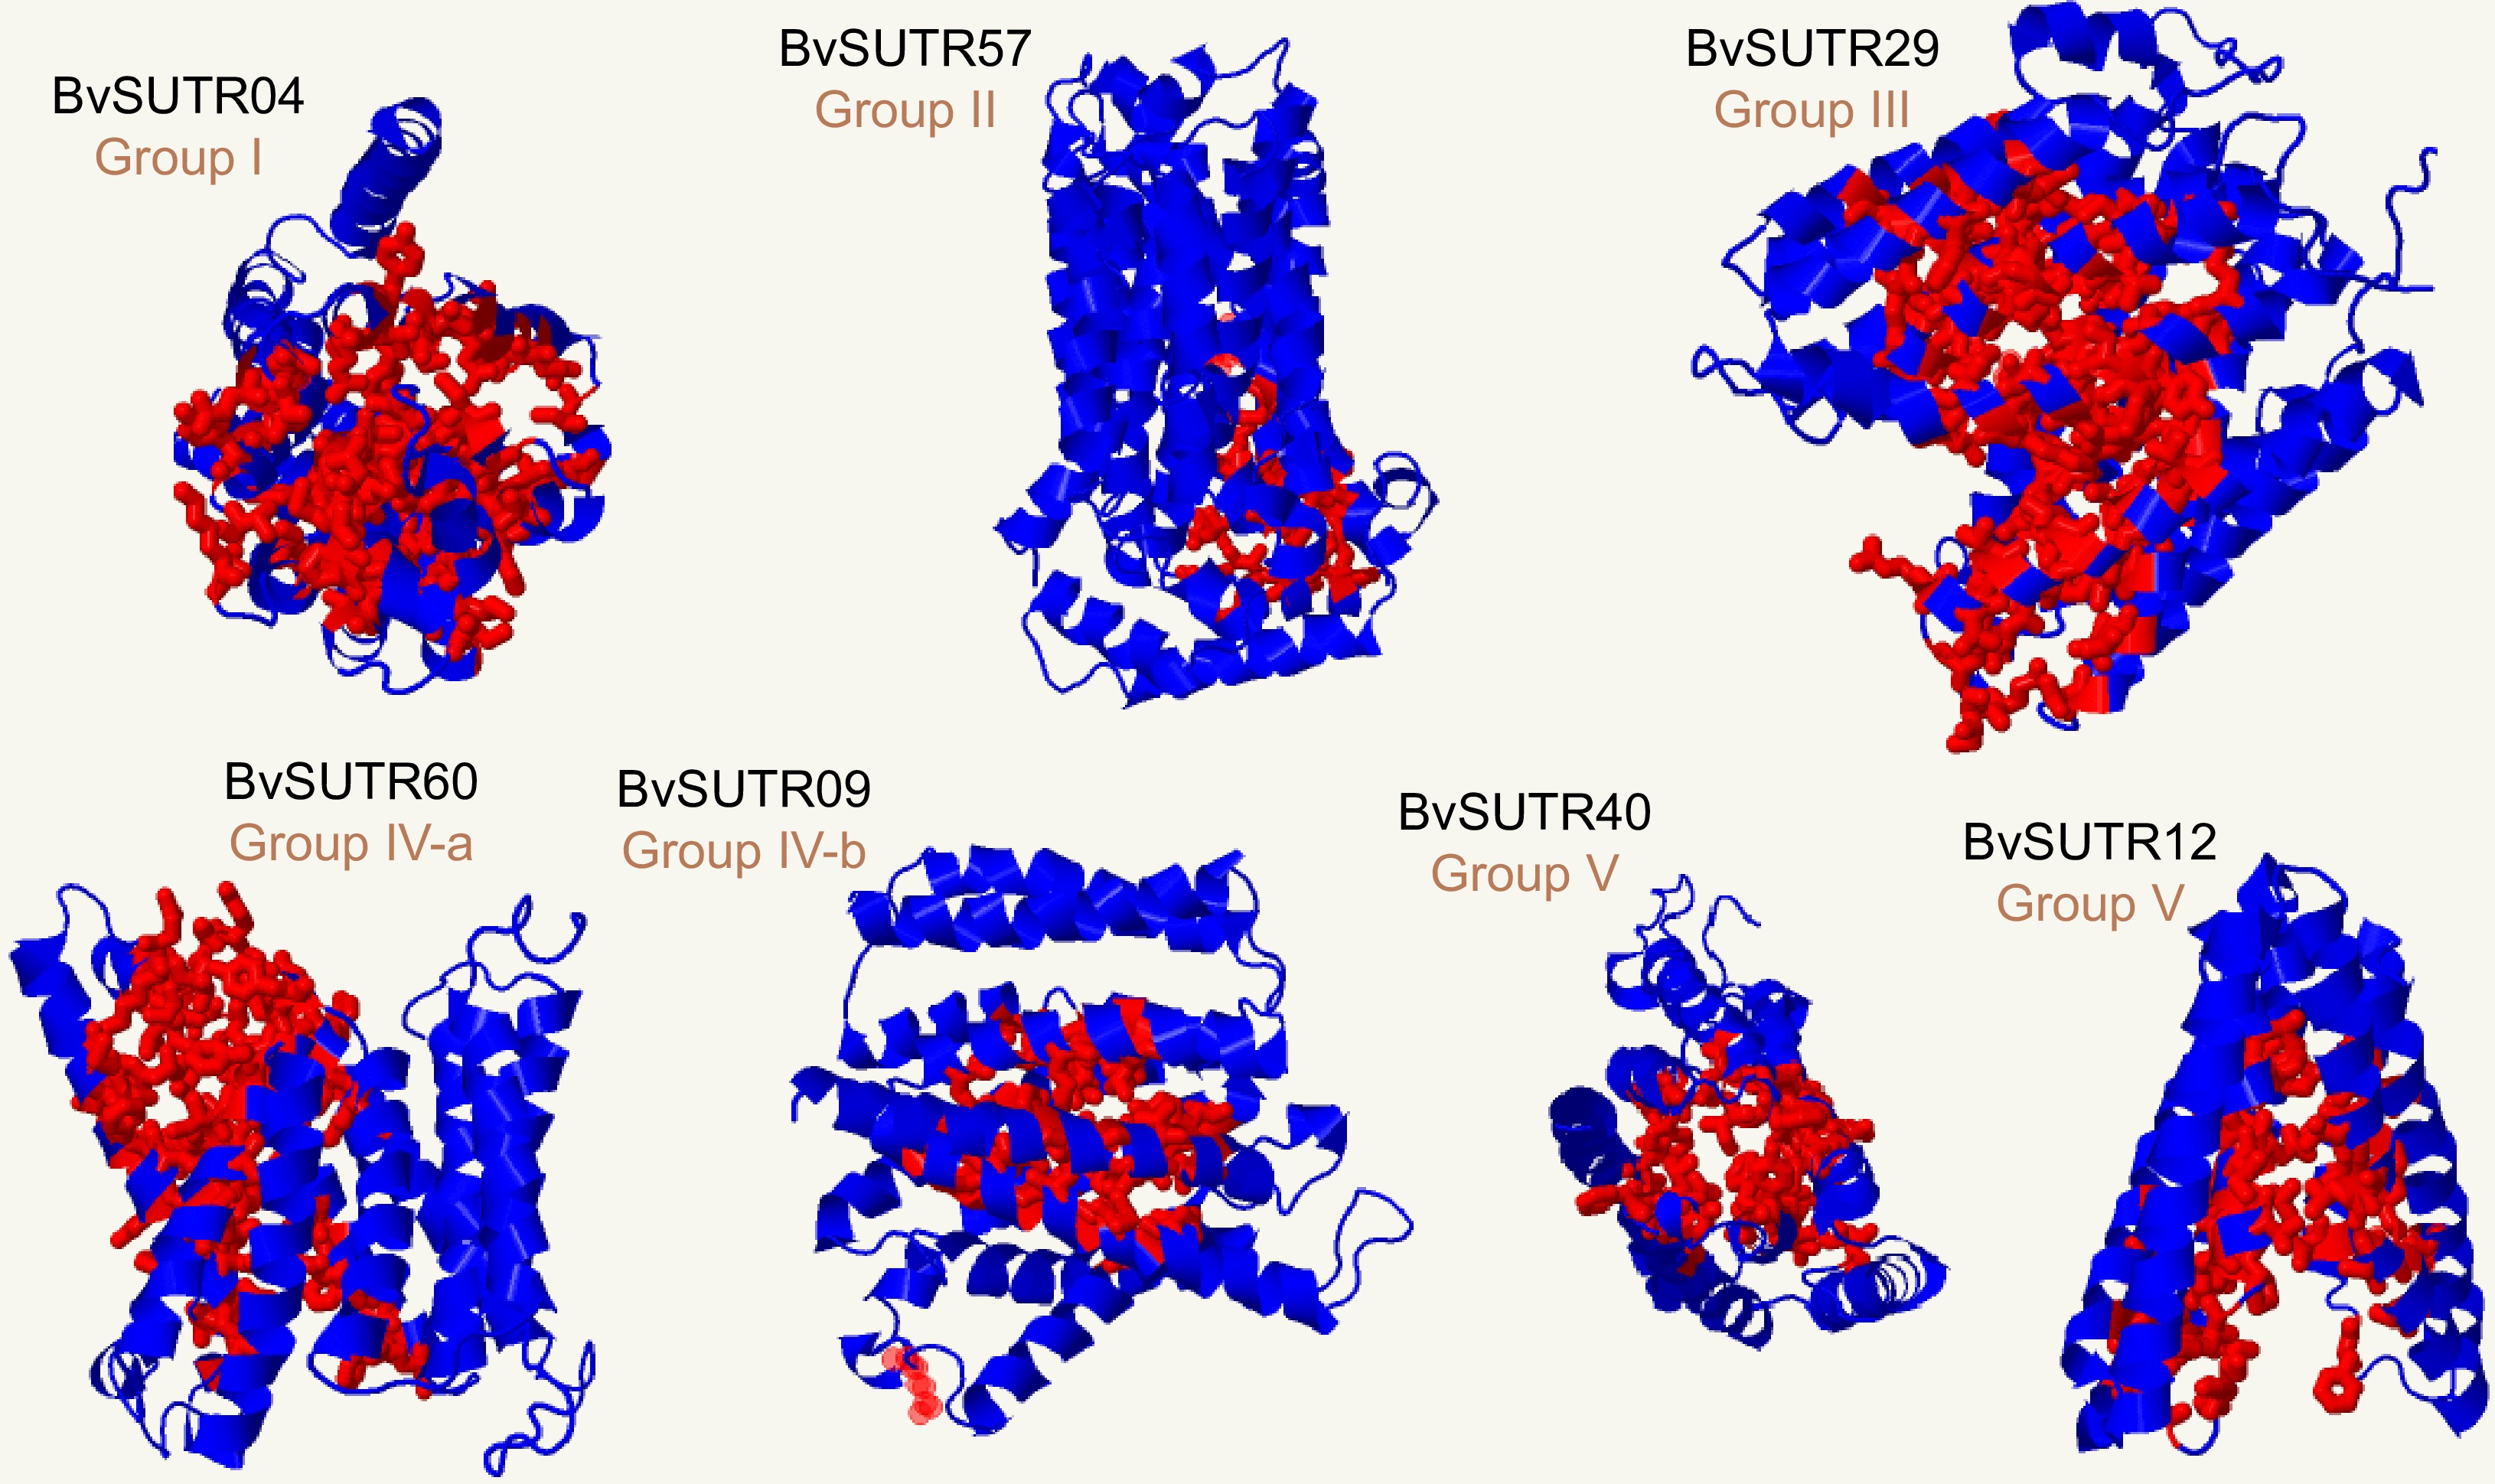
Figure 6.
3D structure and binding sites of BvSUTRs. The red indicates the binding site in the 3D structure of the candidate BvSUTR proteins.
-
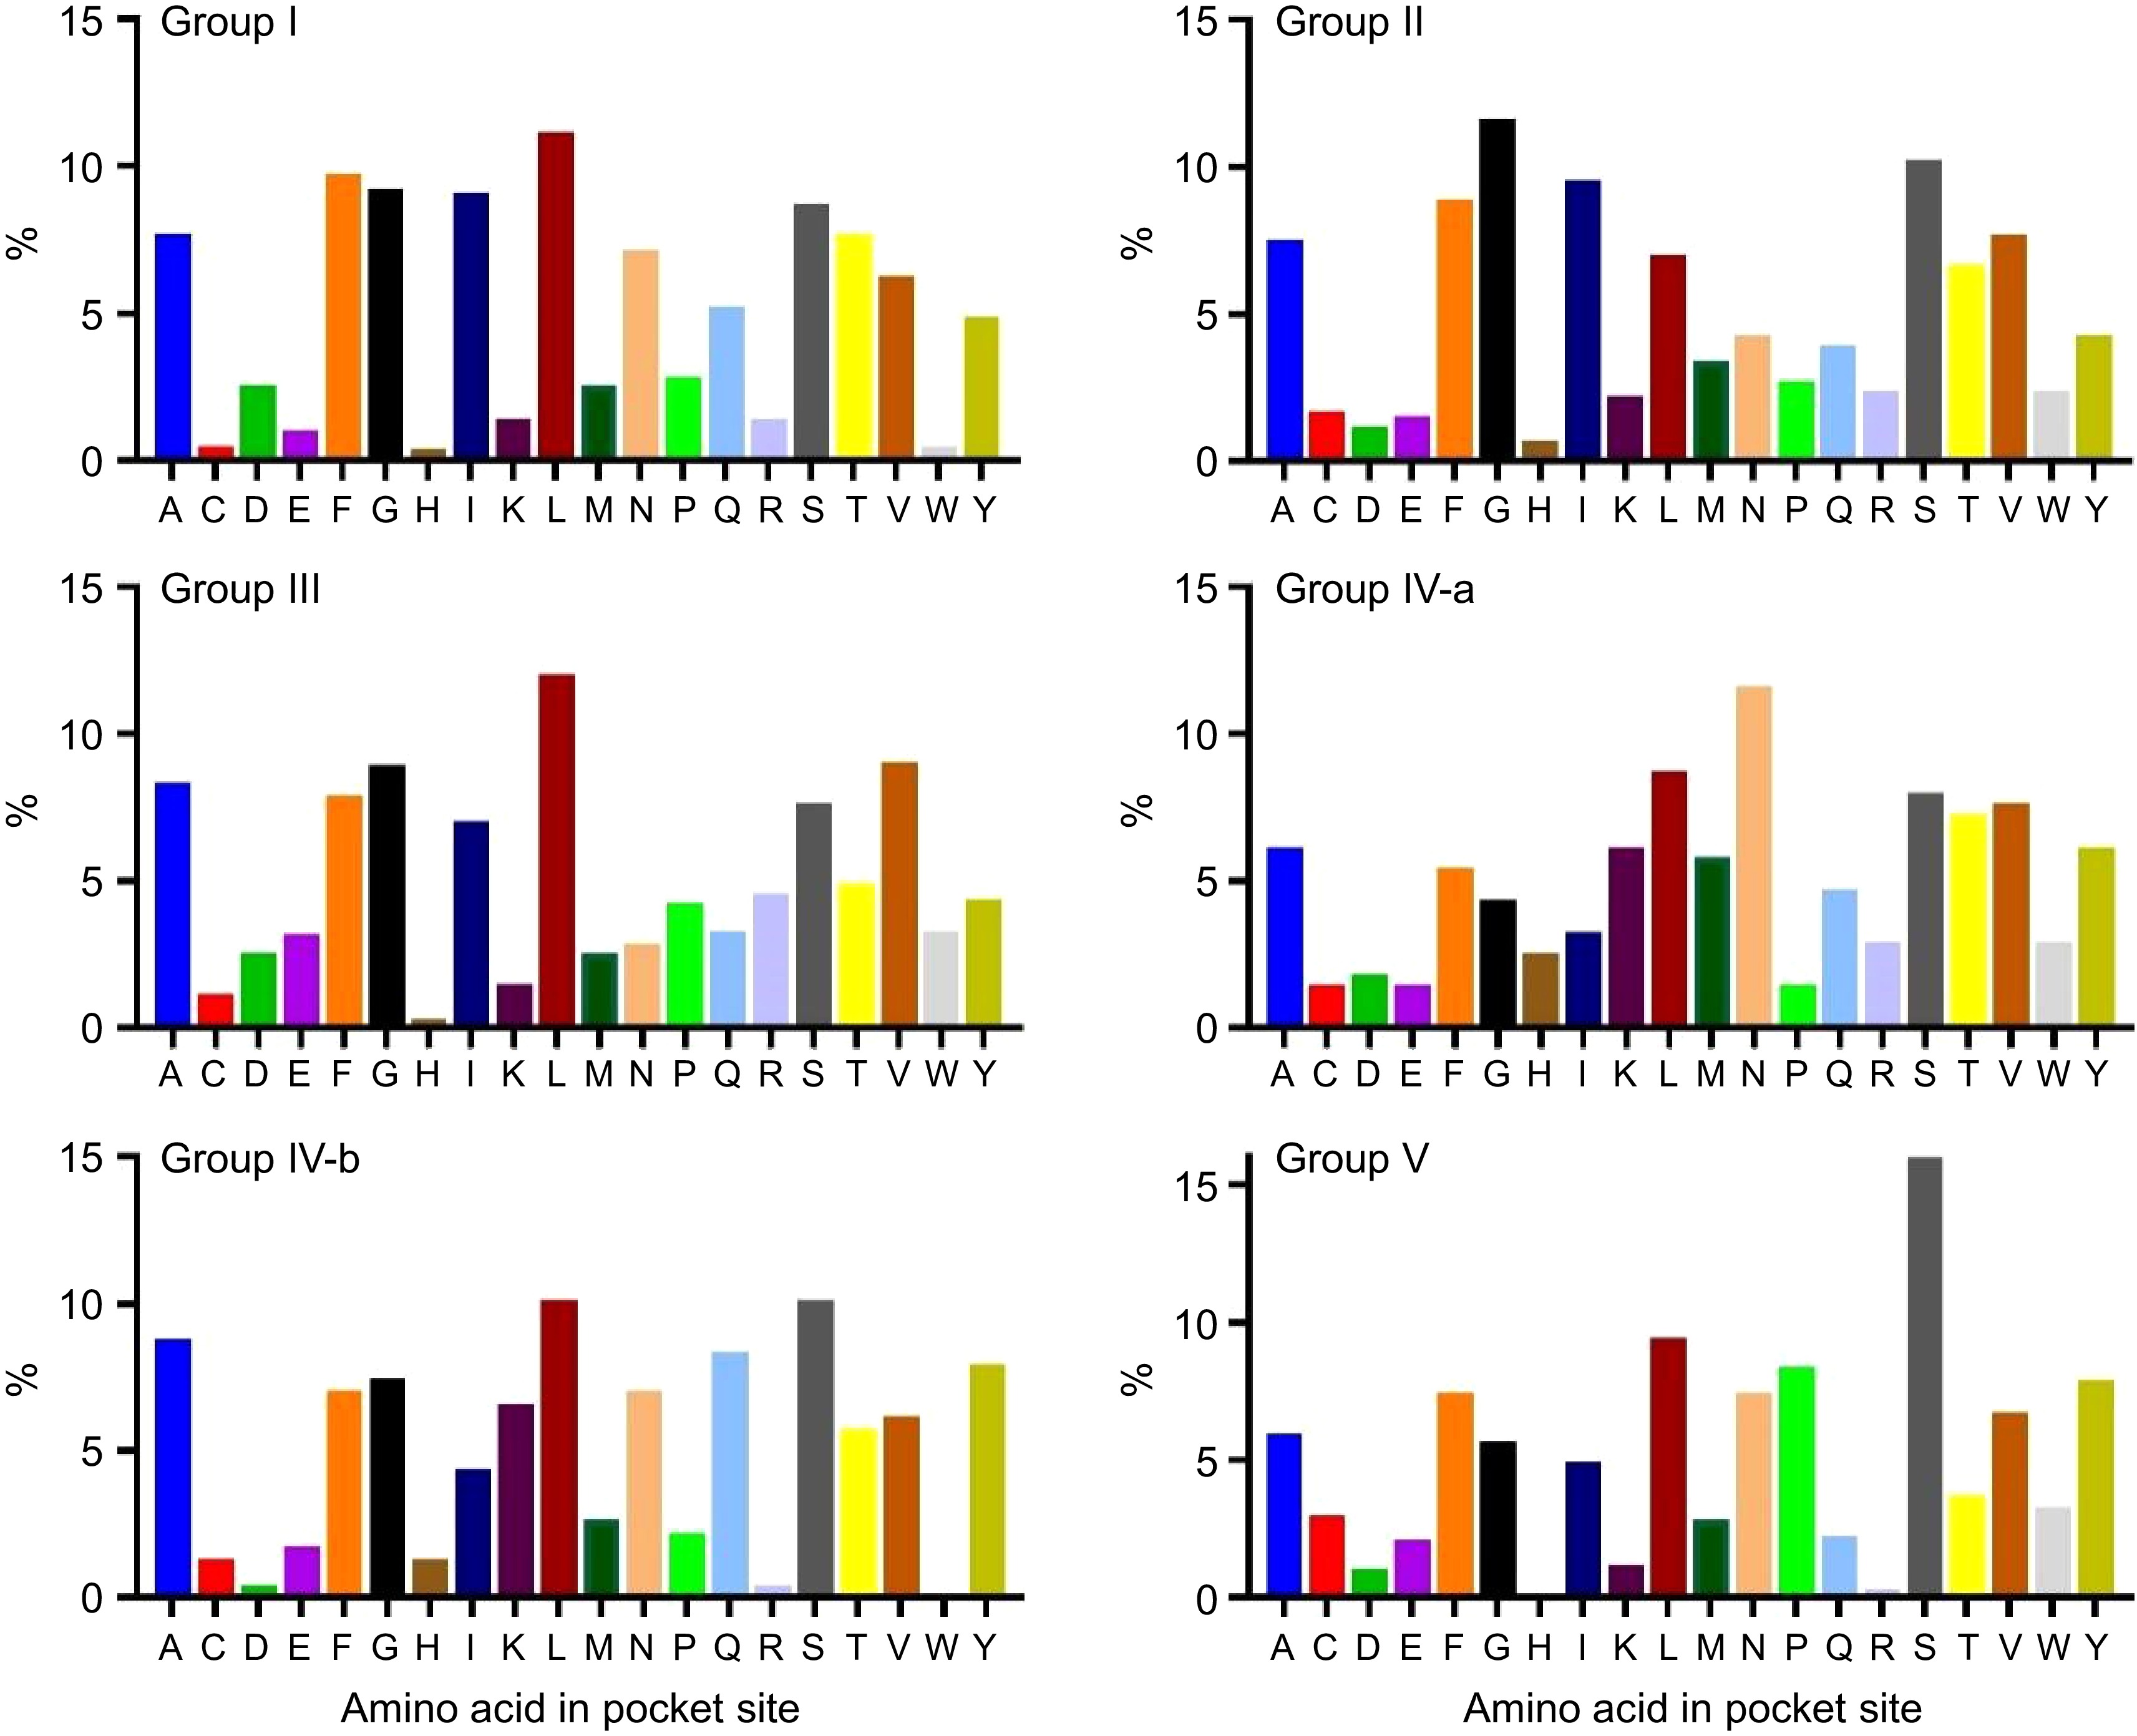
Figure 7.
Percentage of each amino acid in the pocket site of the BvSUTR groups based on phylogenetic analysis. Alanine (A); Cysteine (C); Aspartic acid (D); Glutamic acid (E); Phenylalanine (F); Glycine (G); Histidine (H); Isoleucine (I); Lysine (K); Leucine (L); Methionine (M); Asparagine (N); Proline (P); Glutamine (Q); Arginine (R); Serine (S); Threonine (T); Valine (V); Tryptophan (W); Tyrosine (Y).
-
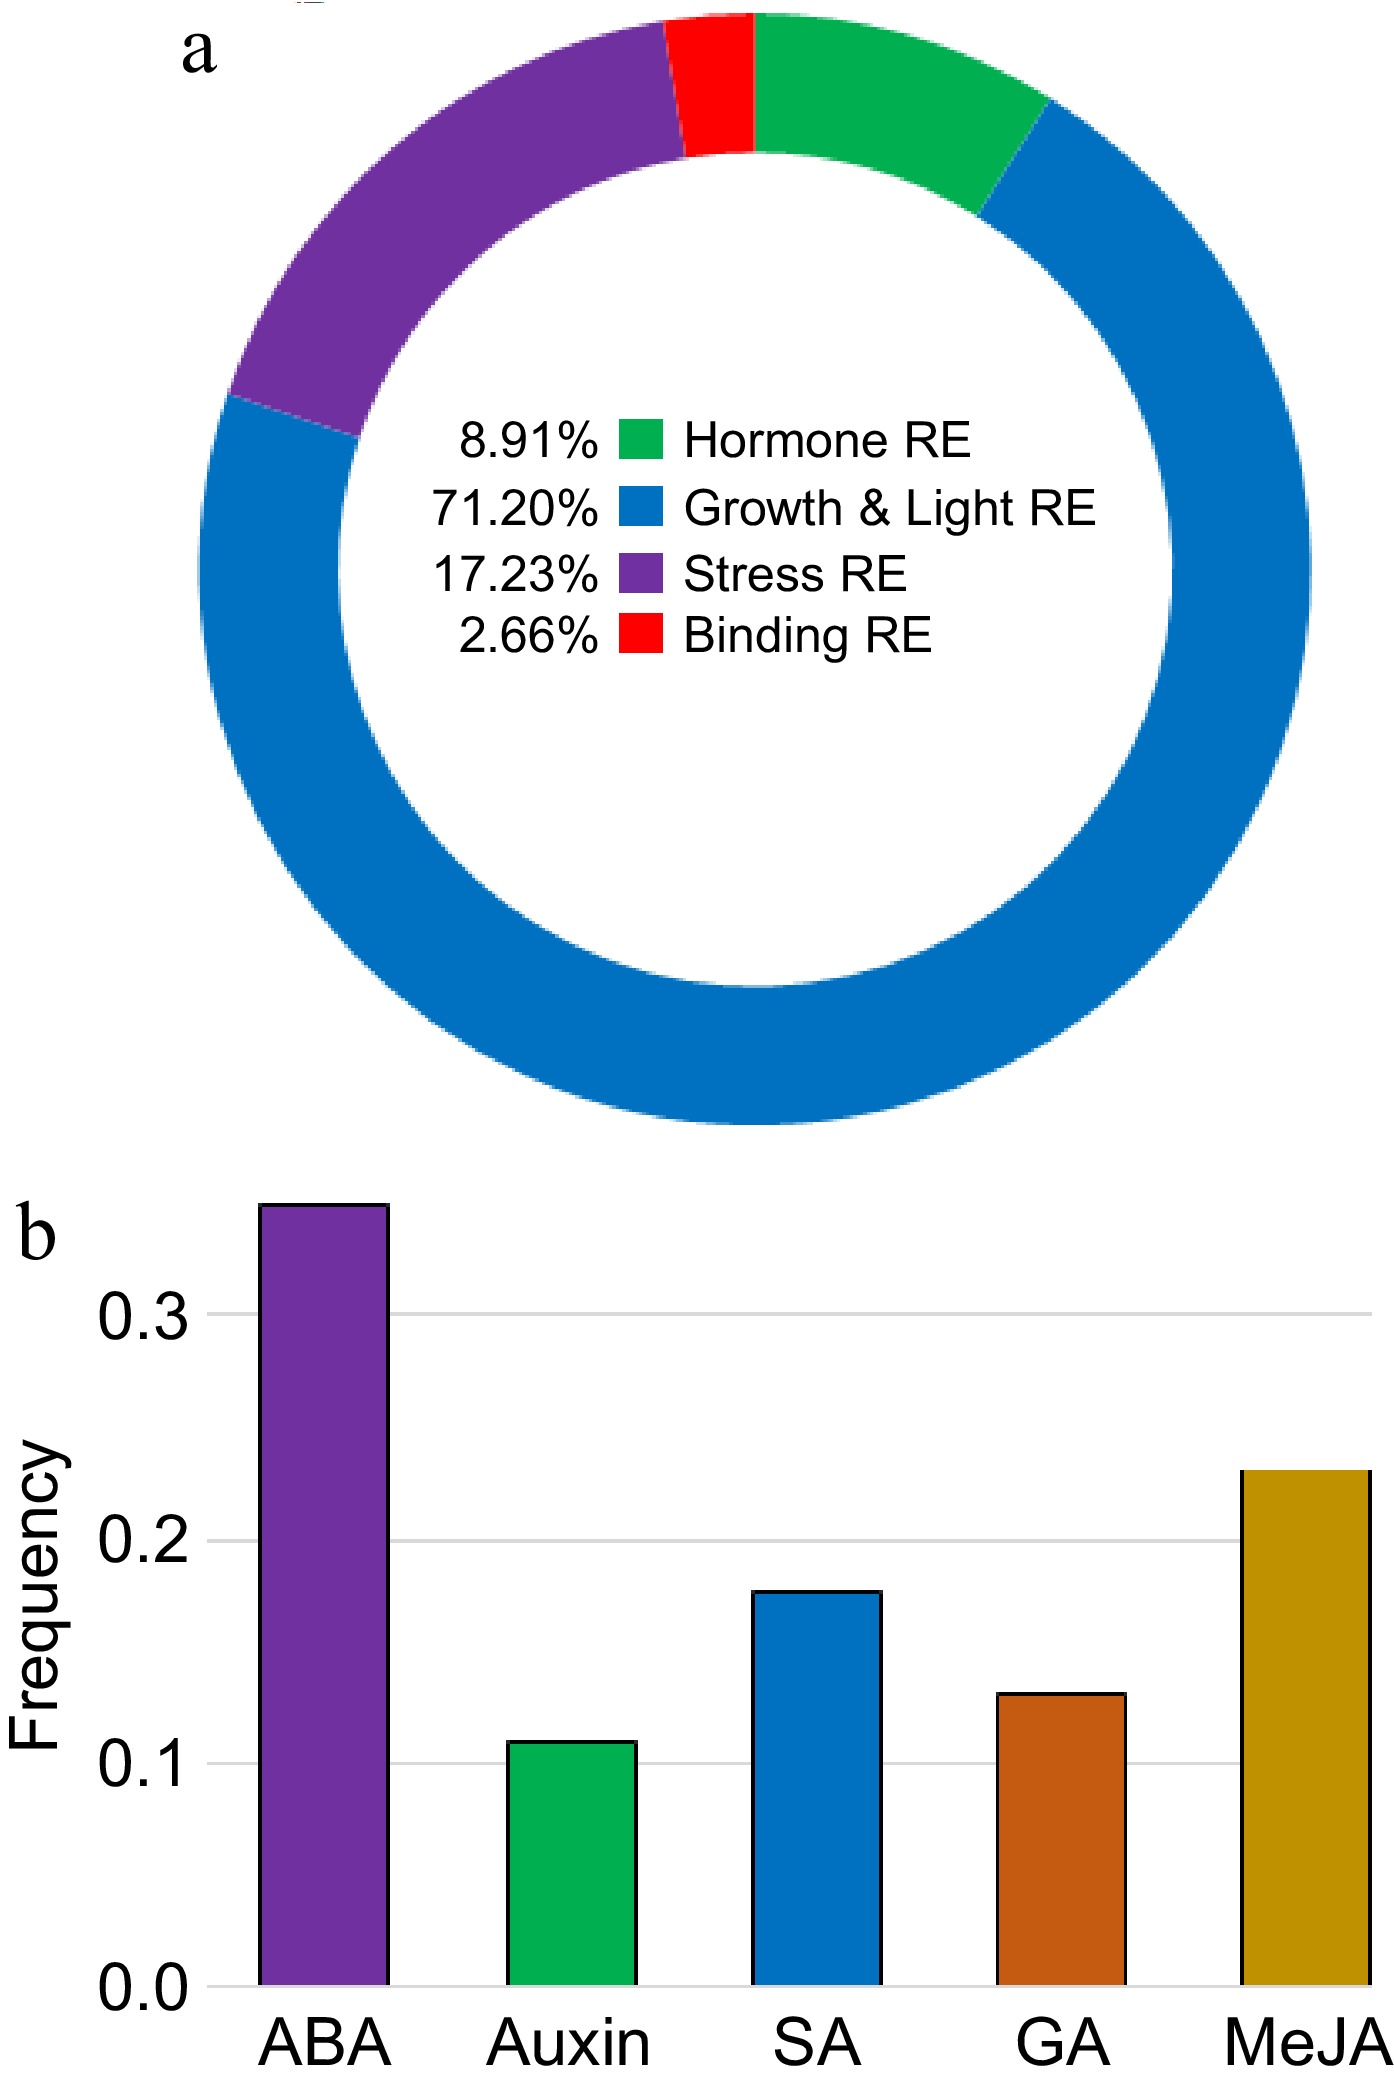
Figure 8.
Promoter analysis of BvSUTRs. Classification of cis-regulatory elements present in the promoter site of (a) BvSUTR genes and (b) involved in the response to hormones. The full details are presented in Supplementary Table S2.
-
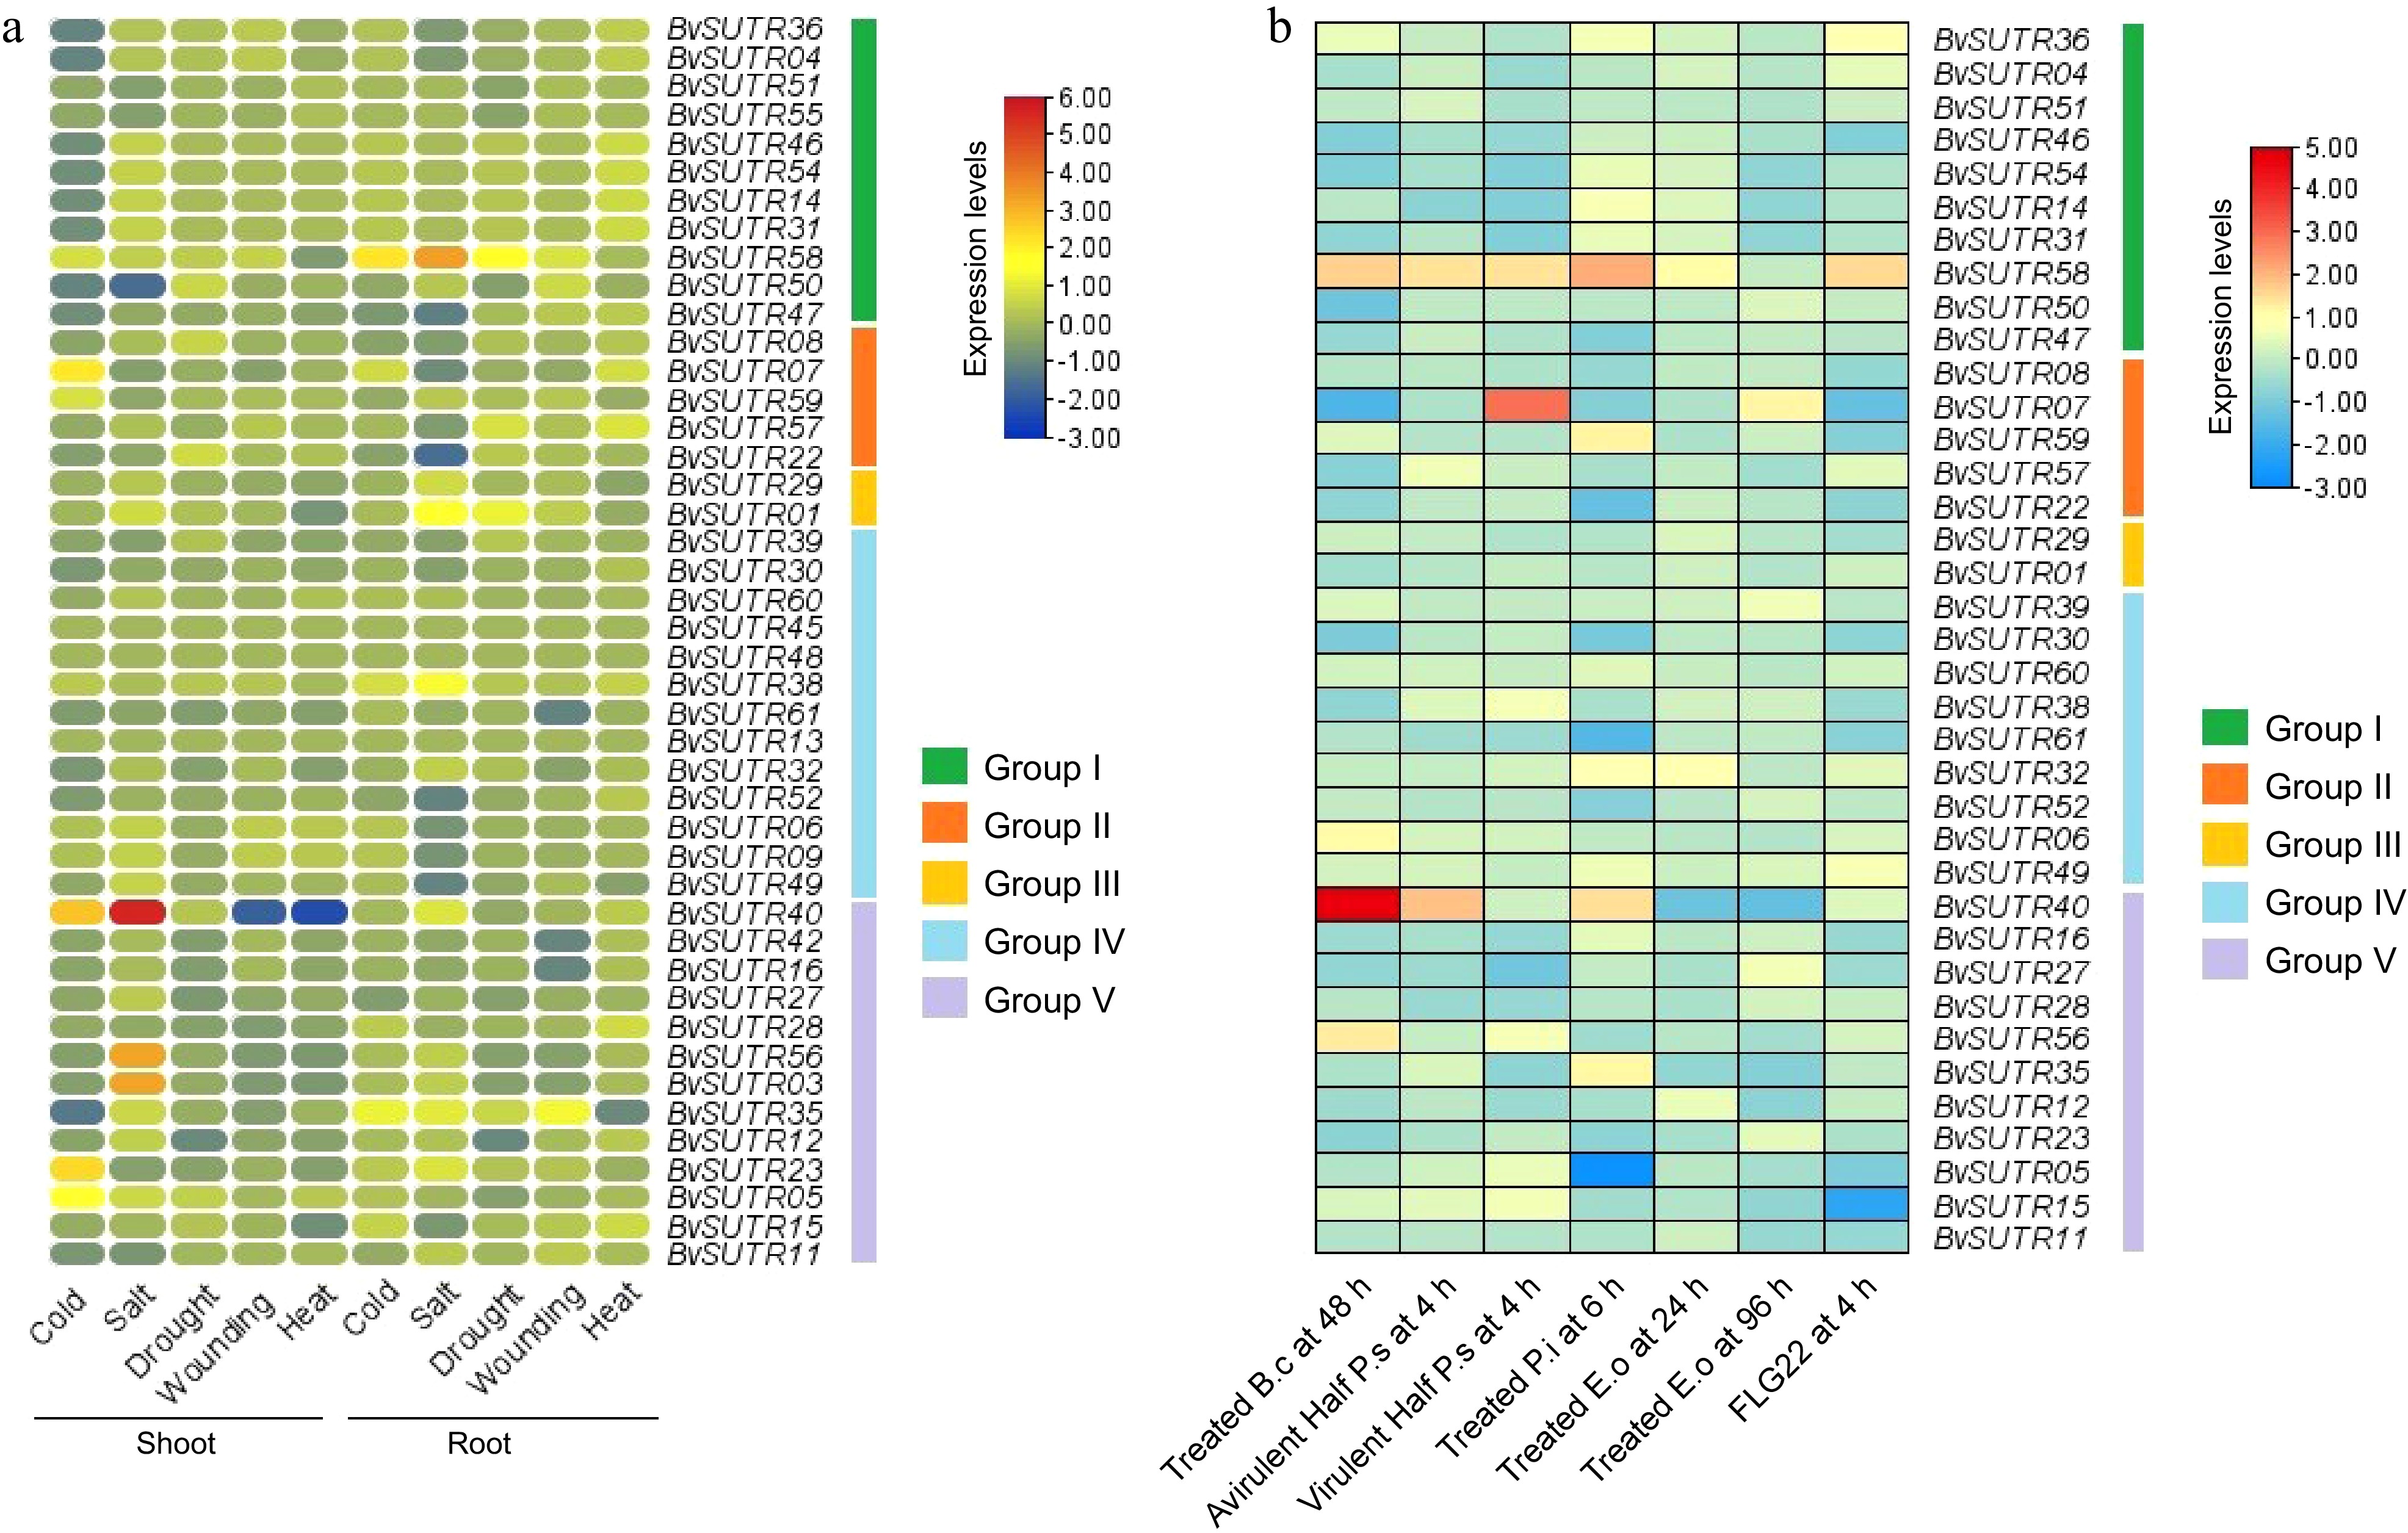
Figure 9.
Expression profile of SUTRs in response to abiotic stresses in (a) shoot and root tissues, and (b) expression profile of SUTRs in response to biotic stresses. B.c: Botrytis cinerea; P.s: Pseudomonas syringae; P.i: Phytophthora infestans; E.o: Erysiphe orontii; FLG22: flagellin 22.
-
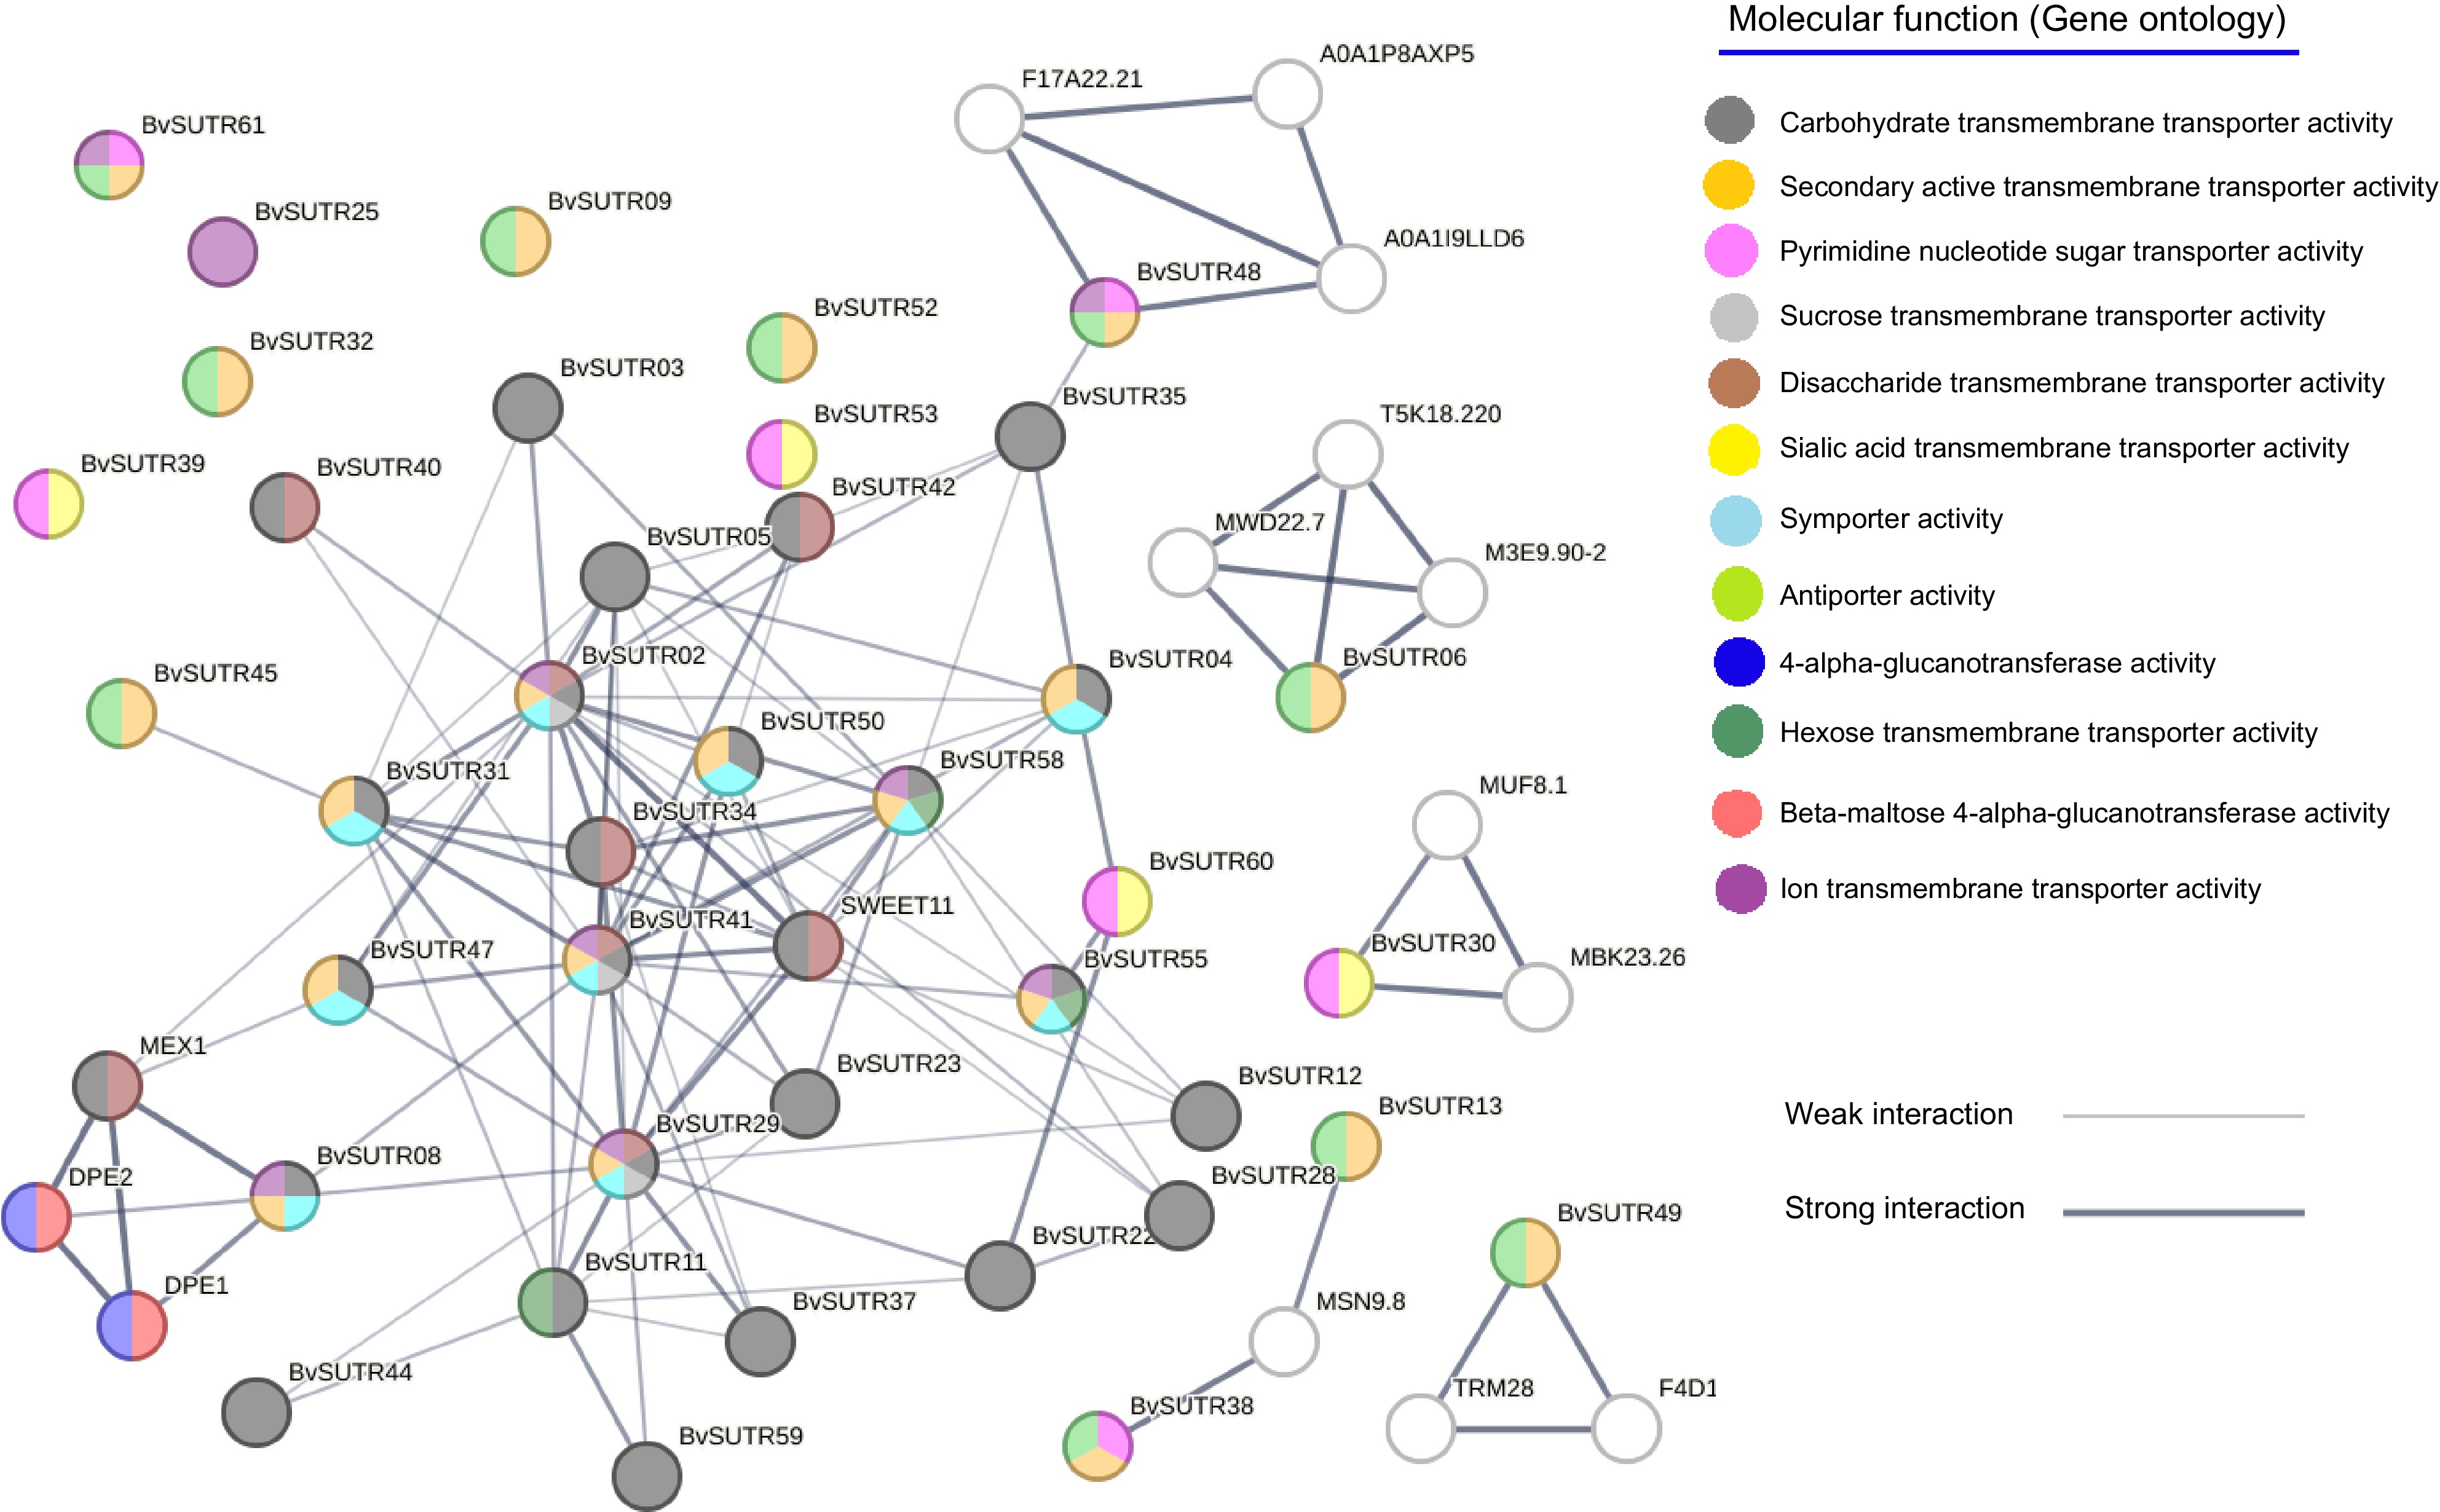
Figure 10.
Interaction network of SUTRs. The background color of each node represents the molecular function.
Figures
(10)
Tables
(0)