-
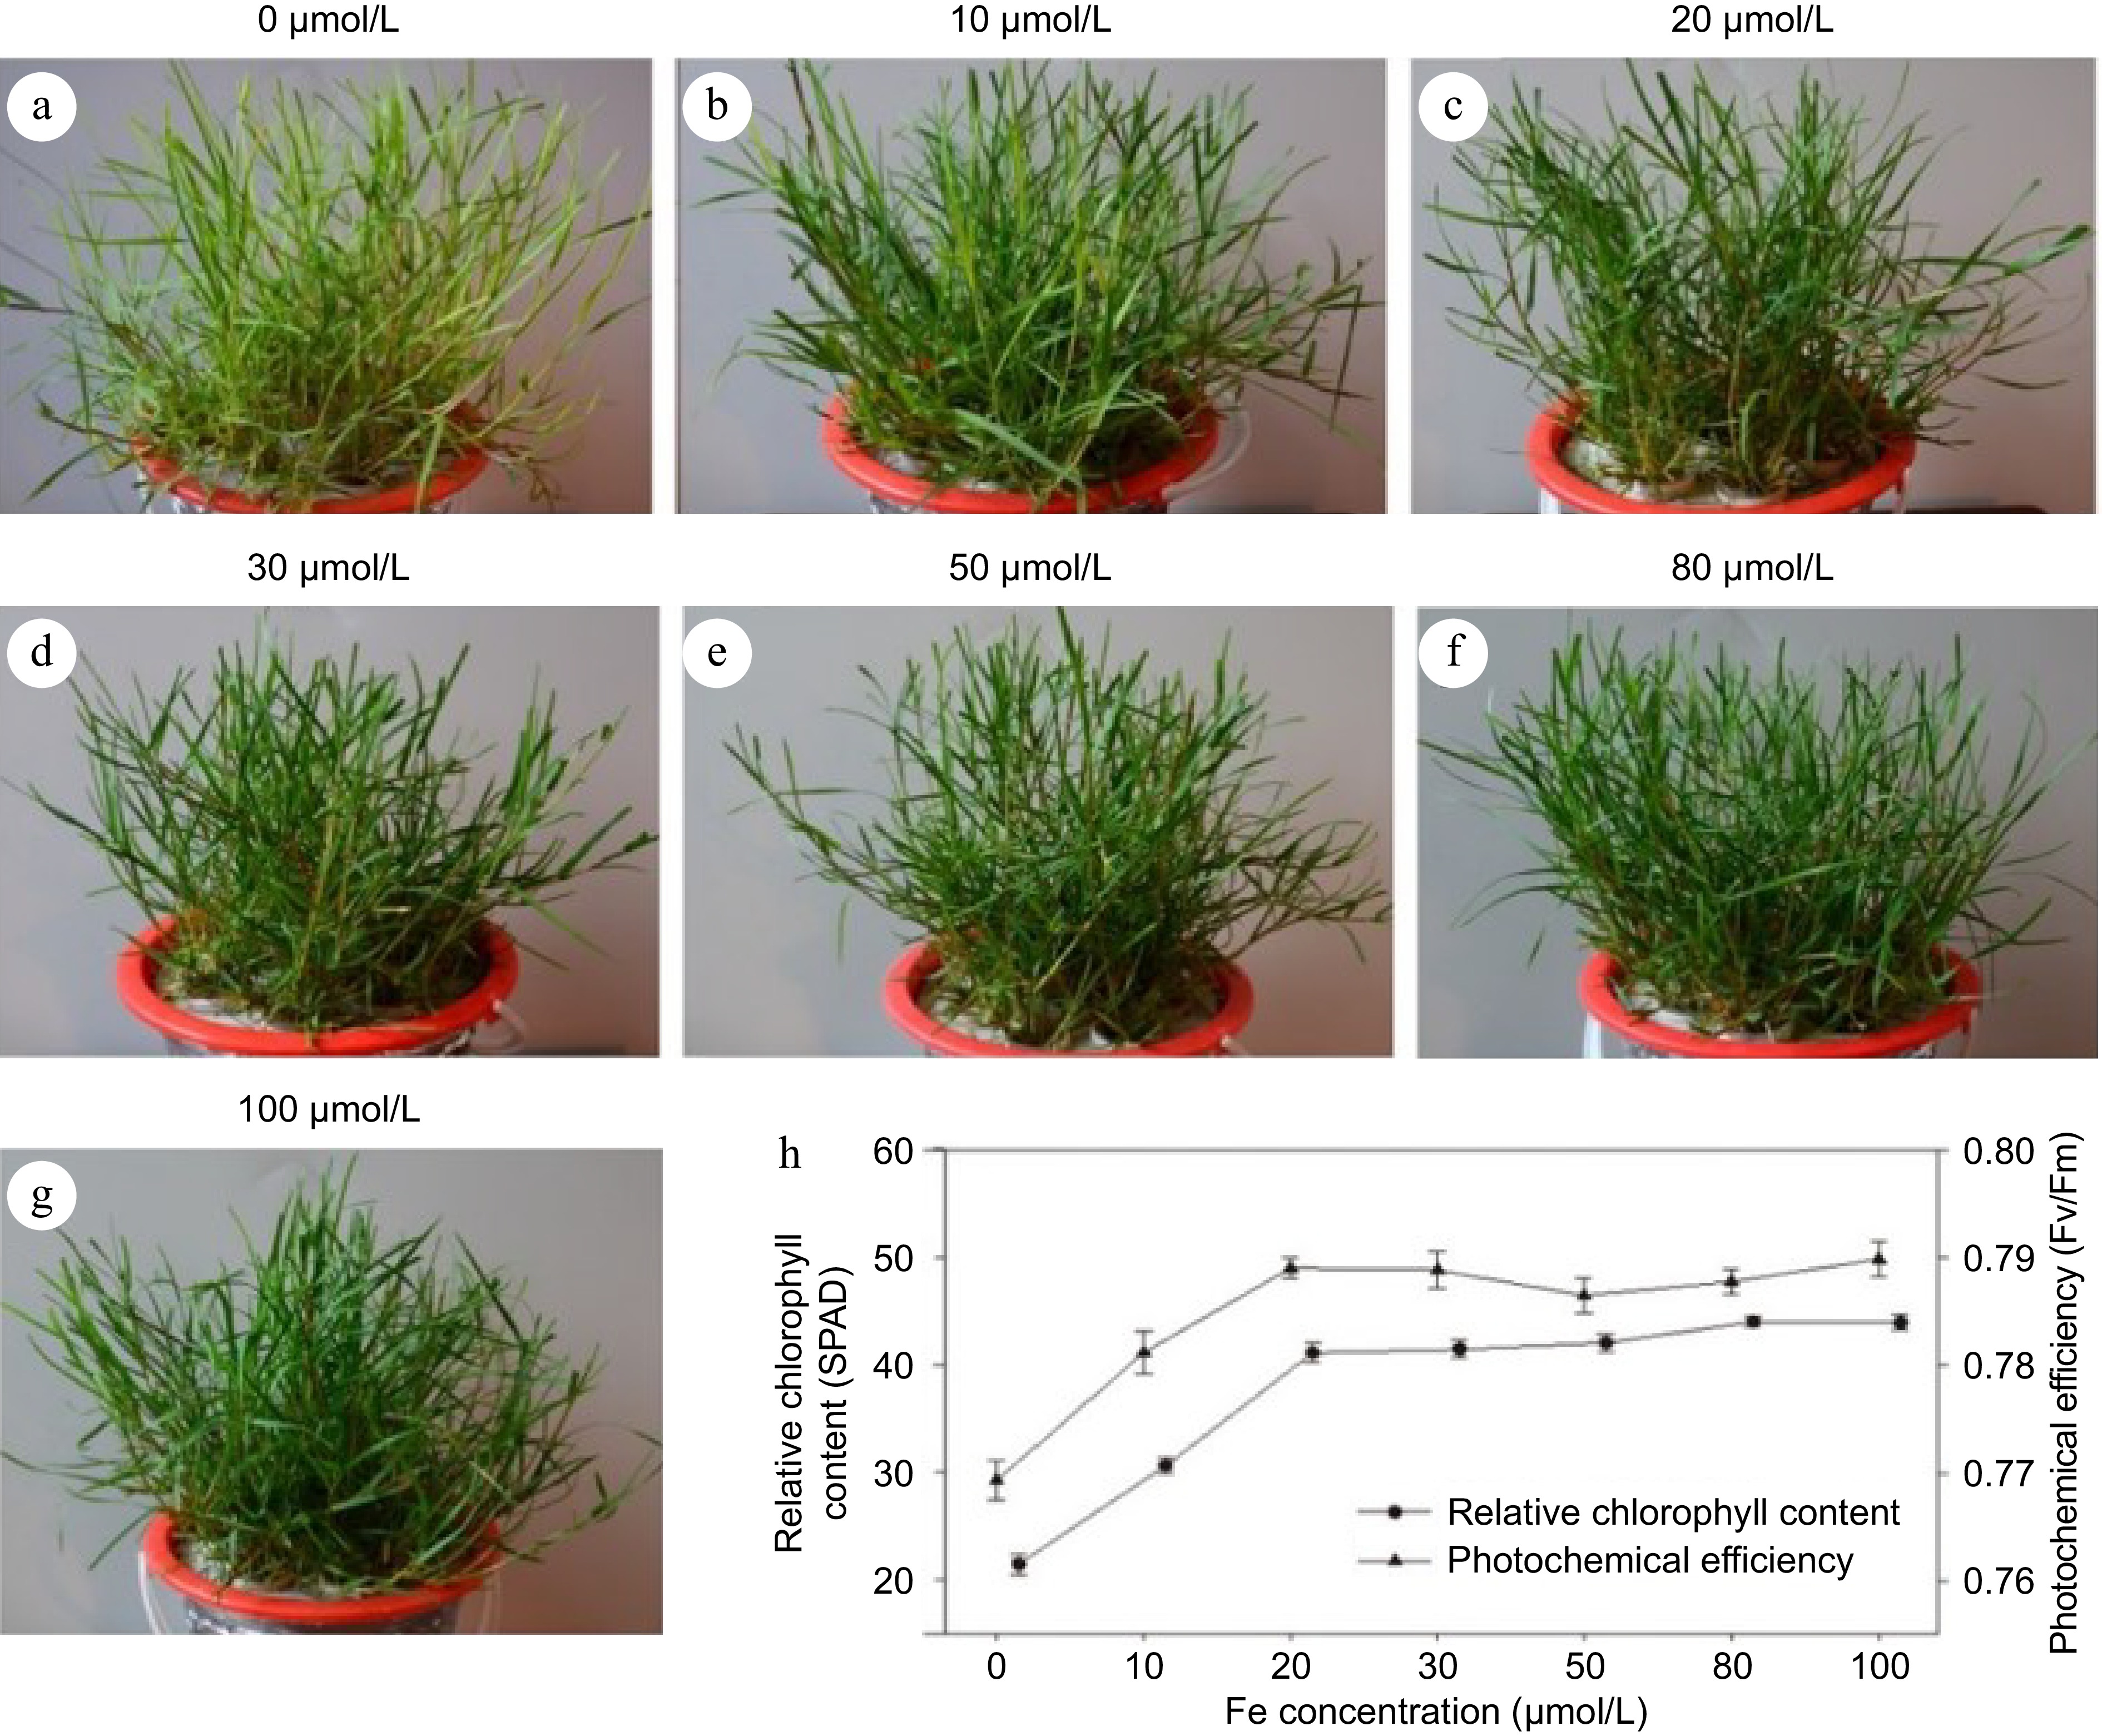
Figure 1.
Screening of optimum concentration of iron in seashore paspalum. (a)−(g) The phenotype of different concentrations iron in seashore paspalum. (h) Indexes of relative chlorophyll content (SPAD) and photochemical efficiency (Fv/Fm). The mean value and standard error were obtained from three biological replicates of every index.
-
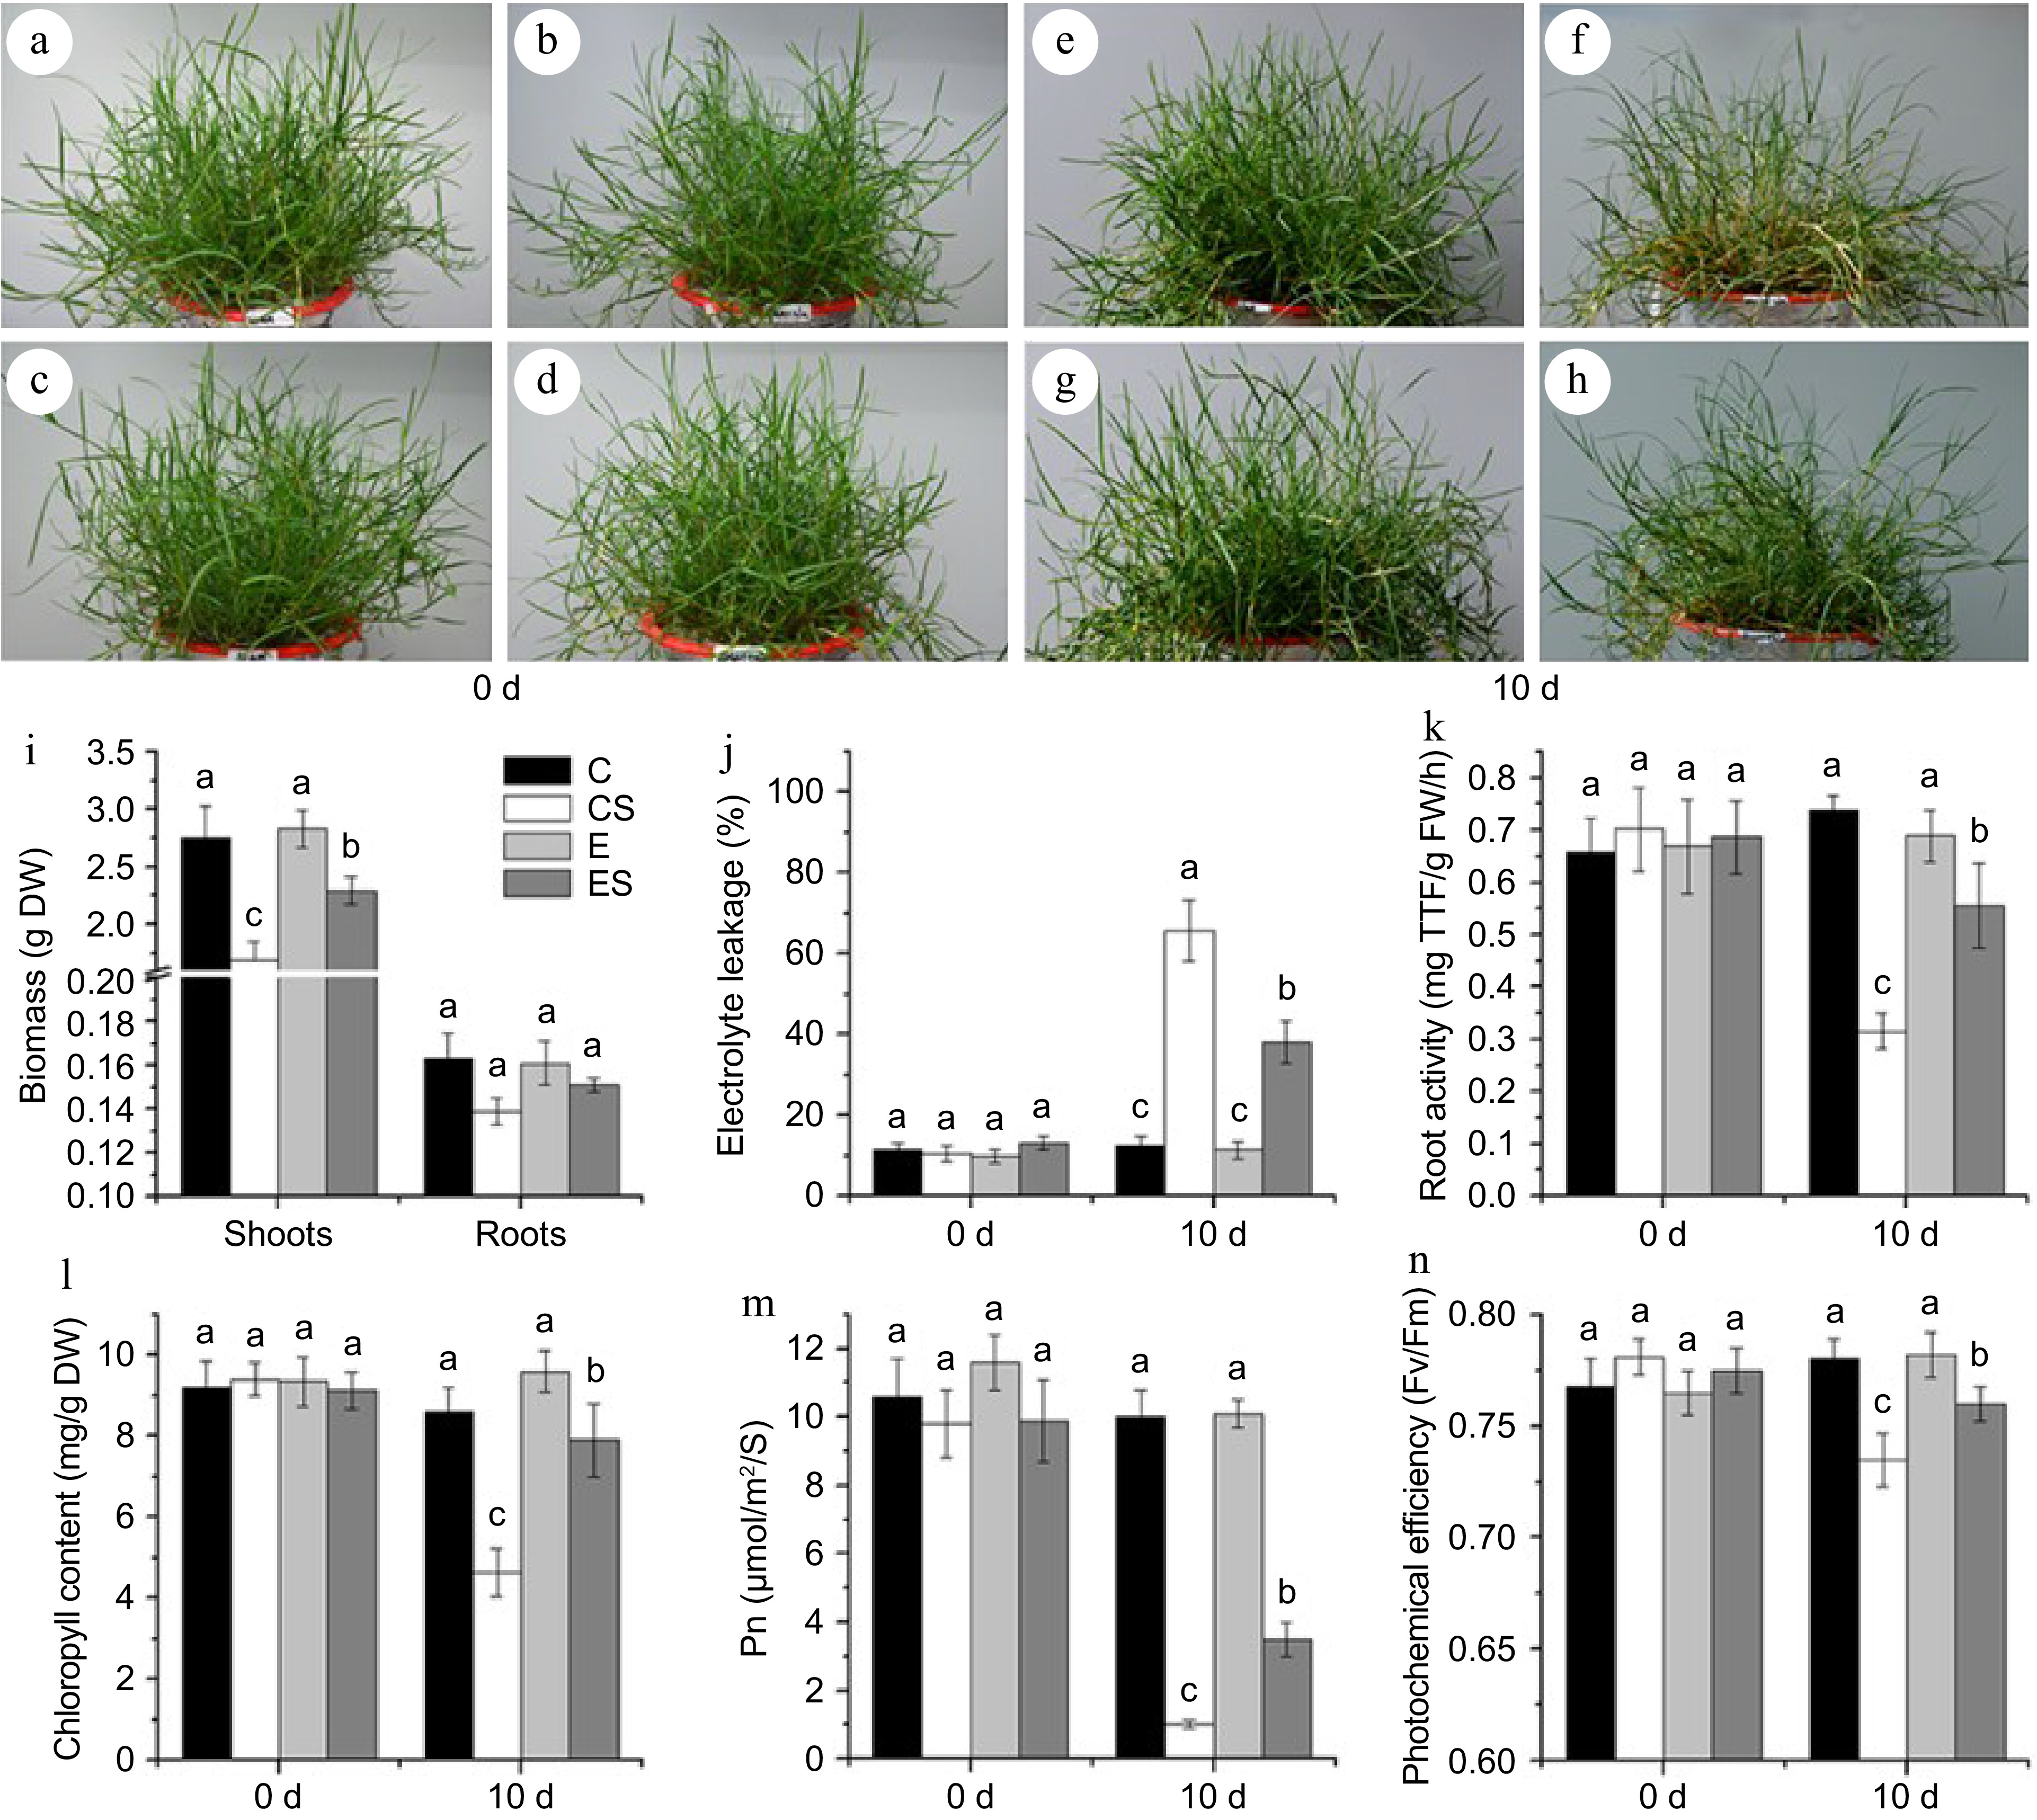
Figure 2.
The appearance and physiological indexes of seashore paspalum under different treatments. (a)−(d) The control group. (e) The treatment of 20 μM Fe (II) EDTA + 0 mM NaCl (C); (f) The treatment of 20 μM Fe (II) EDTA + 250 mM NaCl (CS); (g) The treatment of 80 μM Fe (II) EDTA + 0 mM NaCl (E); (h) The treatment of 80 μM Fe (II) EDTA + 250 mM NaCl (ES). (i)−(n) Physiological indexes of biomass, electrolyte leakage (EL), root activity, chlorophyll content, net photosynthetic rate (Pn), and leaf photochemical efficiency (Fv/Fm) successively, the mean value and standard error were obtained from 3 biological replicates of every physiological index, and the significance difference level p < 0.05.
-
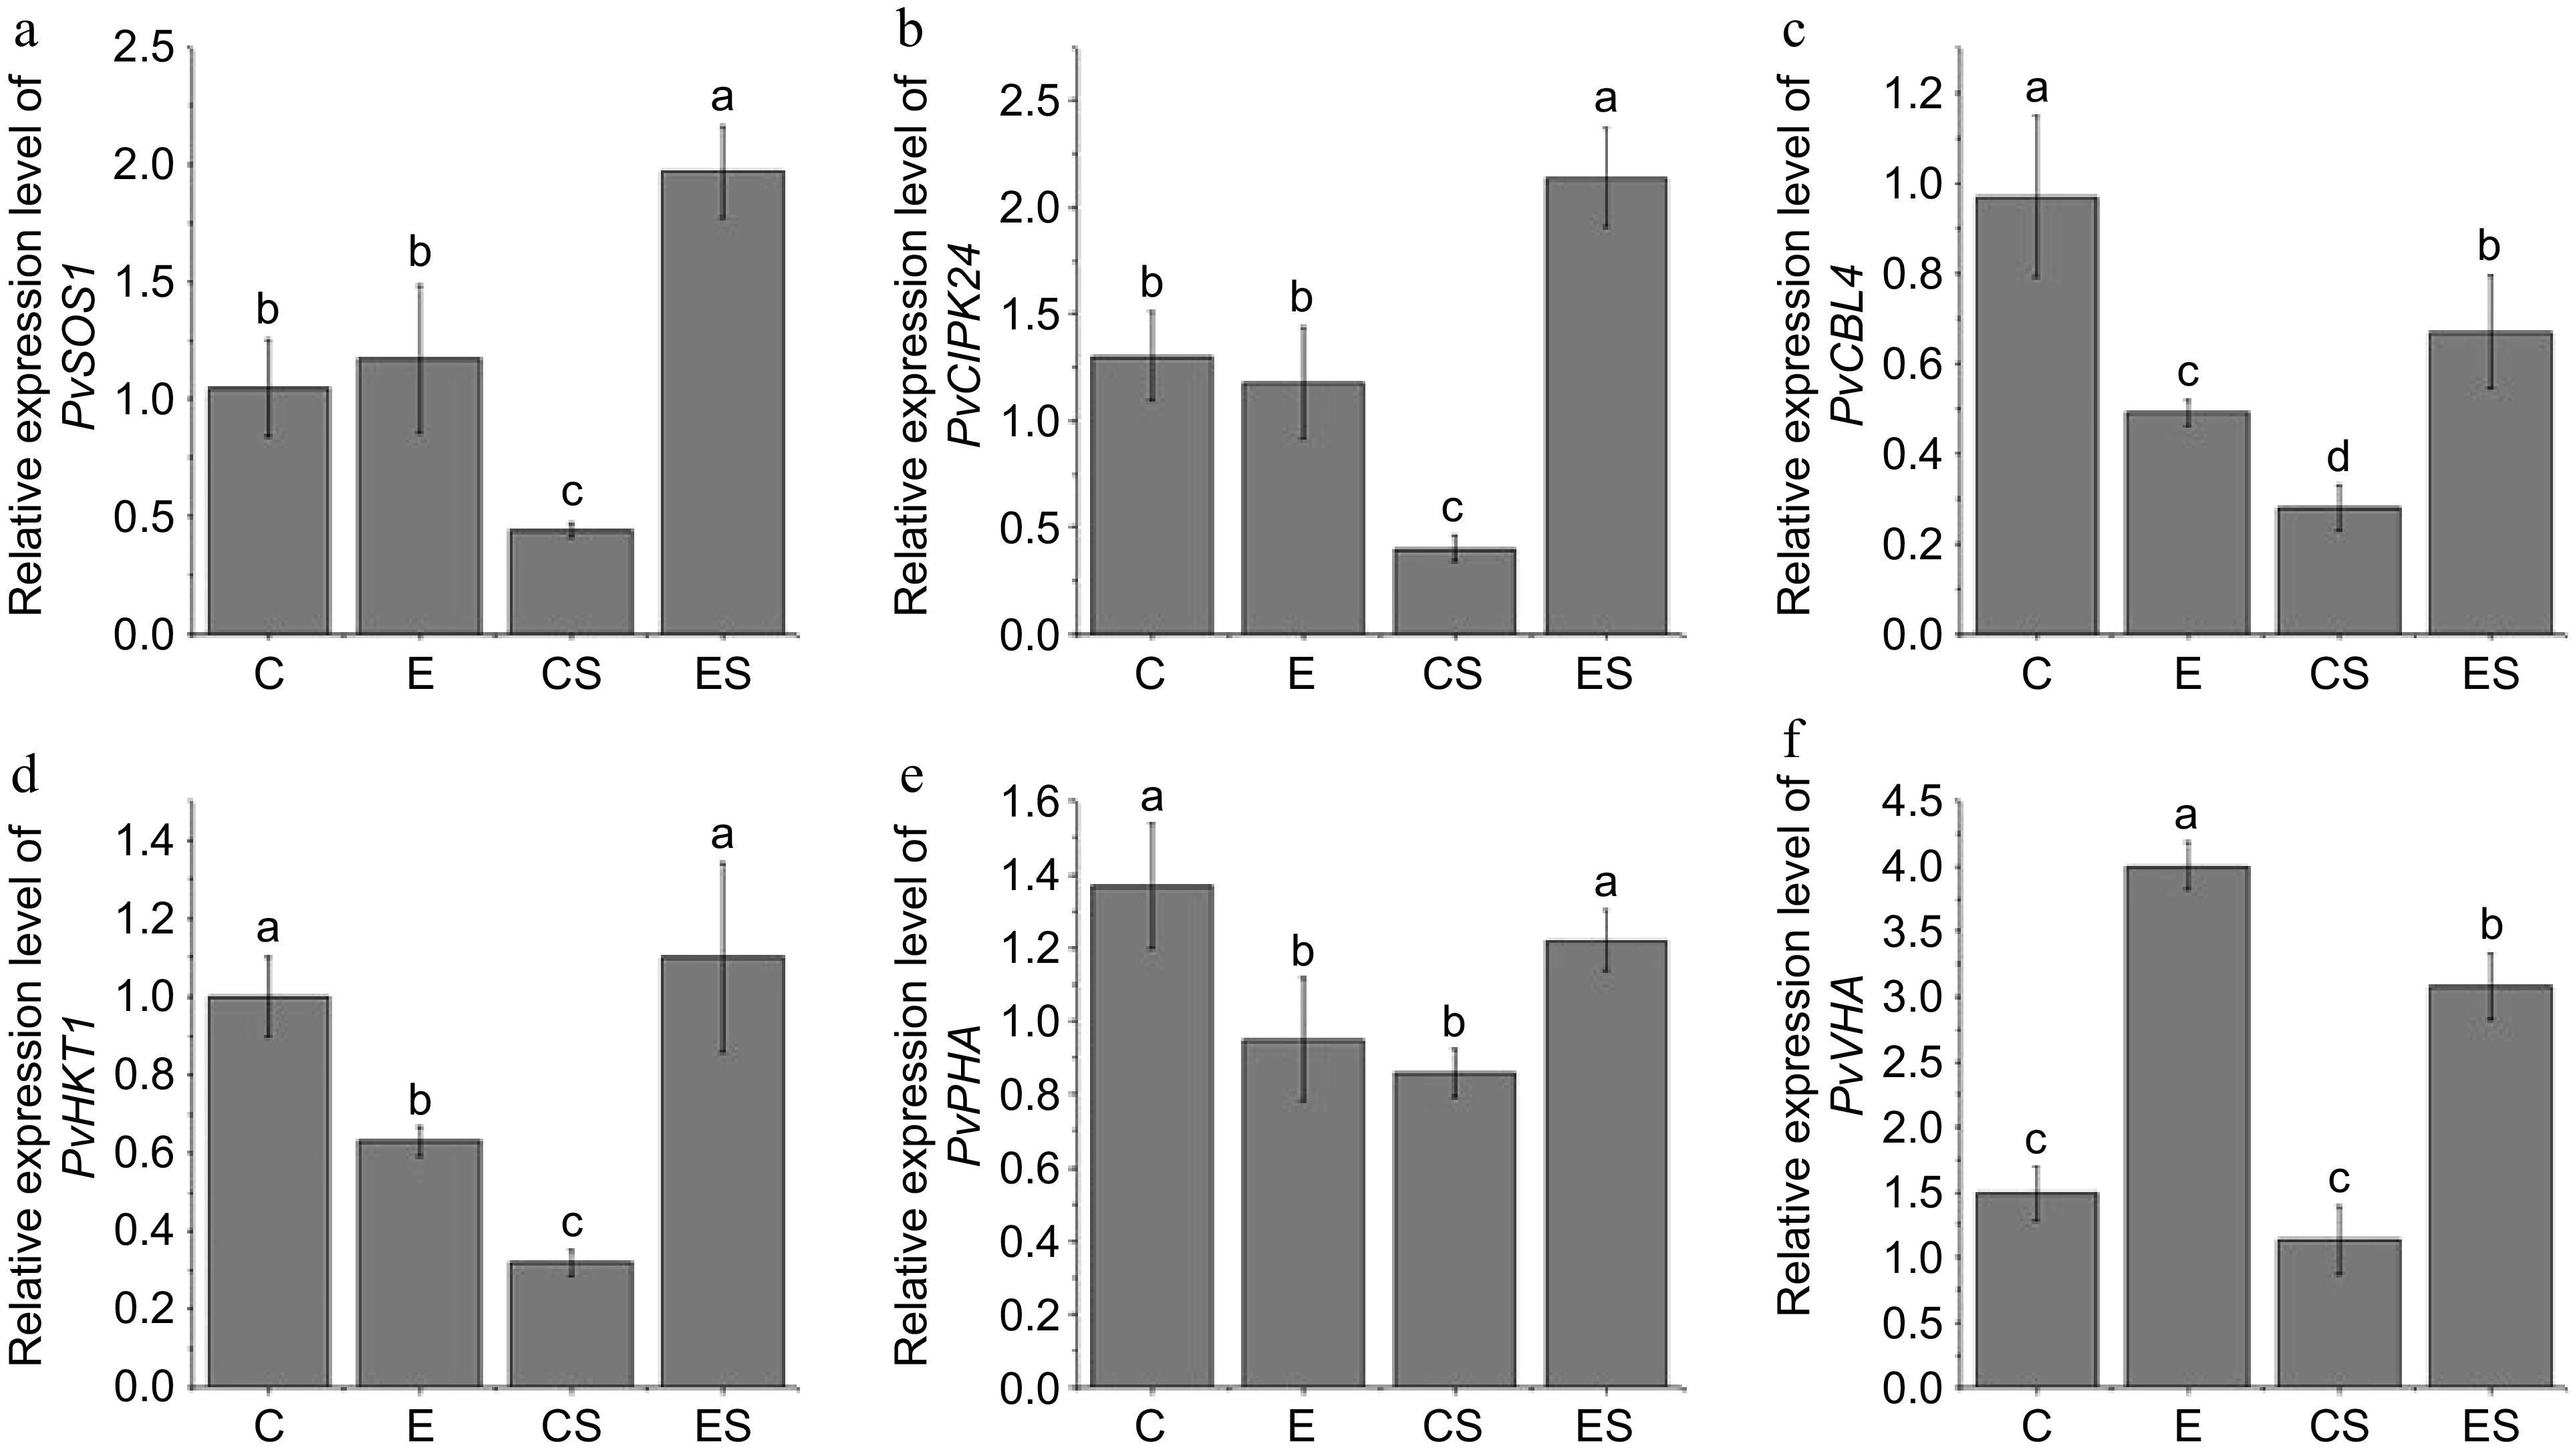
Figure 3.
Effects of excess iron on relative expression level of PvSOS1, PvCIPK24, PvCBL4, PvHKT1, PvPHA, and PvVHA in seashore paspalum roots under salt stress. (C), 20 μM Fe (II) EDTA + 0 mM NaCl; (CS), the treatment of 20 μM Fe (II) EDTA + 250 mM NaCl; (E), the treatment of 80 μM Fe (II) EDTA + 0 mM NaCl; (ES), the treatment of 80 μM Fe (II) EDTA + 250 mM NaCl. The mean value and standard error were obtained from five biological replicates, and the significance difference level p < 0.05.
-
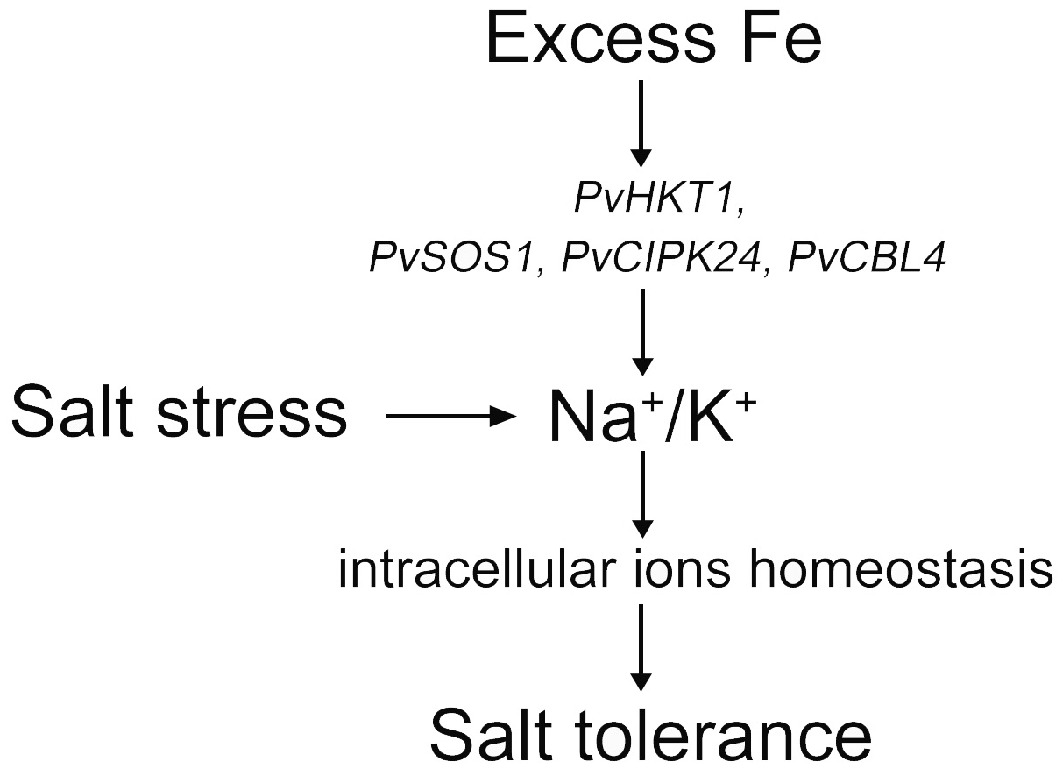
Figure 4.
Abstract figure to illustrate the result of how excess Fe improved salt tolerance under salt stress.
-
Gene Primer sequences 5'-3' (RT-F/RT-R) PvSOS1 GCTTGAAGAGGGACGAATAAA/ACGAAGAAATGCAGCACAGAT PvCIPK24 GGCTTAATGAGGTGTTGGCTG/TGGTAAACTCCTTTGCTGTGG PvCBL4 GCGCCGACATCAGACAAGA/CGAGCAATGCCAAGACCAT PvPHA CAGGAAGTACCCGAGAAATCA/CGTTAACACCAAGAACAAGAGC PvVHA CTCTCCTCCTGGTGGTGGTTT/CCTCACGTGCTTTTGTCCTAATAT PvHKT1 CCATCATCTACAACATTTGTGC/TCATTTCTGAGCCTTCTCCTC PvEF1α GCGGACTGTGCTGTGCTTATC/AGTGGTGGCATCCATCTTGTT Table 1.
Primers of genes used for qRT-PCR analysis.
-
Treatment days 0 day 10 day C CS E ES C CS E ES Roots Na/K 0.502a 0.557a 0.565a 0.583a 0.519c 6.344a 0.612c 4.232b K 4.634a ± 0.079 4.524a ± 0.121 4.341a ± 0.097 4.569a ± 0.174 4.236b ± 0.160 4.040b ± 0.079 4.677a ± 0.126 4.631a ± 0.079 Na 2.324a ± 0.092 2.517a ± 0.050 2.450a ± 0.099 2.648a ± 0.101 2.198c ± 0.100 25.622a ± 0.327 2.856c ± 0.391 19.561b ± 0.816 P 11.320a ± 0.059 10.860a ± 0.064 11.460a ± 0.818 11.830a ± 0.468 11.850a ± 0.092 8.180c ± 0.718 10.420ab ± 0.501 9.140bc ± 0.409 Ca 7.020a ± 0.449 7.575a ± 0.195 7.726a ± 0.184 7.152a ± 0.015 7.578b ± 0.283 7.752b ± 0.116 7.802b ± 0.339 9.388a ± 0.379 Mg 2.236a ± 0.187 1.943a ± 0.030 2.339a ± 0.l82 2.169a ± 0.099 2.129b ± 0.040 2.041b ± 0.003 2.355a ± 0.054 2.448a ± 0.068 Mn 3.762a ± 0.104 3.788a ± 0.127 3.684a ± 0.177 3.804a ± 0.067 3.630b ± 0.061 1.006d ± 0.062 4.002a ± 0.159 1.725c ± 0.085 Zn 0.501a ± 0.028 0.484a ± 0.009 0.508a ± 0.028 0.459a ± 0.029 0.514a ± 0.010 0.403bc ± 0.045 0.464ab ± 0.018 0.368c ± 0.011 Fe 0.0252a ± 0.0016 0.0247a ± 0.0018 0.0247a ± 0.0017 0.0272a ± 0.0015 0.0240bc ± 0.0034 0.0174c ± 0.0040 0.0738a ± 0.0017 0.0307b ± 0.0008 Cu 0.0109a ± 0.0011 0.0102a ± 0.0002 0.0091a ± 0.0007 0.0112a ± 0.0002 0.0100b ± 0.0004 0.0103b ± 0.0001 0.0193a ± 0.0024 0.0116b ± 0.0008 Shoots Na/K 0.011a 0.010a 0.009a 0.009a 0.007b 0.436a 0.007b 0.415a K 23.100a ± 0.514 22.360a ± 0.890 22.530a ± 0.334 23.740a ± 1.302 24.810a ± 1.096 19.380b ± 0.693 25.820a ± 0.055 21.730b ± 0.869 Na 0.265a ± 0.054 0.231a ± 0.015 0.205a ± 0.010 0.217a ± 0.022 0.176c ± 0.022 8.453b ± 0.310 0.169c ± 0.040 9.007a ± 0.474 P 8.676a ± 0.511 8.587a ± 0.395 8.782a ± 0.279 8.386a ± 0.389 8.313a ± 0.785 7.683a ± 0.186 8.190a ± 0.496 8.440a ± 0.154 Ca 3.357a ± 0.024 3.505a ± 0.086 3.320a ± 0.053 3.544a ± 0.091 3.458a ± 0.071 3.472a ± 0.167 3.721a ± 0.154 3.370a ± 0.130 Mg 1.440a ± 0.051 1.513a ± 0.020 1.461a ± 0.036 1.507a ± 0.020 1.476a ± 0.080 1.437a ± 0.117 1.583a ± 0.026 1.482a ± 0.086 Mn 0.419a ± 0.037 0.394a ± 0.023 0.405a ± 0.022 0.411a ± 0.023 0.386c ± 0.008 0.451ab ± 0.030 0.467ab ± 0.042 0.476a ± 0.011 Zn 0.277a ± 0.021 0.286a ± 0.015 0.254a ± 0.014 0.276a ± 0.018 0.265a ± 0.154 0.262a ± 0.013 0.238a ± 0.015 0.243a ± 0.017 Fe 0.0040a ± 0.0010 0.0034a ± 0.0004 0.0039a ± 0.0003 0.0031a ± 0.0008 0.0032a ± 0.0009 0.0027a ± 0.0008 0.0044a ± 0.0003 0.0033a ± 0.0007 Cu 0.0049a ± 5.805E-05 0.0047a ± 0.0001 0.0049a ± 9.293E-05 0.0047a ± 0.0001 0.0045b ± 0.0002 0.0043b ± 0.0002 0.0053a ± 0.0003 0.0048ab ± 0.0002 (C), 20 μM Fe (II) EDTA + 0 mM NaCl; (CS), the treatment of 20 μM Fe (II) EDTA + 250 mM NaCl; (E), the treatment of 80 μM Fe (II) EDTA + 0 mM NaCl; (ES), the treatment of 80 μM Fe (II) EDTA + 250 mM NaCl. Different lowercase letters represents the significance difference level p < 0.05 between C, CS, E and ES treatment. Table 2.
The ion content in seashore paspalum before and after 10 d under different treatments (mg/g DW).
Figures
(4)
Tables
(2)