-
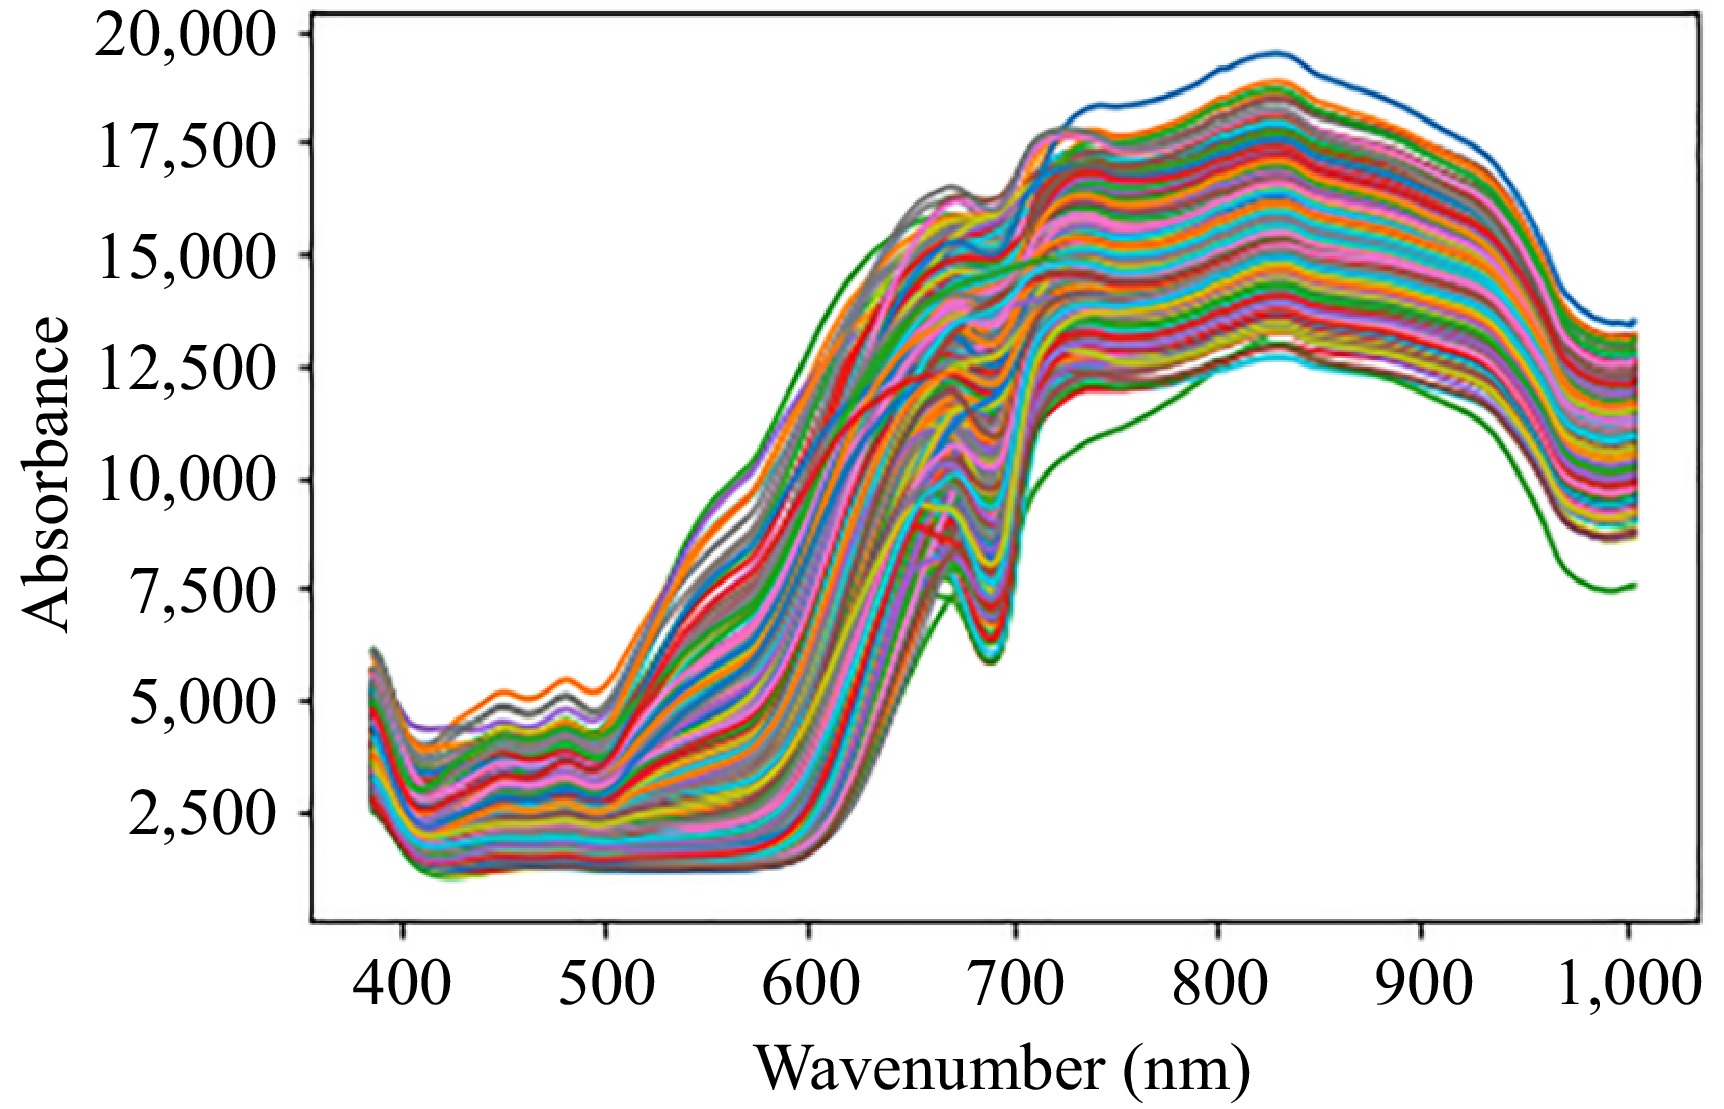
Figure 1.
Sample spectra of apples.
-
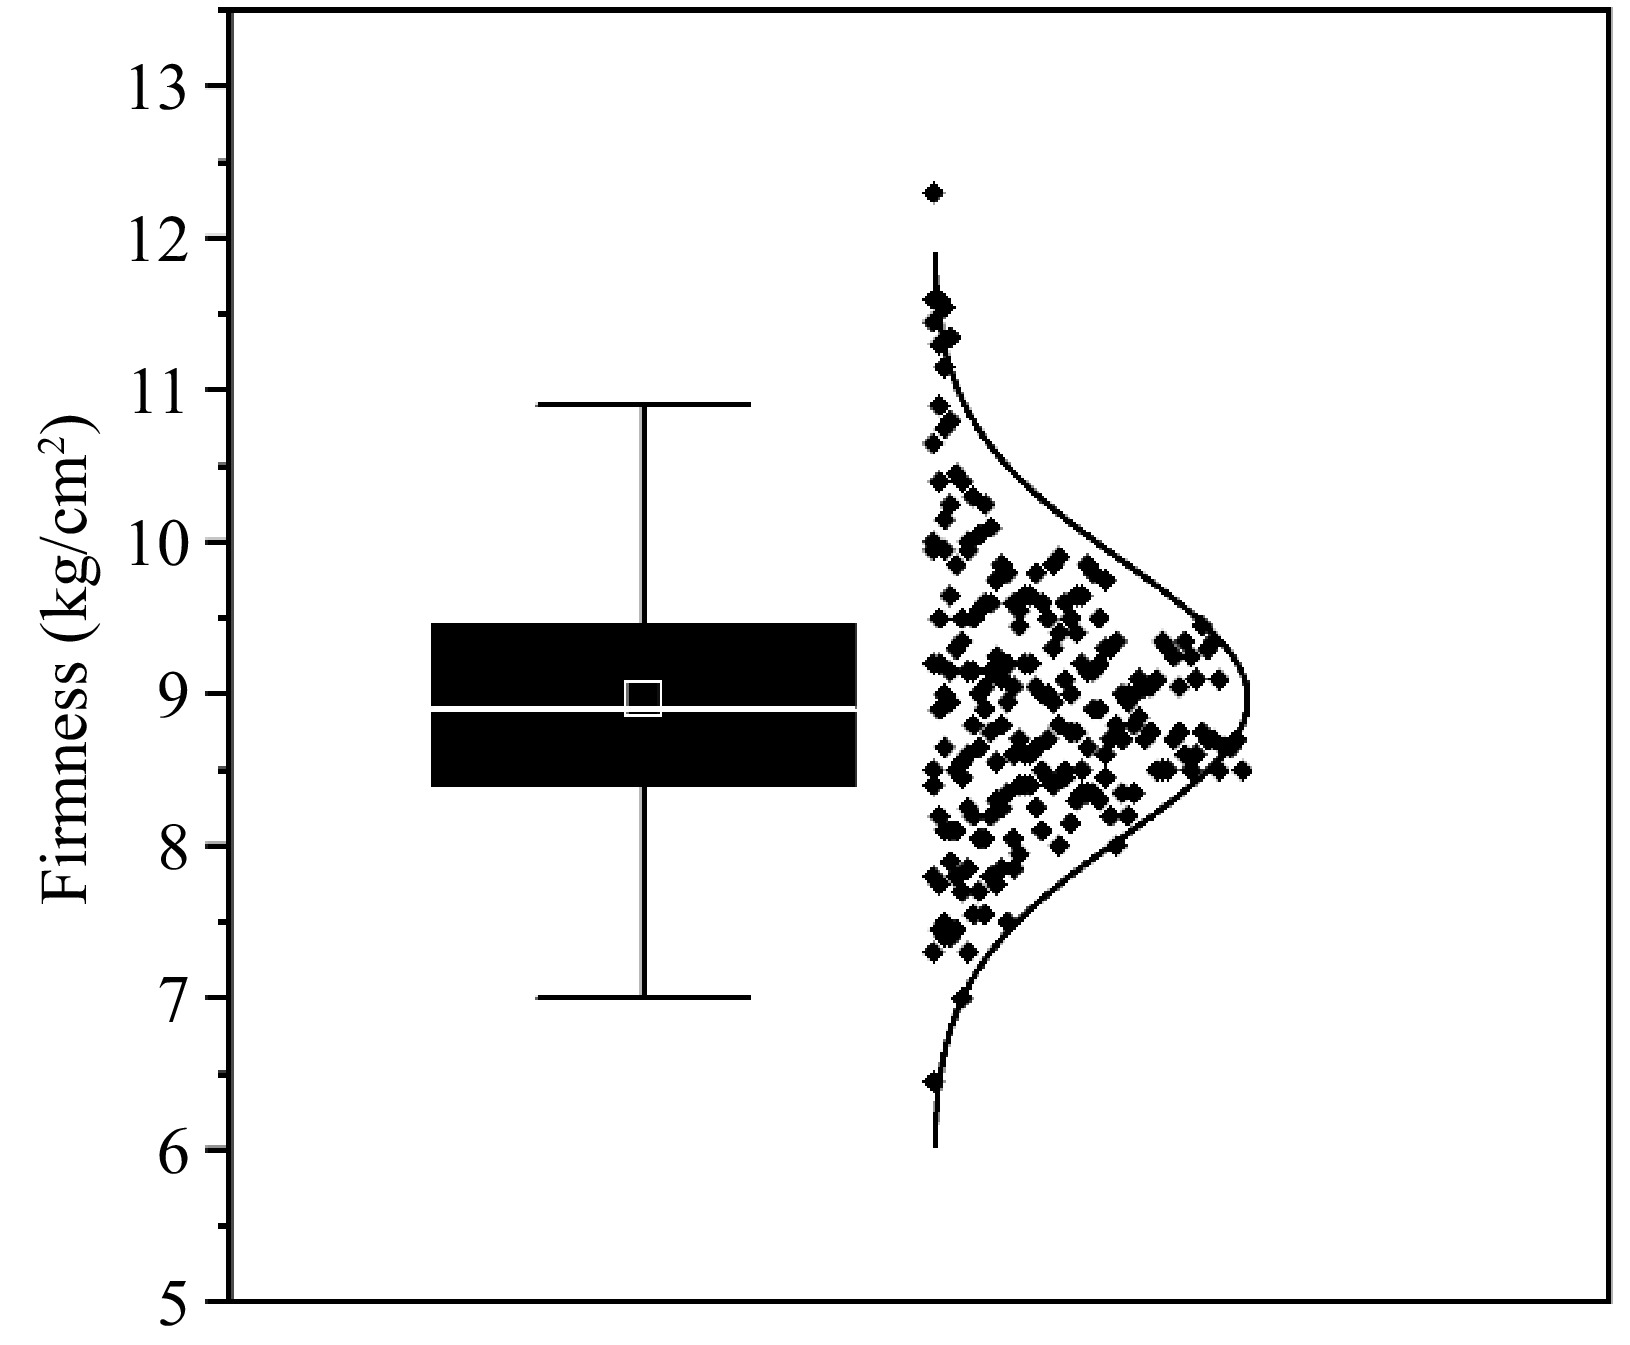
Figure 2.
Boxplot and normal curve plots of firmness.
-
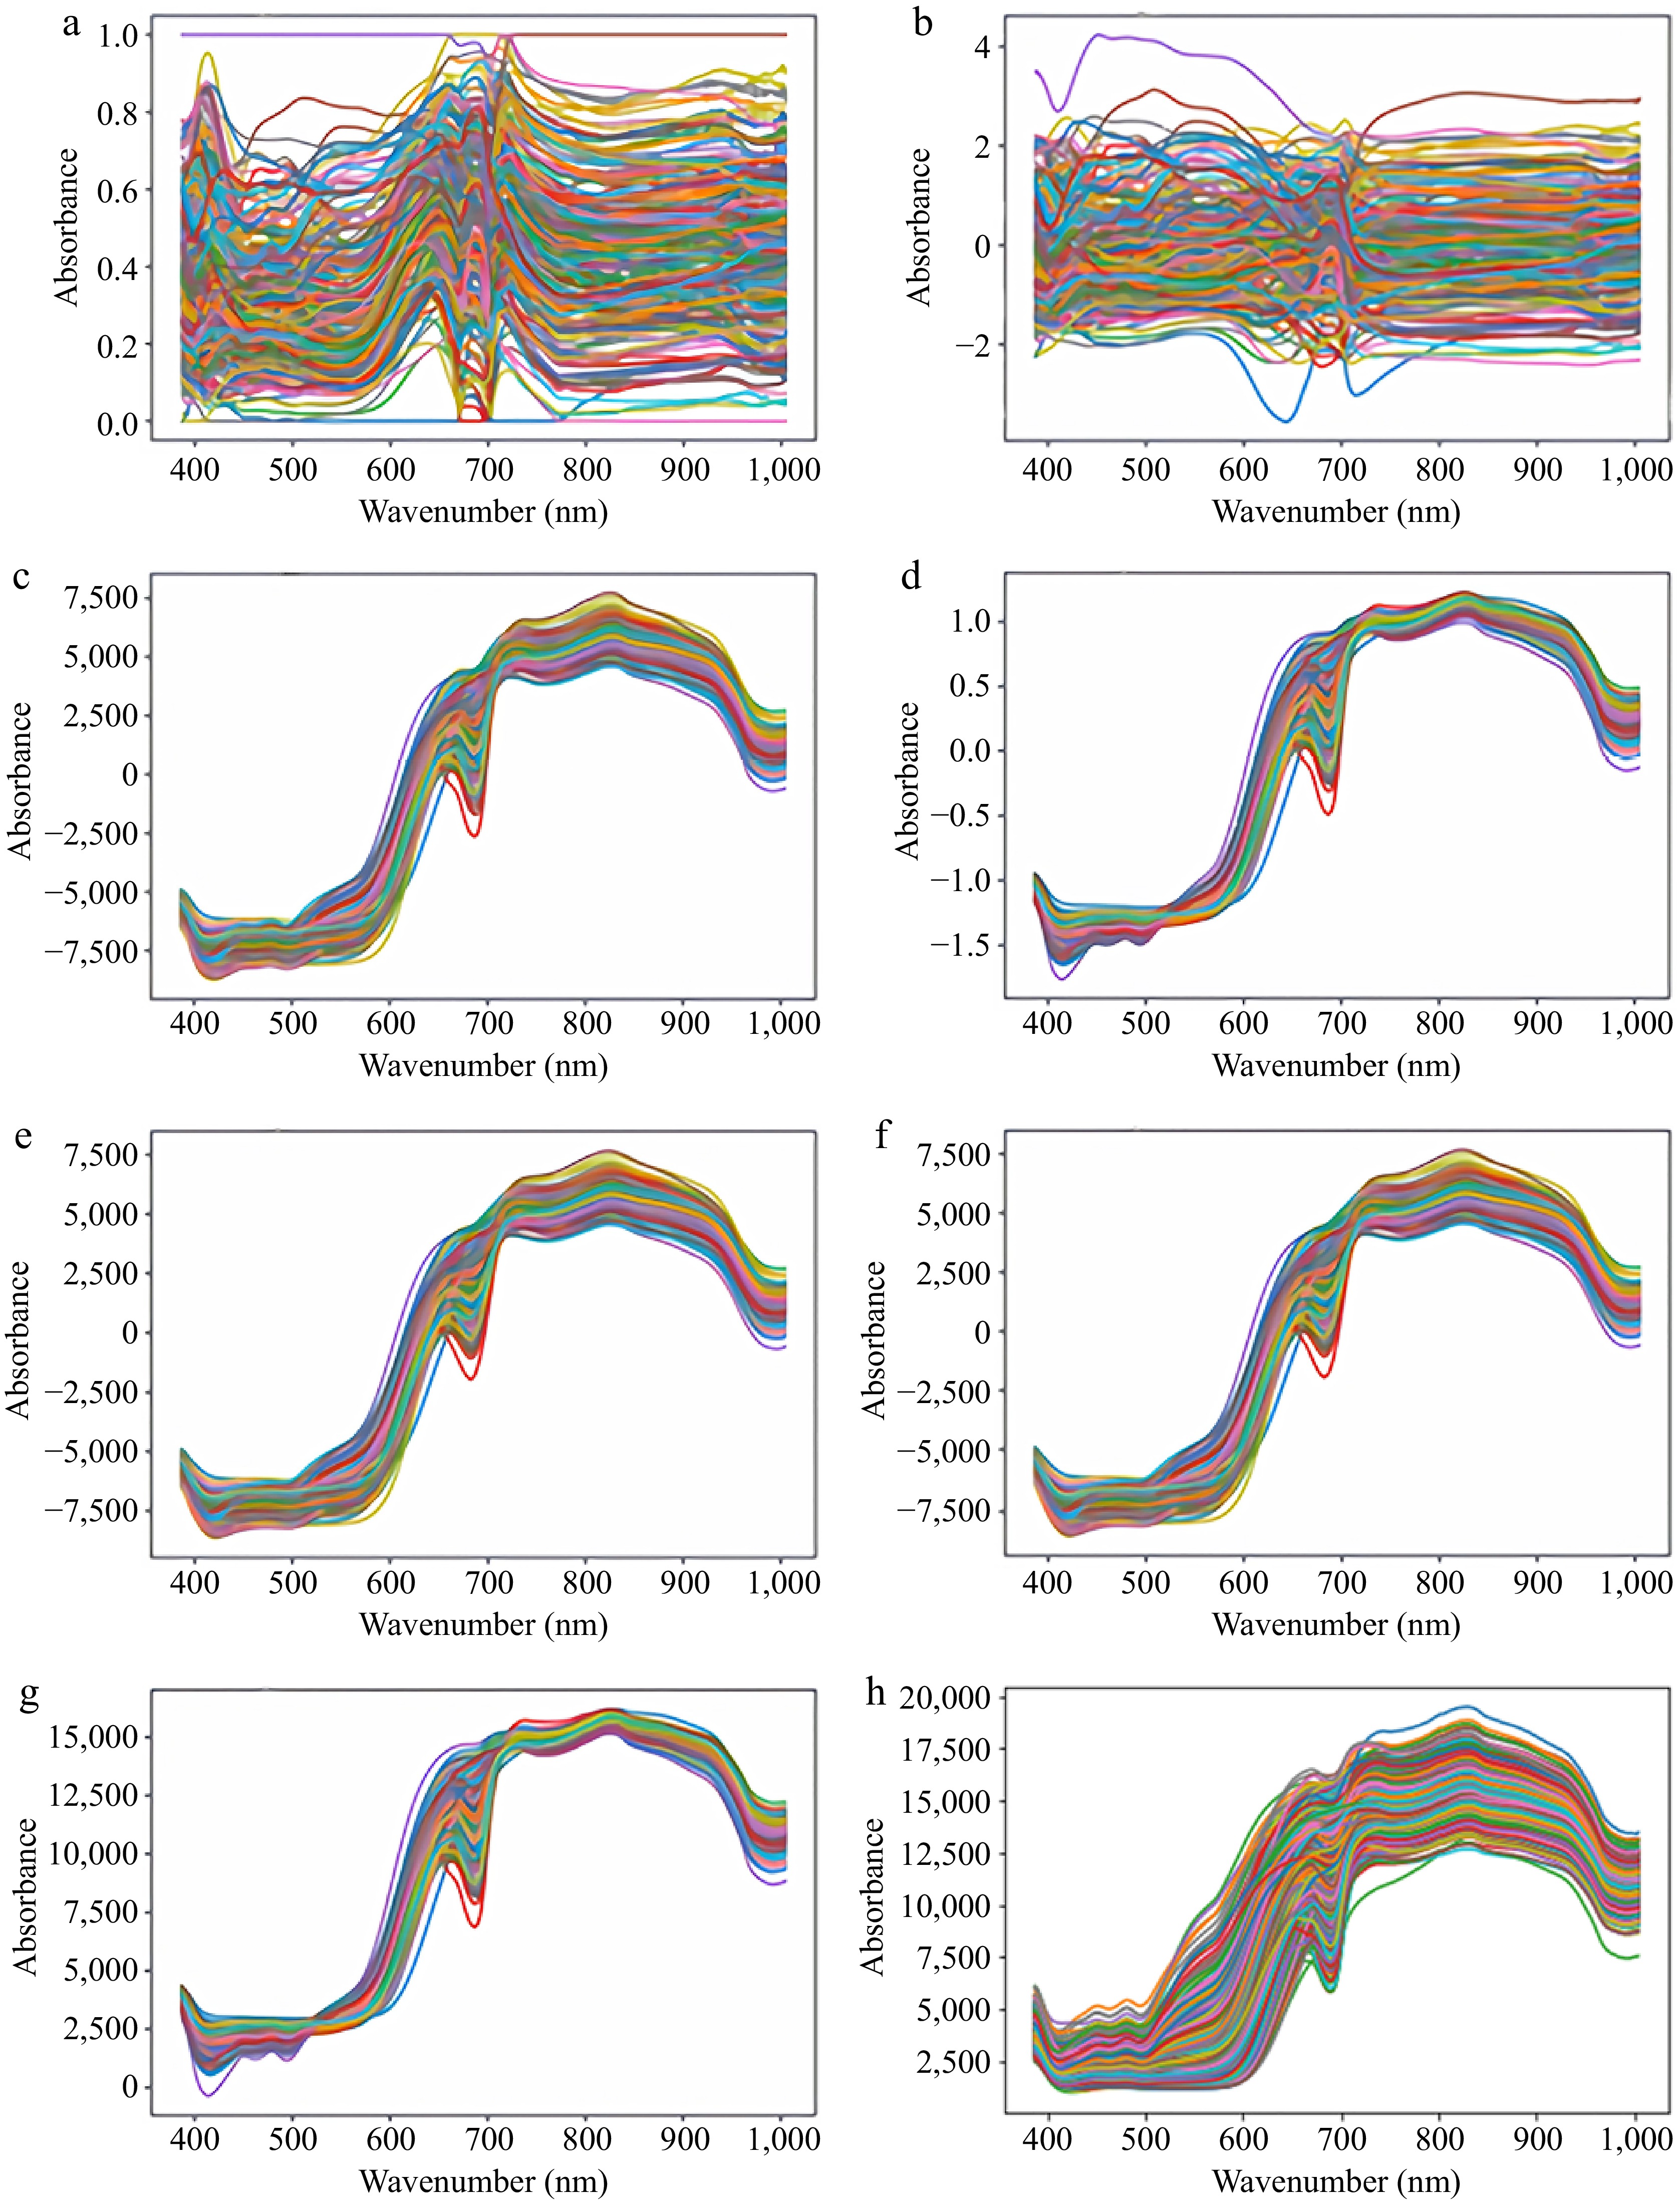
Figure 3.
Wavelength processing graph based on the seven different pre-processing algorithms and the raw wavelength graph. (a) Min Max Scaler, the spectrum of the MMS for dataset, (b) Standard Scaler, the spectrum of the SS for dataset, (c) Mean Centering, the spectrum of the CT for dataset, (d) Standard Normal Variate, the spectrum of the SNV for dataset, (e) Moving Average, the spectrum of the MA for dataset, (f) Savitzky Golay, the spectrum of the SG for dataset, (g) Multiplicative Scatter Correction, the spectrum of the MSC for dataset, (h) Raw Wavelength, the spectrum of the RW for dataset.
-
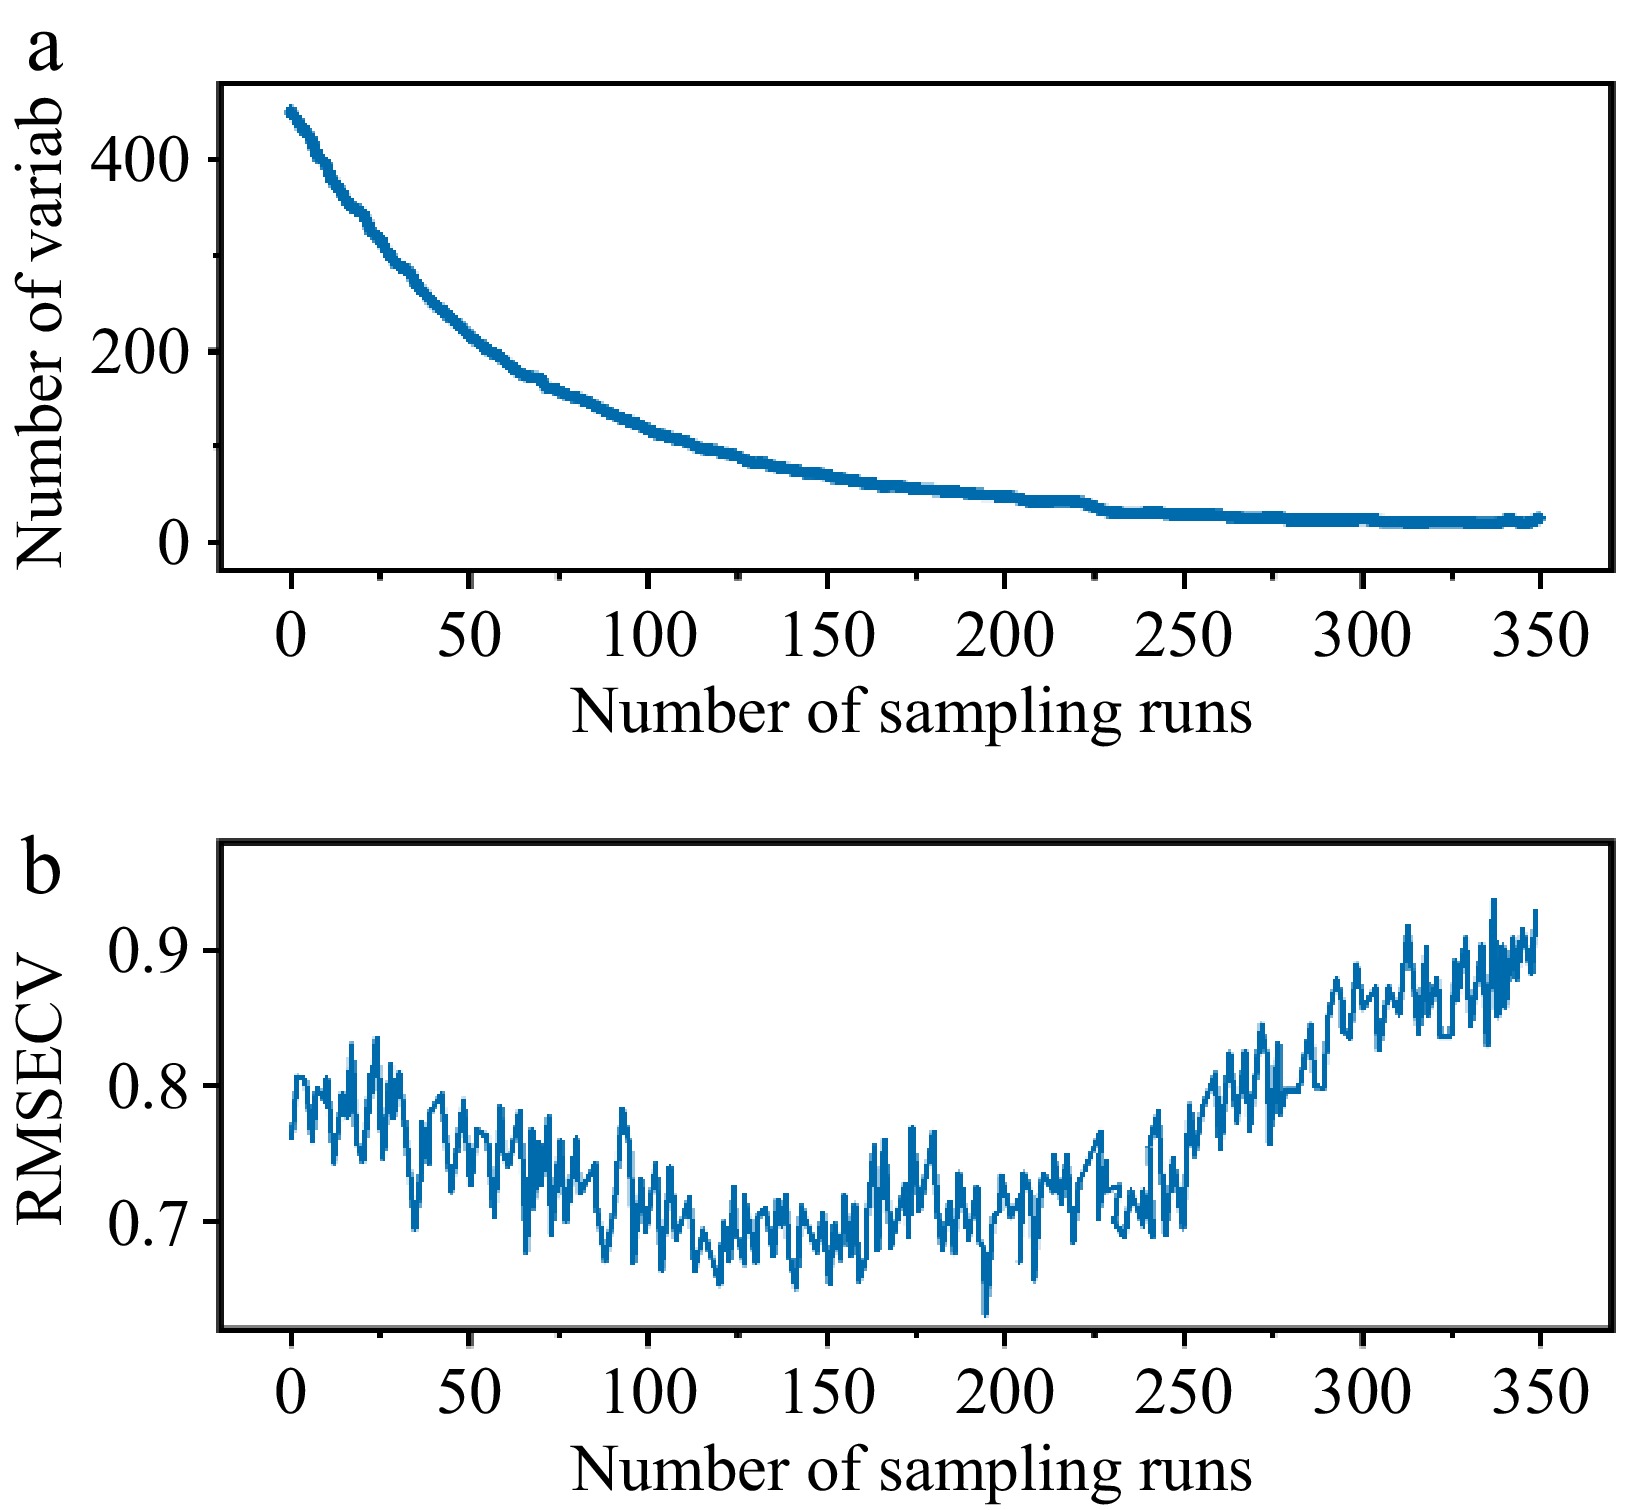
Figure 4.
Firmness feature extraction of CARS. Trend charts of (a) selecting the number of wavelengths and (b) RMSECV.
-
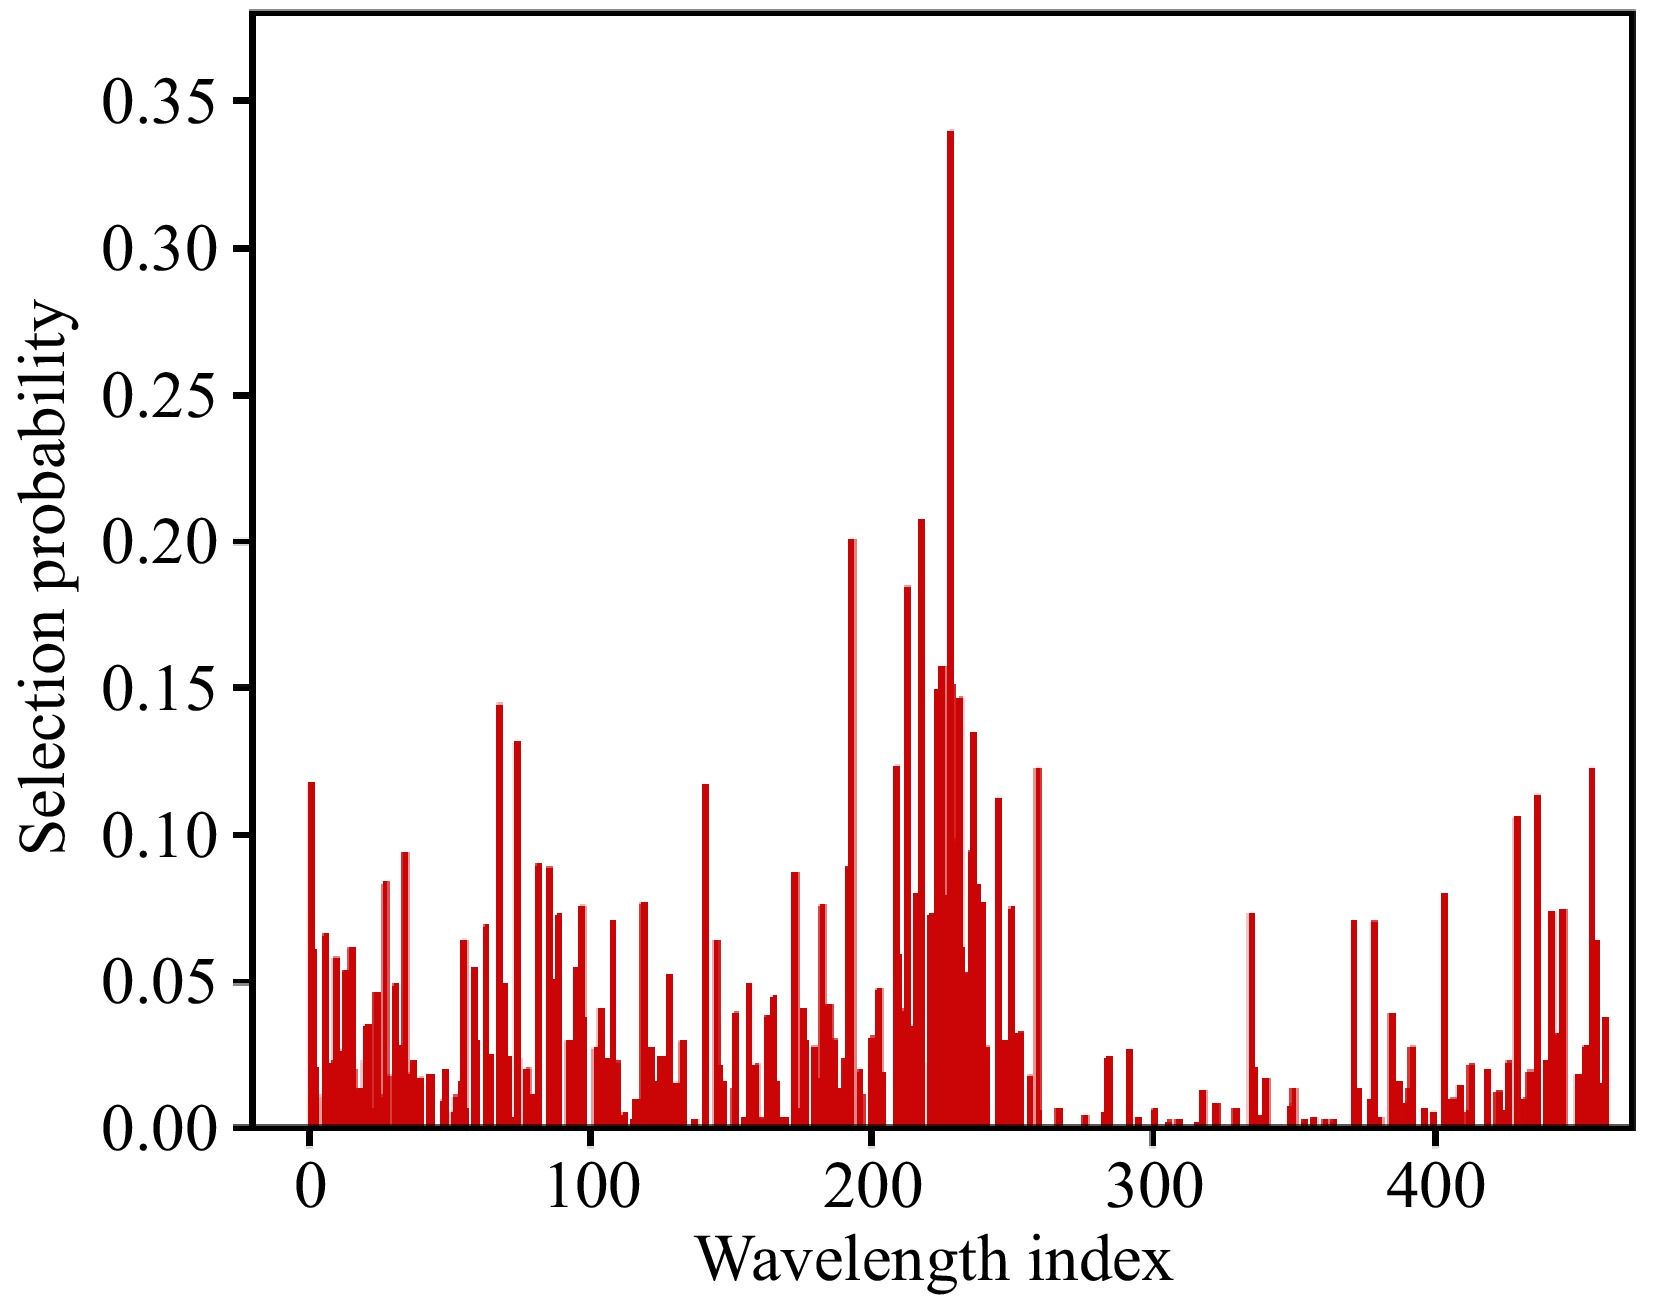
Figure 5.
Firmness feature extraction of RF.
-
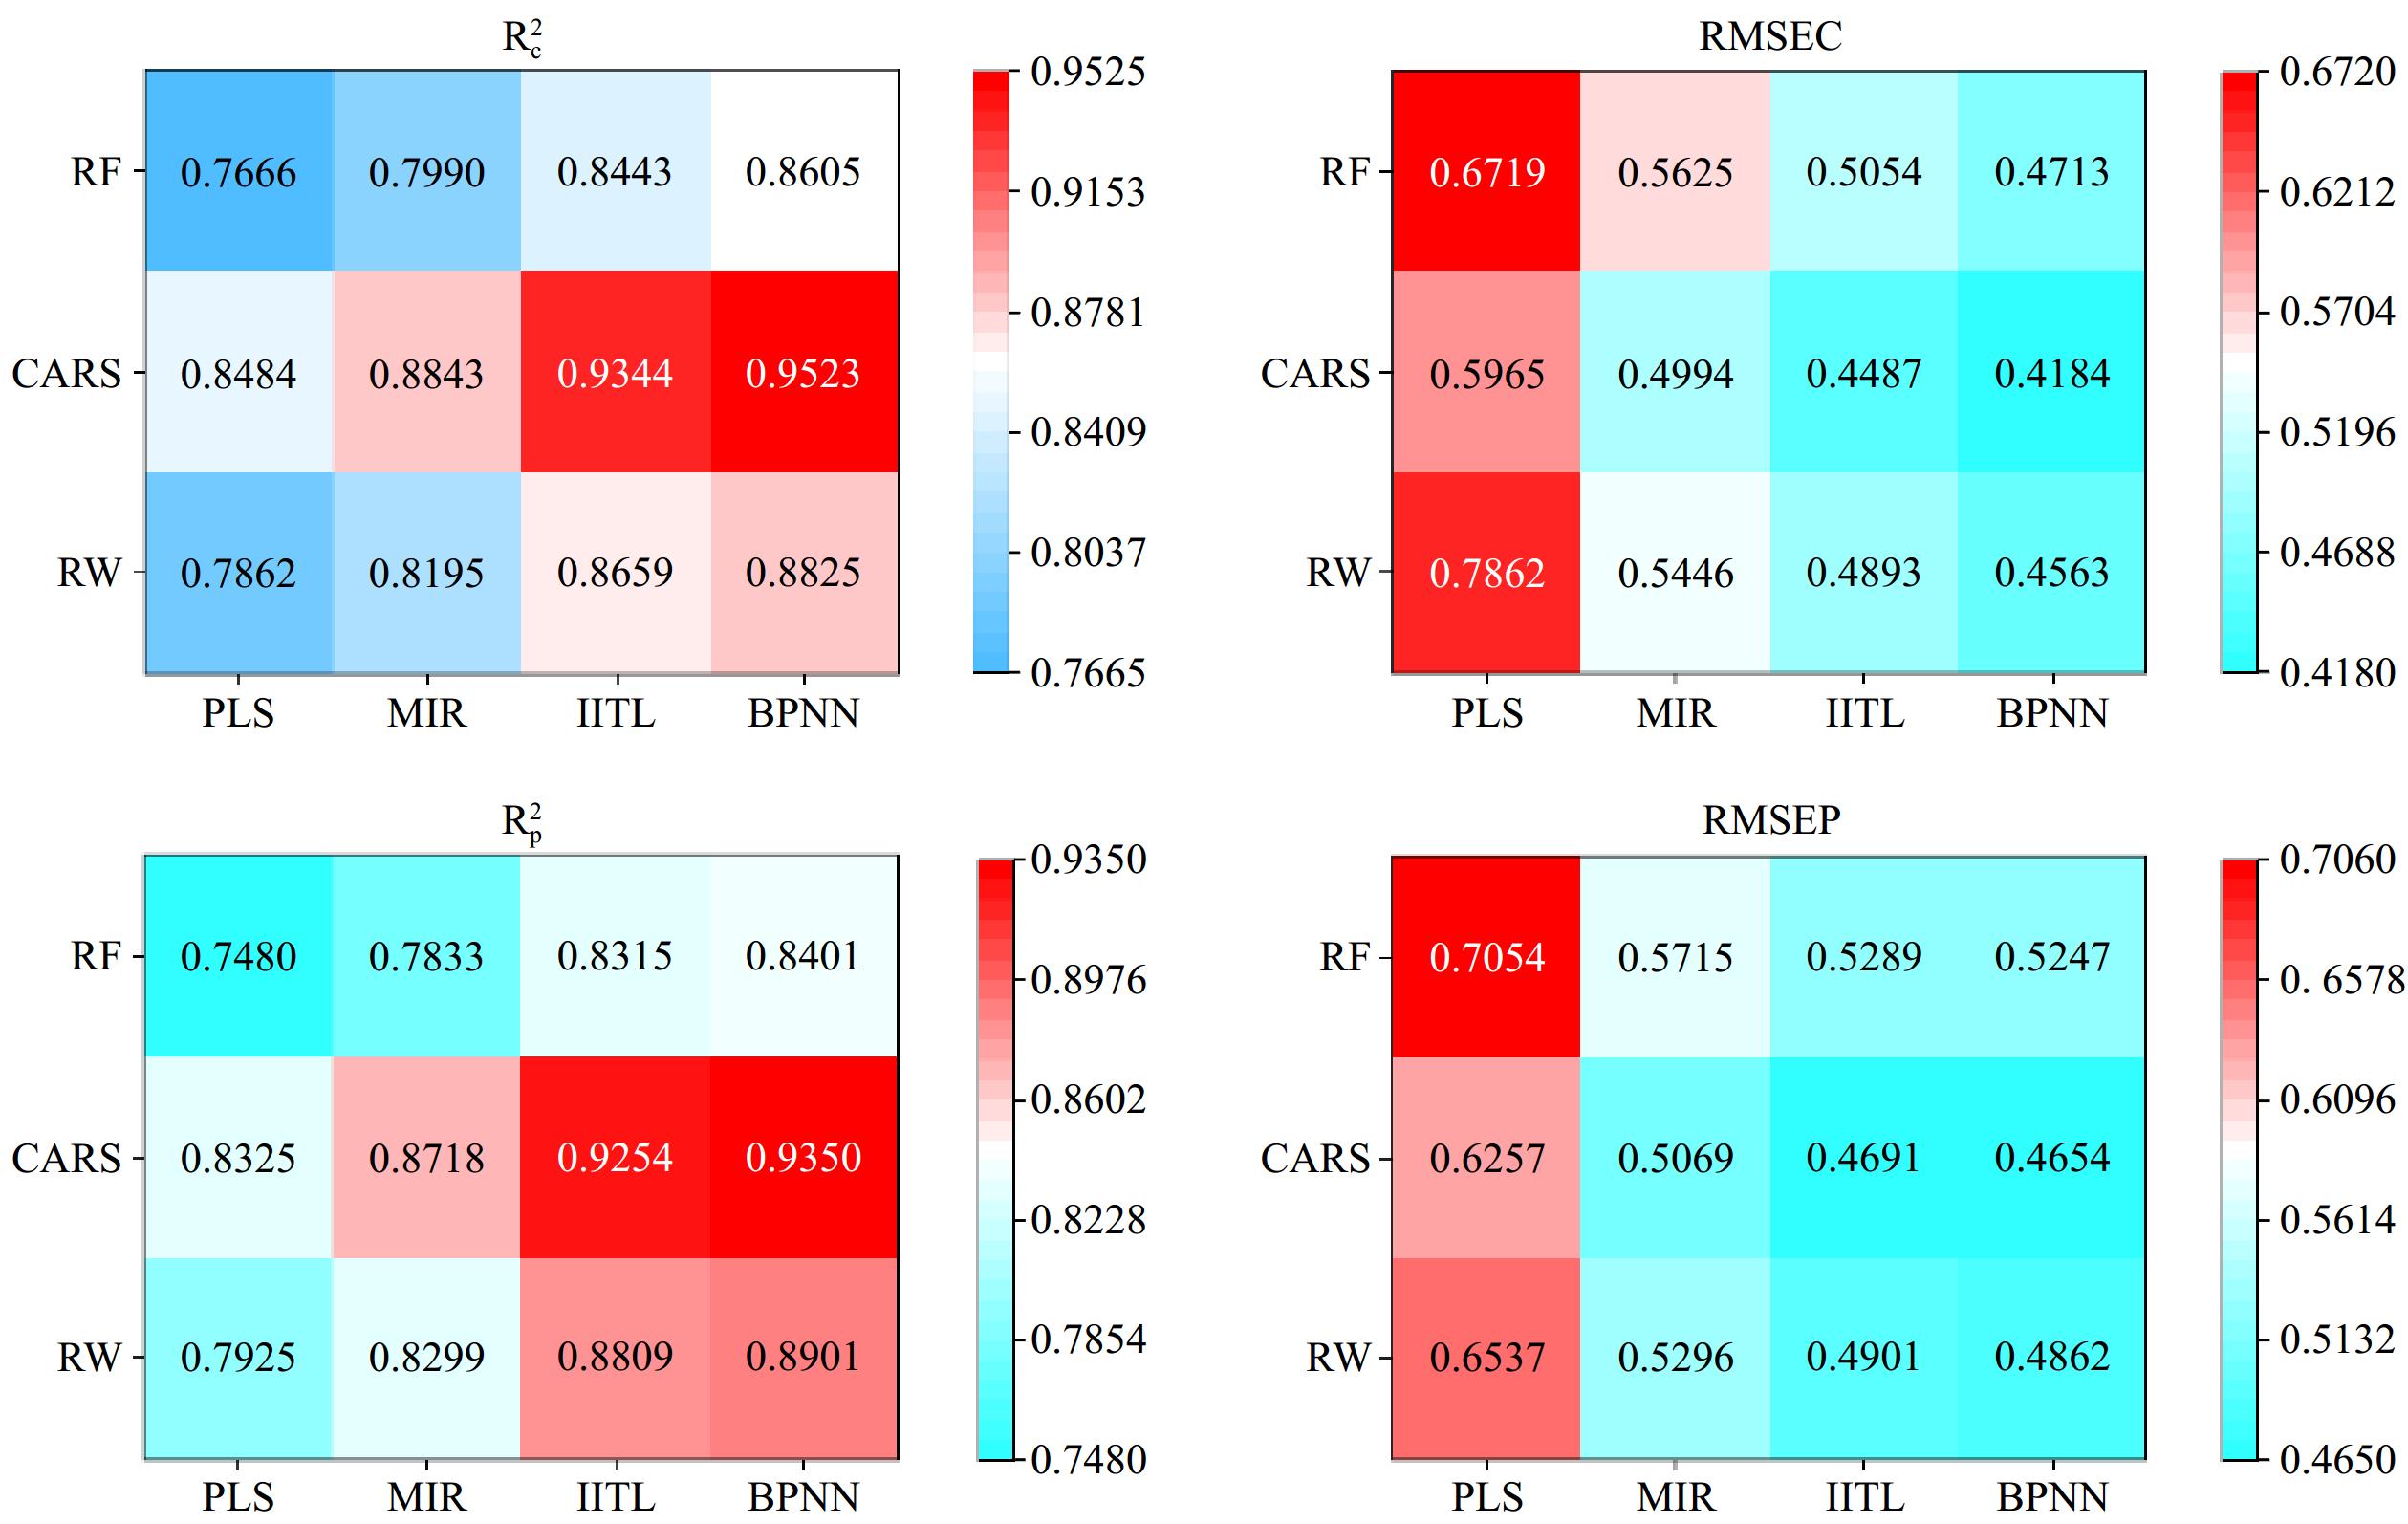
Figure 6.
Matrix heatmap.
-
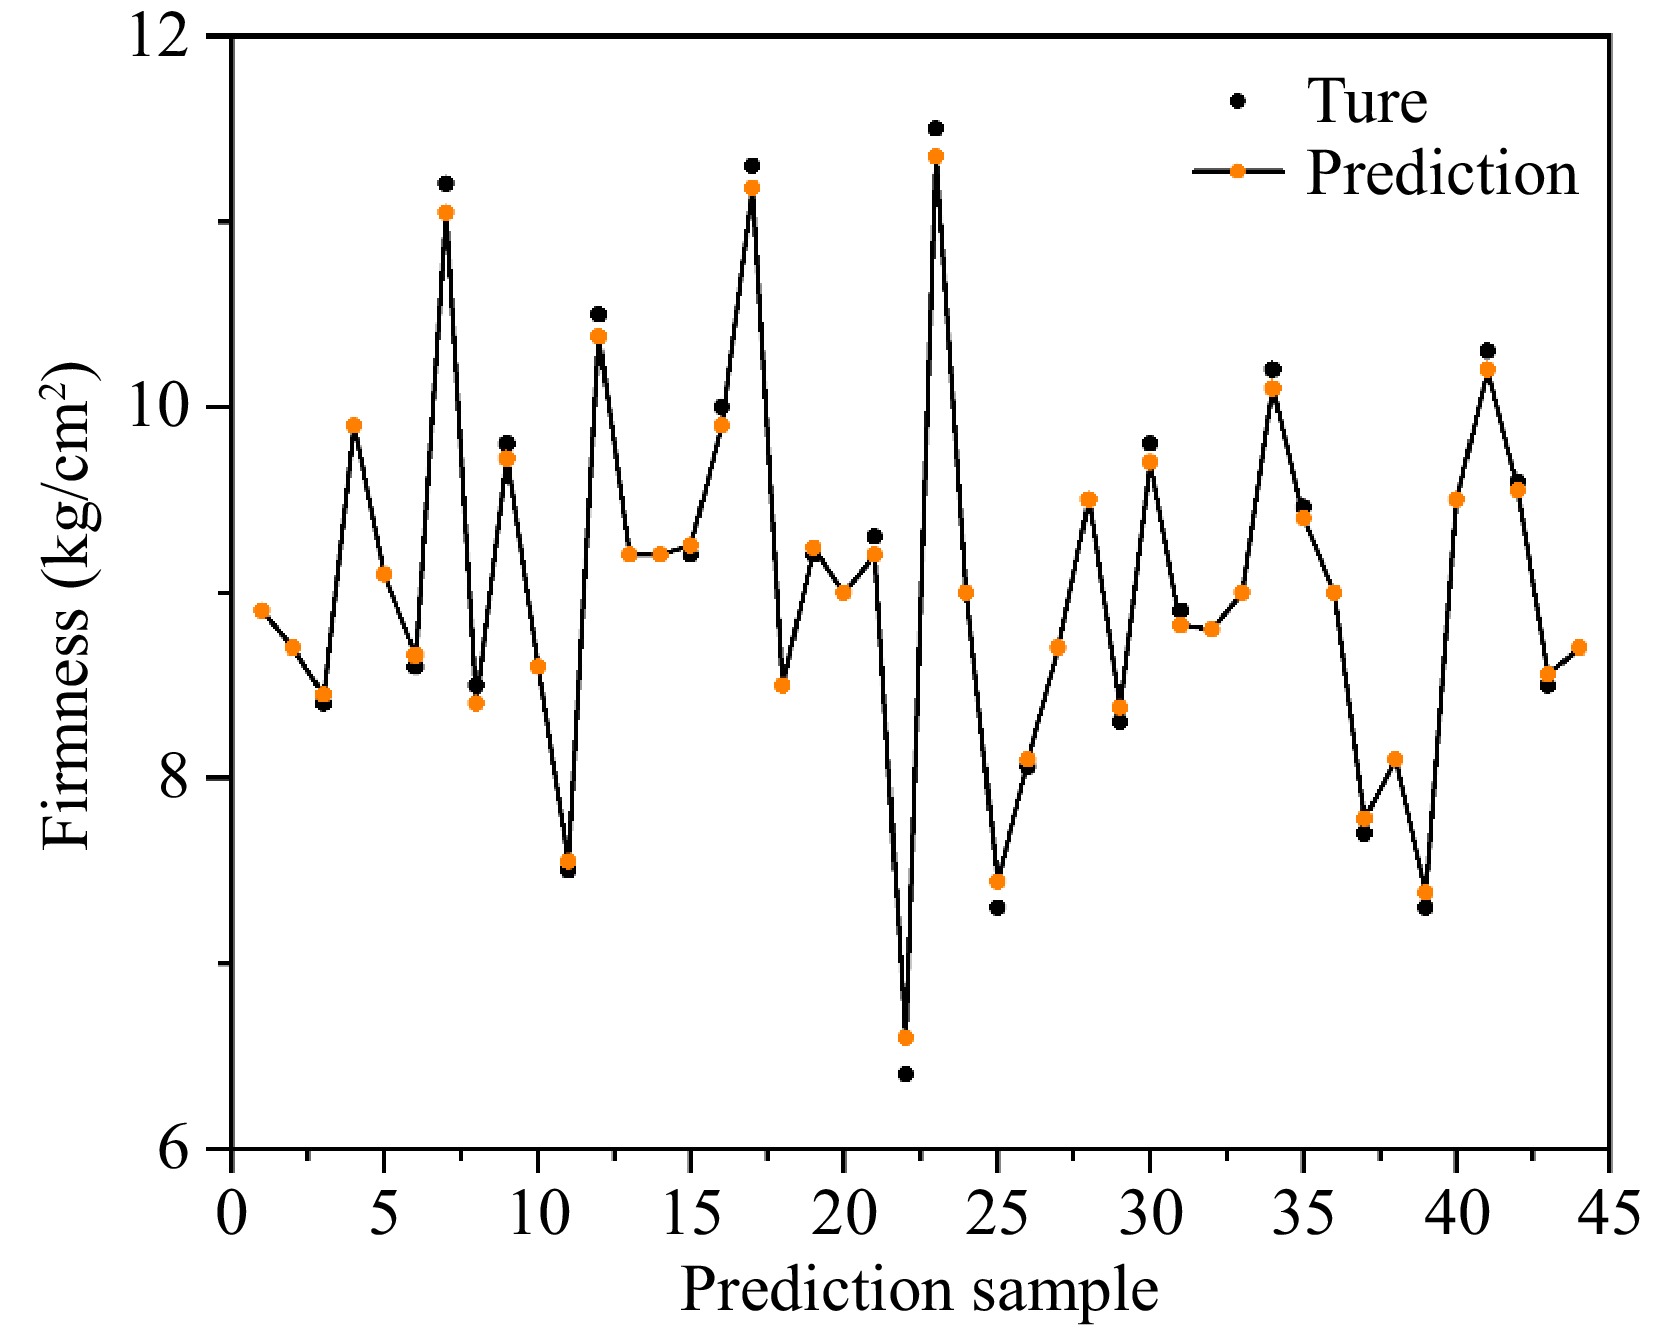
Figure 7.
Line plots of actual vs predicted firmness on the prediction set.
-
Method $ {R}_{c}^{2} $ RMSEC $ {R}_{p}^{2} $ RMSEP MMS 0.7247 0.8081 0.7130 0.8330 SS 0.7795 0.6855 0.7690 0.7336 CT 0.7758 0.6935 0.7780 0.7083 SNV 0.7750 0.6993 0.7861 0.6770 MA 0.7876 0.6481 0.6778 0.8902 SG 0.7913 0.6434 0.6680 0.9013 MSC 0.7862 0.6525 0.7925 0.6537 RW 0.7942 0.6357 0.7891 0.6613 Table 1.
Comparison of different processing methods in the calibration set and prediction set.
-
Model No. of wavelengths $ {R}_{c}^{2} $ RMSEC $ {R}_{p}^{2} $ RMSEP RW-PLS 462 0.7862 0.6505 0.7925 0.6537 CARS-PLS 13 0.8484 0.5965 0.8325 0.6257 RF-PLS 17 0.7666 0.6719 0.7480 0.7054 Table 2.
Comparison of different feature wavelengths in the calibration set and prediction set.
-
Model Input $ {R}_{c}^{2} $ RMSEC $ {R}_{p}^{2} $ RMSEP PLS CARS 0.8484 0.5965 0.8325 0.6257 MLR CARS 0.8843 0.4994 0.8718 0.5069 HTL CARS 0.9344 0.4487 0.9254 0.4691 BPNN CARS 0.9523 0.4184 0.9350 0.4654 Table 3.
Parameter evaluation of models and CARS feature wavelengths for firmness prediction.
Figures
(7)
Tables
(3)