-
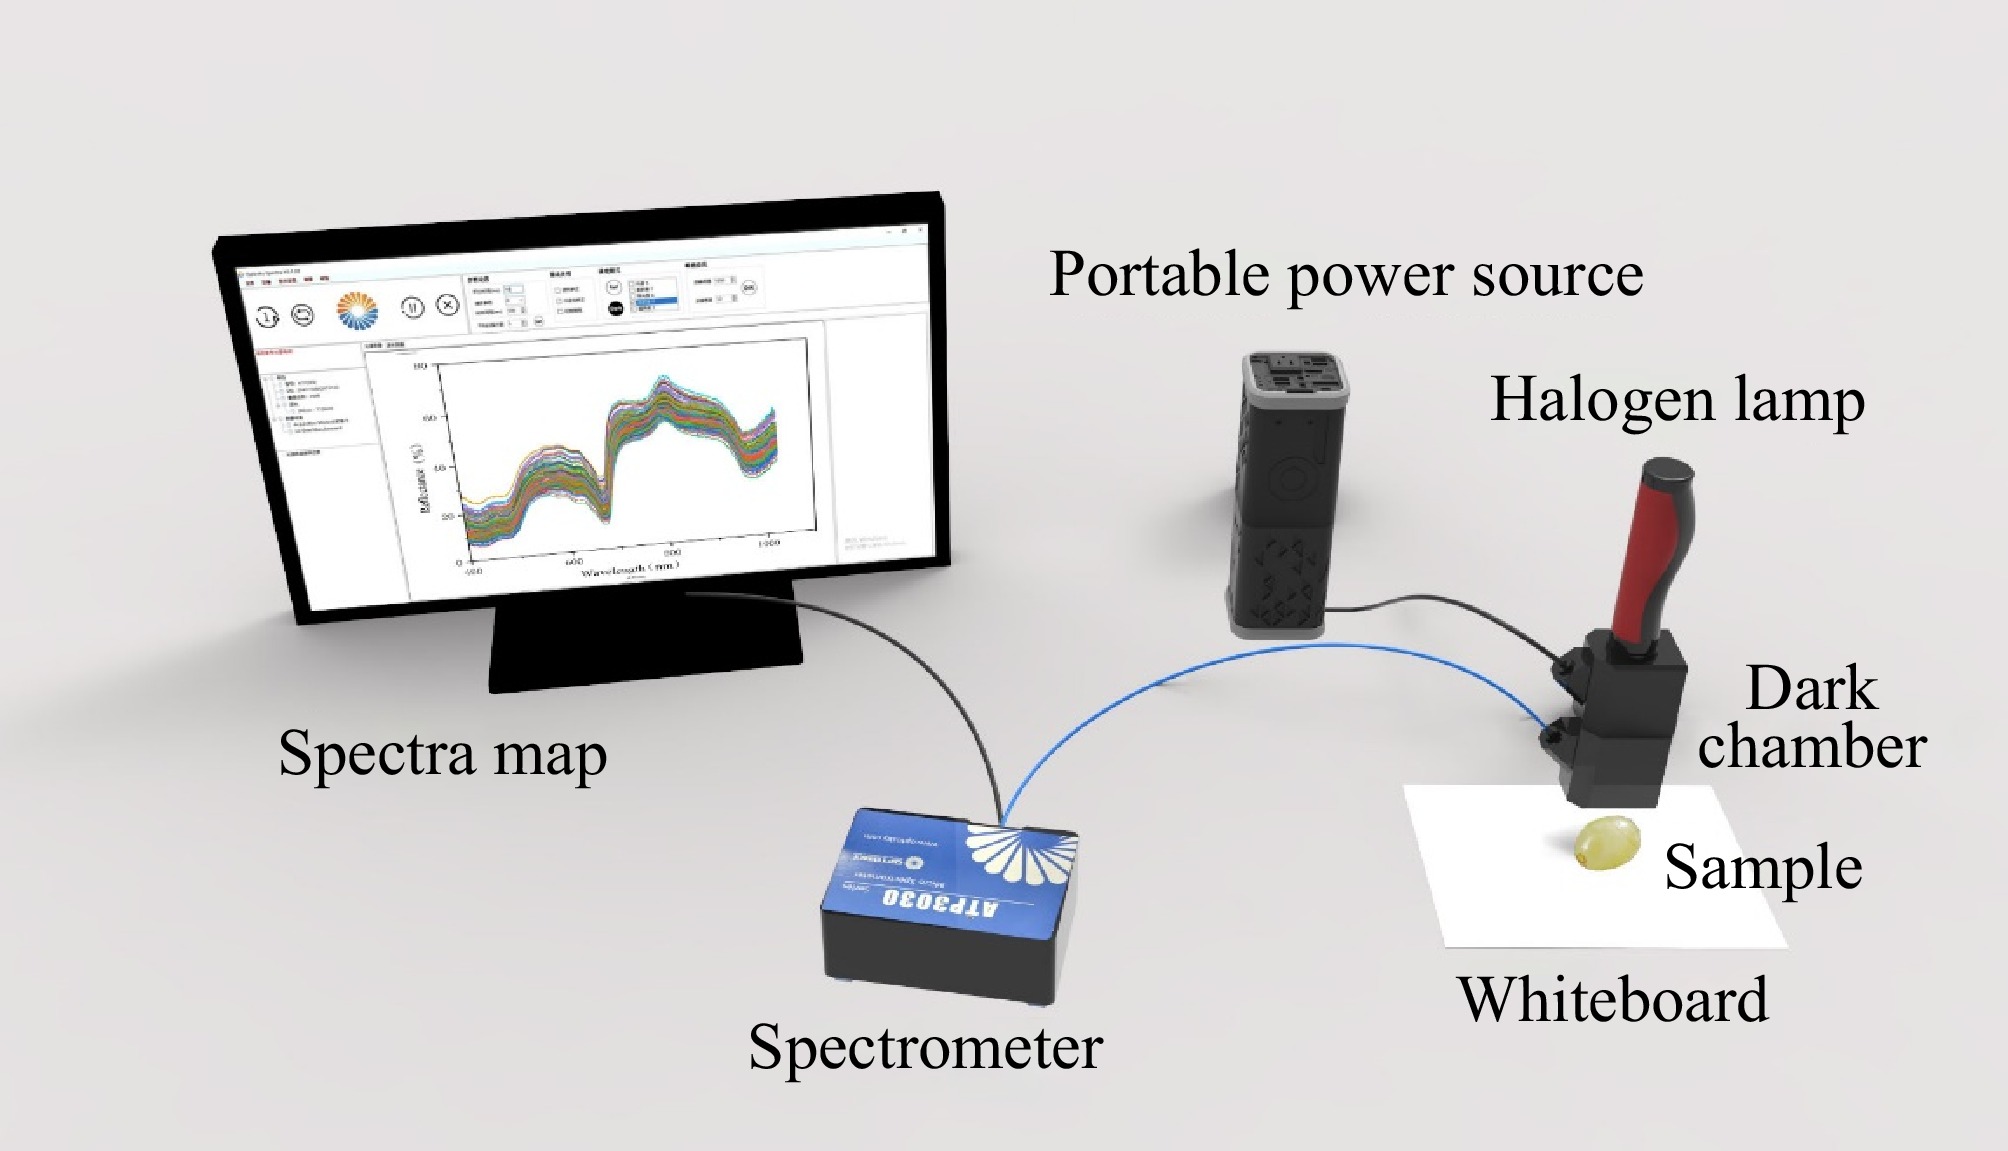
Figure 1.
Vis-NIR spectroscopy acquisition system.
-
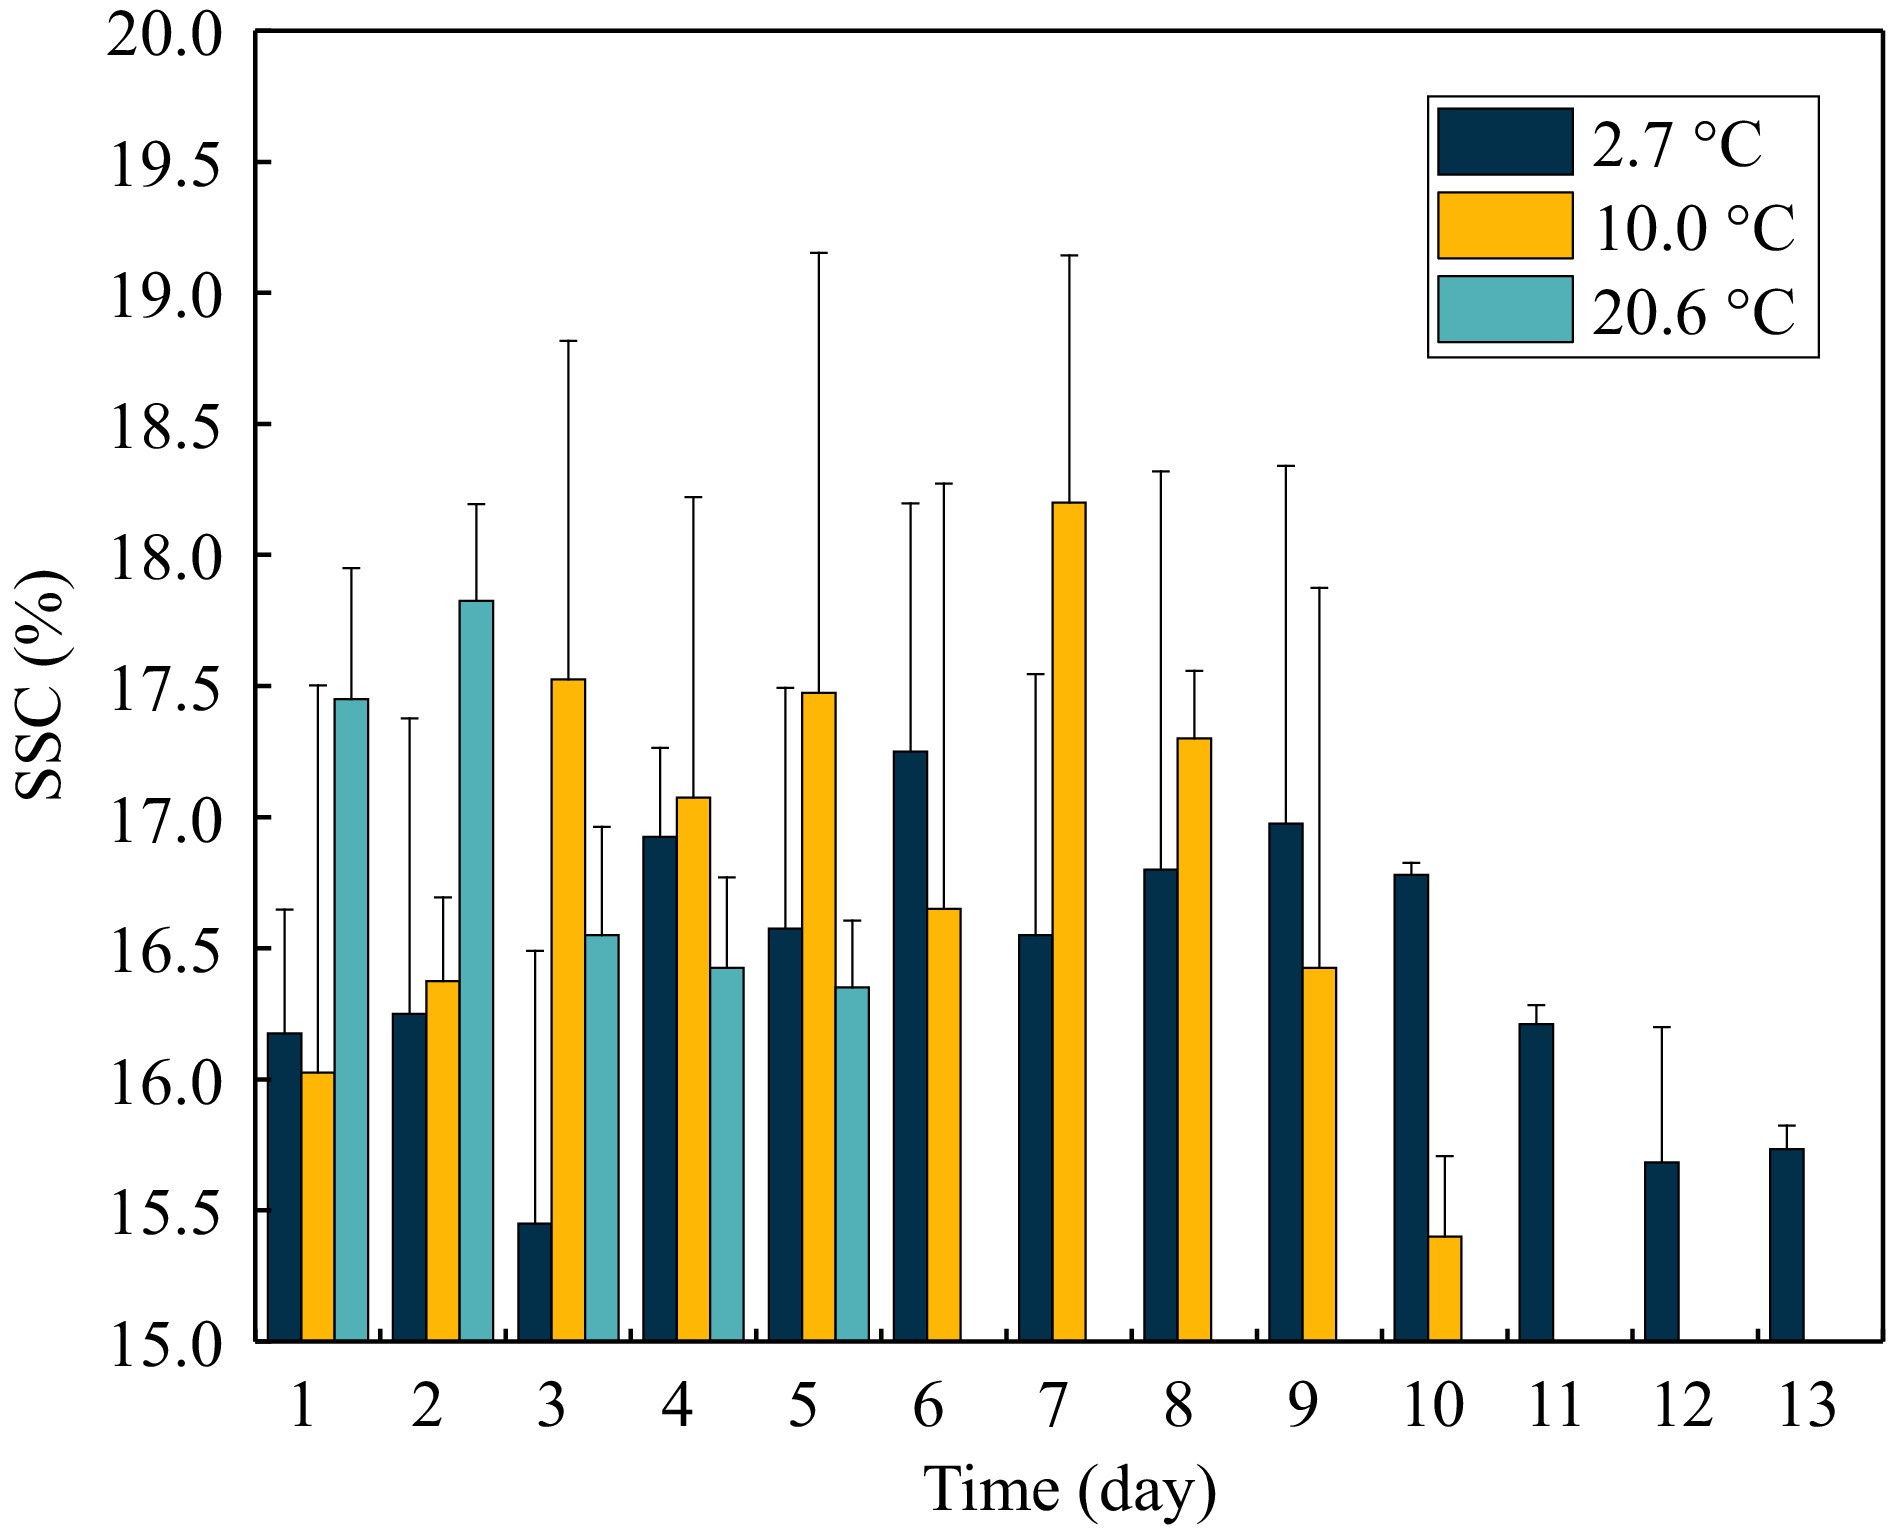
Figure 2.
Reference grape SSC tested on each day of the experiment.
-
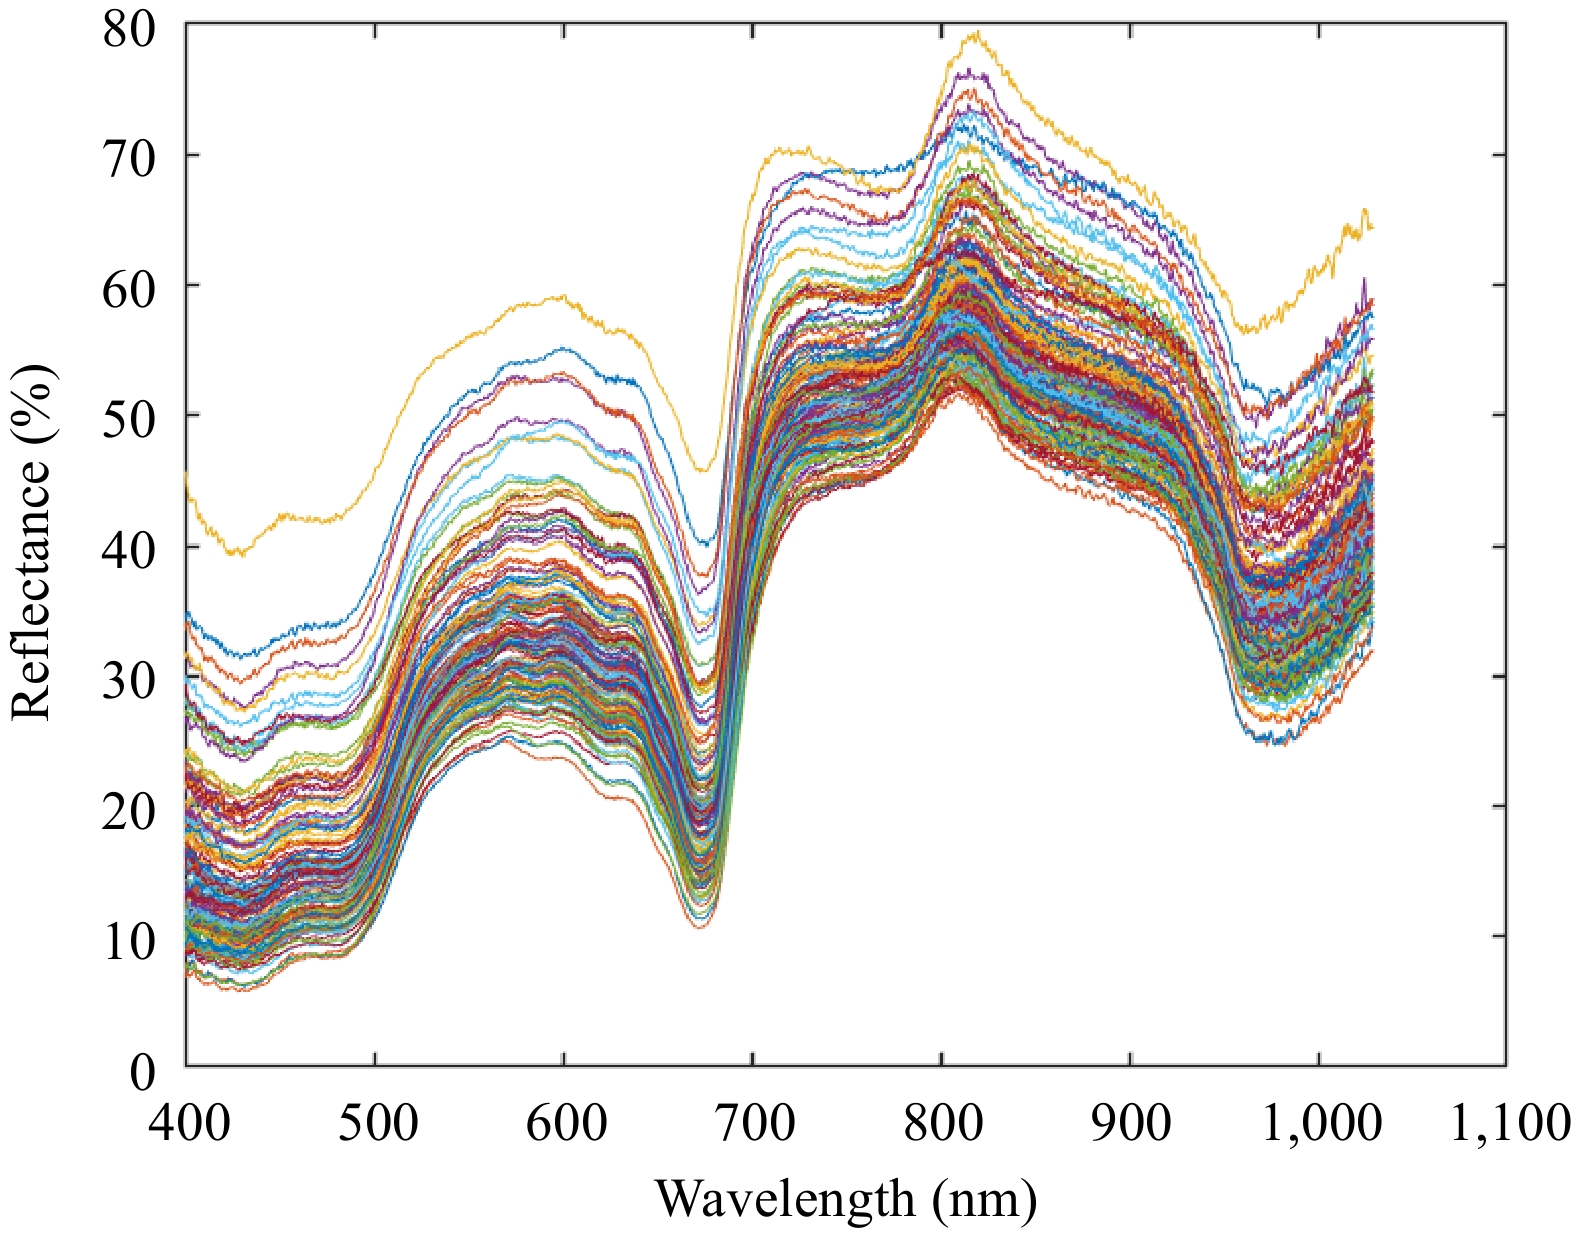
Figure 3.
Original spectral curves of grape SSC.
-
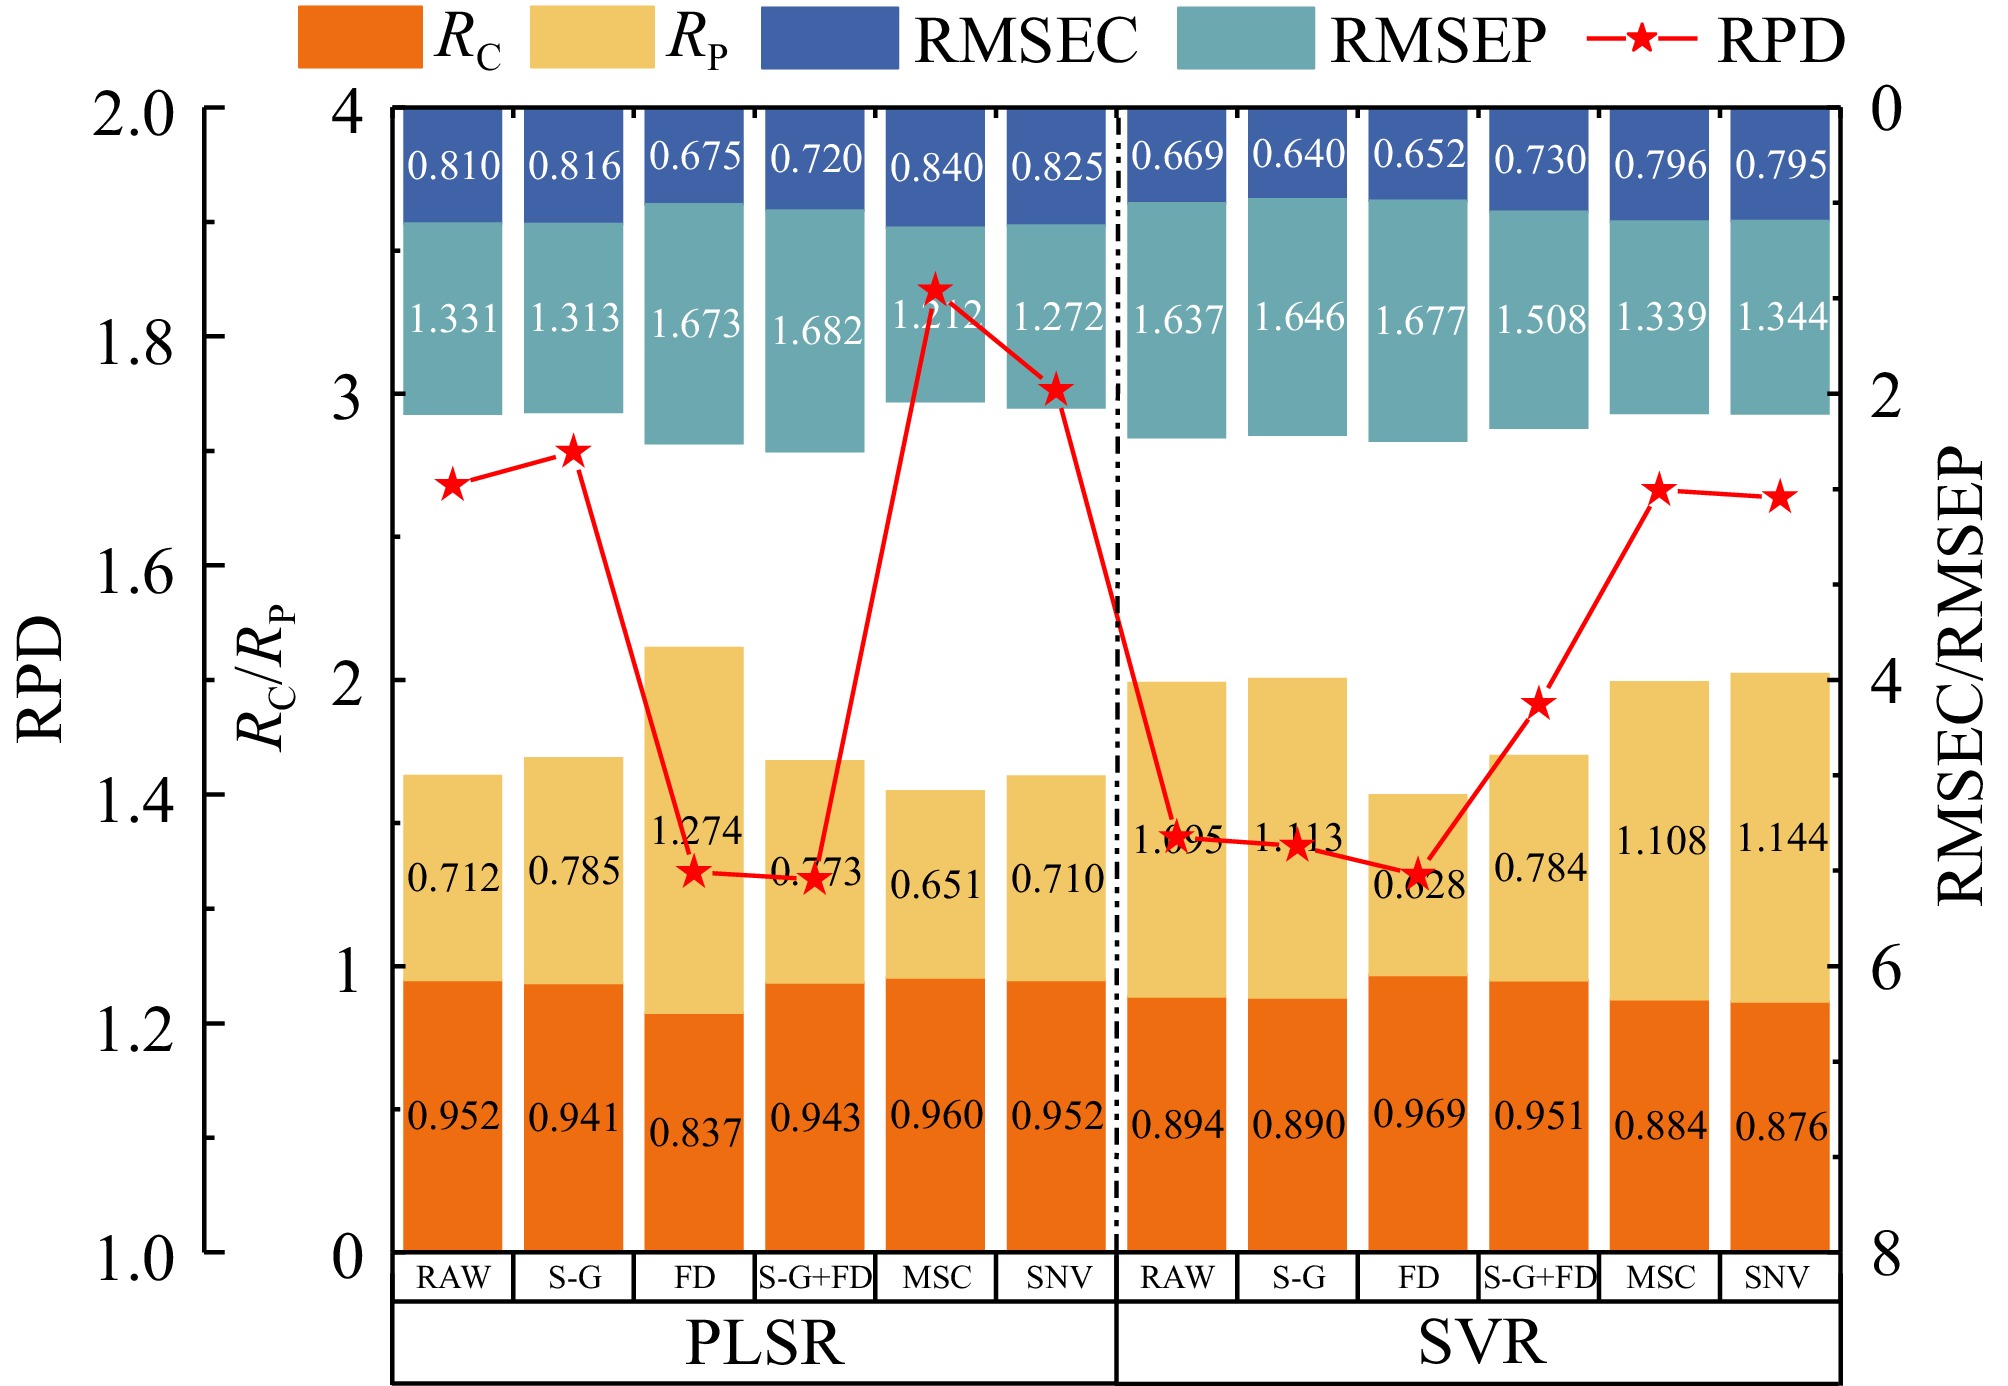
Figure 4.
Grape SSC prediction result based on the whole band spectrum.
-
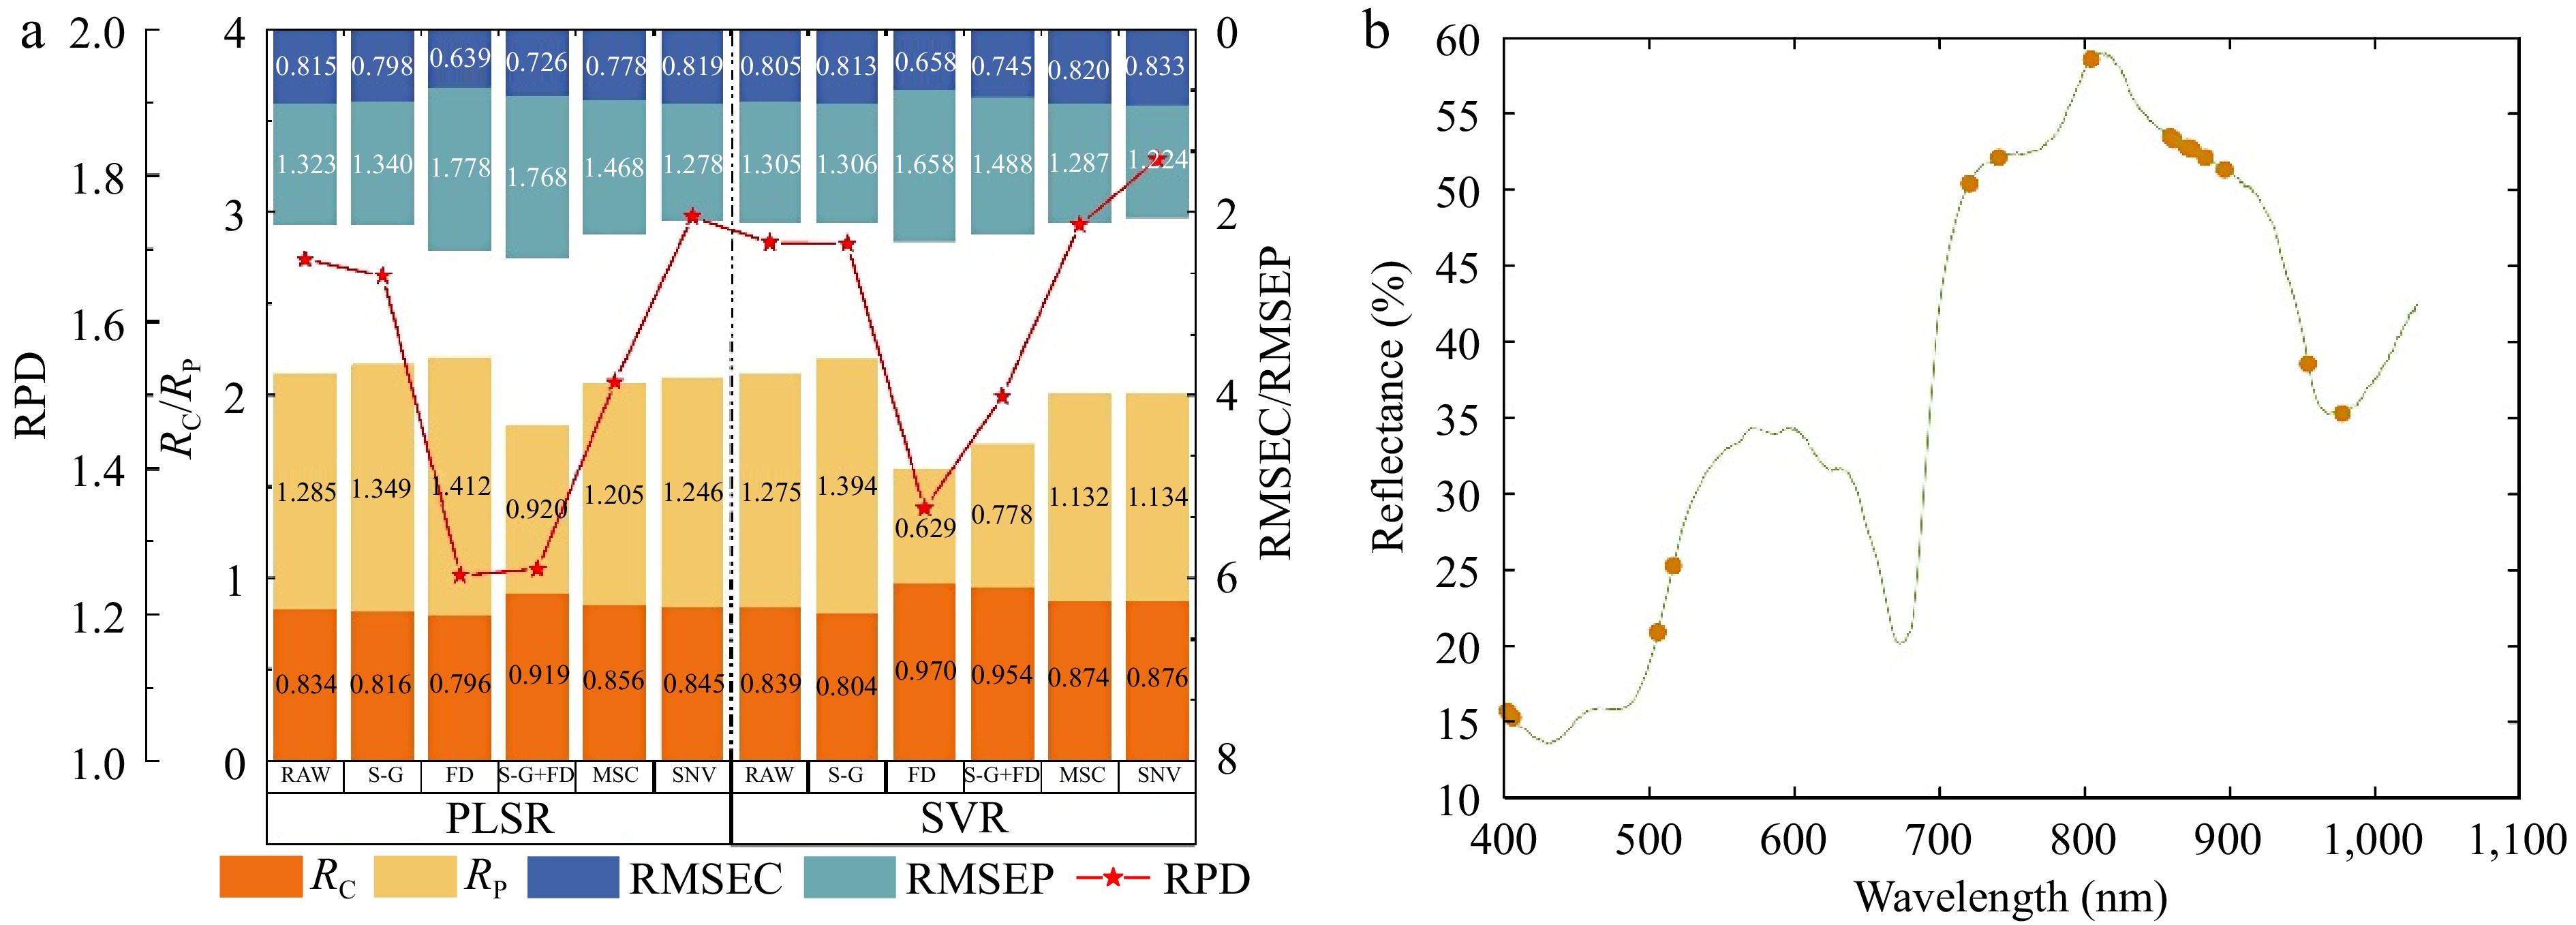
Figure 5.
The grape SSC prediction result based on the SPA screening characteristic variables. (a) Performance comparison of predicting model for SSC from the SPA selected variables data with different pre-processing methods. (b) The distribution of variables selected by SPA.
-
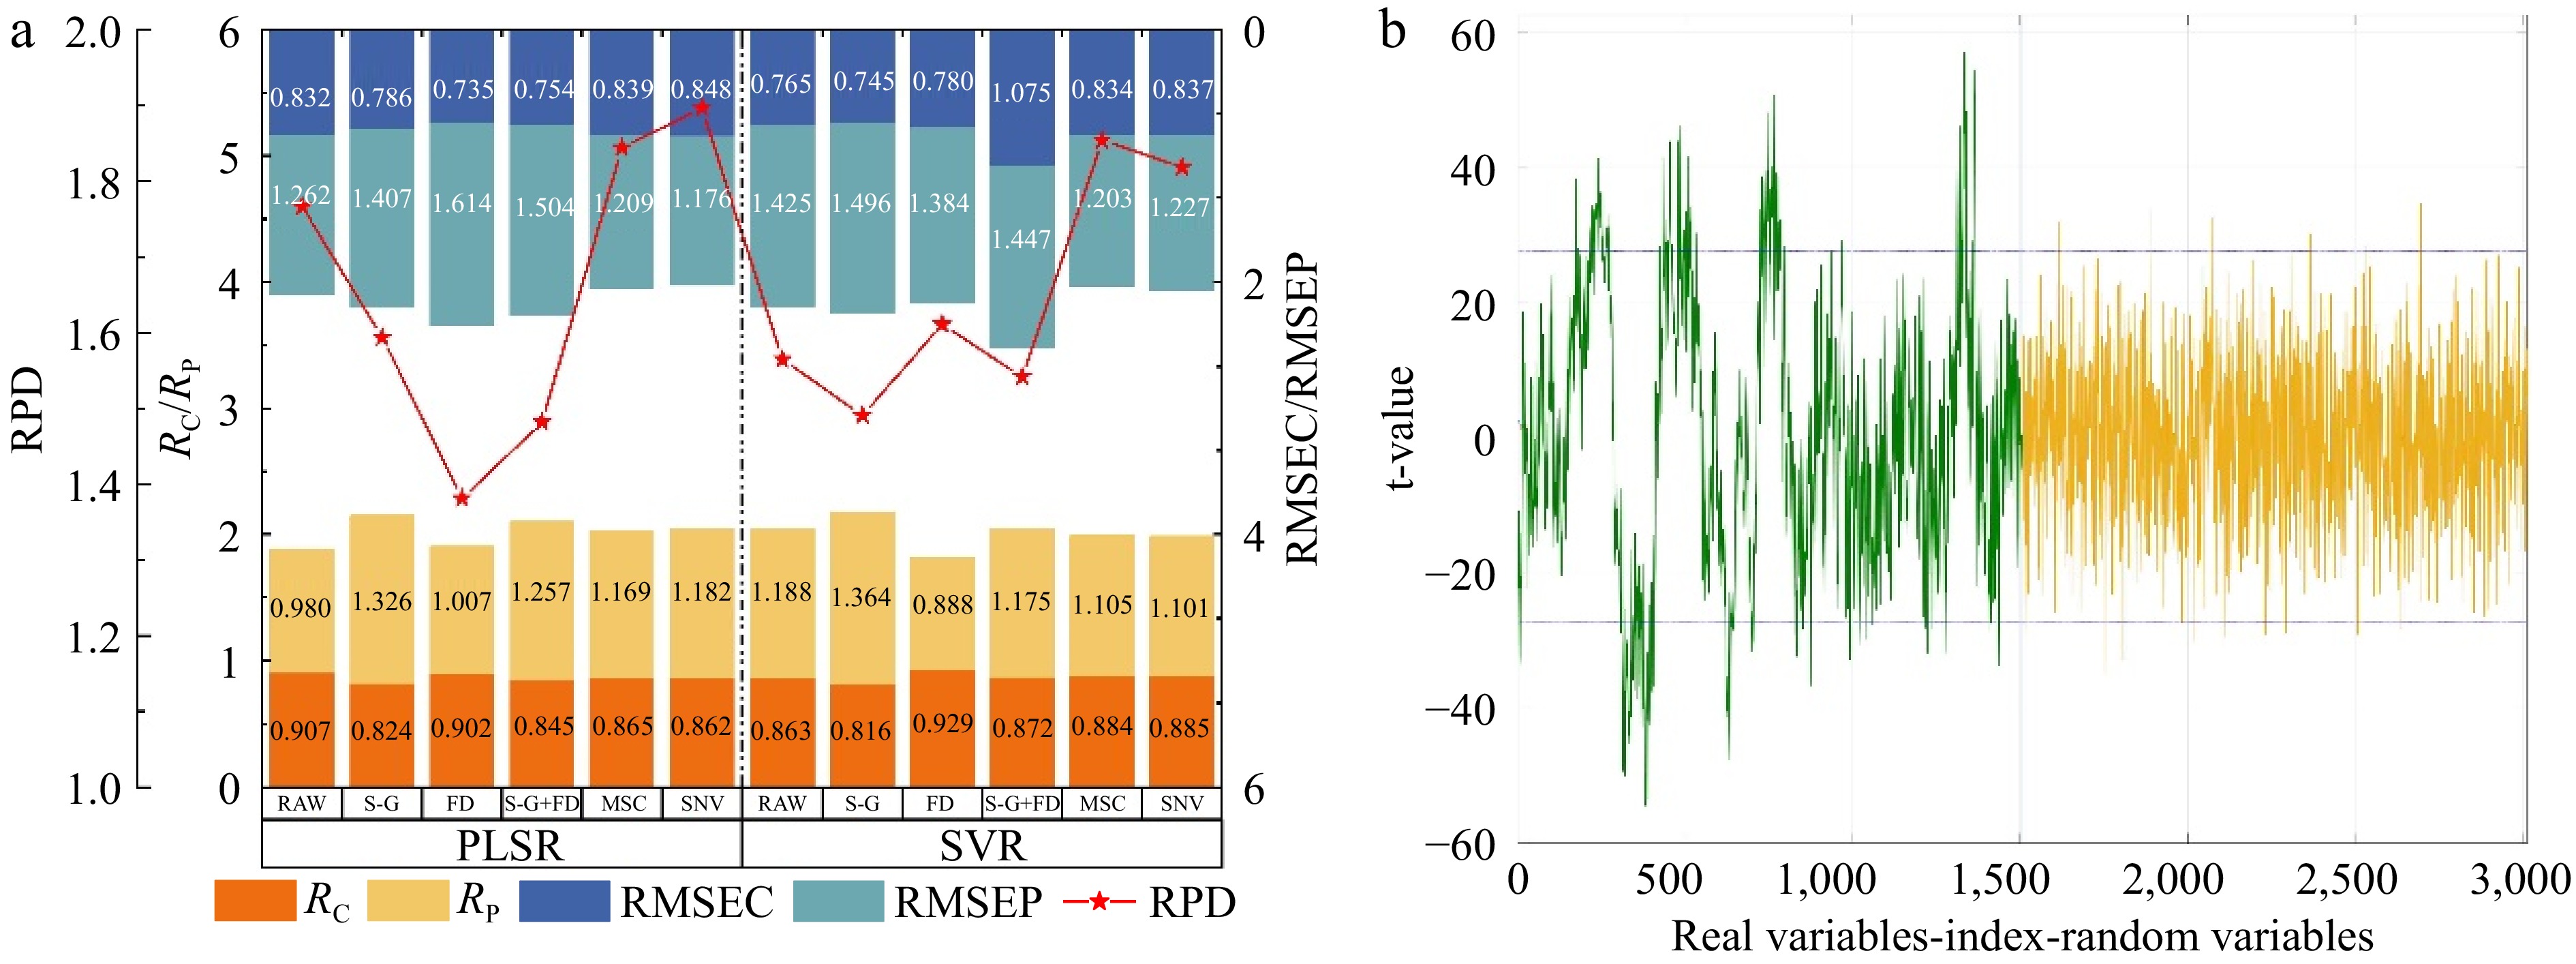
Figure 6.
The grape SSC prediction result based on the UVE screening characteristic variables. (a) Performance comparison of predicting model for SSC from the UVE selected variables data with different pre-processing methods. (b) The distribution of variables selected by UVE.
-
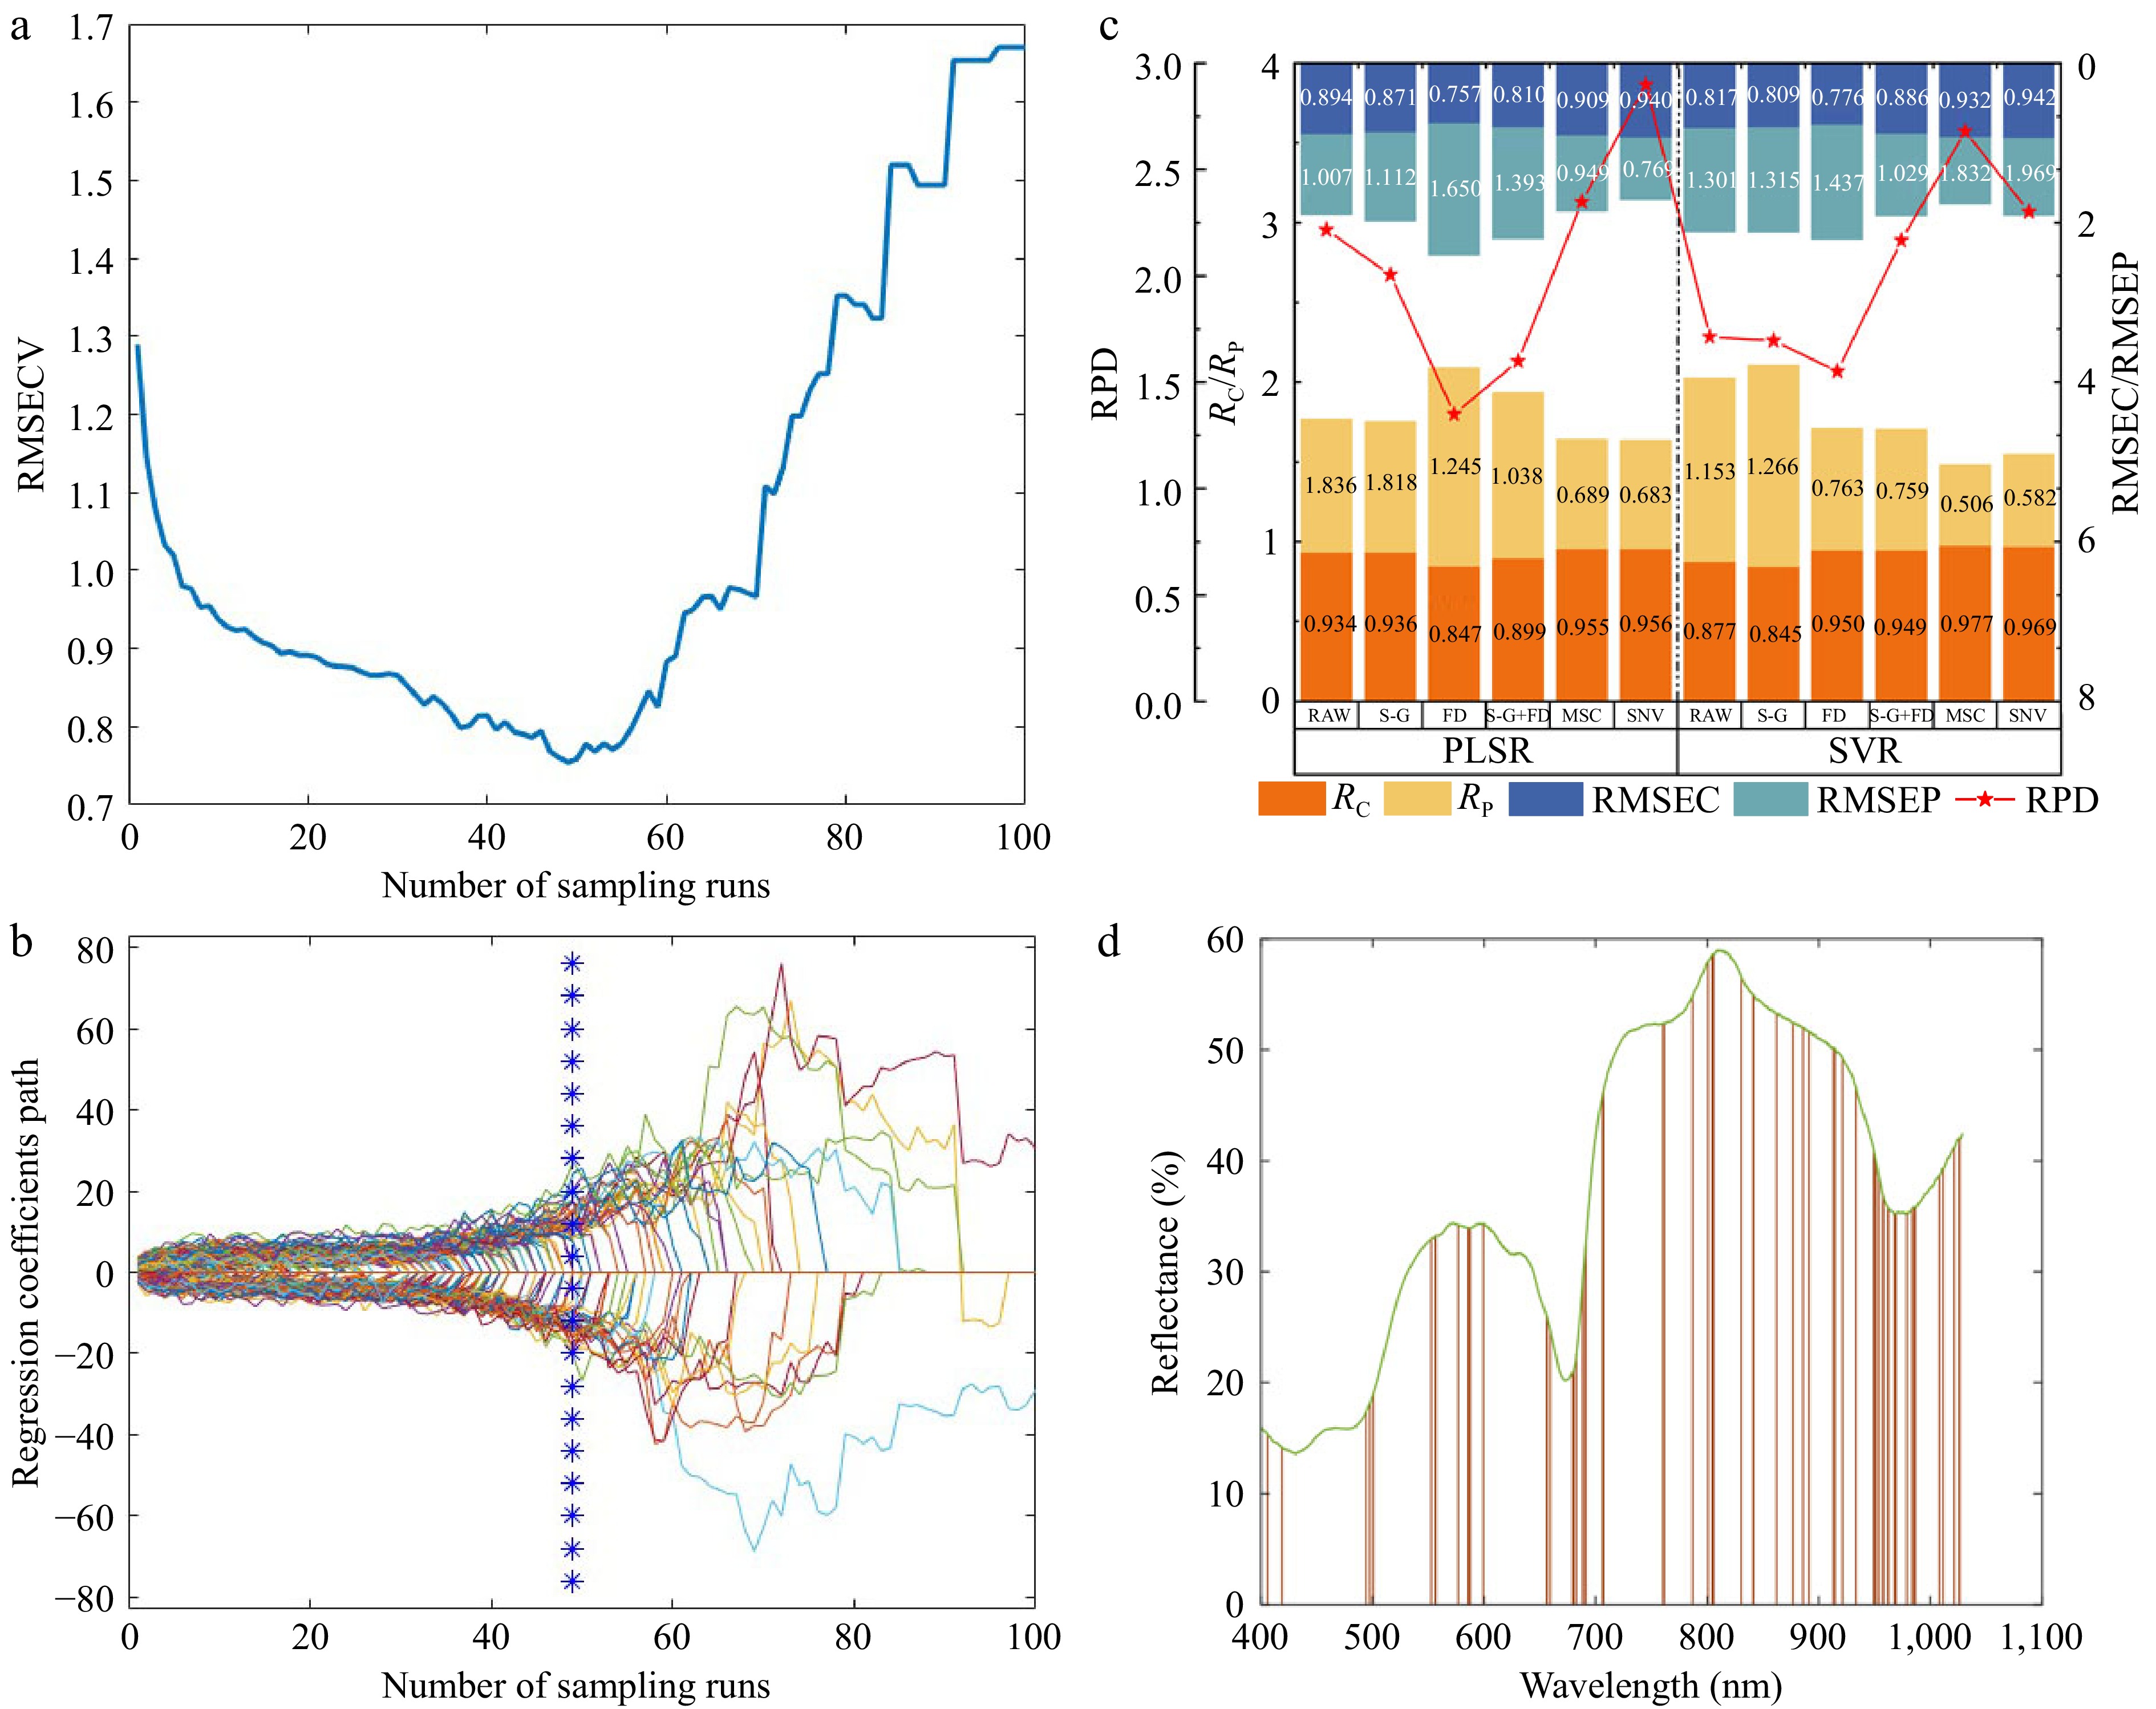
Figure 7.
The grape SSC prediction result based on the CARS screening characteristic variables. (a) The RMSECV variation during the CARS algorithm iteration process. (b) The regression coefficient path of each variable with an increase in the number of sampling runs. (c) The performance comparison of predicting model for SSC from the CARS selected variables data with different pre-processing methods.(d) The distribution of variables selected by CARS.
-
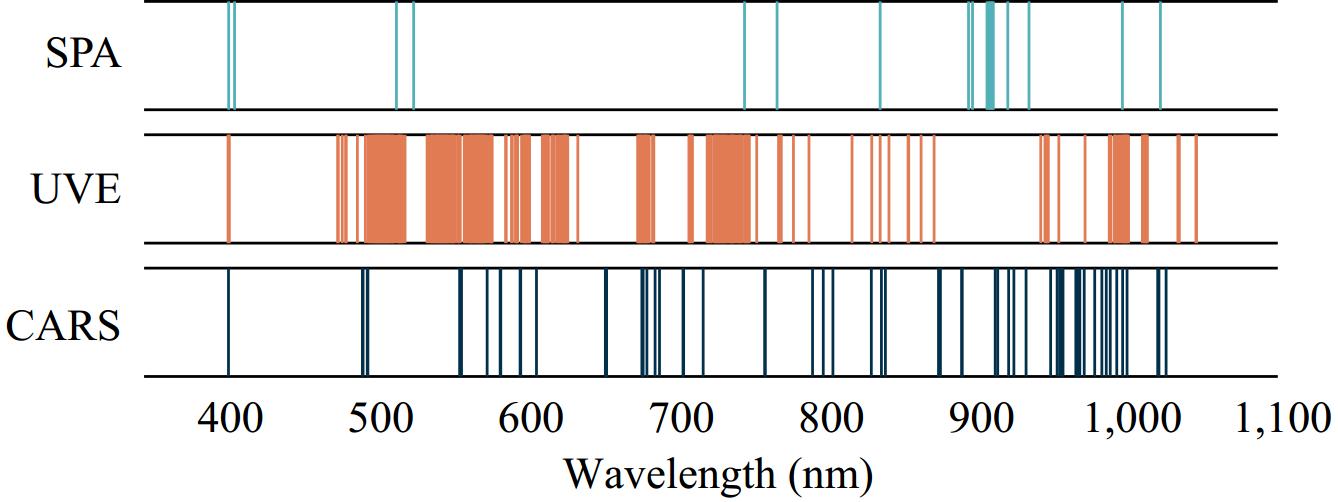
Figure 8.
Comparison of feature variables based on different selecting algorithms.
-
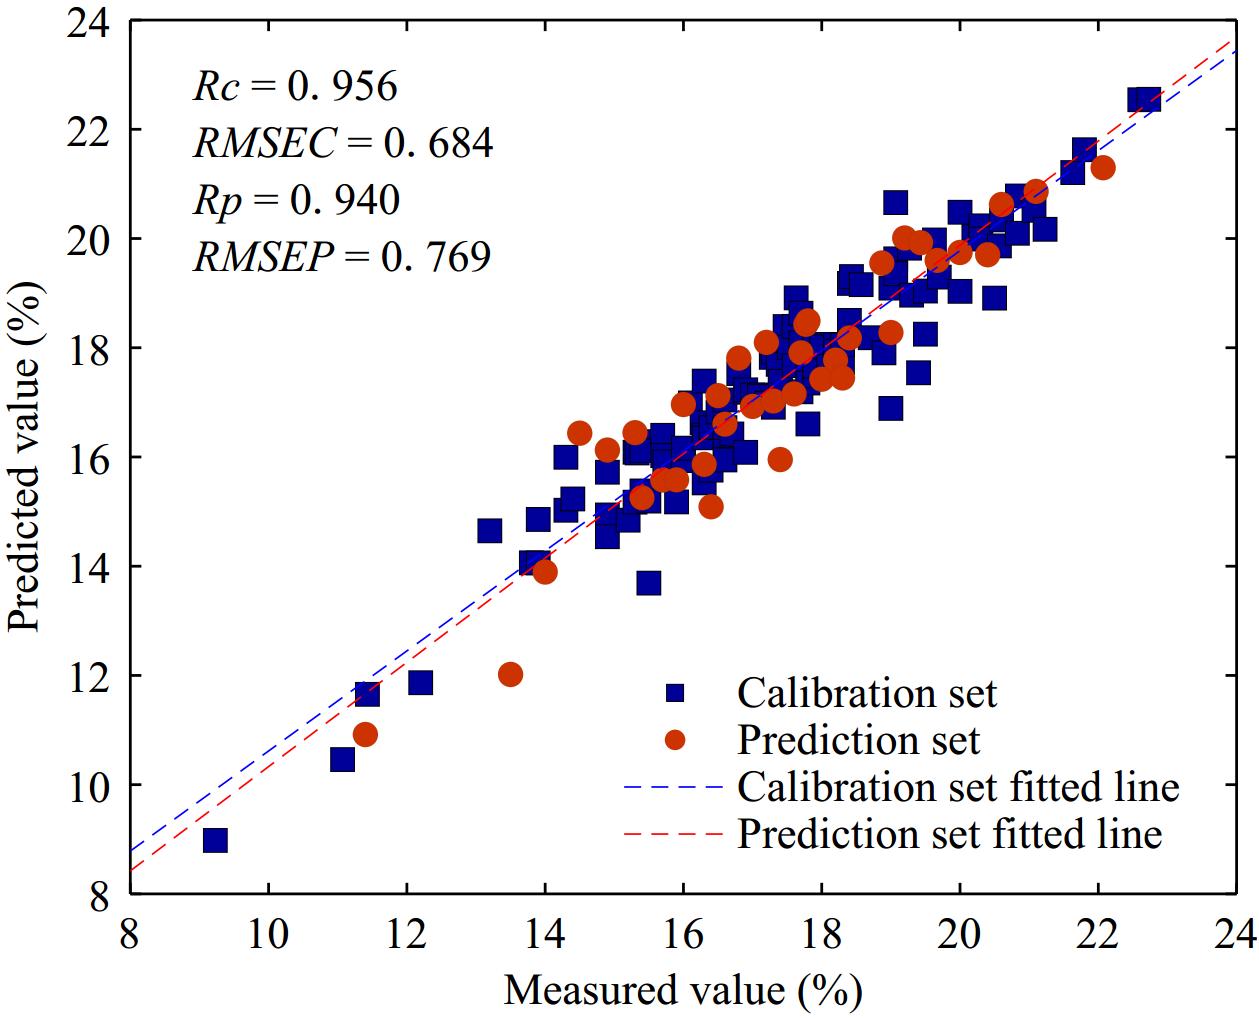
Figure 9.
Correlation between SSC measurement values and predicted values in the calibration set and prediction set.
-
Subsets Number of
sampleRange of SSC Mean Standard
deviationCalibration set 112 9.23%−22.73% 17.349% 2.342% Prediction set 37 11.4%−22.07% 17.357% 2.230% Total samples 149 9.23%−22.73% 17.351% 2.307% Table 1.
Reference measurement of grape SSC.
-
Pre-processing
methodsNo. of input
variablesModelling
methodsRc RMSEC Rp RMSEP RPD MSC 1507 PLSR 0.960 0.651 0.840 1.212 1.84 SNV 18 SPA + SVR 0.876 1.134 0.833 1.224 1.822 SNV 299 UVE + PLSR 0.862 1.182 0.848 1.176 1.897 SNV 61 CARS + PLSR 0.956 0.683 0.940 0.769 2.899 Table 2.
Performance comparison of optimal modelling results of the whole variables and selected variables.
Figures
(9)
Tables
(2)