


-
Grapes are a fruit with distinctive characteristics that make them valuable as food and for processing, occupying a prominent position in global fruit production. Renowned for their rich nutritional content, grapes contain polysaccharides, polyphenols, and flavonoids, which endow them with notable antioxidant and anti-ageing properties. These health-promoting attributes have increased grapes' popularity among consumers[1]. China is a major producer and consumer of grapes, with production increasing annually. Globally, China ranks as the second-largest grape producer and holds the leading position as the largest producer of table grapes. According to the relevant data, by 2021, the planting area of grapes in China accounted for 12.3% of the global total, and the total output was 14.44 million tons. China primarily produces grapes for human consumption and over 80% of the country's yearly harvest is designated for table grapes[2]. Forecasts suggest that as the grape industry continues to develop, table grape consumption in China will inevitably increase annually.
Grape quality is the main factor affecting consumers' willingness to buy and market price. High-quality grapes are more flavorful and offer more excellent nutritional benefits[3]. Grape quality includes appearance and internal physicochemical properties, with critical internal indicators including soluble solid content (SSC), total acid, pH, and total polysaccharide. Among these, SSC is a general term for organic compounds in fruits that can be dissolved in water, which mainly are soluble sugars. It is one of the critical factors affecting the quality and taste of grapes[4]. As such, accurately detecting SSC levels in grapes is of considerable importance. Traditionally, the grape SSC assessment is performed through physicochemical testing. Although these methods can provide accurate measurements, they have many problems and challenges in practical applications, including low efficiency, destructiveness, and inconsistent test results due to human factors[5]. Consequently, these approaches cannot satisfy the requirements of rapid, non-destructive, and automated detection for SSC detection at present.
Recently, with the rapid development of science and technology, non-contact measurement technologies such as visible near-infrared spectroscopy (Vis-NIR)[6], hyperspectral[7], electronic nose[8], and nuclear magnetic resonance[9] have been used to detect the SSC in fruits. The Vis-NIR spectroscopy technology has demonstrated significant potential and value in agricultural product testing due to its non-destructive, low-cost, and rapid[10]. The use of Vis-NIR spectroscopy technology to achieve non-destructive testing of internal quality indicators in fruits has become the focus of research. Researchers have applied the technique to research the quality detection of various fruits. The Vis-NIR spectroscopy technique has shown excellent performance in fruit quality detection for mandarin oranges[11], peaches[12], mangoes[13], and tomatoes[14].
A series of research results have demonstrated the effectiveness of spectral techniques for detecting grape quality, showing that spectral technology applies to a range of quality indicators, such as vitamin C (VC) content, peel anthocyanin levels, and other quality parameters. Costa et al. used Vis-NIR reflectance spectroscopy and various regression modelling algorithms to construct predictive models for SSC and anthocyanin content in Syrah and Cabernet Sauvignon. The results demonstrated that Vis-NIR reflectance spectroscopy is a powerful tool for non-destructive assessment of the quality attributes and ripening stage[15]. Xiao et al. employed partial least squares regression (PLSR) to predict grape quality parameters, including color space, SSC, and total phenols. The result revealed that Vis-NIR spectra were correlated with SSC and total phenols in intact grape berries, with prediction coefficients of determination exceeding 0.74[16]. Zhang et al. applied Vis-NIR spectroscopy to construct quality prediction models for wine grapes at different ripening stages, which were able to predict SSC accurately. In the dataset of grape berries, the correlation coefficient of the calibration and validation sets were above 0.93 and 0.86, respectively, indicating predictive performance. The research proved that Vis-NIR spectroscopy is suitable for the rapid and non-destructive detection of SSC in vineyard settings[17]. Liu et al. carried out a non-destructive testing study on total phenolics and tannins in grape skins and seeds using Vis-NIR spectroscopy coupled with stoichiometric methods and constructed a prediction model for these parameters. The model yielded prediction set correlation coefficients above 0.83, which demonstrated that the spectroscopy technique can be used to detect the content of total phenols and tannins in table grapes[18]. Furthermore, Liu et al introduced an aggregative quality indicator (AQI) to synthesize the evaluation of grape quality and used Vis-NIR spectroscopy combined with chemometric analysis to achieve an AQI prediction model[19].
Currently, researchers have demonstrated the feasibility of using visible near-infrared spectroscopy to detect the internal quality of grapes, and have been continuously optimizing the predictive model to enhance the accuracy and reliability. However, most existing studies mainly focus on the prediction of the internal quality of grapes during the ripening stage. There are relatively few investigations into the application of spectroscopy for quality assessment during grape storage. In this study, the Vis-NIR reflectance spectroscopy technique was employed to evaluate its ability to rapidly and quantitatively detect the SSC of table grapes throughout the storage period. The specific research content of this study includes the following four aspects: (1) a visible near-infrared spectroscopic detection system for SSC of table grapes during storage stage in the wavelength range of 400−1,100 nm was established; (2) the effects of different spectral pre-processing on the modelling results of the spectral prediction model for the SSC content of table grapes during the storage period were compared; (3) a step-by-step projection algorithm (SPA), an uninformed variable elimination Variable Algorithm (UVE) and Competitive Adaptation (CARS) to screen the near-infrared spectral detection feature wavelengths of SSC content of table grapes; (4) the partial least squares regression (PLSR) algorithm and the support vector machine (SVR) algorithm were used to develop a quantitative prediction model between the spectral data and the measured SSC content of table grapes and to analyze and compare the results of the different modelling approaches.
-
Grapes of the Seedless White cultivar were purchased from a local supermarket in Yangling, China. Upon arrival at the laboratory, the grape berries were carefully separated using fruit shears to avoid damaging the grape, while retaining a small section of the stalk to minimize water loss. According to size, colour, and shape without deterioration or mechanical damage, and stored at three different temperatures 2.7, 10, and 20.6 °C for up to 13 d. During the experiment, 20 grapes were grouped for spectrum collection and SSC analysis, with 5~6 groups tested daily for each temperature. During the testing period, a total of 149 valid group samples with varying SSC levels were acquired.
Vis-NIR spectroscopy detection system and spectral data acquisition
-
The reflectance spectral data of grape samples were obtained using a portable Vis-NIR spectrum system. The system included a high-resolution micro-spectrometer (ATP3030, Op-tosky Photonics Inc., Xiamen, China), a bulb light source (HL2000), a dark chamber, and a computer running Optosky Spectra software. The structure of the Vis-NIR spectroscopy acquisition system is illustrated in Fig. 1. The acquisition wavelength range of the Vis-NIR spectrometer was from 200 to 1,100 nm with an approximate sampling interval of 0.05 nm. Before spectral data acquisition, the spectral acquisition system should be preheated for 30 min by activating the bulb light source, and spectral data collection should begin only once the light source is stable. The environmental influence was minimized by using a standard whiteboard (Guangzhou Jingyi Optoelectronic Technology Inc., Xiamen, China) as a white reference and a dark chamber as a black reference. Each sample within a group was measured five times from both grape sides (the sunny and shady sides), and the average spectral data across all measurements was used as the final spectral data for each group. To mitigate the effects of signal noise at the edges of the spectral range, the instrument's spectral range was limited deliberately to wavelengths between 400 and 1,100 nm for subsequent analysis[20].
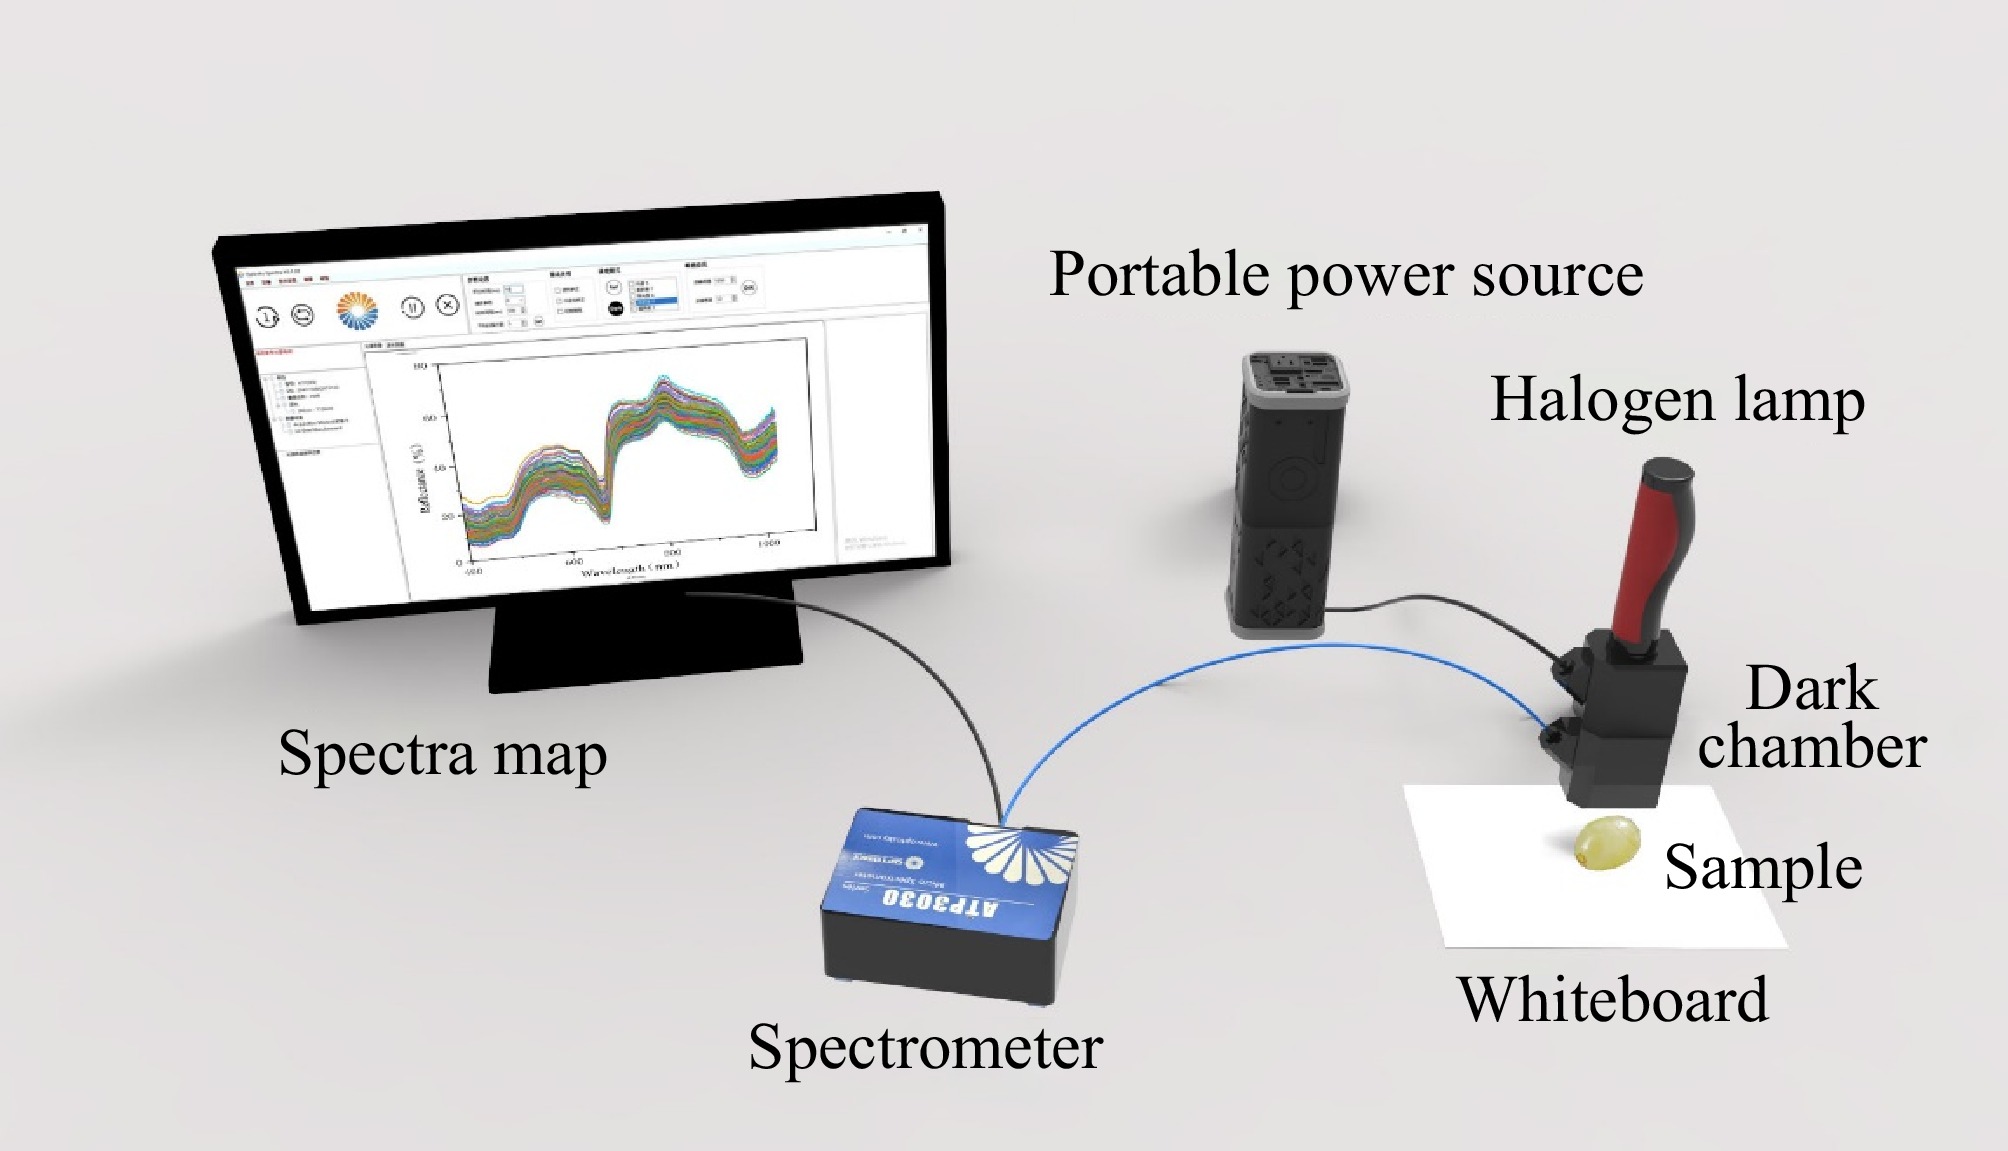
Figure 1.
Vis-NIR spectroscopy acquisition system.
Determination of SSC
-
To obtain more accurate data, SSC measurements were conducted immediately following the spectral acquisition. The grapes were manually pressed into juice and filtered, after which the grape juice was dispensed onto a digital refractometer (PR-101a, ATAGO, Japan) using a rubber-tipped burette. Three measurements were taken for each sample juice and the average of the three measurements was taken as the actual SSC value for that sample[21].
Chemometrics and statistical analysis
Spectral data pre-process
-
The collected spectrum was affected by various factors such as external environment, noise, and baseline drift, which resulted in the original spectral information containing extraneous data and adversely affecting the stability and accuracy of the model. To eliminate useless details and improve the model's accuracy and strength, it is necessary to preprocess the original spectrum. In this study, first derivative (FD), Savitzky-Golay convolutional smoothing (S-G), multivariate scatter correction (MSC), and standard normal variables transformation (SNV) were adopted to process the spectrum. The FD method could enhance the resolution of spectral signals and facilitate the separation of overlapping peaks. Meanwhile, Savitzky-Golay (S-G) smoothing serves to attenuate high-frequency noise within spectral profiles, with a five-point smoothing window applied in the present study. MSC and SNV methods allow the spectrum to be appropriately corrected and normalized, thereby reducing the influence of various factors and increasing the reliability of subsequent data modelling[22].
Selection of characteristic wavelengths
-
The Vis-NIR spectrum is rich in molecular vibrational absorption information, however, there is a significant amount of redundant information in the raw spectral data that needs to be more relevant to SSC detection. The spectrum data corresponding to the wavelengths of the NIR spectra are used as input variables for the model. These input variables contain information regarding the composition of all components in the sample. For spectral detection of SSC, there are a large number of wavelengths in the NIR spectrum that are independent of SSC detection. Therefore, selecting a limited number of essential wavelengths related to the response information can significantly reduce the number of input variables. These important wavelengths are identified as feature variables through a mathematical algorithm. To determine the most suitable characteristic wavelength, the successive projections algorithm(SPA), uninformative variable elimination(UVE), and competitive adaptive reweighted sampling(CARS) were employed in this paper.
The SPA is a forward feature variable selection method. The fundamental principle of SPA entails selecting a specific wavelength, subsequently calculating the projection of this wavelength onto other wavelengths in each iteration, and ultimately identifying the wavelength exhibiting the maximum projection as the feature variable. The feature wavelength selected by SPA represents the minimum collinear variable combination, which contains the least redundant information[23]. The UVE algorithm is a feature selection technique predicted on a noise model. It integrates a noise matrix with spectral data and a physical and chemical value matrix, subsequently calculating a threshold for discerning noise information. The spectral variables are categorized into valid variables and invalid variables based on the threshold, and only characteristic wavelengths with a high correlation with the target component are retained. This algorithm can avoid the interference of invalid variables in the model and enhance the stability and predictive performance of the model[24]. The CARS algorithm is a wavelength selection algorithm that combines the Monte Carlo sampling technique with the regression coefficient of the PLS model. Specifically, the CARS algorithm uses an adaptive weighting method to select data points with elevated absolute weight values of the regression coefficients in the PLS model during each iteration to construct a new data subset, while eliminating those points with lower weights. Subsequently, based on this new subset, the PLS model is reconstructed and subjected to multiple rounds of calculation and verification. Ultimately, the wavelength in the subset with the minimal root mean square error (RMSECV) of the PLS model in the interactive verification is selected as the characteristic wavelength. This method effectively improves both the precision and efficiency of feature extraction[25].
Build of the spectral prediction model
-
According to the Lambert-Beer law, the amplitude of the spectral curve peak is linearly related to the content of the measured component. The characteristics of the spectral curve exhibit variability corresponding to differing levels of SSC in grapes. Partial least square regression (PLSR) is the most widely used multivariate linear regression method in Vis-NIR spectroscopy analysis. This method decomposes the spectral matrix X and the concentration matrix Y, while simultaneously considering the relationship between the two matrices and reinforcing the corresponding computational relationship to obtain the optimum calibration mode. When using PLSR to establish a model, it is imperative to select the optimal number of latent variables (LVs) involved in the modelling to mitigate the risks of underfitting or overfitting. The number of LVs is a critical parameter for establishing a robust PLSR model[26]. This study determined the optimal number of LVs based on the minimum value of the root mean square error of cross-validation (RMSECV) of the calibration set samples in 10-fold cross-validation. Nonetheless, recent studies have indicated that there may be a more complex nonlinear relationship between some components and spectral information. Therefore, the support vector regression (SVR), as a classic nonlinear regression algorithm, was adopted in this study for comparison. The principle of SVR is to transform the input variables into high dimensional space through nonlinearity mapping and construct the optimal hyperplane in the high dimensional space to minimize the distance from all sample points to the plane[27]. In this investigation, the model development was performed using Matlab R2019b to ensure computational rigor and reliability in the analysis.
Evaluation of the indicators
-
To comprehensively evaluate the prediction performance of the model, the calibration set correlation coefficient (Rc), the root mean square error of calibration set (RMSEC), as well as the prediction set correlation coefficient (Rp), the root mean square error of prediction set (RMSEP) are used to evaluate the model comprehensively. To mitigate the risk of overfitting or underfitting, the values of Rc and Rp, RMSEC, and RMSEP are required to be closely aligned. In addition, the relative analytical error (RPD) serves as an indicator of the model's predictive capability. For RPD, when it is less than 1.5, it indicates that the model possesses inadequate predictive ability; conversely, when the value exceeds 1.5, it means that the model has a prediction effect. Notably, when the value exceeds 2, the prediction ability is markedly enhanced[28]. The calculation methods of these evaluation indexes are shown in Eqns (1)−(3).
$ {Rc}/{Rp} = \sqrt {1 - \dfrac{{\displaystyle\mathop \sum \nolimits_{i = 1}^n {{\left( {{y_i} - {{\hat y}_i}} \right)}^2}}}{{\displaystyle\mathop \sum \nolimits_{i = 1}^n {{\left( {{y_i} - \bar y} \right)}^2}}}} $ (1) $ RMSEC/RMSEP = \sqrt {\dfrac{{\displaystyle\mathop \sum \nolimits_{i = 1}^n {{\left[ {f\left( {{x_i}} \right) - {{\hat y}_i}} \right]}^2}}}{n}} $ (2) $ RPD = \dfrac{{\sqrt {\dfrac{1}{n}\displaystyle\mathop \sum \nolimits_{i = 1}^n {{\left( {{y_i} - \dfrac{1}{n}\displaystyle\mathop \sum \nolimits_{i = 1}^n {y_i}} \right)}^2}} }}{{\sqrt {\dfrac{1}{n}\displaystyle\mathop \sum \nolimits_{i = 1}^n {{\left( {{y_i} - {{\hat y}_i}} \right)}^2}} }} $ (3) -
Figure 2 presented the temporal variation in soluble solid content (SSC) of seedless white grapes across different storage temperatures. During storage, the SSC levels of grapes initially exhibited an increase followed by a subsequent decline[29]. This pattern arises due to an early ripening phase, during which SSC levels rise. As storage duration extends, organic acids within the grapes undergo metabolic conversion, resulting in a gradual reduction in SSC. Grapes stored at 20.6 °C exhibited noticeable deterioration after 5 d, while those at 10.0 °C showed similar deterioration beginning after 10 d. By contrast, grapes maintained at 2.7 °C demonstrated minimal signs of deterioration over the entire experimental period. In low-temperature environments, the respiratory and metabolic activities of Seedless White grapes are markedly diminished, resulting in a relatively more minor variation in SSC compared to the 10.0 °C condition, thus extending the storage duration of the grapes. In contrast, at 10.0 °C, the enhanced respiration and metabolic processes lead to a more rapid decline in SSC.
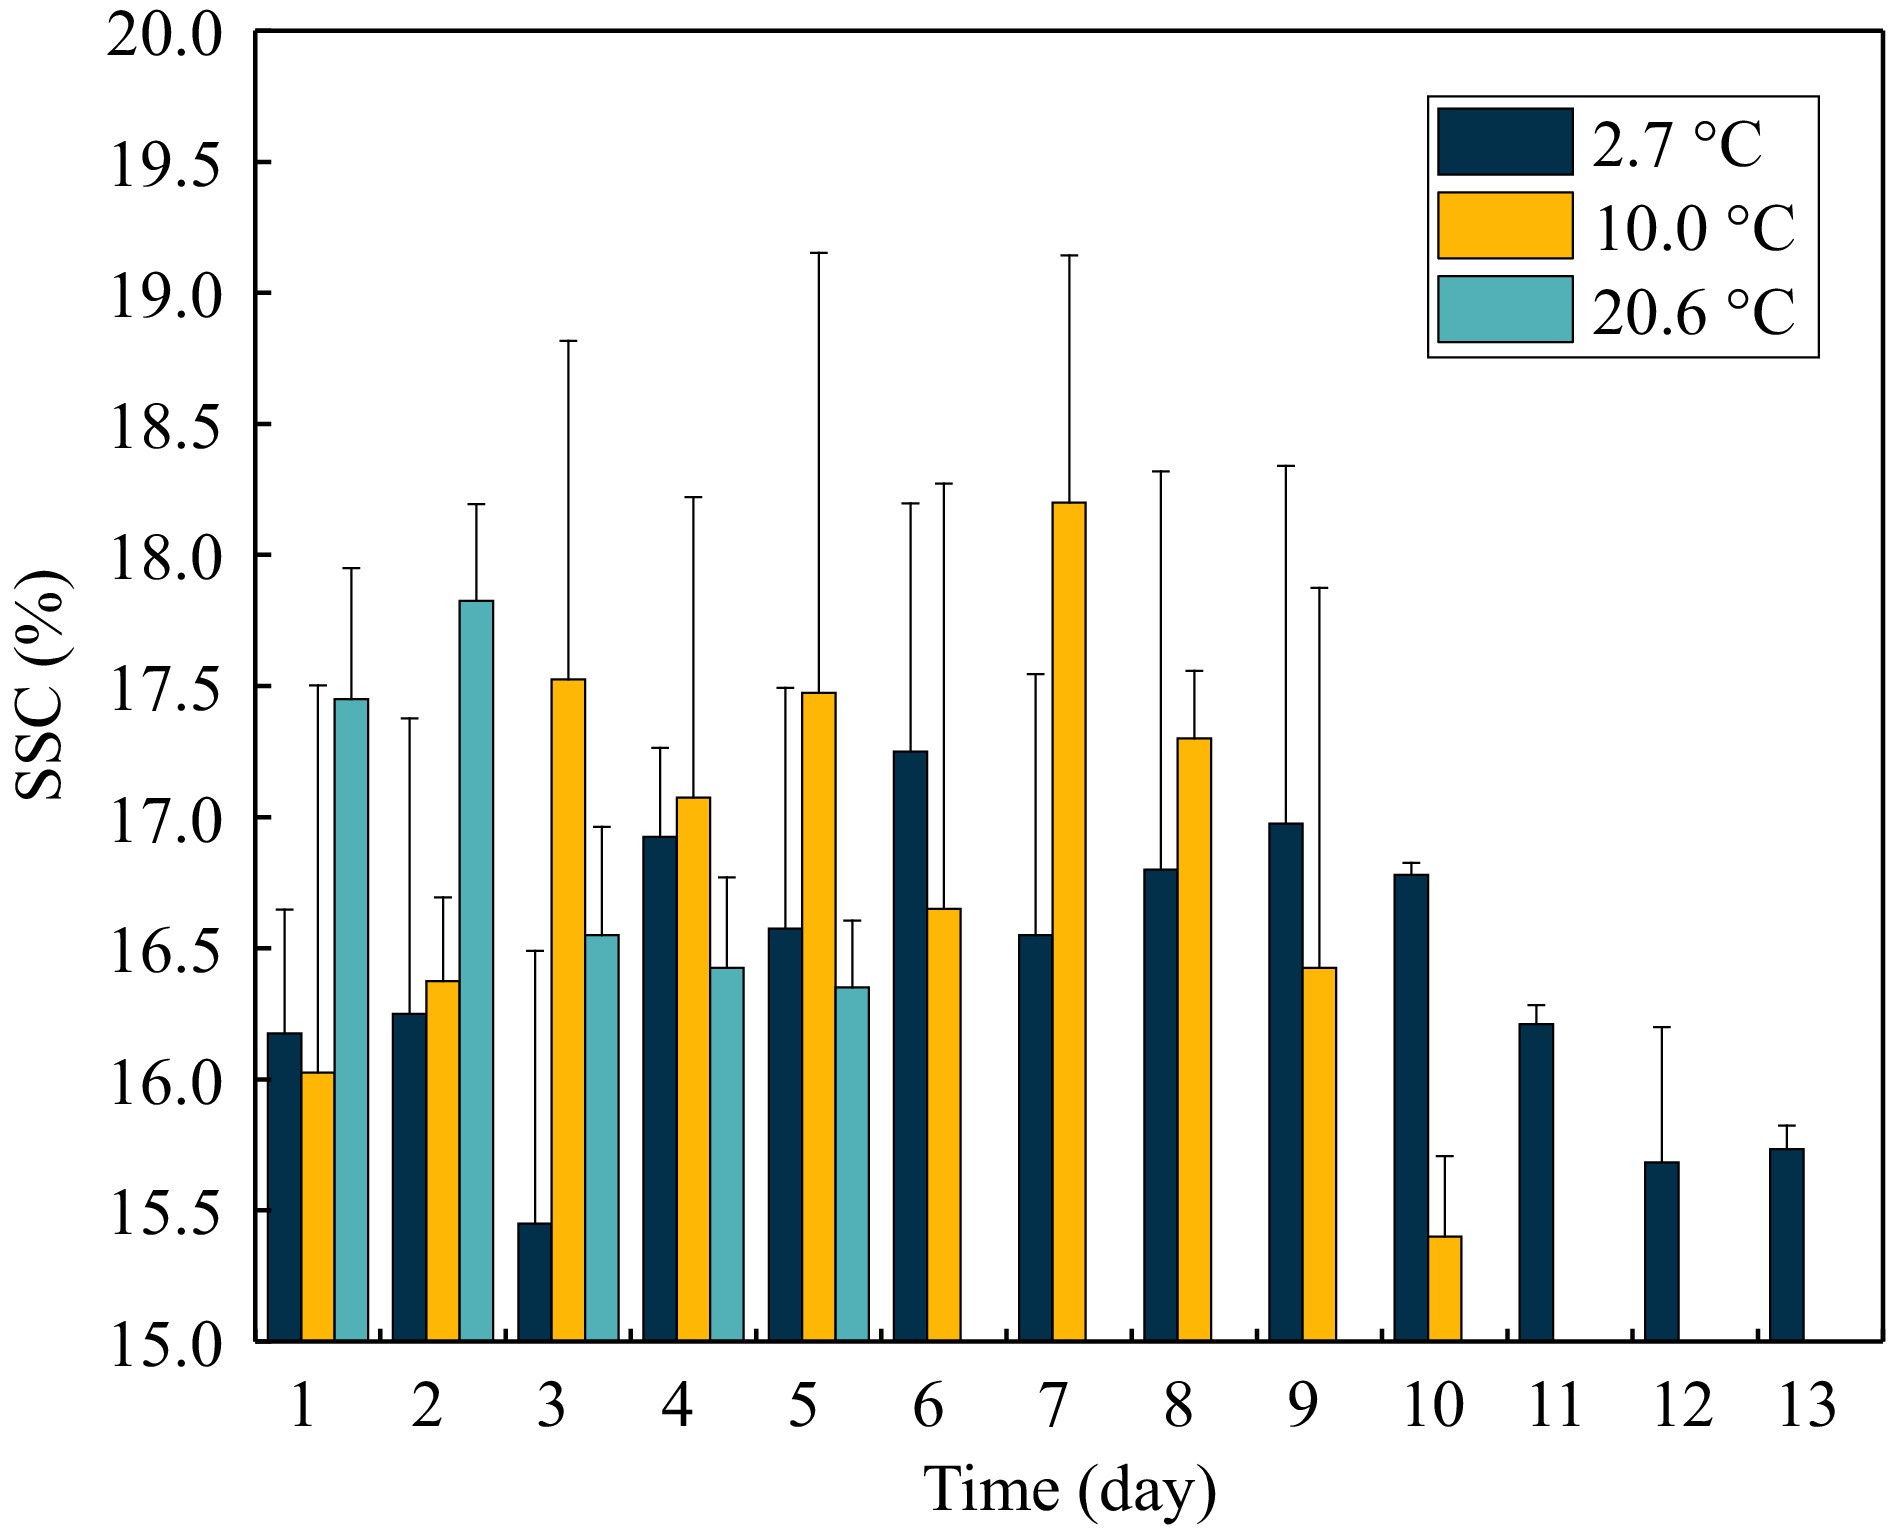
Figure 2.
Reference grape SSC tested on each day of the experiment.
Table 1 demonstrates that the range of SSC was 9.23%–22.73%. The concentration gradient methodology was applied to partition the data into a calibration set and a prediction set. The SSC range of 11.43%–22.6% within the prediction set fell within the 9.23%–22.73% interval of the calibration set. There is no significant variation in standard deviations observed between the calibration and prediction sets. There were no apparent differences in the standard deviations found between the calibration and prediction sets. Therefore, the distribution of SSC in the calibration and prediction sets is almost identical, which avoids biases in the distribution of the data sets. This phenomenon illustrated that both sets were suitable for reliable analysis.
Table 1. Reference measurement of grape SSC.
Subsets Number of
sampleRange of SSC Mean Standard
deviationCalibration set 112 9.23%−22.73% 17.349% 2.342% Prediction set 37 11.4%−22.07% 17.357% 2.230% Total samples 149 9.23%−22.73% 17.351% 2.307% Analysis of grape SSC spectral data
-
The spectral data of all samples were acquired using a Vis-NIR spectroscopy detection system. The reflectance spectral curves of 149 group grapes of 400–1,100 nm are shown in Fig. 3. As shown in Fig. 3, the spectral curves of all samples exhibited a consistent vibrational pattern. The absence of any significant differences among spectral curves indicates that the spectral data of all grape samples could be used for subsequent modelling. Across the entire spectrum, three distinct wave peaks were observed at 530−630, 720, and 810 nm respectively, along with two distinct troughs at 670 and 970 nm. The peak at the wavelength of 530−630 nm reflected the color of the Seedless White cultivar grape, while the trough at the wavelength of 670 nm may correlate with the absorption of carotenoids and chlorophyll. The peak at 810 nm might correlate with the third overtone of C-H in sugars. The absorption at the wavelength of 970 nm was associated with the first overtone of O-H stretching vibration and it is closely related to the moisture content of grapes[30,31].
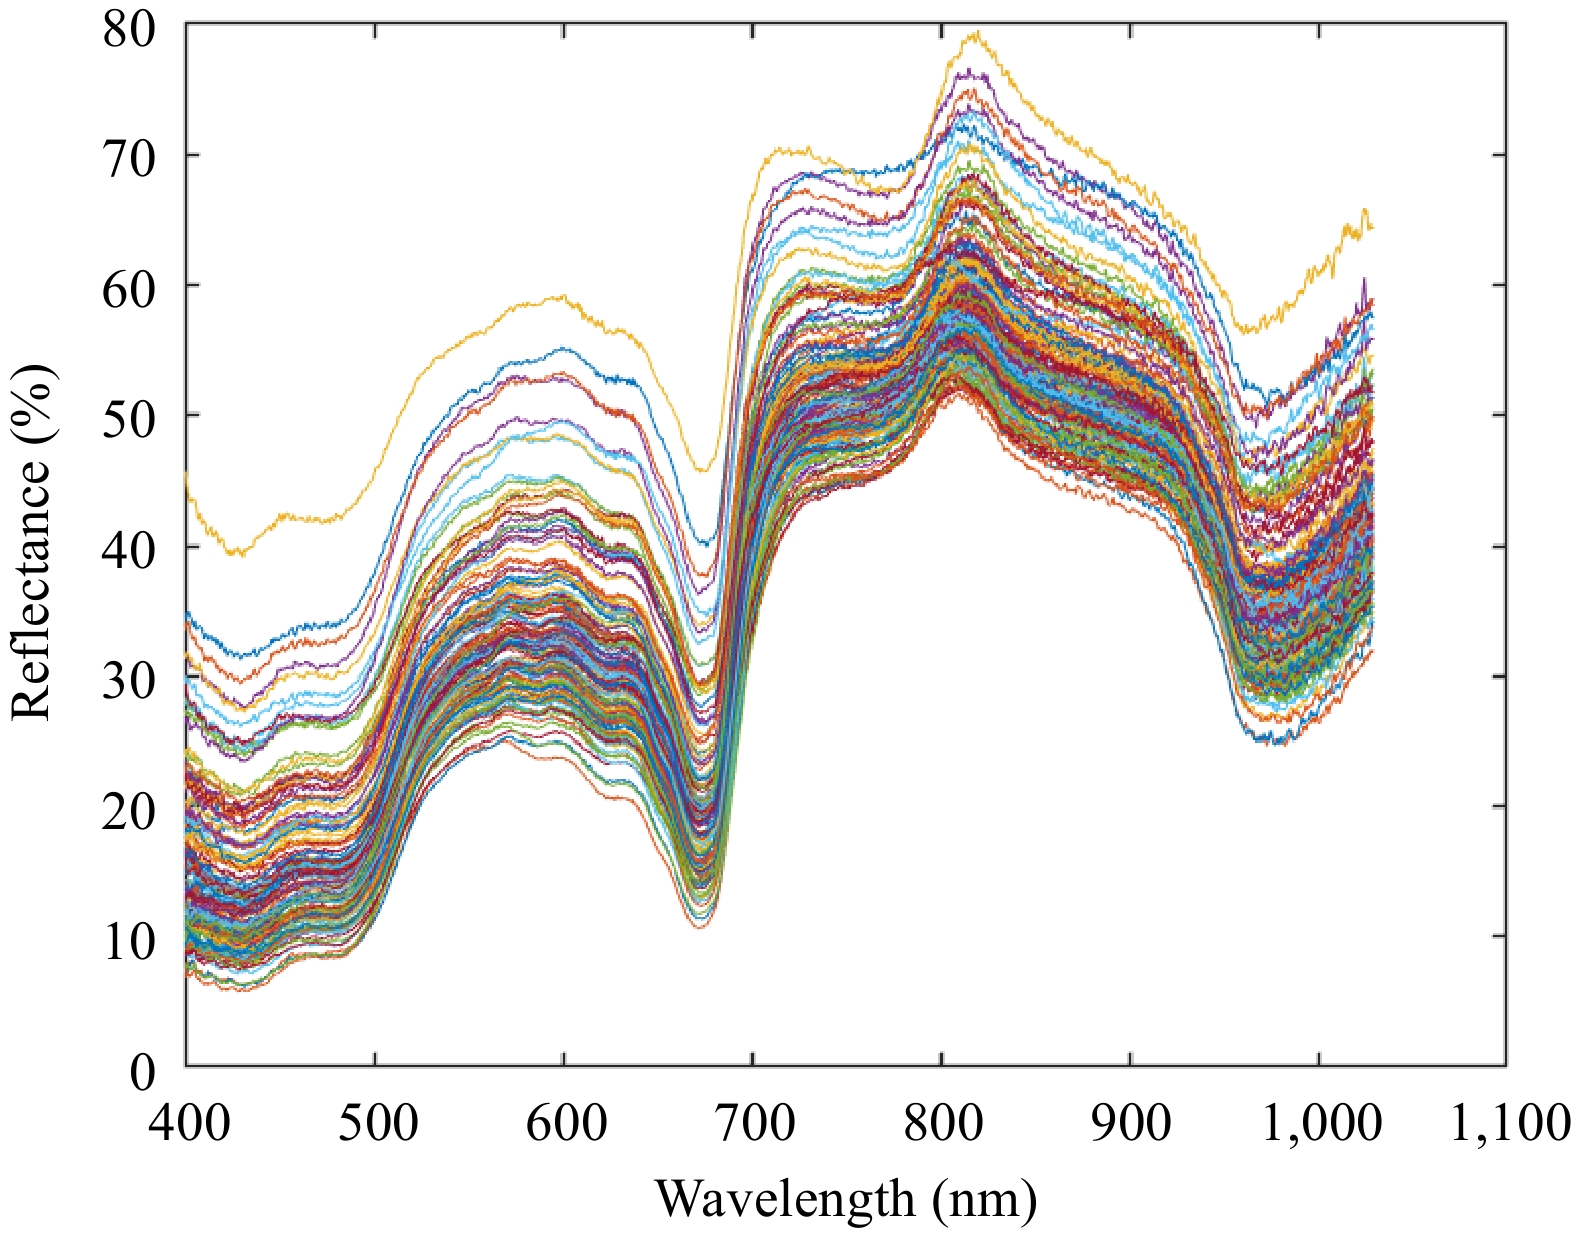
Figure 3.
Original spectral curves of grape SSC.
Spectrum detection analysis of SSC based on the whole band spectral data
-
The whole band spectral variables obtained by the portable Vis-NIR spectrometer served as input data and grape SSC obtained by the measurement were used as output data. The PLSR and SVR algorithms were employed to establish the grape SSC prediction models based on whole band spectral data. To improve the model accuracy, six pre-processing methods were applied to the raw spectral data. The modelling results are shown in Fig. 4, which illustrates that the different pre-processing methods significantly affect the prediction accuracy of the model. In particular, the MSC and SNV methods can improve the prediction accuracy of the model, which is because both of the pre-processing methods can alleviate the effect of the scattering from the surface of the sample. The S-G smoothing method can reduce the impact of the high-frequency noise on the modelling, although its contribution to model accuracy improvement is limited. Conversely, while derivative processing can enhance the spectral signal, it also amplifies the effect of noise. Since the spectral data resolution is 0.5 nm, the noise introduced by derivative processing masks the enhancement of the spectral data, which explains the observed decline in model accuracy following derivative processing[32].
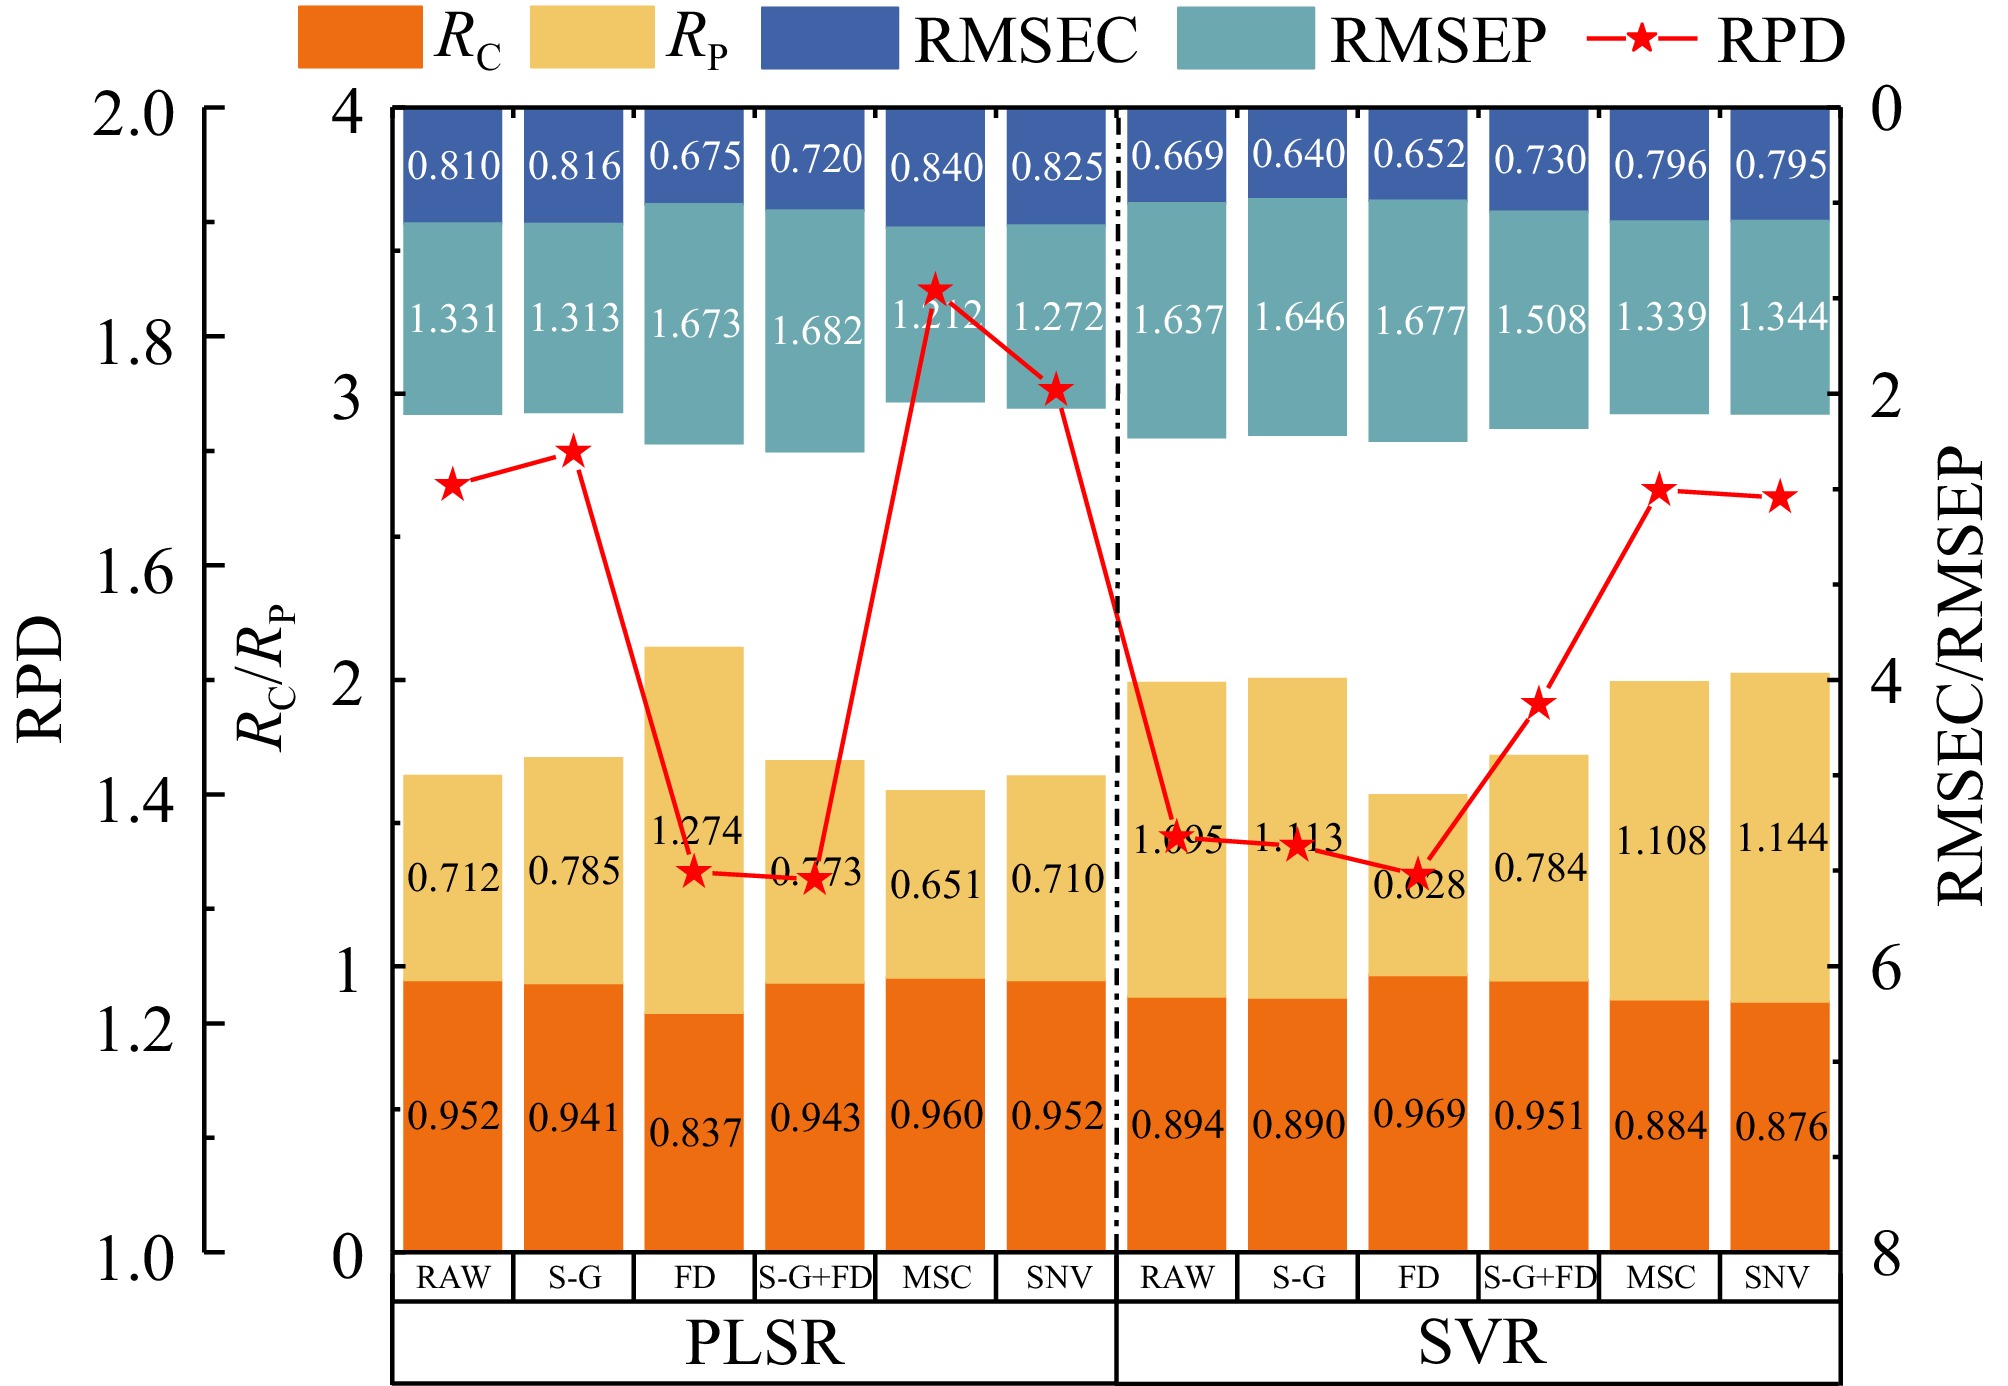
Figure 4.
Grape SSC prediction result based on the whole band spectrum.
Compared to the SVR algorithm, the PLSR algorithm achieved better results due to the strong collinearity among the 1,507 spectral data points in the whole band. After MSC pre-processing, an optimal PLSR prediction model was established, yielding the corresponding correlation coefficients of the calibration set of 0.96 and the root mean square error of the calibration set of 0.651. For the prediction set, the corresponding correlation coefficient was 0.840 with the root mean square error of 1.21. The RPD of the optimum model was calculated as 1.84.
Spectrum determination analysis of SSC based on screening characteristic wavelength by SPA
-
The use of feature wavelength selection methods to identify critical spectral regions can reduce the number of input variables and contribute to a more robust and concise model. SPA was used to screen feature variables from both raw and various preprocessed spectral data. In the feature variable selection process, the constraints of the number of feature variables could result in the loss of useful information and the introduction of redundant information, so there were no constraints on the number of screening variables. The combinations of spectral variables that would reflect the SSC variation in raw and preprocessed spectral data were screened by SPA based on the minimum predicted root mean square error. Subsequently, the PLSR and SVR methods were used to build a grape SSC prediction model derived from the optimized spectral data. The modelling results are shown in Fig. 5a.
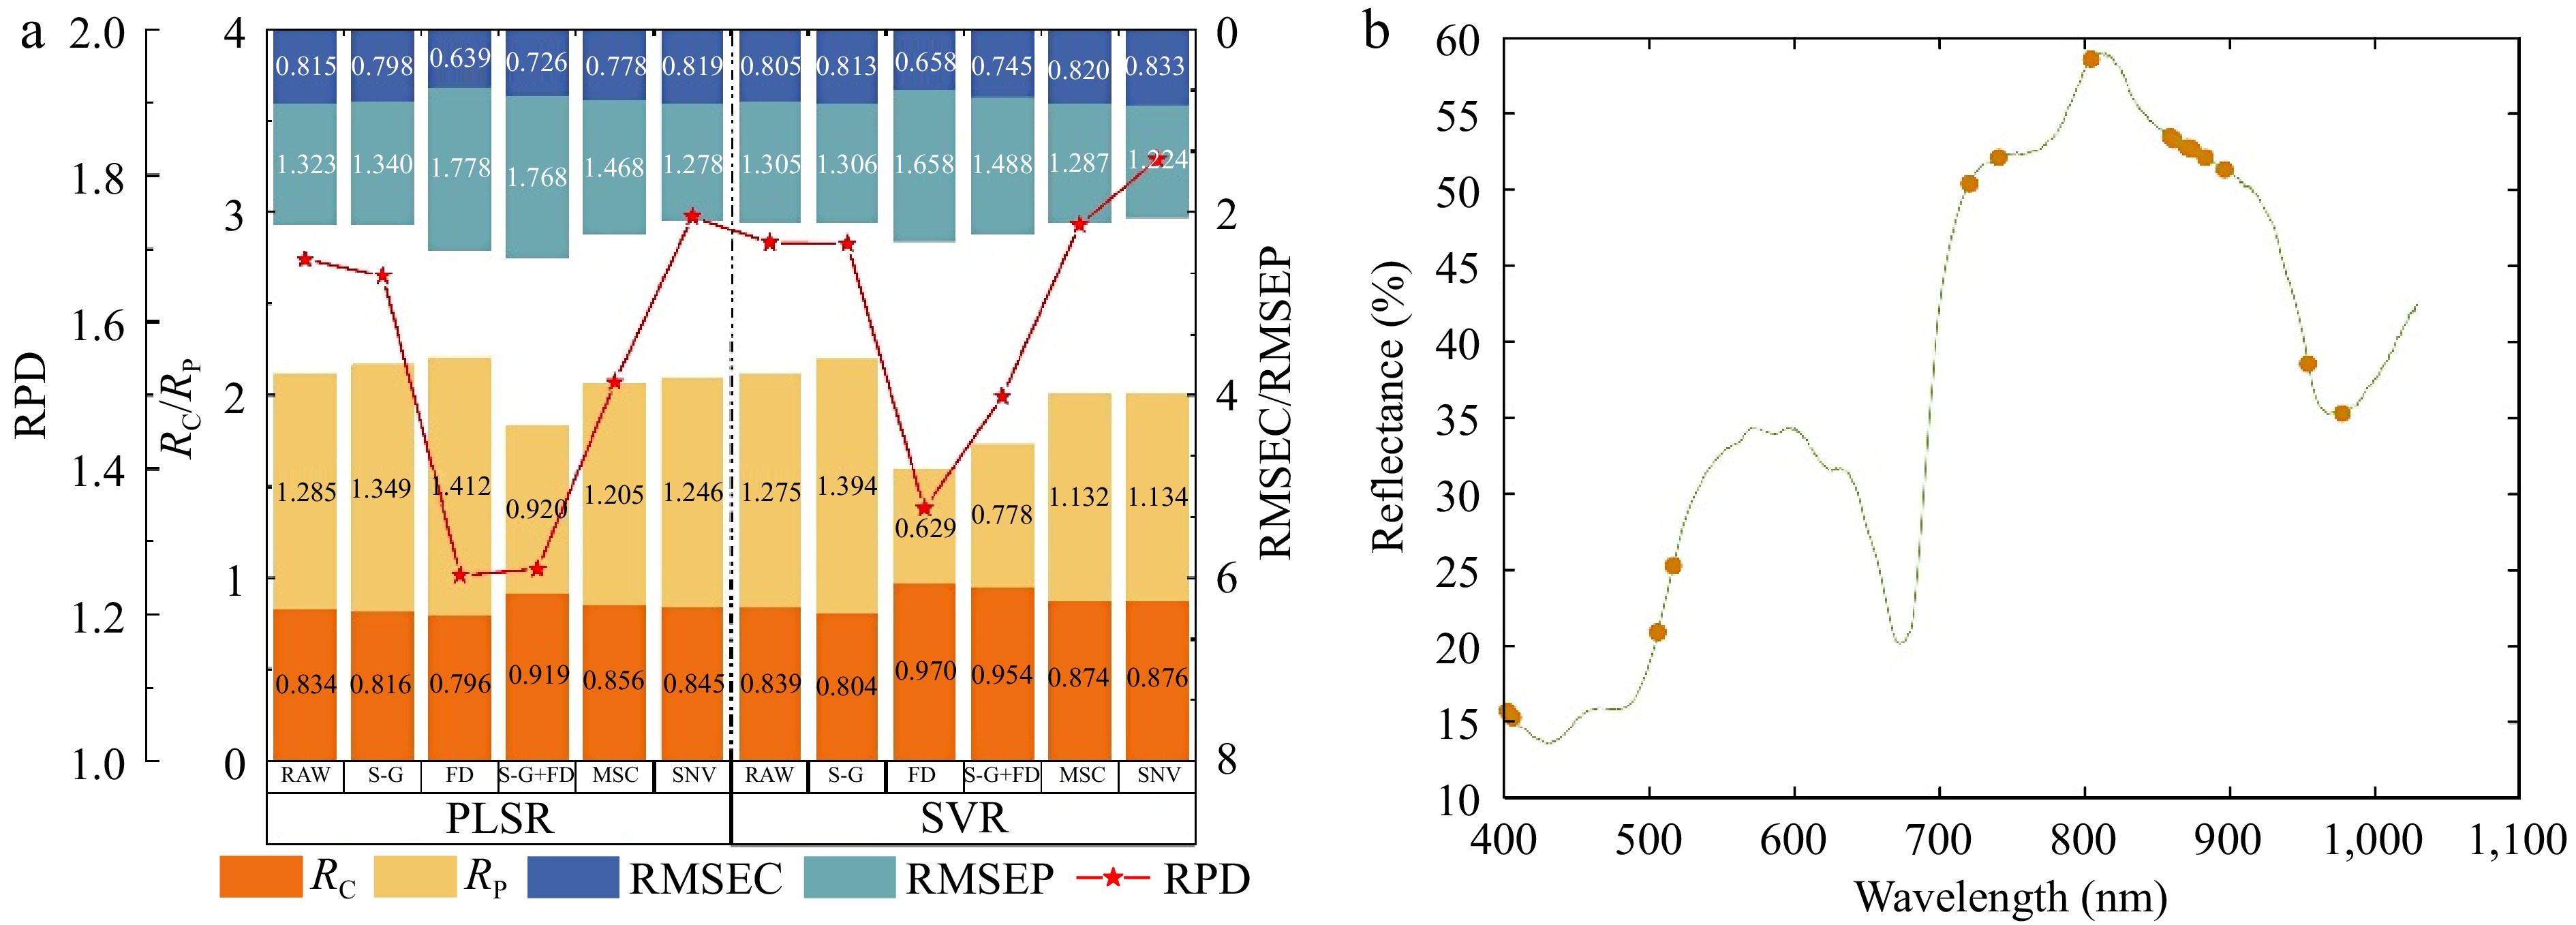
Figure 5.
The grape SSC prediction result based on the SPA screening characteristic variables. (a) Performance comparison of predicting model for SSC from the SPA selected variables data with different pre-processing methods. (b) The distribution of variables selected by SPA.
As shown in Fig. 5, the SVR prediction model for the SSC of seedless white grapes demonstrates superior performance compared to the PLSR model. The effects of different preprocessing methods vary, with both MSC and SNV preprocessing yielding better modelling results than the original spectral data model, whereas S-G smoothing and derivative processing lead to a reduction in the model's predictive accuracy. Following SNV preprocessing, the optimal predictive model derived from SPA-selected variables has been determined to be the SVR model. This model demonstrates a correlation coefficient of 0.876 for the calibration dataset and a correlation coefficient of 0.833 for the prediction dataset. Additionally, the root mean square error for the calibration dataset is 1.134, while that for the prediction dataset is 1.224, resulting in a model RPD of 1.822. Figure 5b illustrates the distribution of variables after SPA selection. As a result of the SPA selection process, the number of variables utilized in the modelling was reduced to 18.
Spectrum determination analysis of SSC based on screening characteristic wavelength by UVE
-
To compare the effects of different spectral pre-processing methods on the screening of feature wavelengths by UVE, various pre-processing techniques were applied to the raw spectral data before screening the feature wavelengths. The UVE algorithm eliminated the irrelevant information variables within the wavelength range of 400−1,100 nm in the spectral data while retaining information related to the grape SSC. The selection of principal components is critical in the process of eliminating irrelevant information using UVE, and the root mean square error of prediction is the basis for determining the number of principal components. When the root mean square error of prediction reaches the minimum value, the corresponding principal component is regarded as the optimal principal component. Ultimately, the PLSR and SVR algorithms were used to establish a quantitative prediction model between grape SSC and spectral data. The detailed modelling results are shown in Fig. 6a. As shown in Fig. 6, the PLSR prediction model for the SSC of seedless white grapes outperforms the SVR prediction model, with models constructed using spectral data preprocessed by MSC and SNV demonstrating superior performance. As shown in Fig. 6a, the optimum UVE-PLSR prediction model could be established after SNV pre-processing. The corresponding correlation coefficients of the calibration set and prediction set were 0.862 and 0.848, respectively; the root mean square errors of the calibration set and prediction set were 1.182 and 1.176, respectively. The RPD of the optimal model was 1.84.
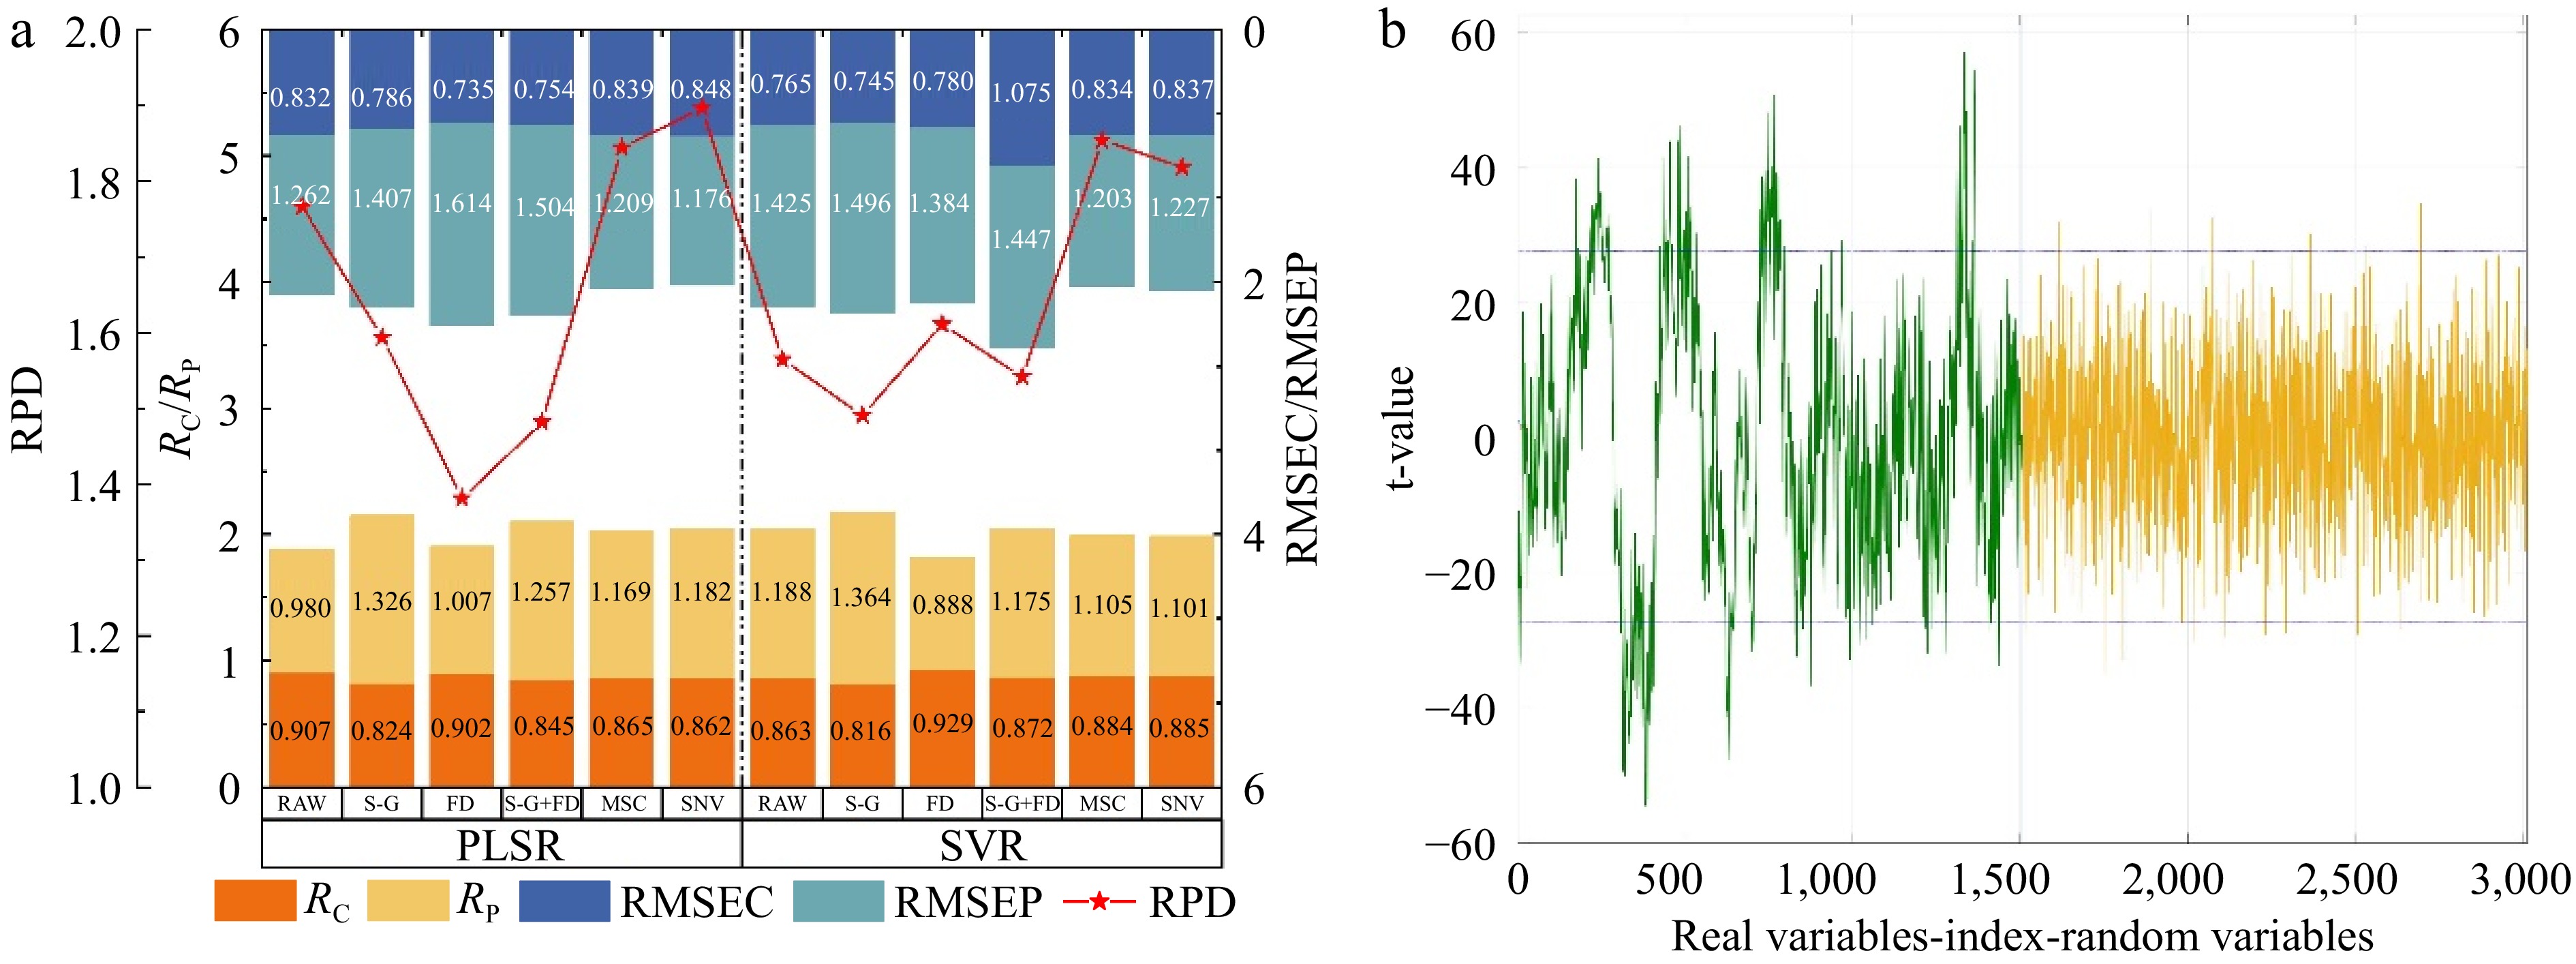
Figure 6.
The grape SSC prediction result based on the UVE screening characteristic variables. (a) Performance comparison of predicting model for SSC from the UVE selected variables data with different pre-processing methods. (b) The distribution of variables selected by UVE.
Figure 6b illustrates the distribution of feature wavelength selected using UVE after SNV pre-processing at the optimal number of principal components. The horizontal coordinates represent the spectral and noise matrices, and the vertical coordinate represents the stability t-value. The two parallel lines indicated the threshold. The variables with stability between the threshold separating lines were excluded. Conversely, if the stability of the variable was beyond the threshold, the corresponding variables remained as feature information[33]. The results showed that the feature variables were reduced to 299 after irrelevant information was eliminated by UVE.
Spectrum determination analysis of SSC based on screening characteristic wavelength by CARS
-
The CARS algorithm was used for the selection of the characteristic wavelengths associated with SSC in Seedless White grapes. The Monte Carlo sampling number of 100 was set and 10-fold cross-validation was used for the calculation. Figure 7a & b showed the vibration of RMSECV during the process of extracting the characteristic wavelengths of the SSC, from which it can be seen that the value of RMSECV reached the minimum when the number of sampling times was 50; the RMSECV value showed a decreasing trend during the first to the 50th sampling operations, indicating that the wavelength variables remained in the spectra data that were useful. In the 51st to the 100th sampling operations, the RMSECV value showed an increasing trend, suggesting that the CARS algorithm removed some critical information related to the SSC in grapes[34].
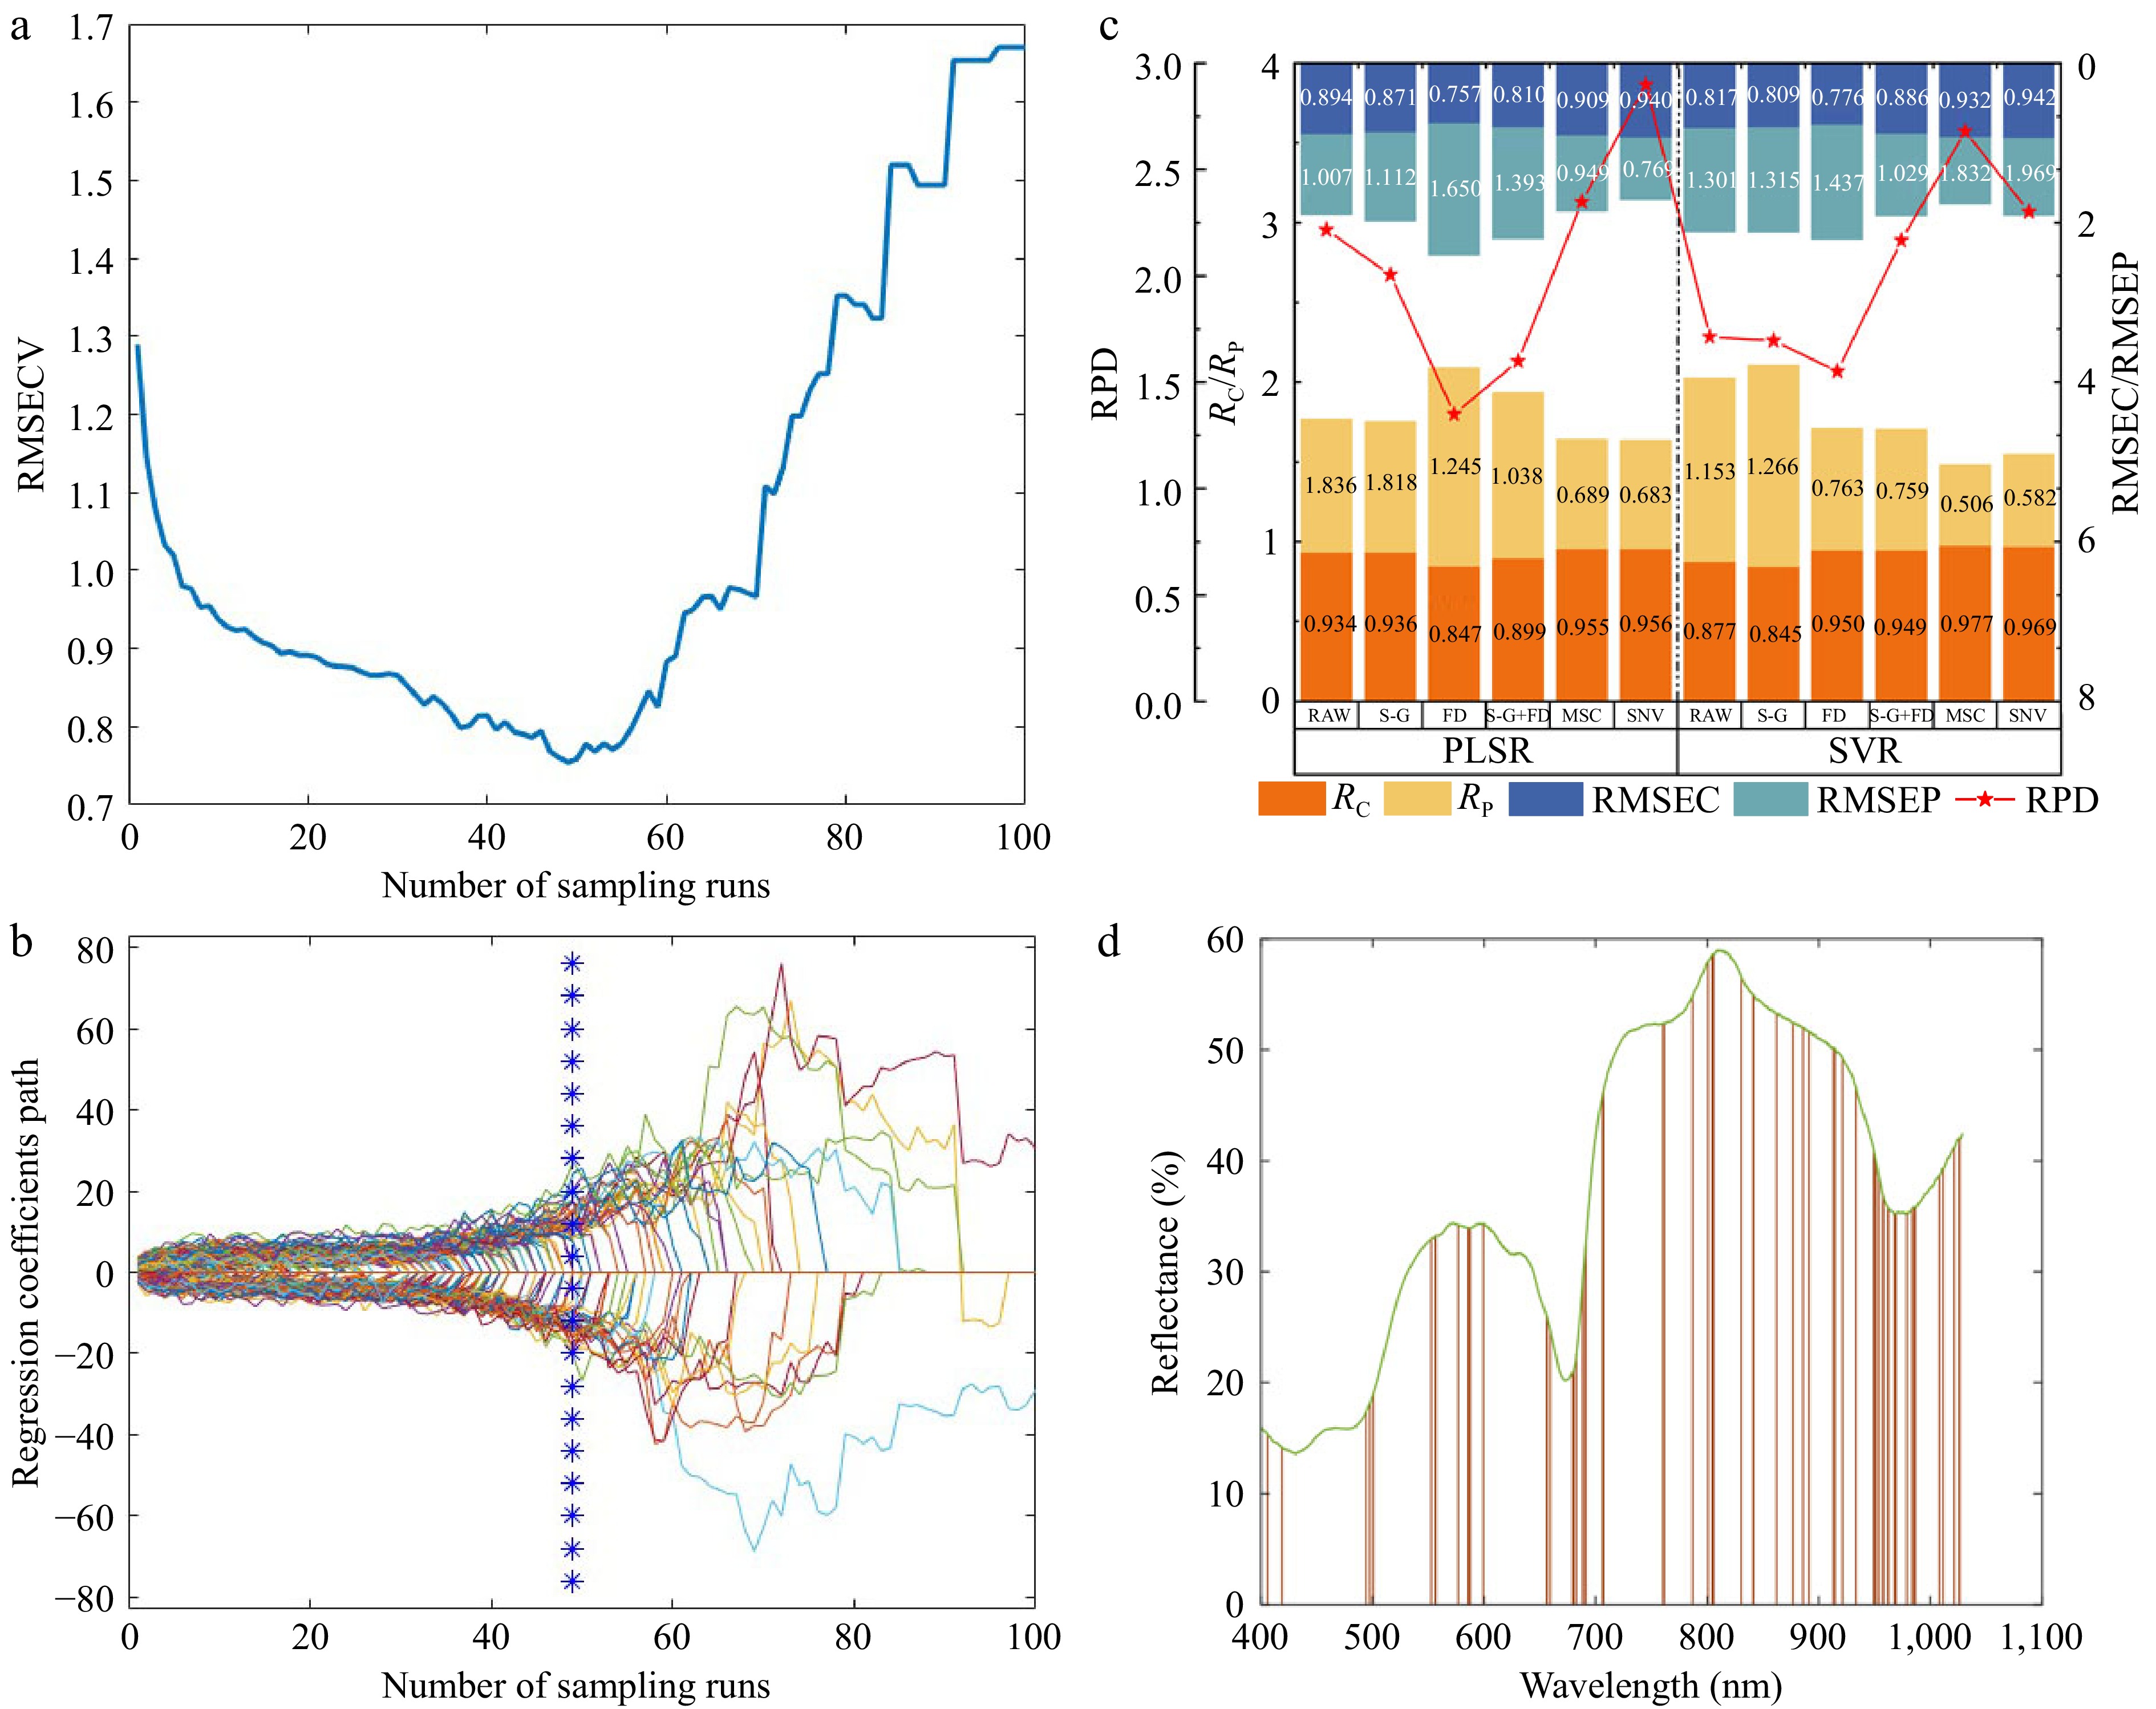
Figure 7.
The grape SSC prediction result based on the CARS screening characteristic variables. (a) The RMSECV variation during the CARS algorithm iteration process. (b) The regression coefficient path of each variable with an increase in the number of sampling runs. (c) The performance comparison of predicting model for SSC from the CARS selected variables data with different pre-processing methods.(d) The distribution of variables selected by CARS.
Figure 7c shows the results established by the CARS screening variables. As shown in Fig. 7c, it can be seen that the optimum CARS-PLSR prediction model could be built following the SNV process. The corresponding correlation coefficients of the calibration set and prediction set were 0.956 and 0.940, respectively; the root mean square errors of the calibration set and prediction set were 0.683 and 0.767, respectively. The RPD of the model was 2.899. These results indicate that the model established based on the variables selected by the CARS algorithm exhibited higher accuracy and stability compared to the whole band spectrum. The feature wavelength distribution following CARS selection is displayed in Fig. 7d.
Comparison analysis of SSC spectral detection results based on the whole band and characteristic wavelength
-
Figure 8 shows the comparison of the feature bands remained by three variable selection algorithms. It can be seen that the variables all contained the spectral data around 400, 750, and 970 nm, which are associated with anthocyanin and chlorophyll content[35]. This is the foundation for ensuring the establishment of the SSC prediction model. Compared with UVE and CARS, the least number of variables remained by using SPA, which may explain why SPA failed to improve the prediction model accuracy. The variables selected by UVE had a wide distribution between 530 and 630 nm, which may lead to the possibility of collinearity among the variables. In summary, the CARS methods contained more information related to SSC and exhibited the least collinearity among the selected variables. These factors are the primary reasons for CARS screening variables to establish the PLSR model with the best performance. Furthermore, the UVE and CARS retained the spectral data around 970 nm, which may be related to the moisture content in grapes[36].
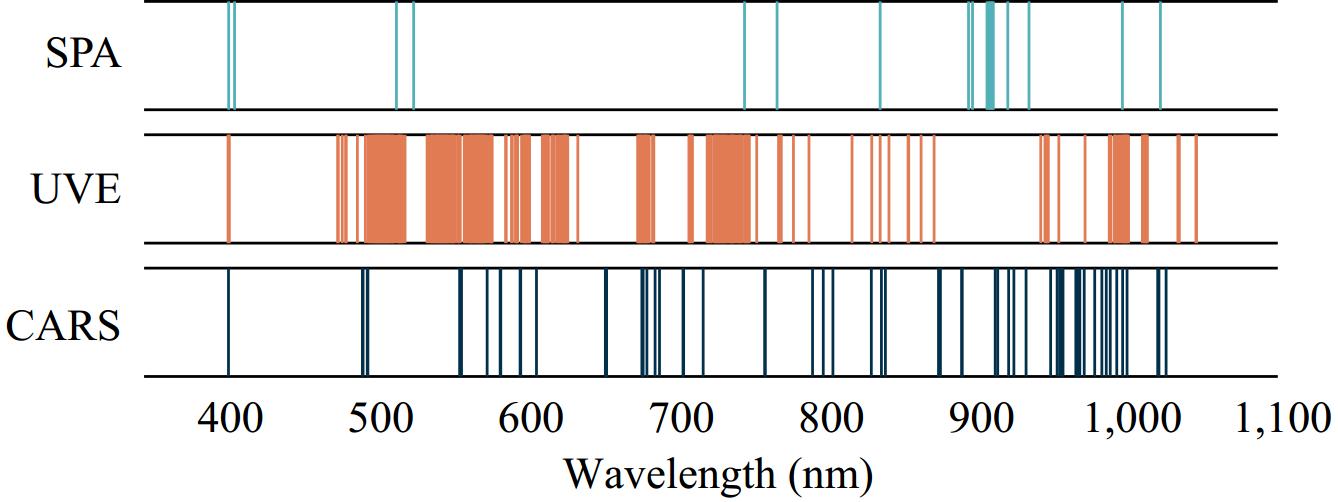
Figure 8.
Comparison of feature variables based on different selecting algorithms.
To achieve high-precision and rapid detection of grape SSC during storage and simplify the complexity of the model, the optimal model established based on whole spectrum data was compared with the predictive performance of the three selected feature variable spectral data. The comparison results are shown in Table 2. As shown in Table 2, both the prediction model based on whole band spectrum and selected variable spectrum data could facilitate rapid and non-destructive quantitative assessments of SSC in grapes during storage. The SNV pre-processing method could effectively improve the accuracy and stability of the prediction model. The three feature variable selected methods could effectively eliminate redundant information in spectral data. Notably, both the SPA and CARS algorithms significantly simplified the complexity of the model, while the UVE method had relatively meager simplification effects on the model. Compared with the grape SSC prediction model established using the whole band spectrum data, the PLSR model established using CARS selected variables exhibited the optimum overall properties. The correlation coefficient of the calibration set was updated from 0.960 to 0.956, and the corresponding root mean square error was updated from 0.651 to 0.683; the correlation coefficient of the prediction set was increased from 0.840 to 0.940, and the corresponding root mean square error decreased from 1.212 to 0.769. The RPD of the optimum model rose from 1.753 to 2.899. The optimum model of SSC in grapes based on characteristic variables was displaced more intuitively by the scatter plots of Fig. 9.
Table 2. Performance comparison of optimal modelling results of the whole variables and selected variables.
Pre-processing
methodsNo. of input
variablesModelling
methodsRc RMSEC Rp RMSEP RPD MSC 1507 PLSR 0.960 0.651 0.840 1.212 1.84 SNV 18 SPA + SVR 0.876 1.134 0.833 1.224 1.822 SNV 299 UVE + PLSR 0.862 1.182 0.848 1.176 1.897 SNV 61 CARS + PLSR 0.956 0.683 0.940 0.769 2.899 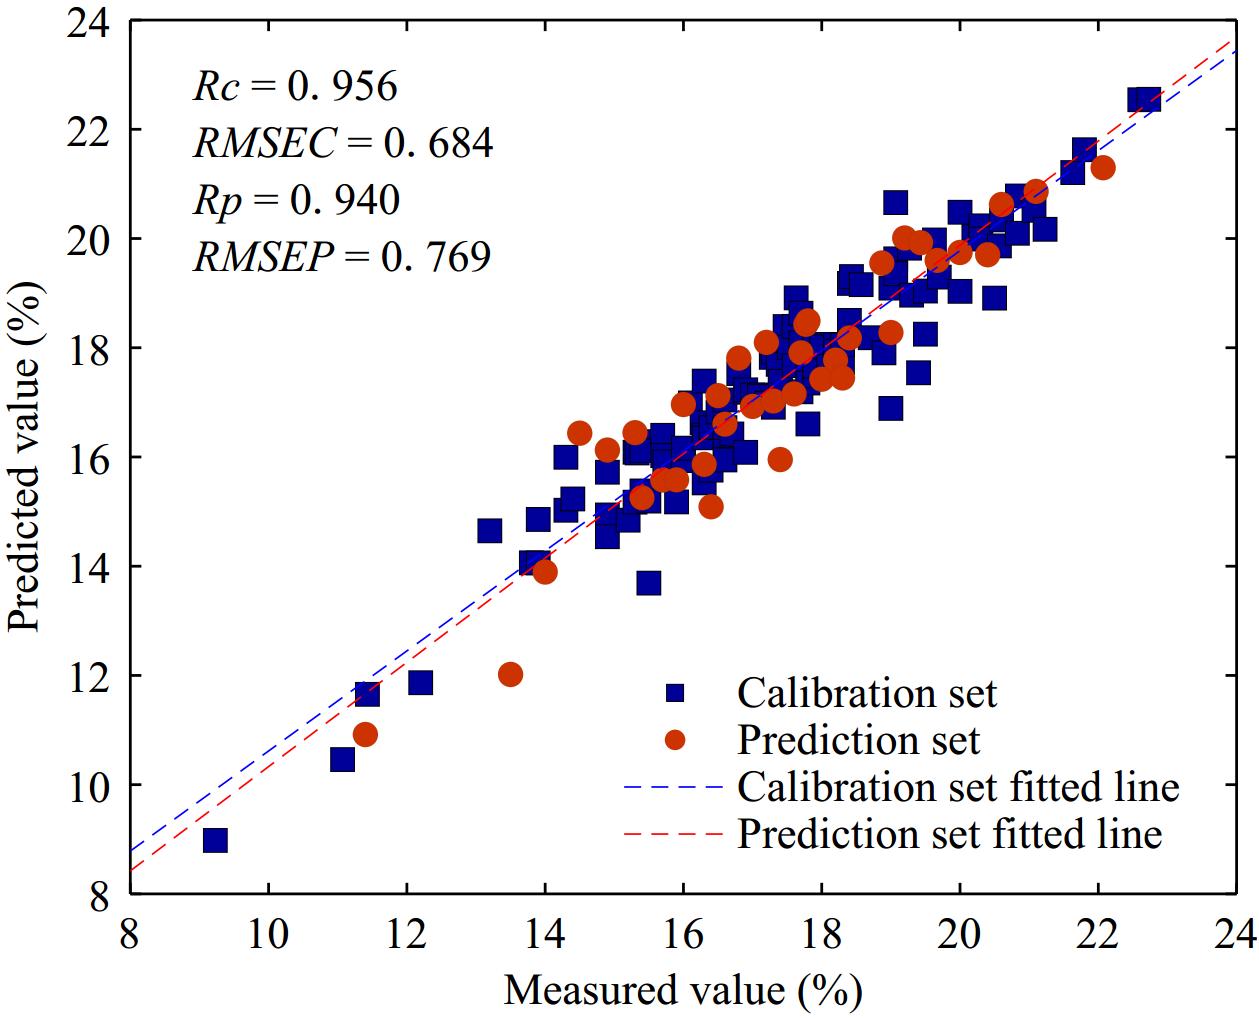
Figure 9.
Correlation between SSC measurement values and predicted values in the calibration set and prediction set.
-
In this study, Vis-NIR spectroscopy combined with chemometrics was used to detect the SSC in grapes during storage. The research demonstrated that the reliable grape SSC prediction model could be established using the whole band spectrum data. Different pre-processing methods had varying influences on model accuracy, and the SNV method could effectively improve model accuracy. In contrast, the SPA, UVE, and CARS algorithms were adopted to select the essential variables effectively and simplify the model complexity. Among the three variable selection algorithms, the PLSR prediction model based on the variables selected by the CARS algorithm yielded optimal overall performance. The correlation coefficient of the calibration set and the corresponding root mean square error were 0.956 and 0.683, respectively; the correlation coefficient of the prediction set and the corresponding root mean square error were 0.940 and 0.769, respectively, resulting in an RPD of 2.899. In summary, this study provides a feasible reference for rapid and non-destructive assessment of grape quality, including SSC and total acid, during storage. It is worth noting that deep learning has increasingly been applied in the analysis of agricultural product quality, yielding promising results. However, due to the limited sample size, it is essential to adjust the network model when employing algorithms such as deep learning, which represents a key focus for future research. Further optimization is necessary to enhance the applicability of these models to a broader range of grape cultivars and quality characteristics.
This work was supported by the National Natural Science Foundation of China (Project No. 52305281) and the Modern Agricultural Engineering Key Laboratory at Universities of Education Department of Xinjiang Uygur Autonomous Region (Project Nos TDNG2023102 and TDNG2024101). The authors declare no conflict of interest and the authors are grateful to anonymous reviewers for their comments.
-
The authors confirm contribution to the paper as follows: conceptualization, writing - draft manuscript preparation: Su Y, He K; investigation and methodology: Liu W, Li J; writing - manuscript revision: He K, Hou K; investigation: Lv S; supervision, funding, administration: Su Y, He X. All authors reviewed the results and approved the final version of the manuscript.
-
The datasets generated and analyzed during the current study are available from the corresponding author upon reasonable request.
-
The authors declare that they have no conflict of interest.
-
Authors contributed equally: Yuan Su, Ke He
- Copyright: © 2025 by the author(s). Published by Maximum Academic Press on behalf of China Agricultural University, Zhejiang University and Shenyang Agricultural University. This article is an open access article distributed under Creative Commons Attribution License (CC BY 4.0), visit https://creativecommons.org/licenses/by/4.0/.
-
About this article
Cite this article
Su Y, He K, Liu W, Li J, Hou K, et al. 2025. Detection of soluble solid content in table grapes during storage based on visible-near-infrared spectroscopy. Food Innovation and Advances 4(1): 10−18 doi: 10.48130/fia-0025-0005 

Detection of soluble solid content in table grapes during storage based on visible-near-infrared spectroscopy
- Received: 05 November 2024
- Revised: 29 November 2024
- Accepted: 03 December 2024
- Published online: 17 January 2025
Abstract: The soluble solid content (SSC) in grapes significantly influences their flavour and plays an integral role in evaluation of the quality and consumer acceptance. This study employed visible near-infrared (Vis-NIR) spectroscopy to rapidly quantify SSC in table grapes during storage. A predictive model was developed to construct a correlation between the spectral data and the measured SSC, while a comparative analysis was undertaken to assess the effects of various spectral preprocessing techniques. Successive projection algorithms (SPA), uninformative variable elimination (UVE), and the competitive adaptive reweighting algorithm (CARS) were adopted to eliminate redundant variables from both the original and preprocessed spectral data. The partial least squares regression (PLSR), and support vector regression (SVR) algorithms were adopted to establish a predictive model. Comparing the modelling results derived from whole-band spectral data with those obtained from selected spectral variables, the optimal spectral prediction model was formulated utilizing PLSR. The model, which incorporated filtered characteristic wavelength spectral data obtained through CARS following standard normal variate (SNV) preprocessing yielded optimum results with the correlation coefficients of the calibration set (RC), and the prediction set (RP) were 0.956 and 0.940, respectively. The root mean square errors of the calibration set (RMSEC), and prediction set (RMSEP) were 0.683 and 0.769, respectively, while the ratio of prediction to deviation (RPD) was 2.899. These results suggest that the application of Vis-NIR spectroscopy technology could effectively detect the SSC in grapes during storage, and it can provide a valuable reference for the rapid assessment of the table grape quality.
-
Key words:
- Table grape /
- SSC /
- Vis-NIR spectroscopy /
- Characteristic wavelength /
- Rapid detection