-
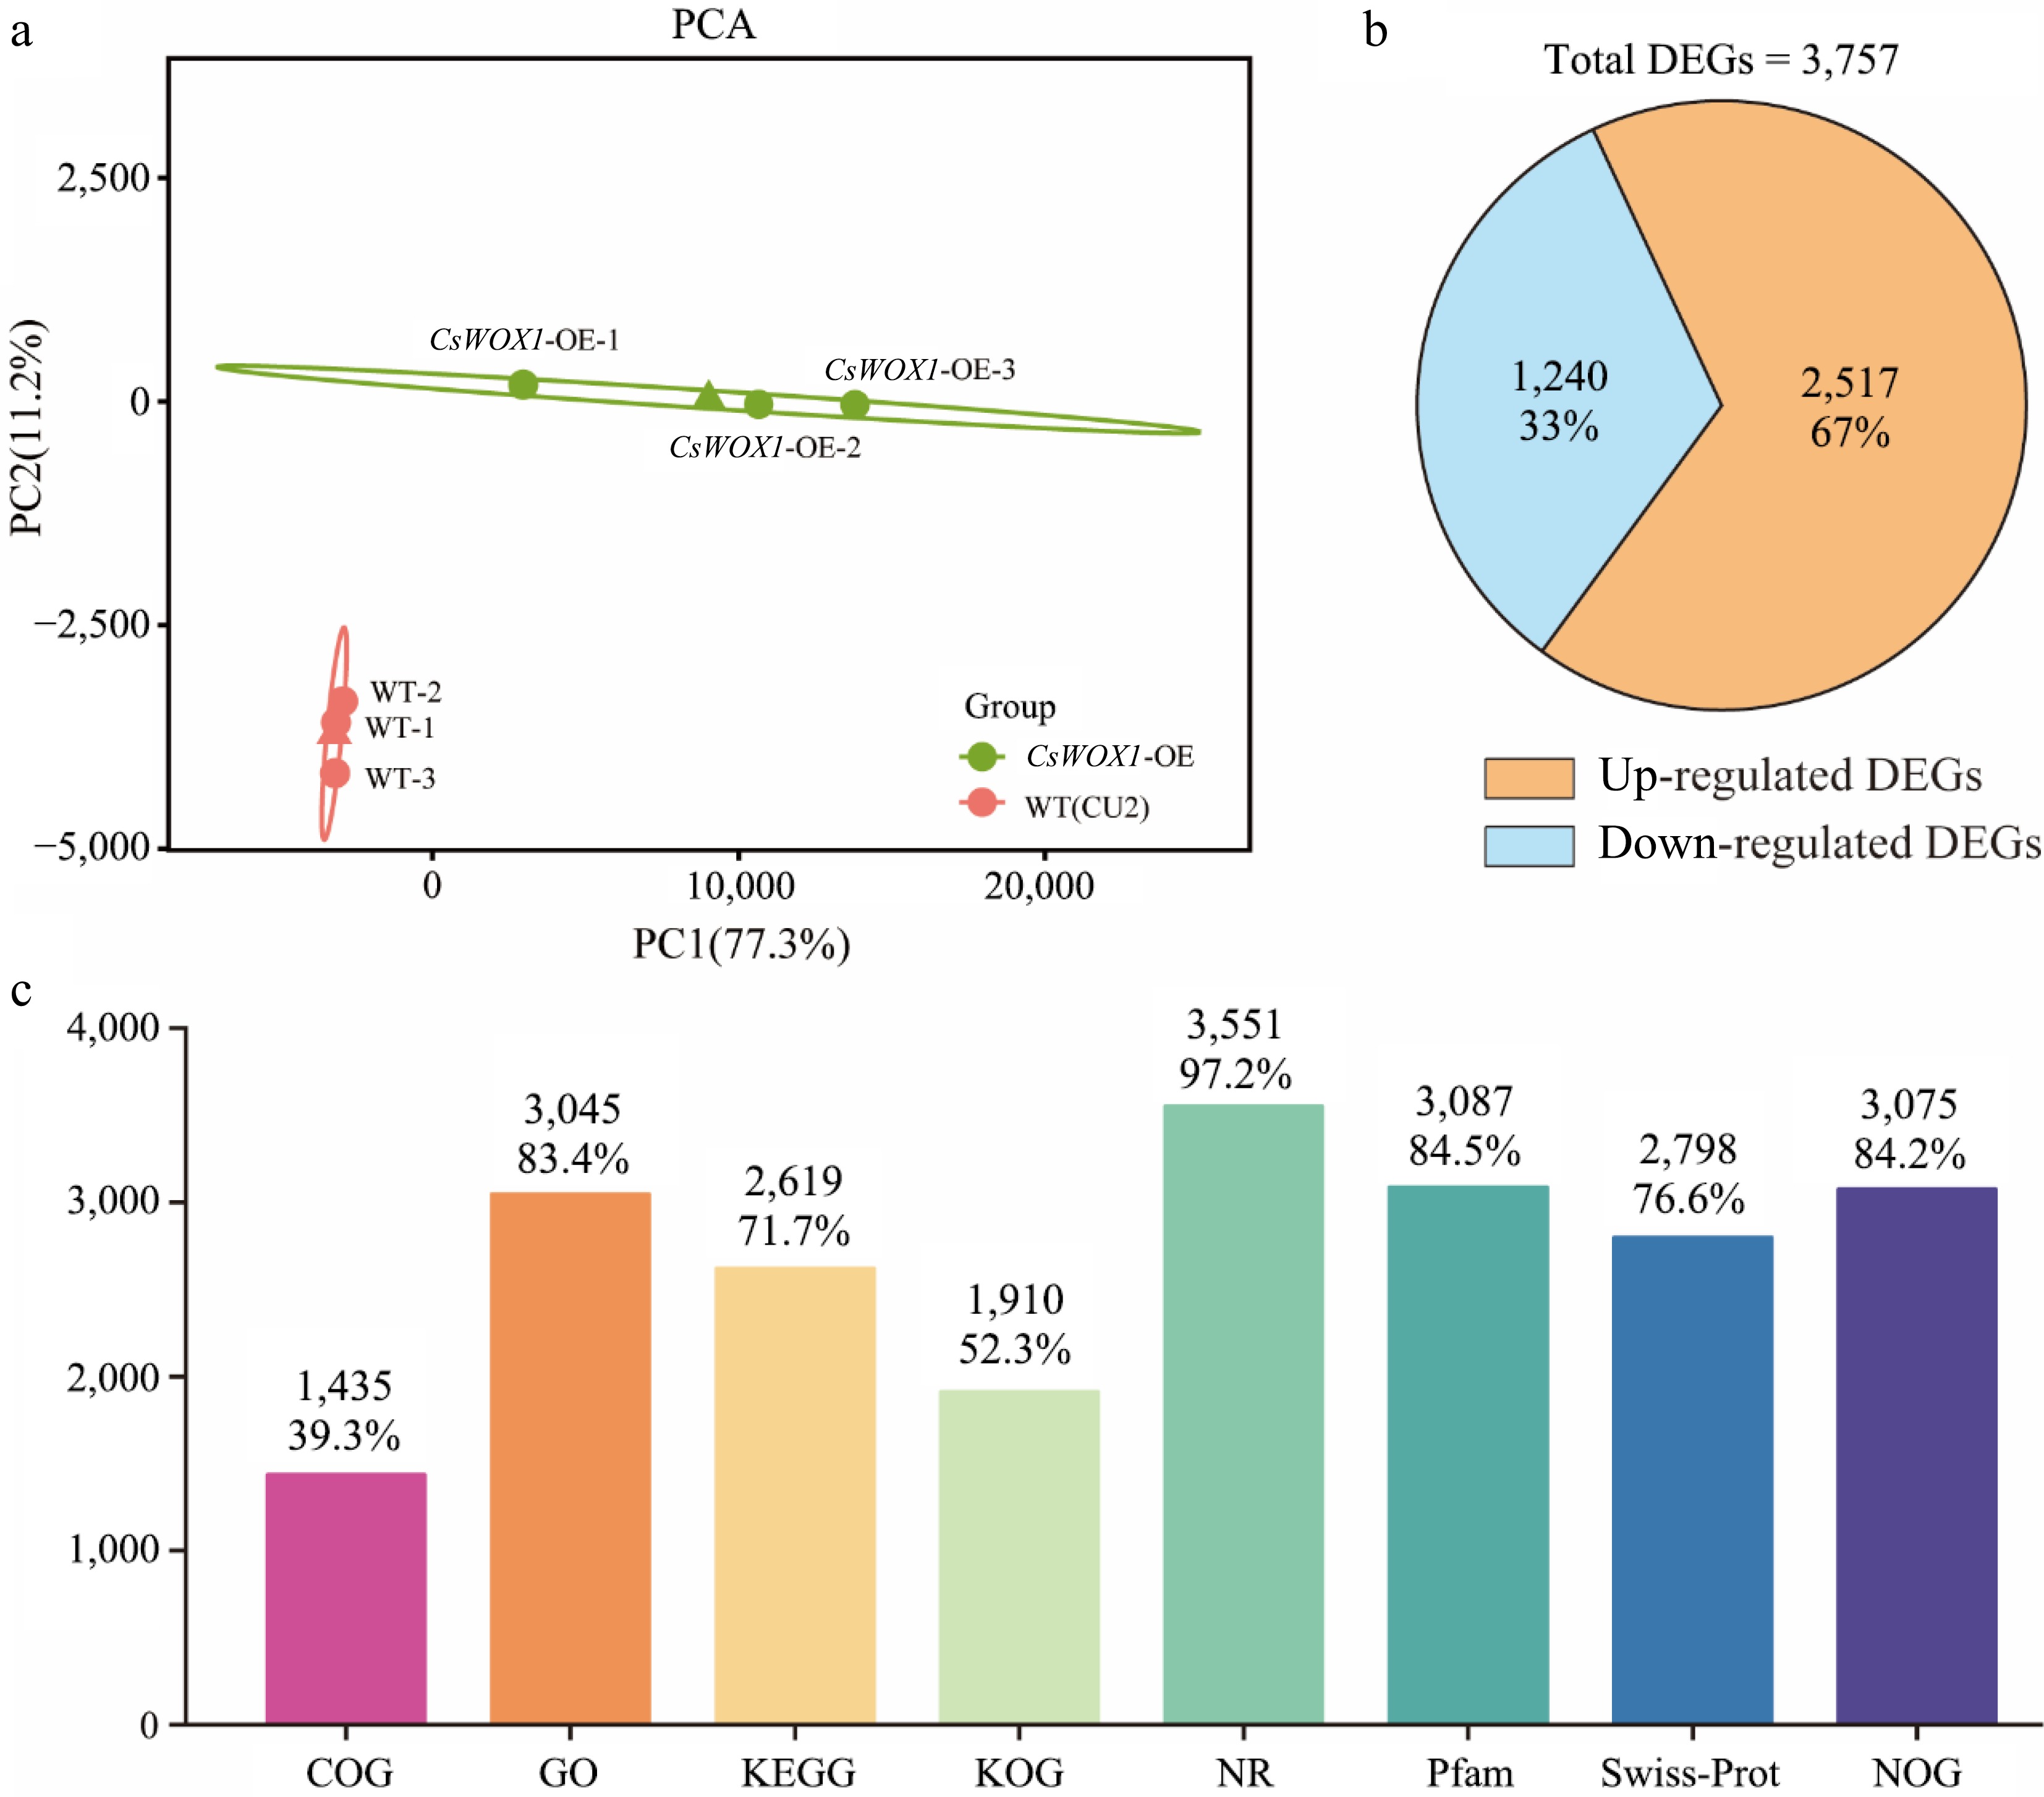
Figure 1.
Transcriptome information and analysis of CsWOX1-OE. (a) The principal component analysis (PCA) of differently expressed transcripts from two groups. (b) Statistics on the number of up-regulated and down-regulated DEGs. (c) The number and proportion of DEGs annotated in different databases.
-
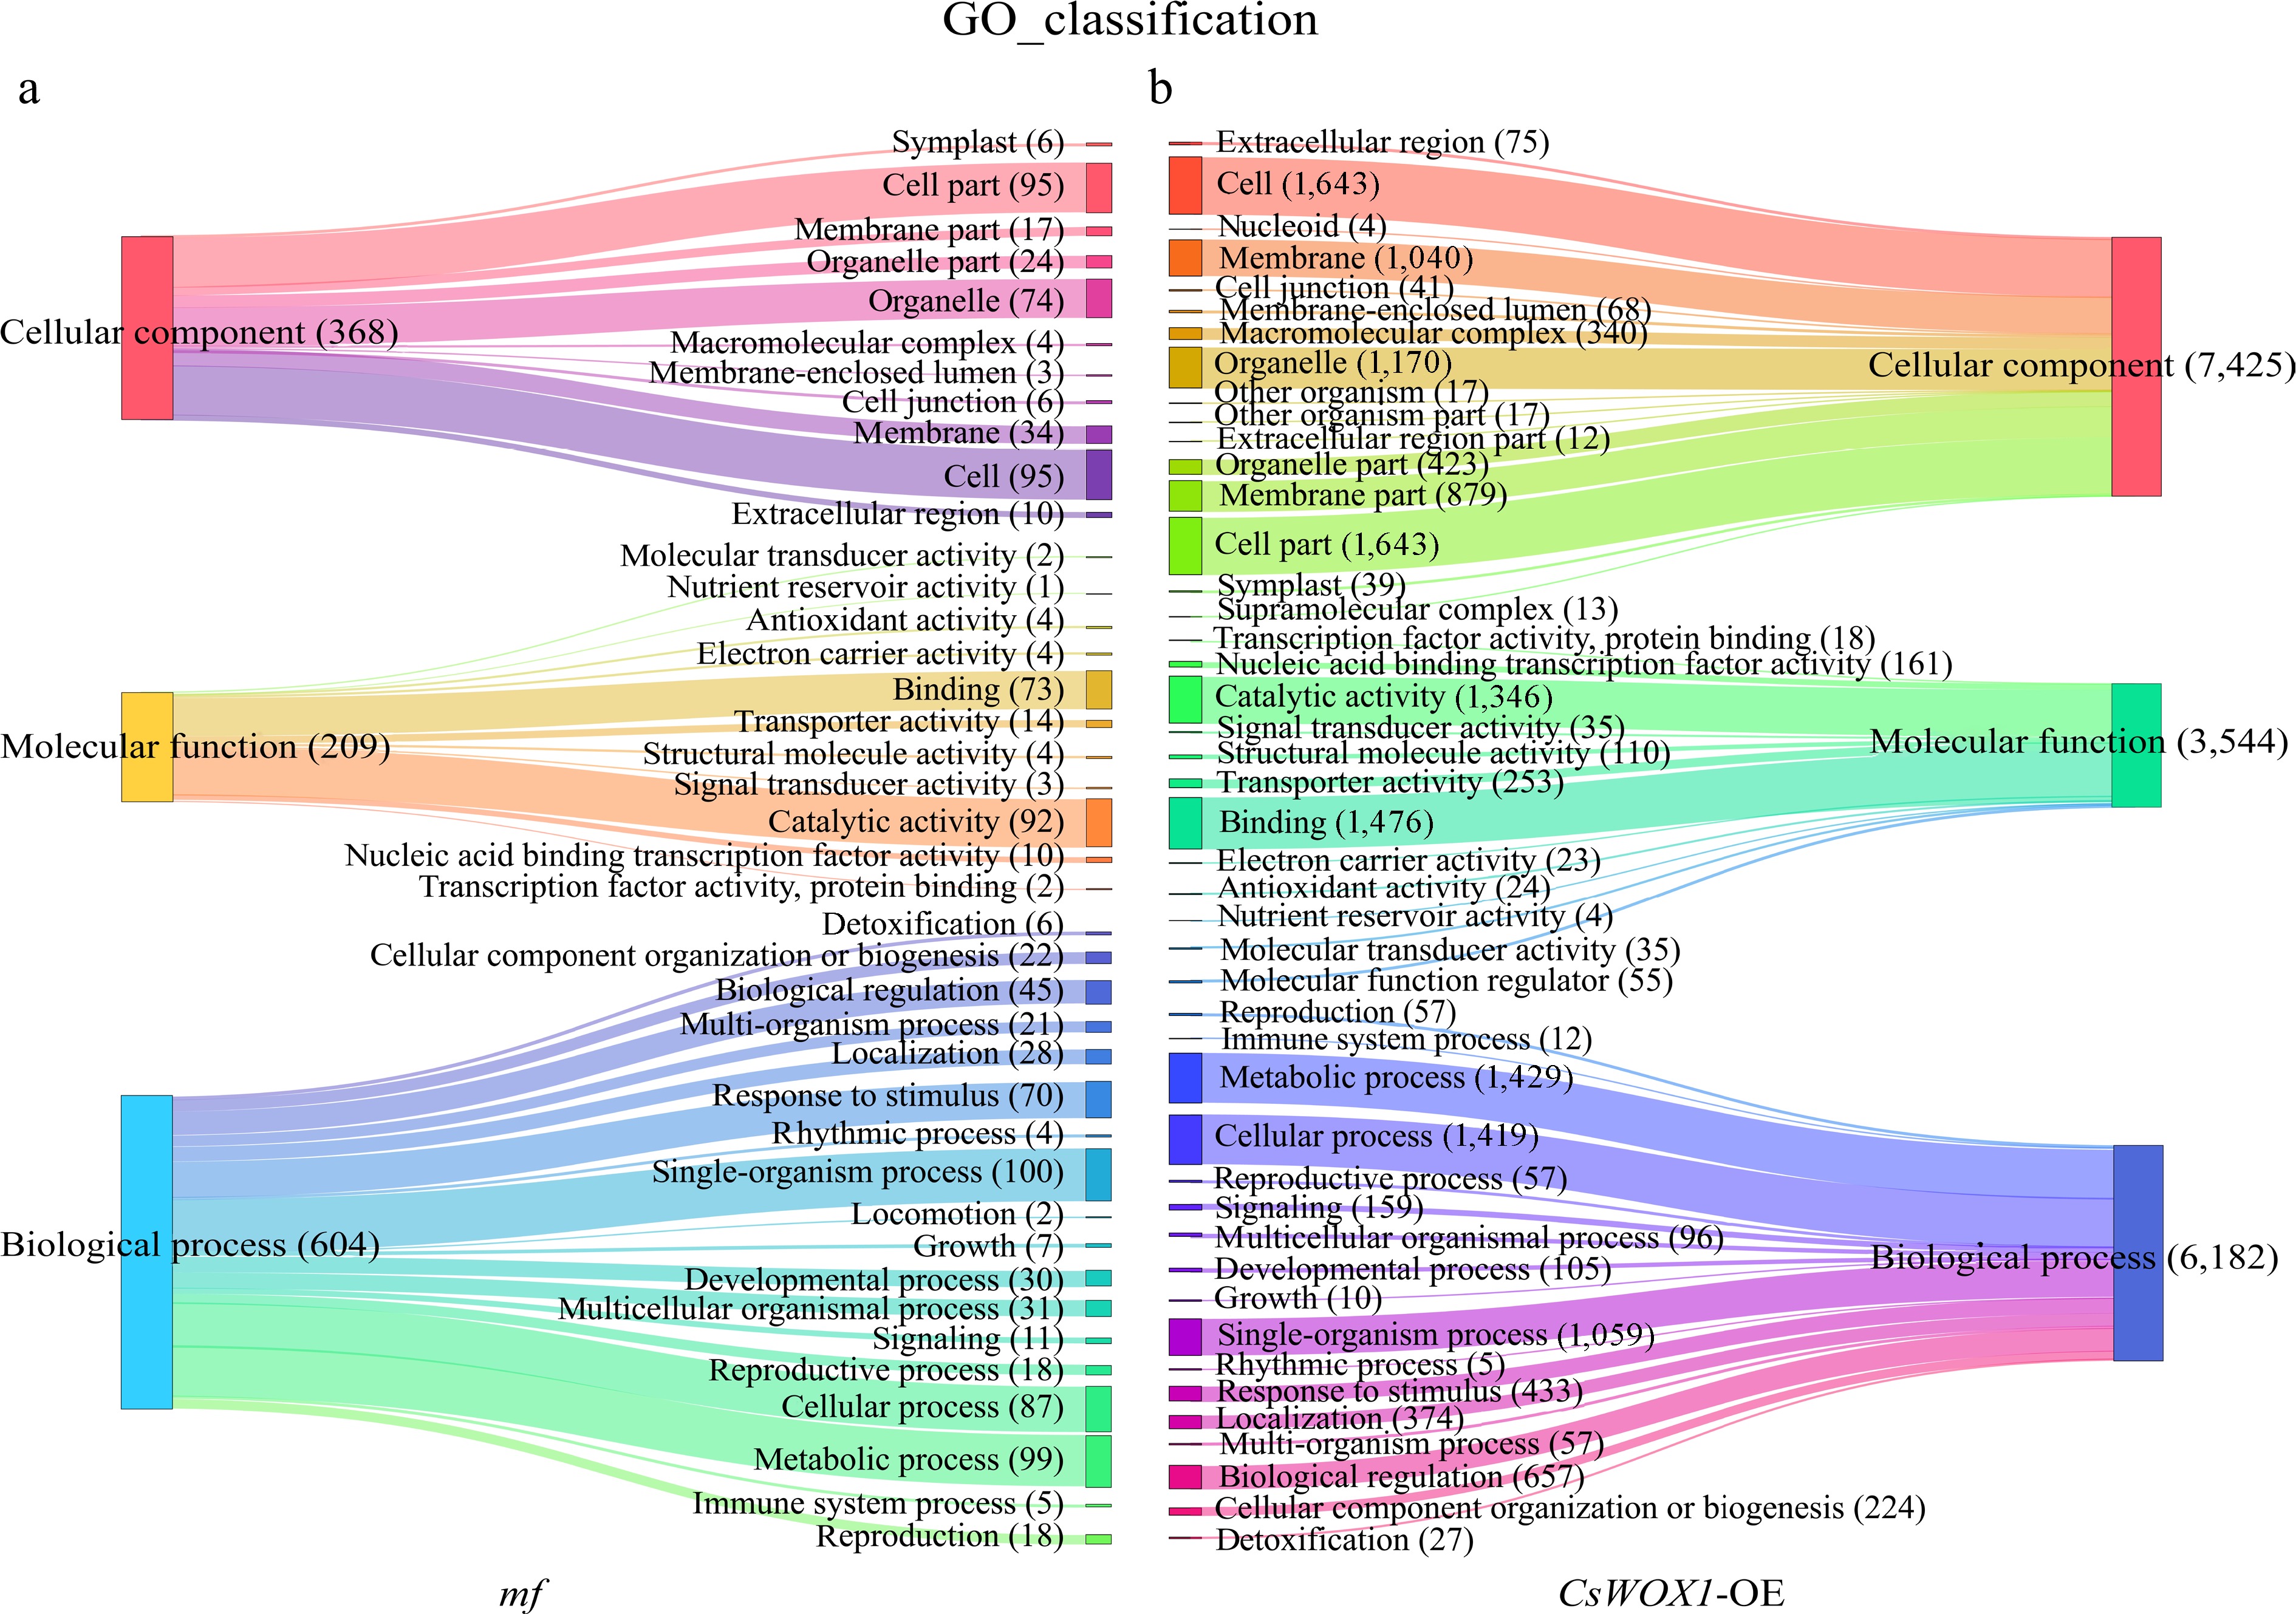
Figure 2.
The GO classification analysis results show the differences in the number and categories of annotated DEGs between the mf and CsWOX1-OE, with three main GO categories: Cellular component, Molecular function, and Biological process. (a) GO classification of DEGs in the mf sample. (b) GO classification of DEGs in the CsWOX1-OE sample. Each band represents the annotation status and trends of different GO terms and the numbers in parentheses indicate the number of genes in each category.
-
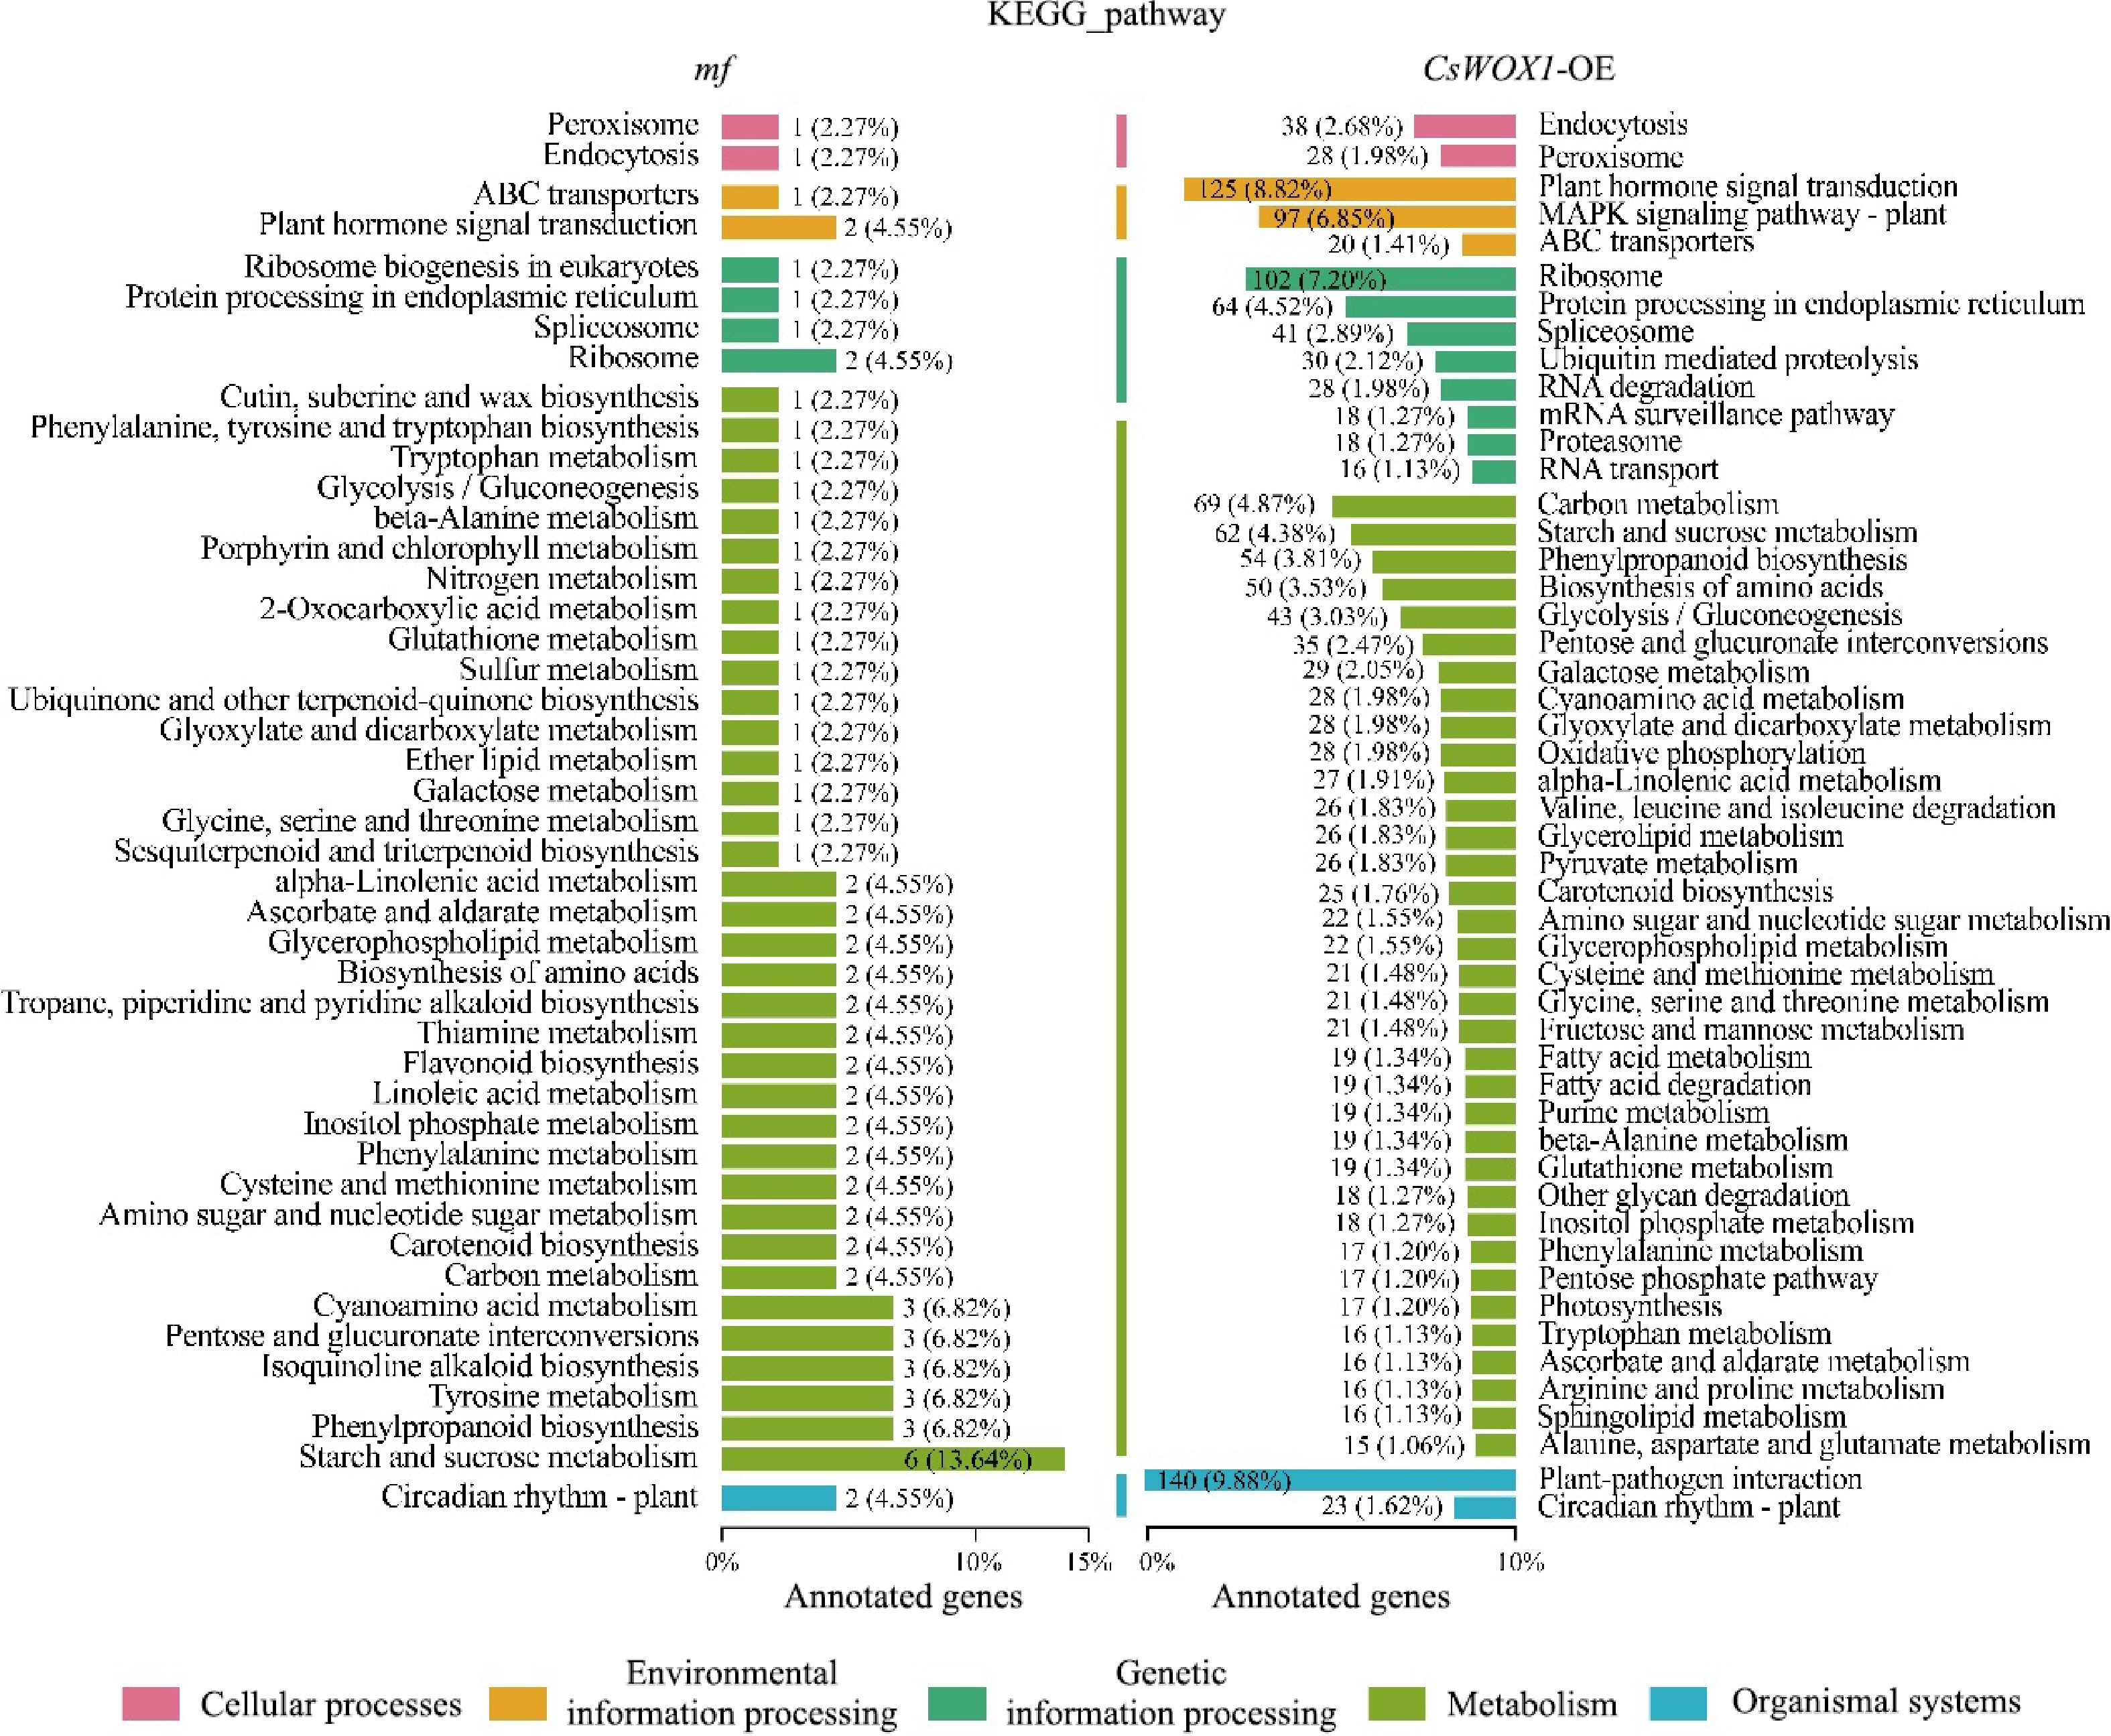
Figure 3.
KEGG pathway analysis of the DEGs from mf and CsWOX1-OE shows the number and proportion of DEGs annotated in different metabolic pathways. The KEGG pathways are categorized into five groups: cellular processes, environmental information processing, genetic information processing, metabolism, and organismal systems.
-
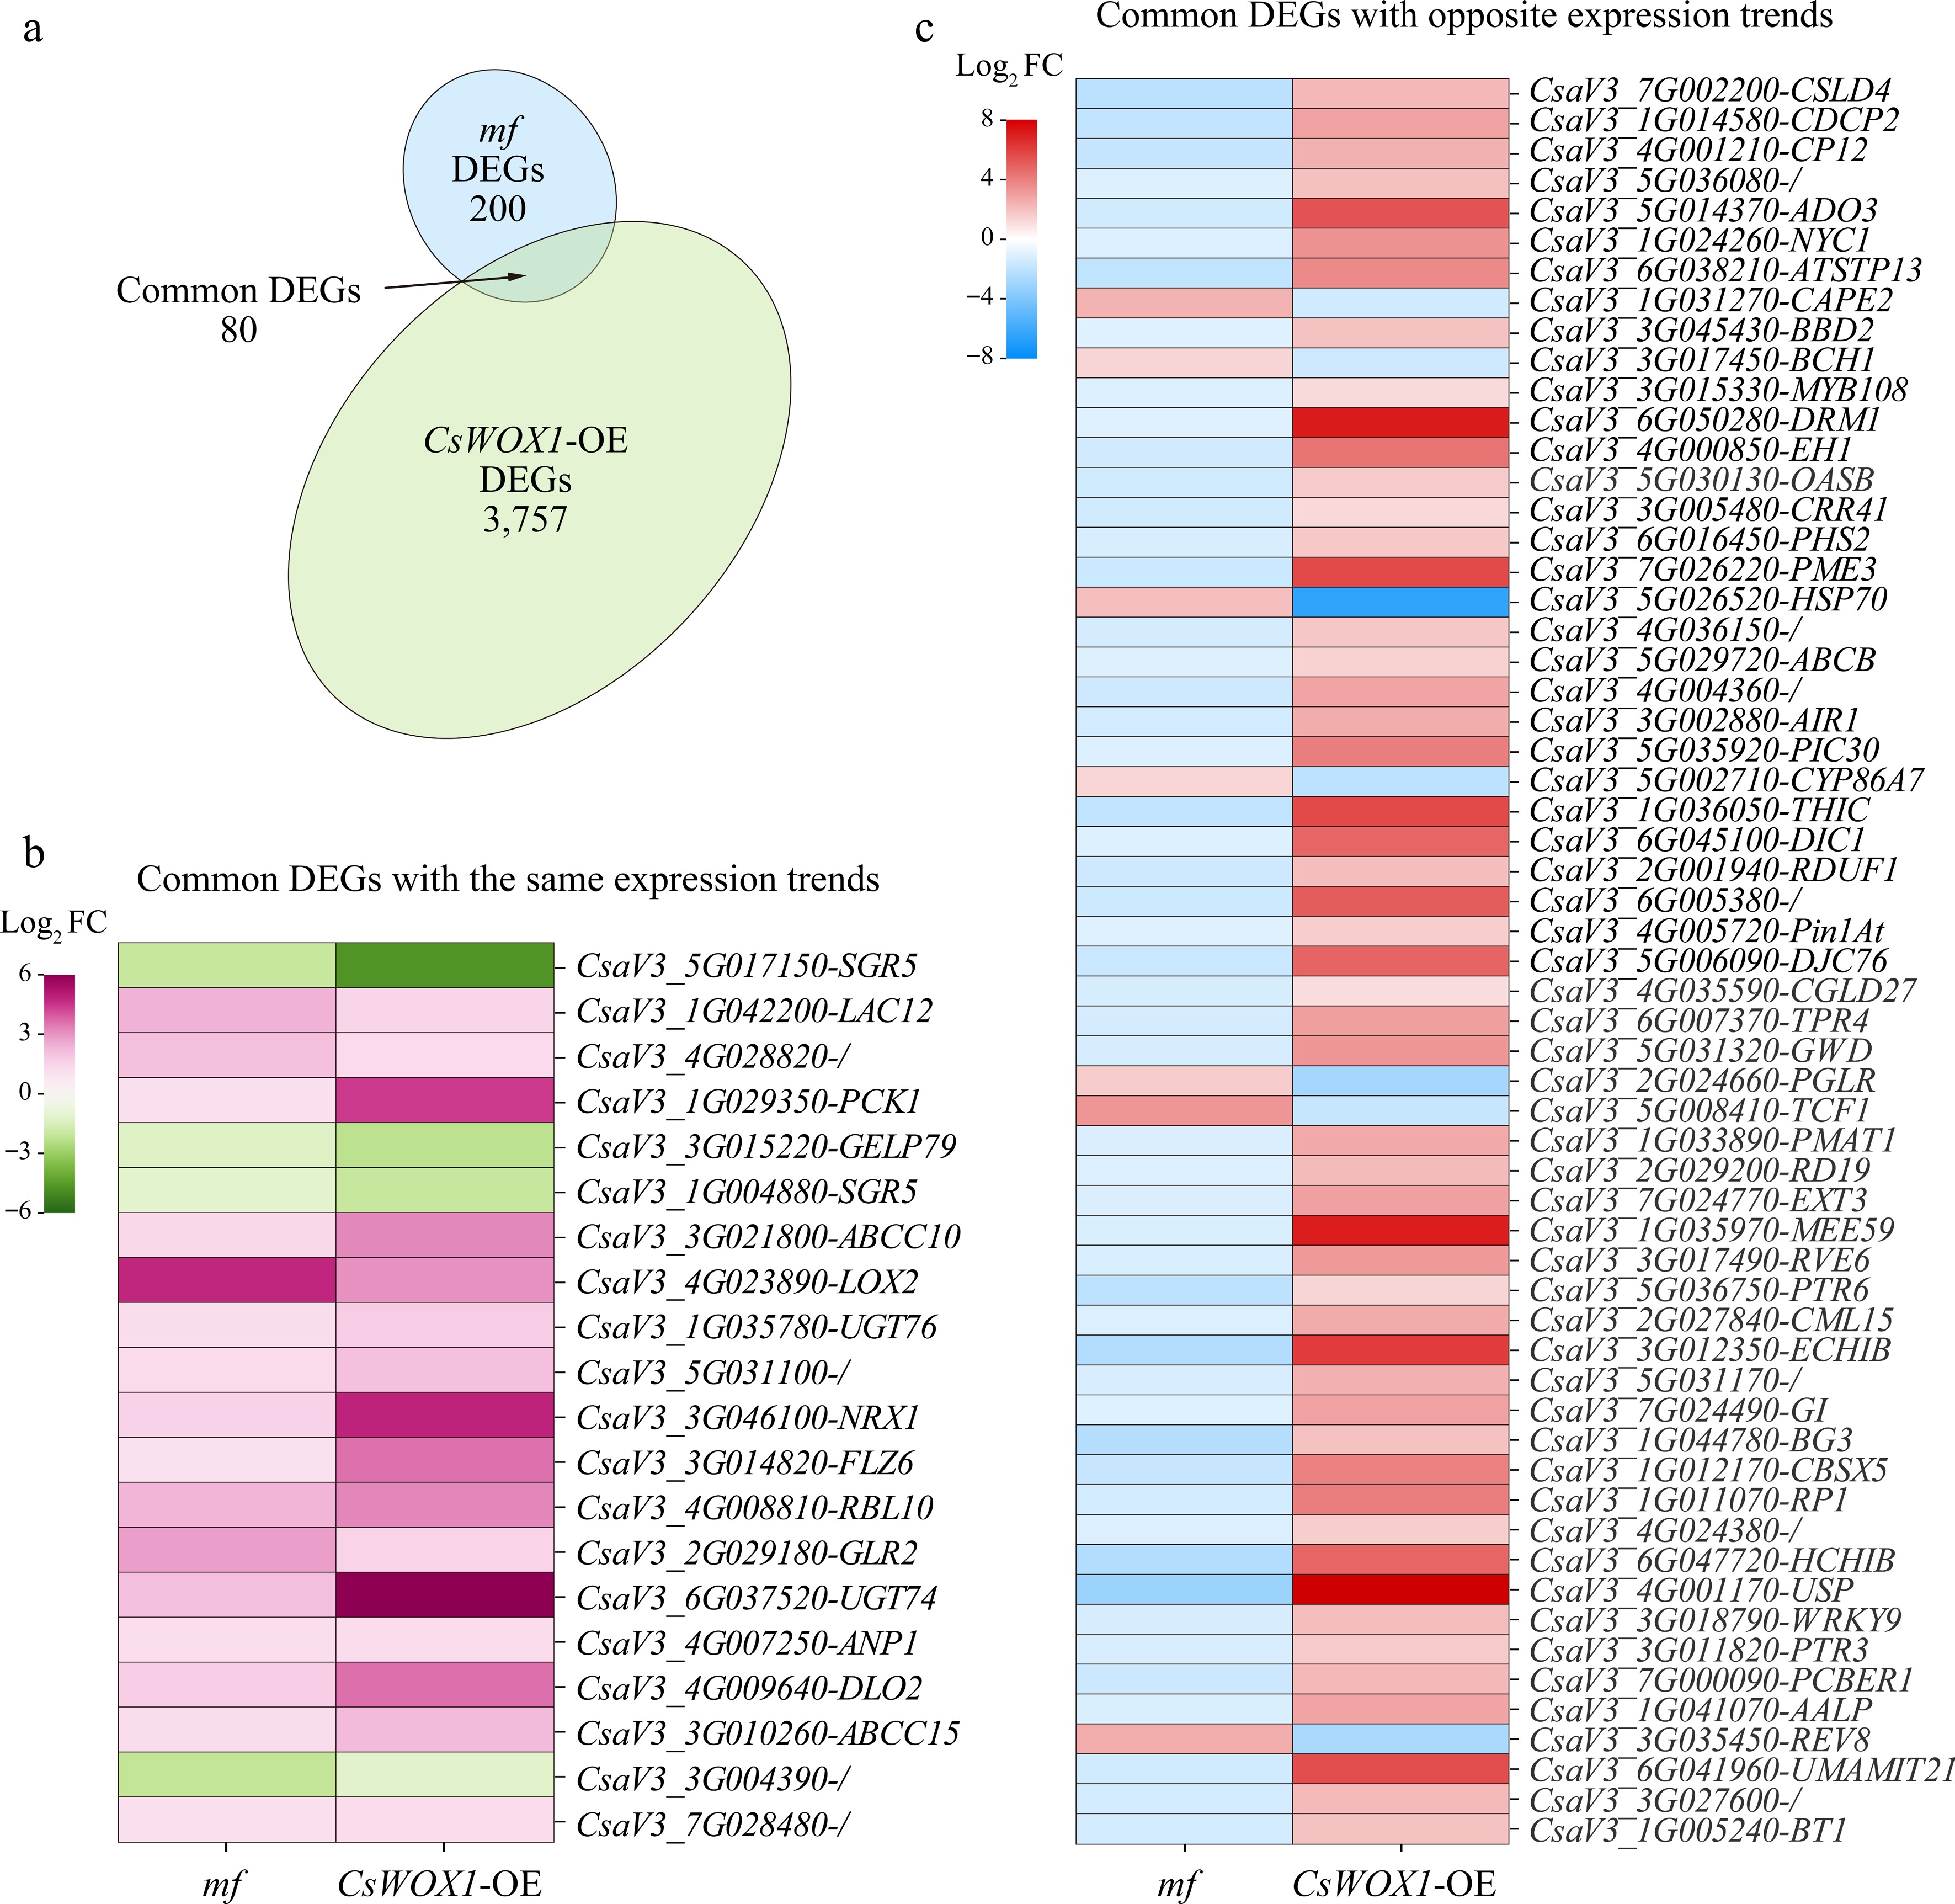
Figure 4.
Combined analysis of mf and CsWOX1-OE DEGs. (a) Identification of eight common DEGs between mf and CsWOX1-OE. (b) Heatmap of gene expression levels of 20 common DEGs with the same trend of change. (c) Heatmap of gene expression levels of 60 common DEGs with opposite trends. The colored legend positioned to the left of each map indicates fold changes (Log2 value).
-

Figure 5.
RT-qPCR analyses of (a) CsRVE6, (b) CsRVE8, (c) CsFKF1, (d) CsPin1At, (e) CsABCB, and (f) CsGI in CsWOX1-OE and mf. Significance analyses compared to WT were performed with the two-tailed Student's t-test. Different letters (a, b, c) indicate significant differences between groups (p < 0.05). The values represent the mean ± SD (n = 3).
-
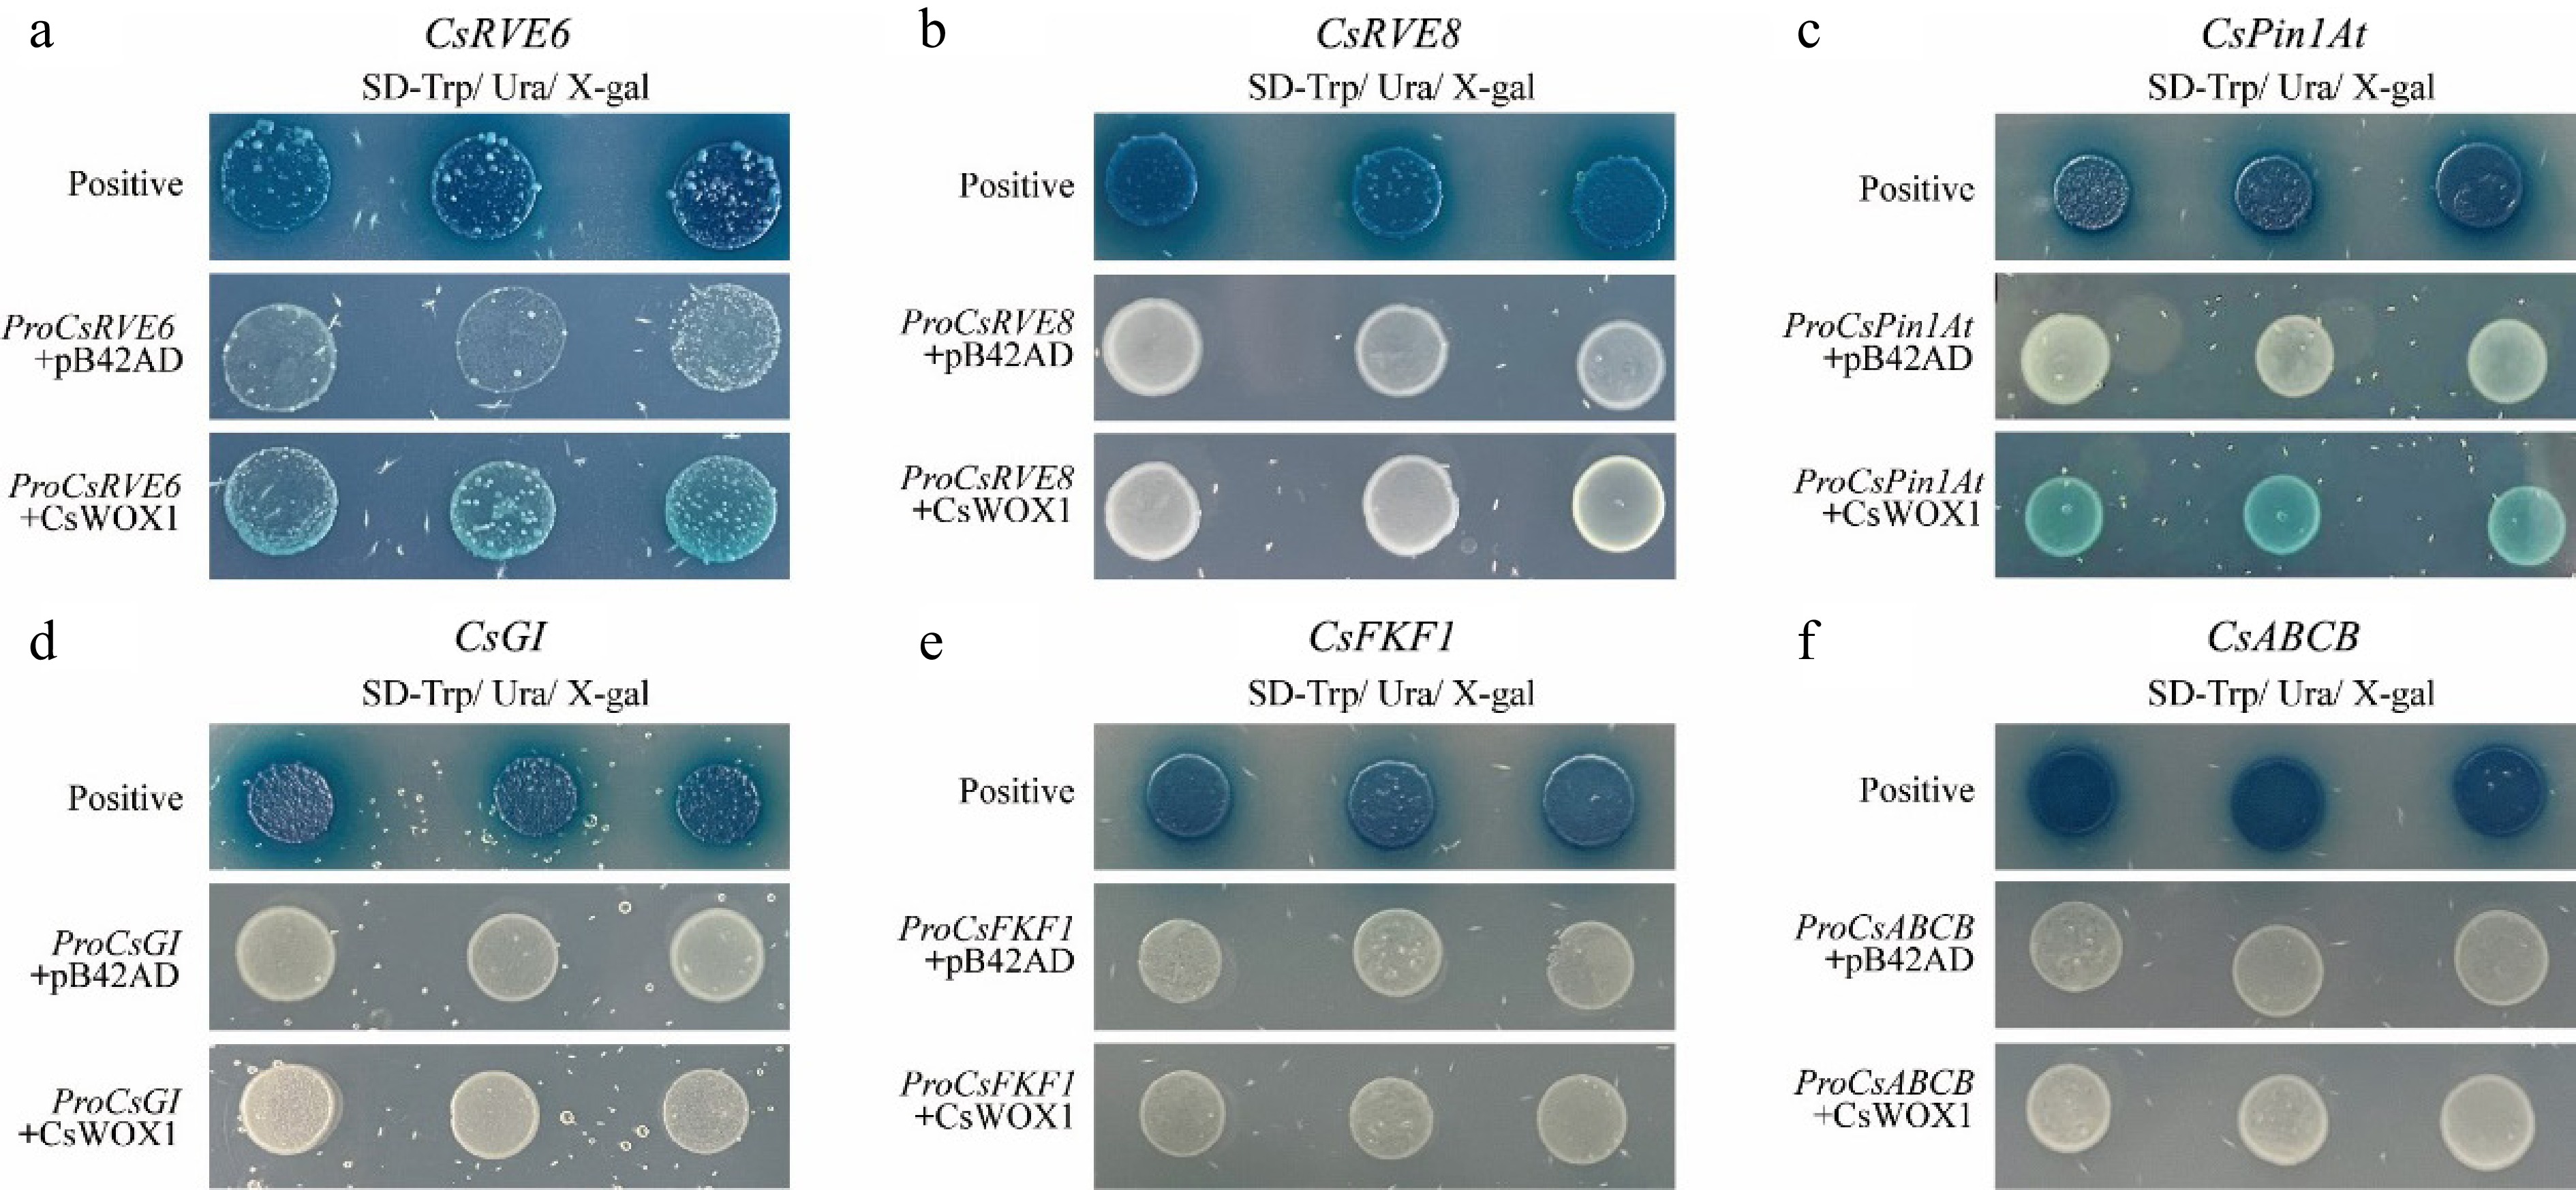
Figure 6.
Yeast-one hybrid validation between CsWOX1 transcription factors and candidate genes, which showed that CsWOX1 bound to the promoters of CsRVE6 and CsPin1At.
-
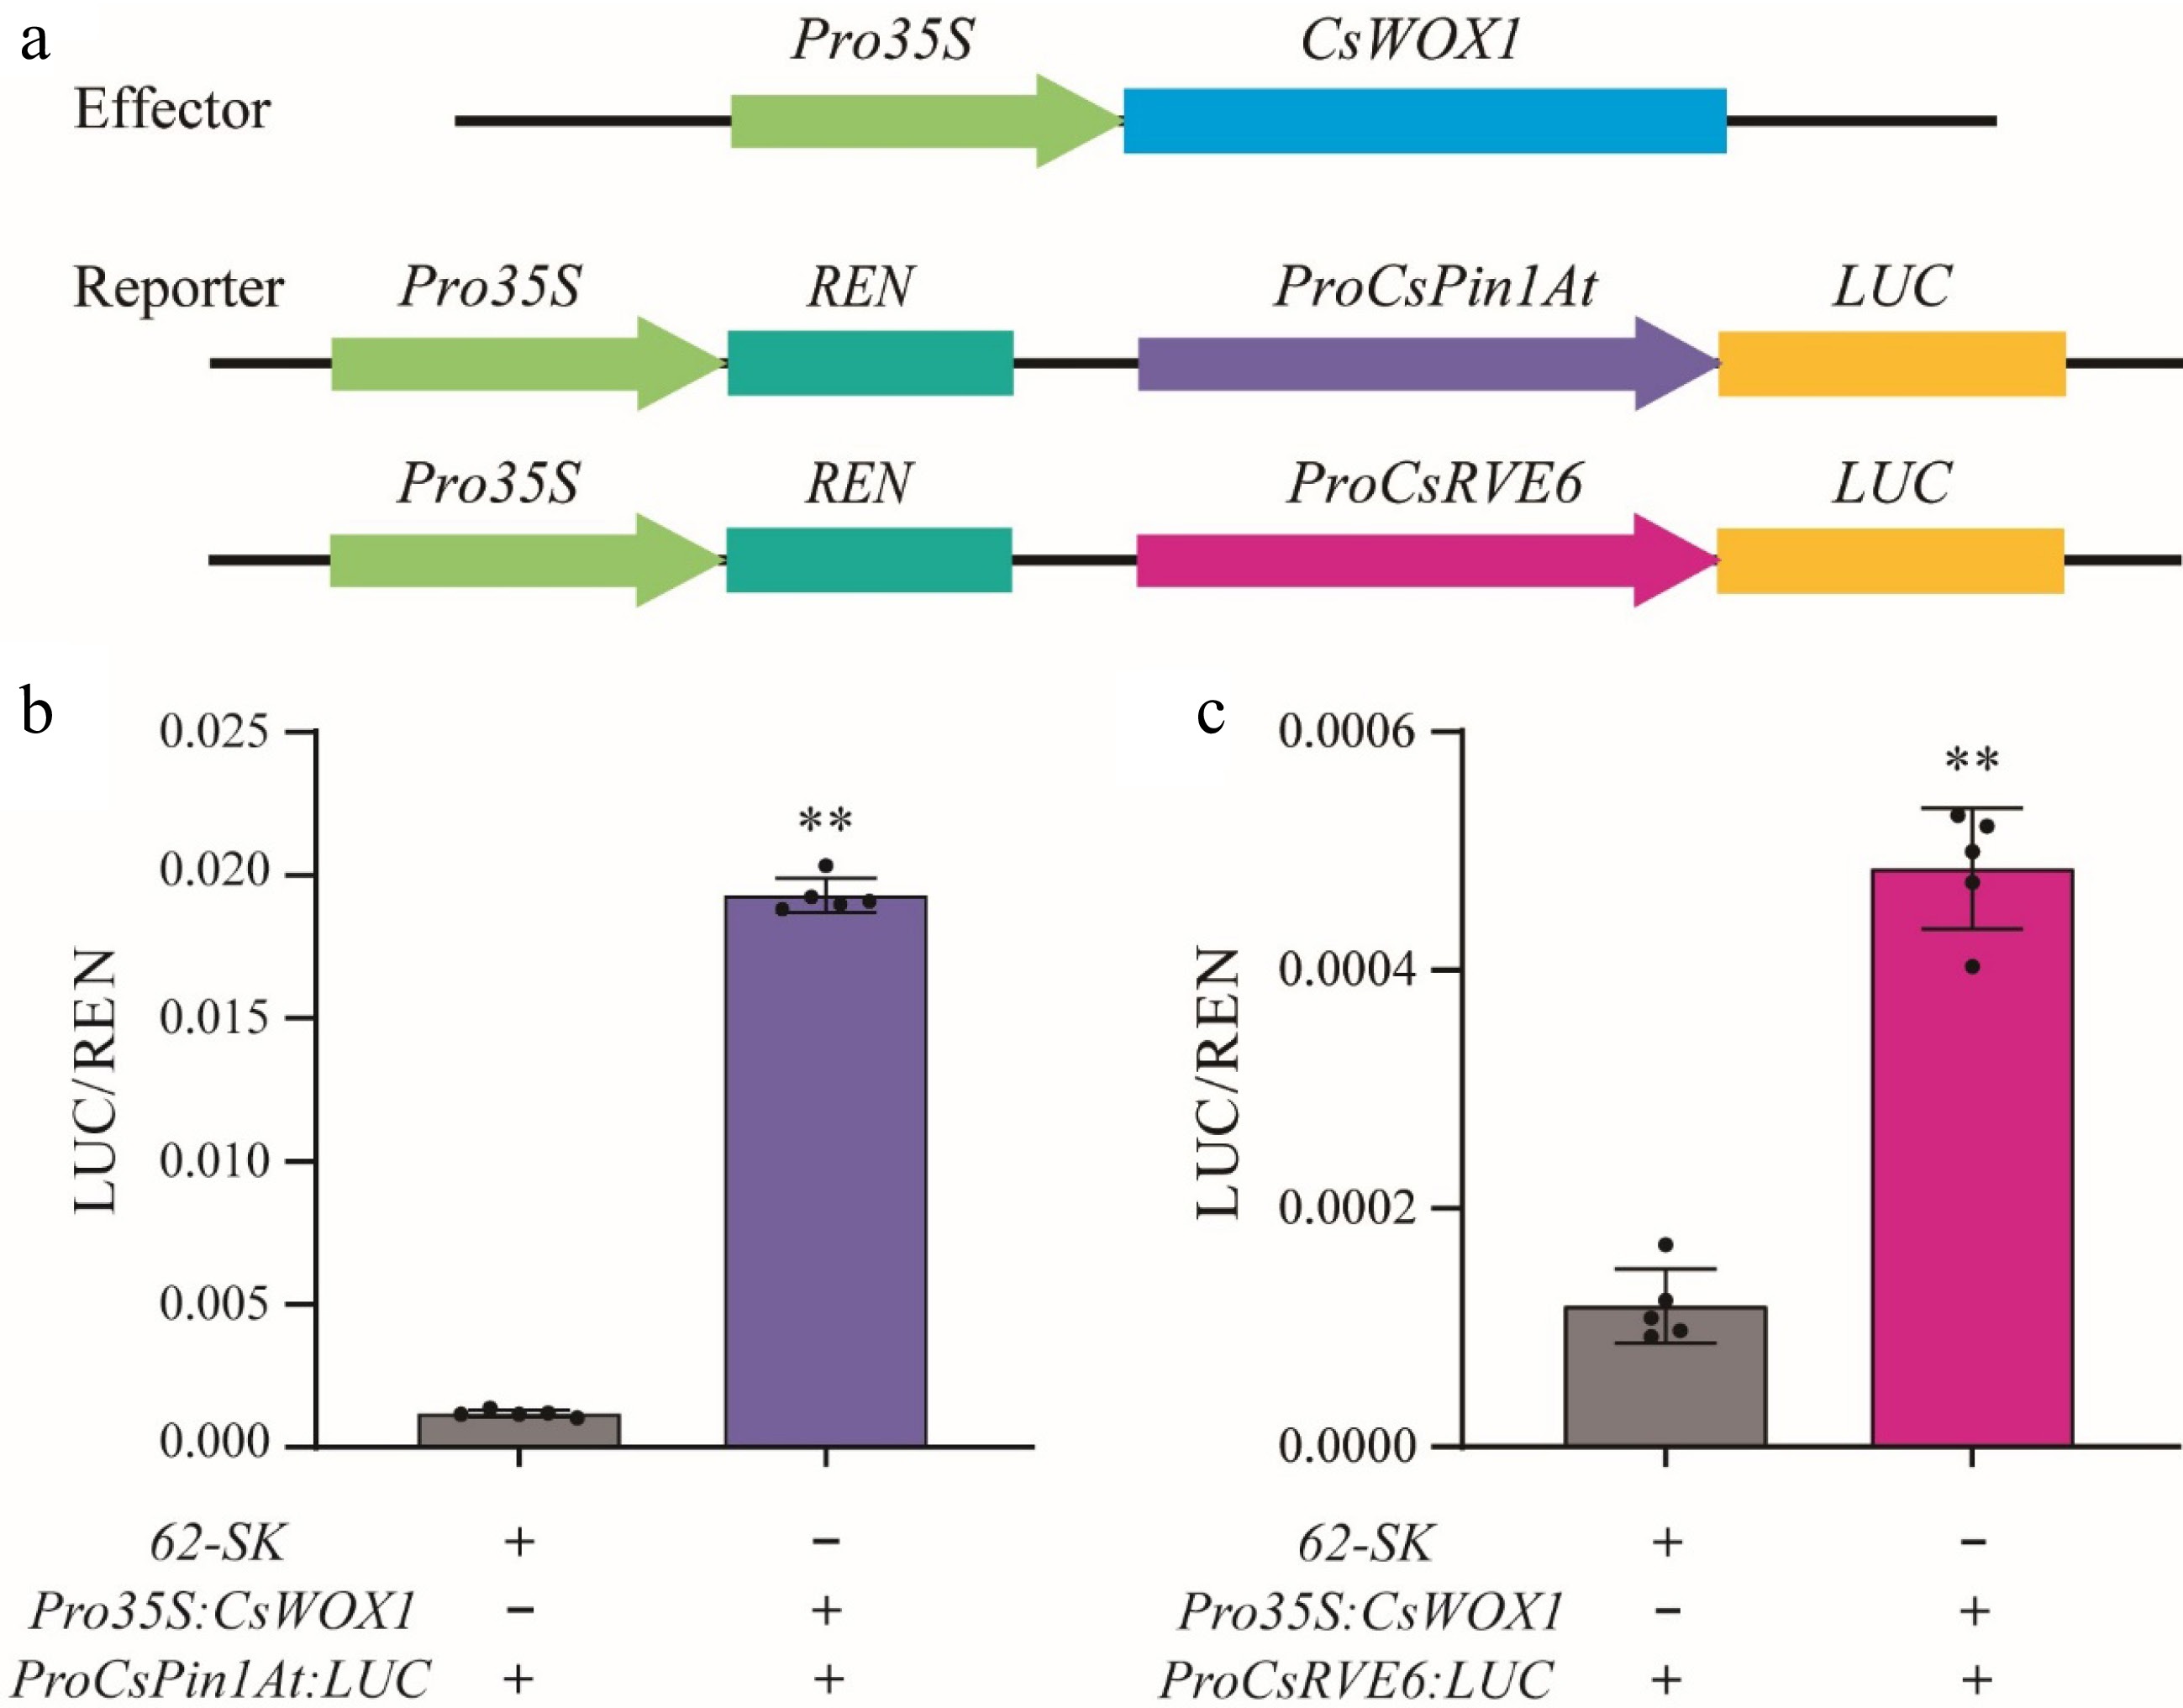
Figure 7.
CsWOX1 actives the expression of CsRVE6 and CsPin1At. (a) Structural diagram of the reporter and effector constructs used for LUC/REN assays. LUC activity measurement after transient expression of 35S:CsWOX1 with (b) ProCsPin1At:LUC and (c) ProCsRVE6:LUC in tobacco leaves. The LUC/REN ratio from the empty vector (62-SK) combined with ProCsPin1At:LUC and ProCsRVE6:LUC were used as the calibration. Two-tailed Student's t-test was performed and statistically significant differences were indicated by ** p < 0.01. Values are mean ± SD (n = 5).
-
Pathway ID Pathway name Common DEGs ko00906 Carotenoid biosynthesis CsaV3_1G014580, CsaV3_3G017450 ko04712 Circadian rhythm - plant CsaV3_5G014370, CsaV3_3G017490,
CsaV3_7G024490, CsaV3_3G035450ko00860 Porphyrin and chlorophyll
metabolismCsaV3_1G024260 ko04016 MAPK signaling pathway - plant CsaV3_1G031270, CsaV3_6G047720,
CsaV3_3G018790ko04075 Plant hormone signal transduction CsaV3_1G031270 ko04626 Plant-pathogen interaction CsaV3_1G031270, CsaV3_2G029200,
CsaV3_2G027840, CsaV3_3G018790ko00590 Arachidonic acid metabolism CsaV3_4G000850 ko04146 Peroxisome CsaV3_4G000850 ko00270 Cysteine and methionine metabolism CsaV3_5G030130 ko00920 Sulfur metabolism CsaV3_5G030130 ko01200 Carbon metabolism CsaV3_5G030130 ko01230 Biosynthesis of amino acids CsaV3_5G030130 ko00500 Starch and sucrose metabolism CsaV3_6G016450, CsaV3_1G044780 ko00040 Pentose and glucuronate interconversions CsaV3_7G026220, CsaV3_2G024660 ko03040 Spliceosome CsaV3_5G026520 ko04141 Protein processing in endoplasmic
reticulumCsaV3_5G026520 ko04144 Endocytosis CsaV3_5G026520, CsaV3_7G024770 ko02010 ABC transporters CsaV3_5G029720 ko00073 Cutin, suberine and wax biosynthesis CsaV3_5G002710 ko00730 Thiamine metabolism CsaV3_1G036050 ko04120 Ubiquitin mediated proteolysis CsaV3_5G008410 ko00943 Isoflavonoid biosynthesis CsaV3_1G033890 ko00944 Flavone and flavonol biosynthesis CsaV3_1G033890 ko00071 Fatty acid degradation CsaV3_3G012350 ko03008 Ribosome biogenesis in eukaryotes CsaV3_5G031170 ko00520 Amino sugar and nucleotide sugar metabolism CsaV3_6G047720 Table 1.
Joint KEGG pathway analysis of common DEGs in CsWOX1-OE and mf.
Figures
(7)
Tables
(1)