-
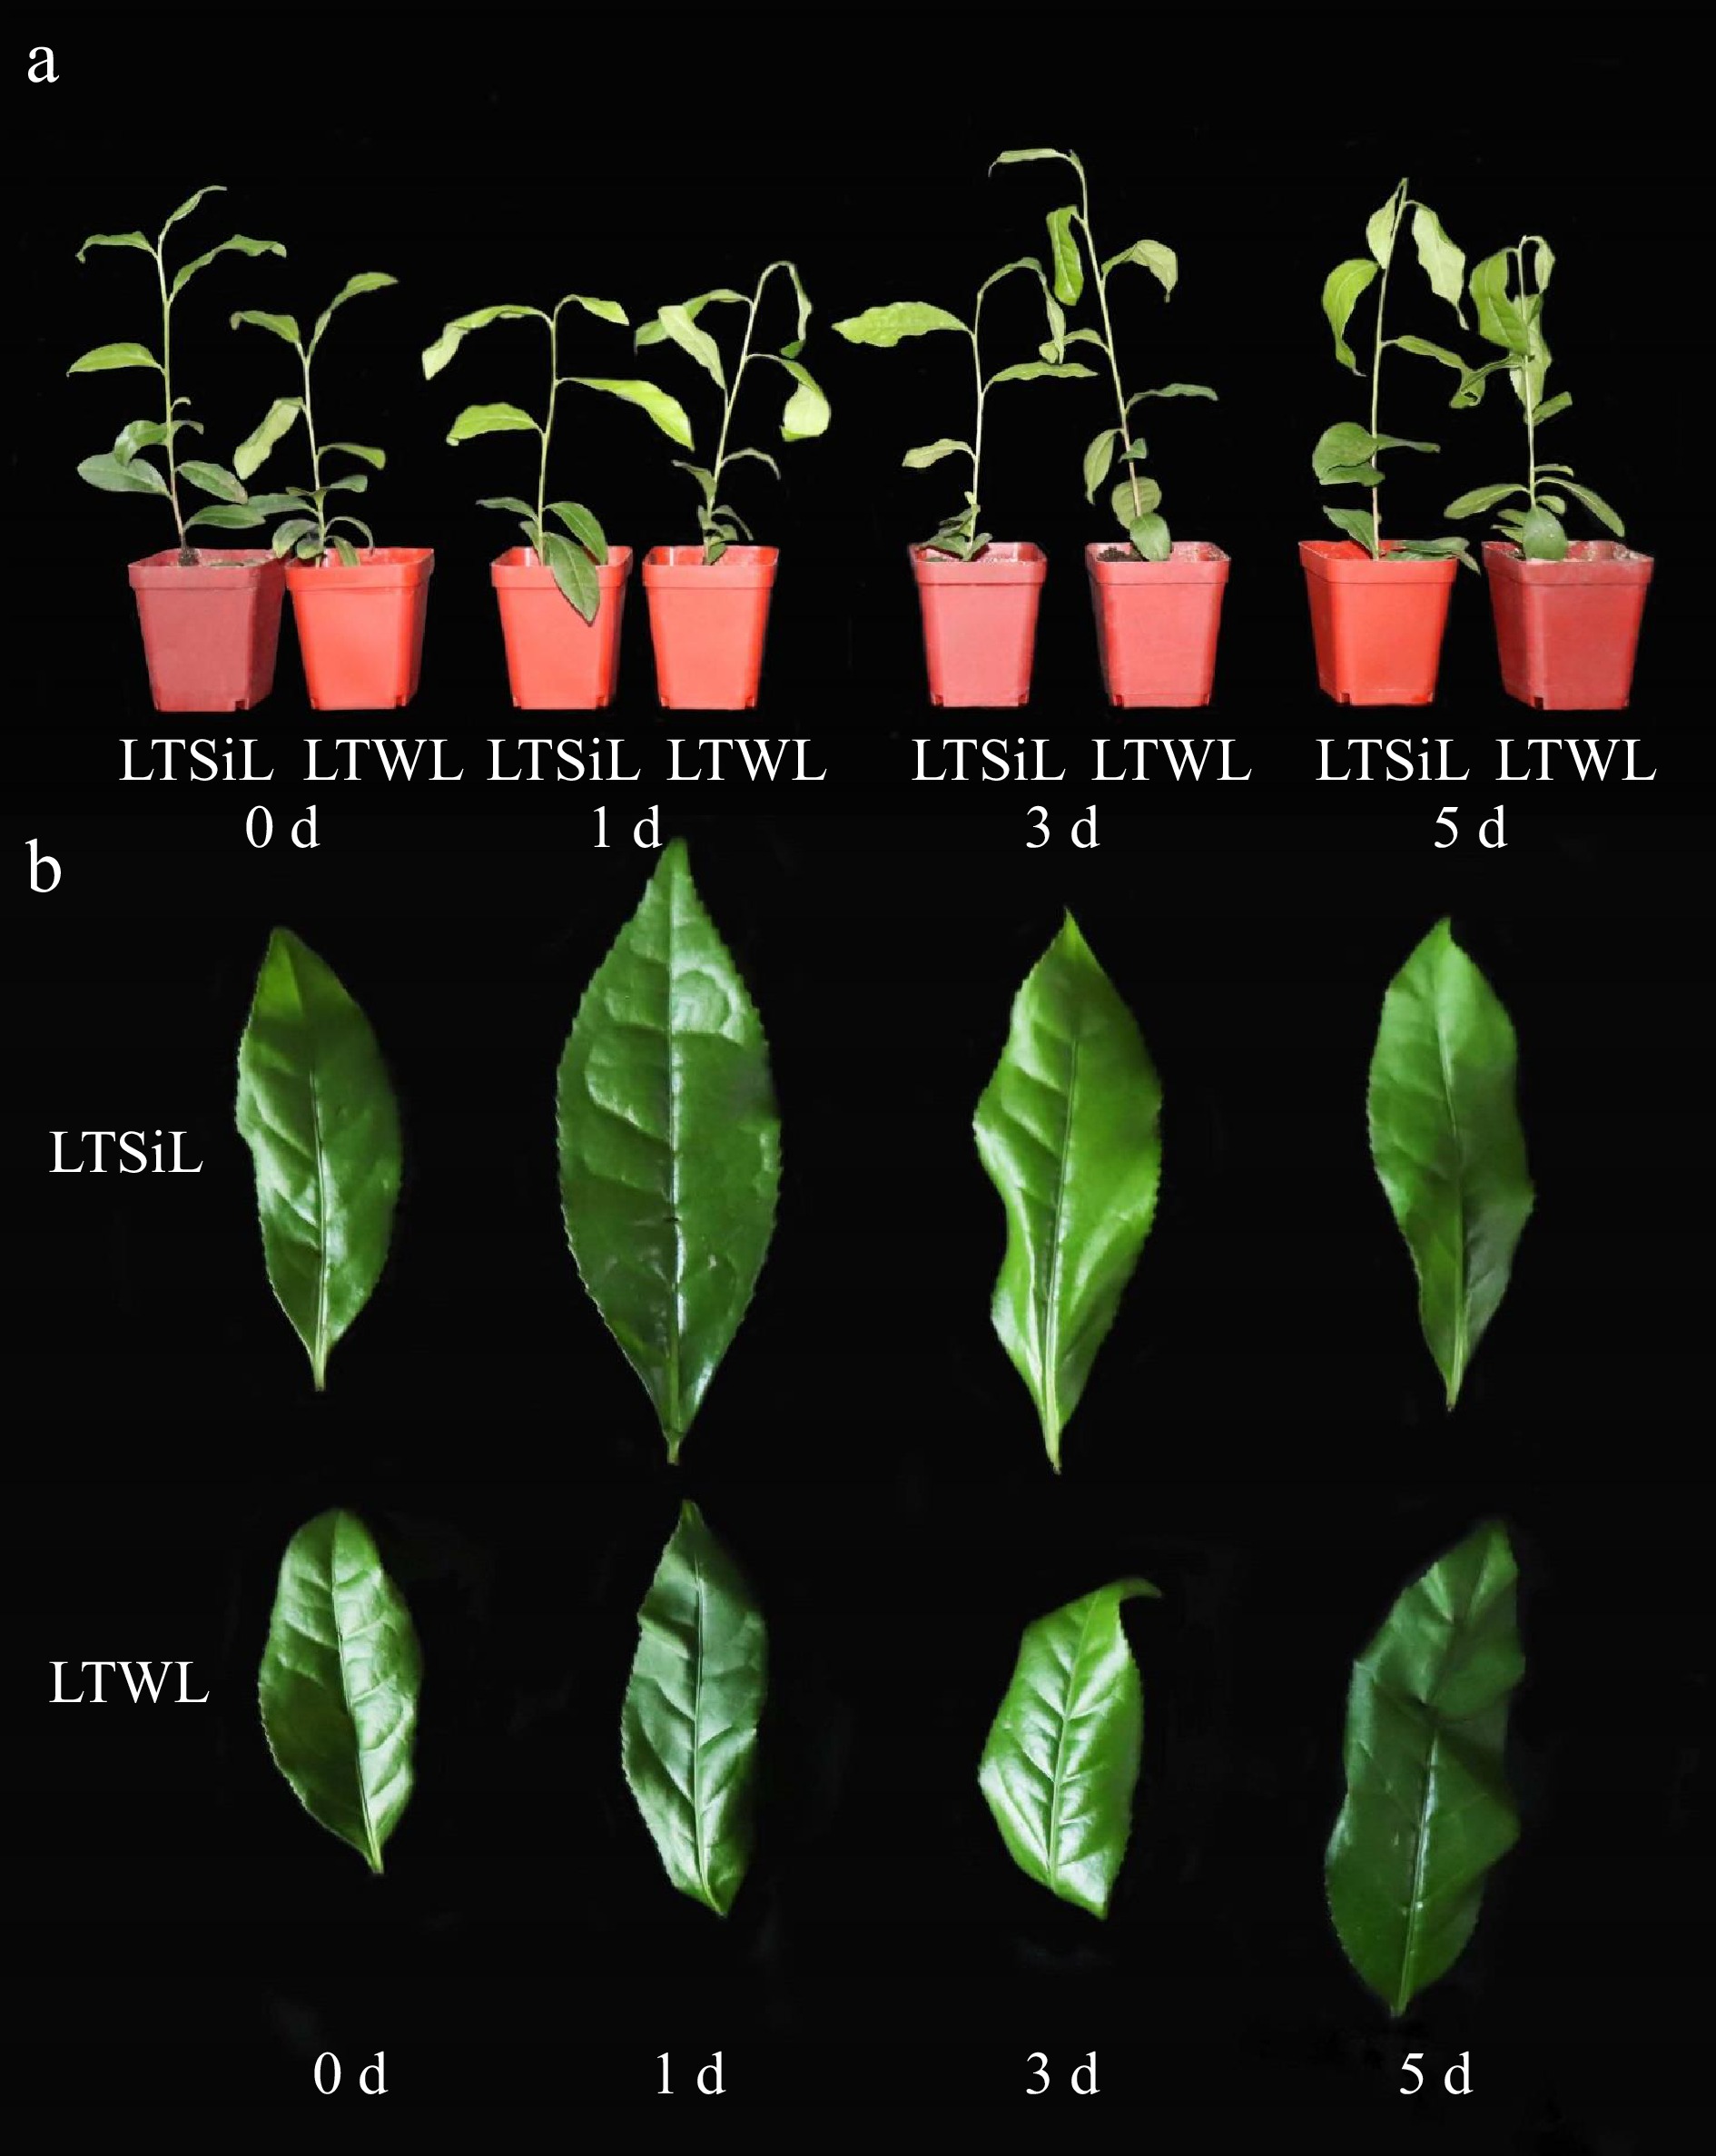
Figure 1.
Effects of silicon-amelioration on tea plant in 1, 3, and 5 d under 4 °C. (a) Effects on whole plant growth. (b) Effects on leaf development. LTSiL: the leaves with silicon-amelioration under 4 °C; LTWL: the leaves without silicon-amelioration under 4 °C.
-
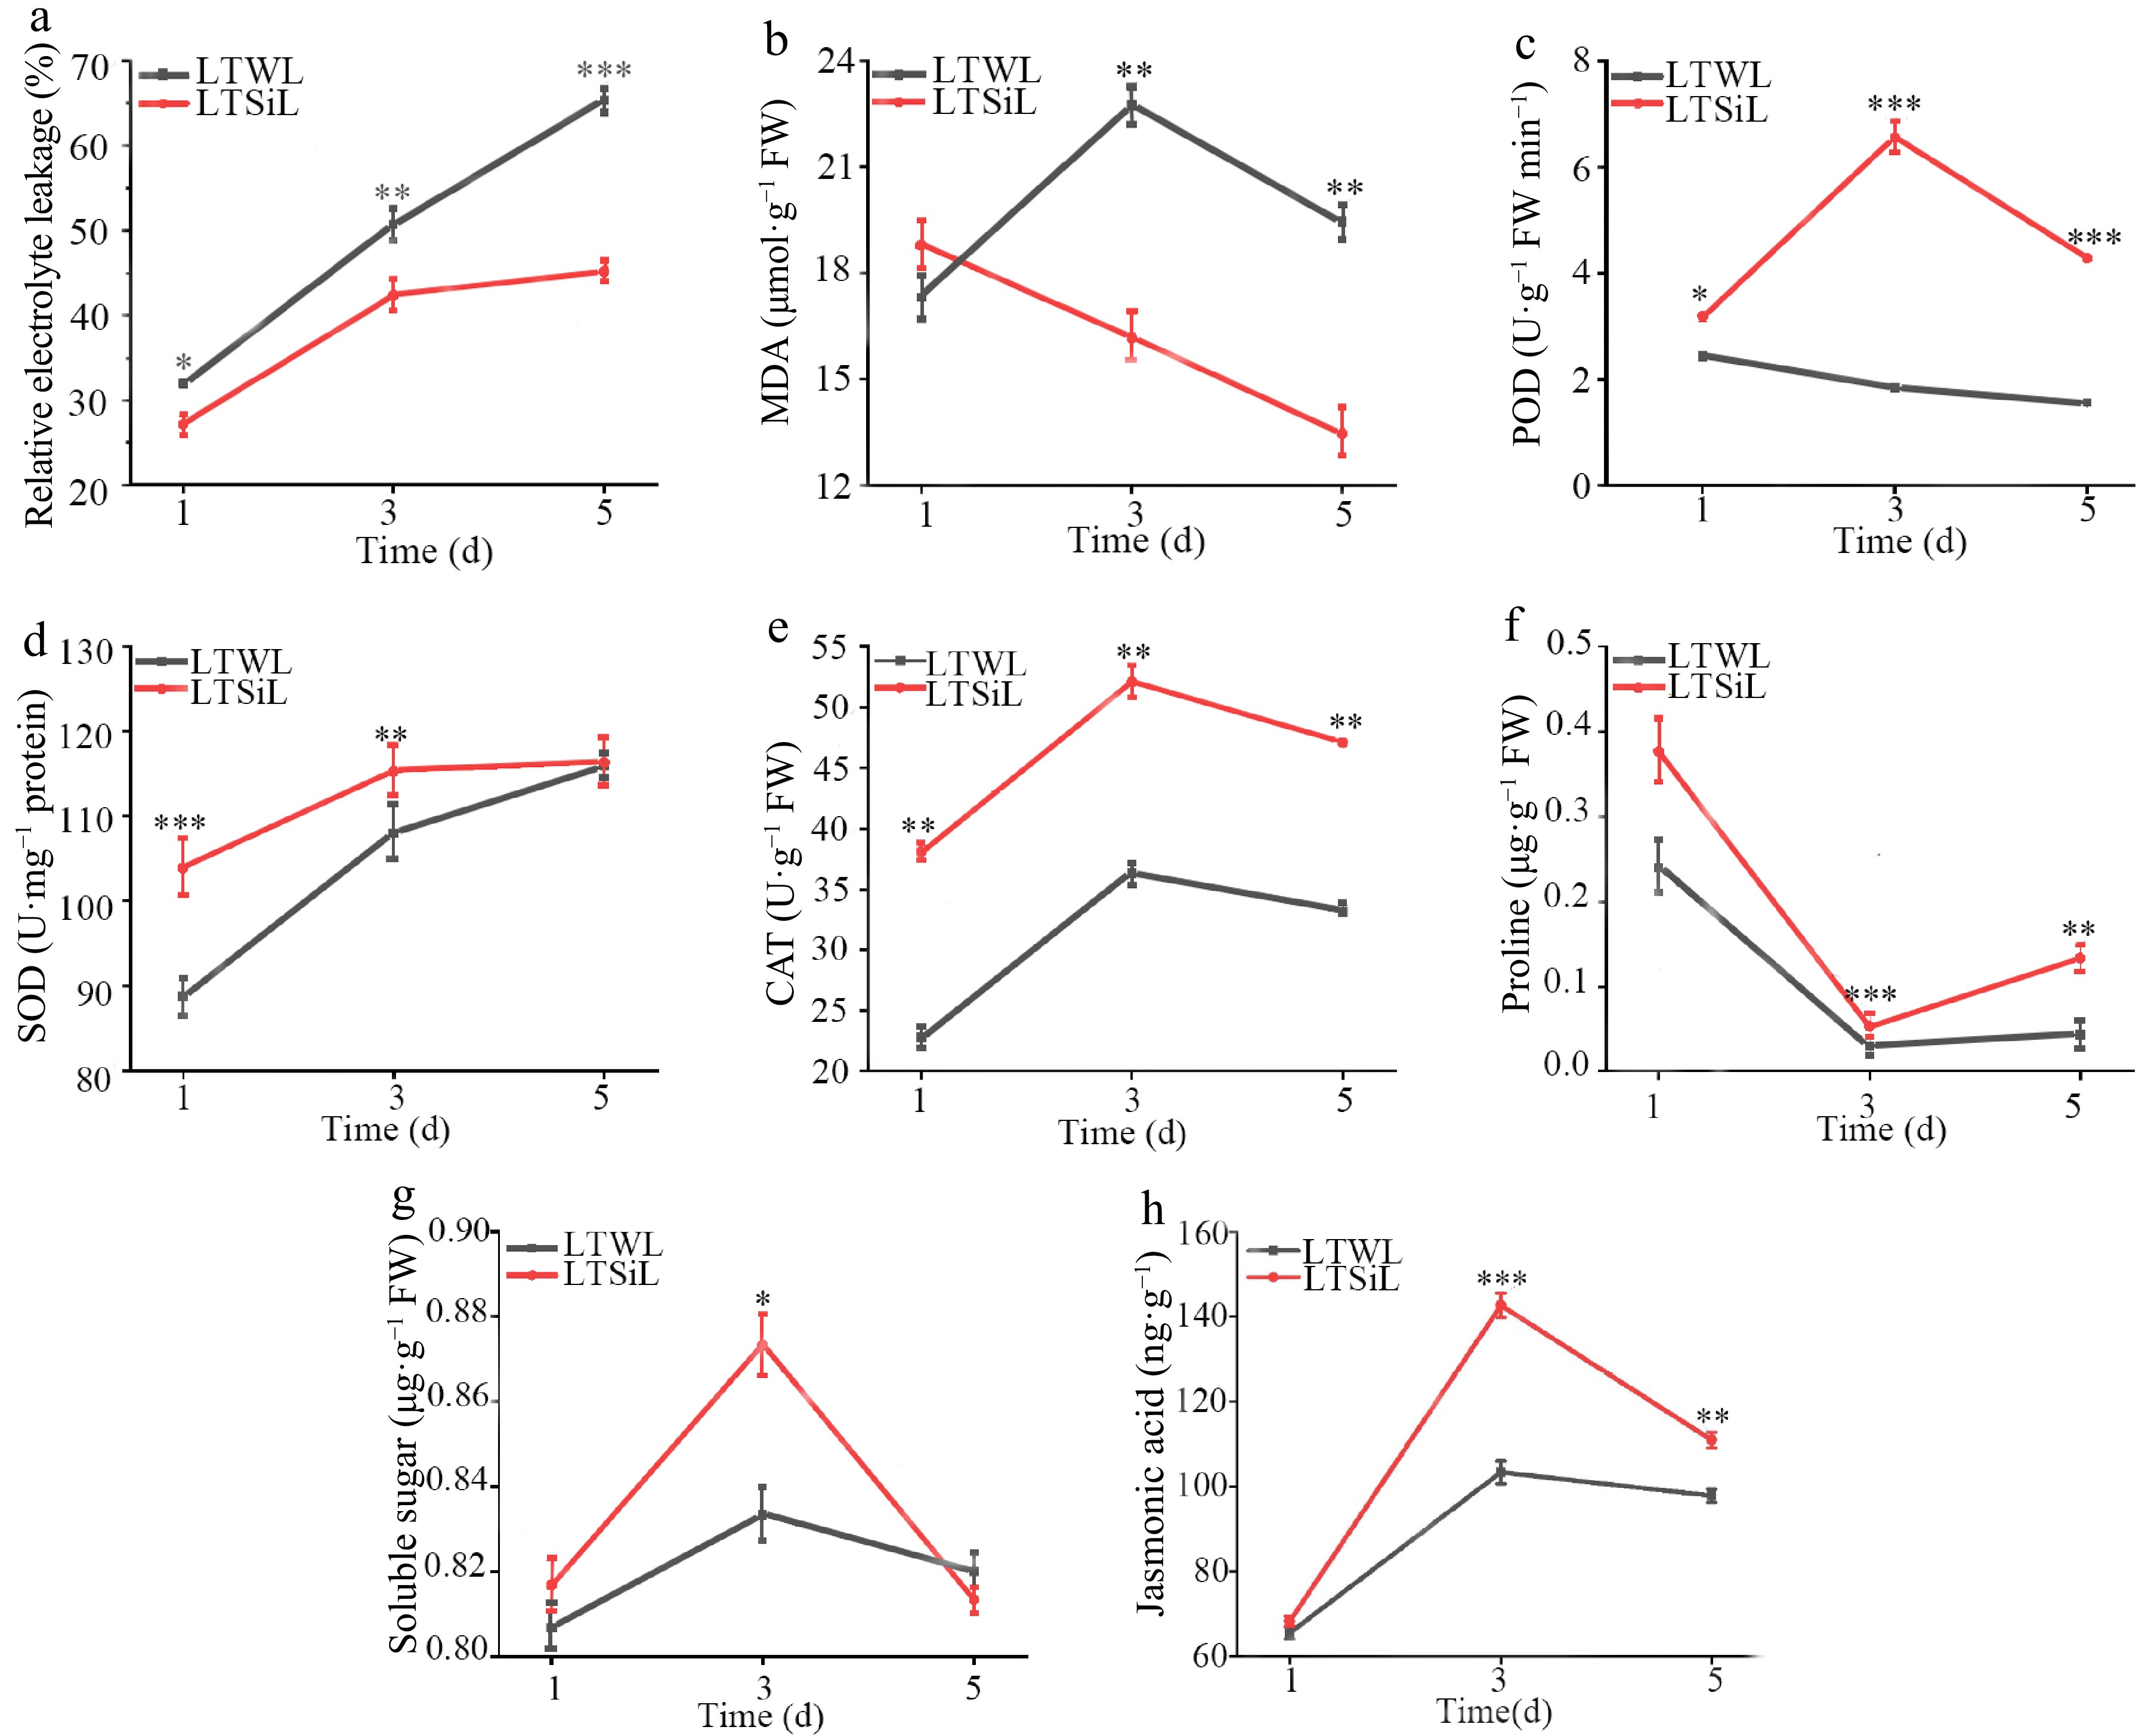
Figure 2.
Physiological changes in the leaves of tea plants with / without silicon-amelioration under 4 °C. (a) Relative electrolyte leakage (REL) values. (b) Malondialdehyde (MDA) content. (c) Peroxidase (POD) activity. (d) Superoxide dismutase (SOD) activity. (e) Catalase (CAT) activity. (f) Proline content. (g) Soluble sugar content. (h) JA content. LTSiL: the leaves with silicon-amelioration under 4 °C; LTWL: the leaves without silicon-amelioration under 4 °C. X-axis of (a)−(g) represents cold stress time. Y-axis of (a)−(g) represents substance content. The error bars represent means ± SD from three replicates.
-
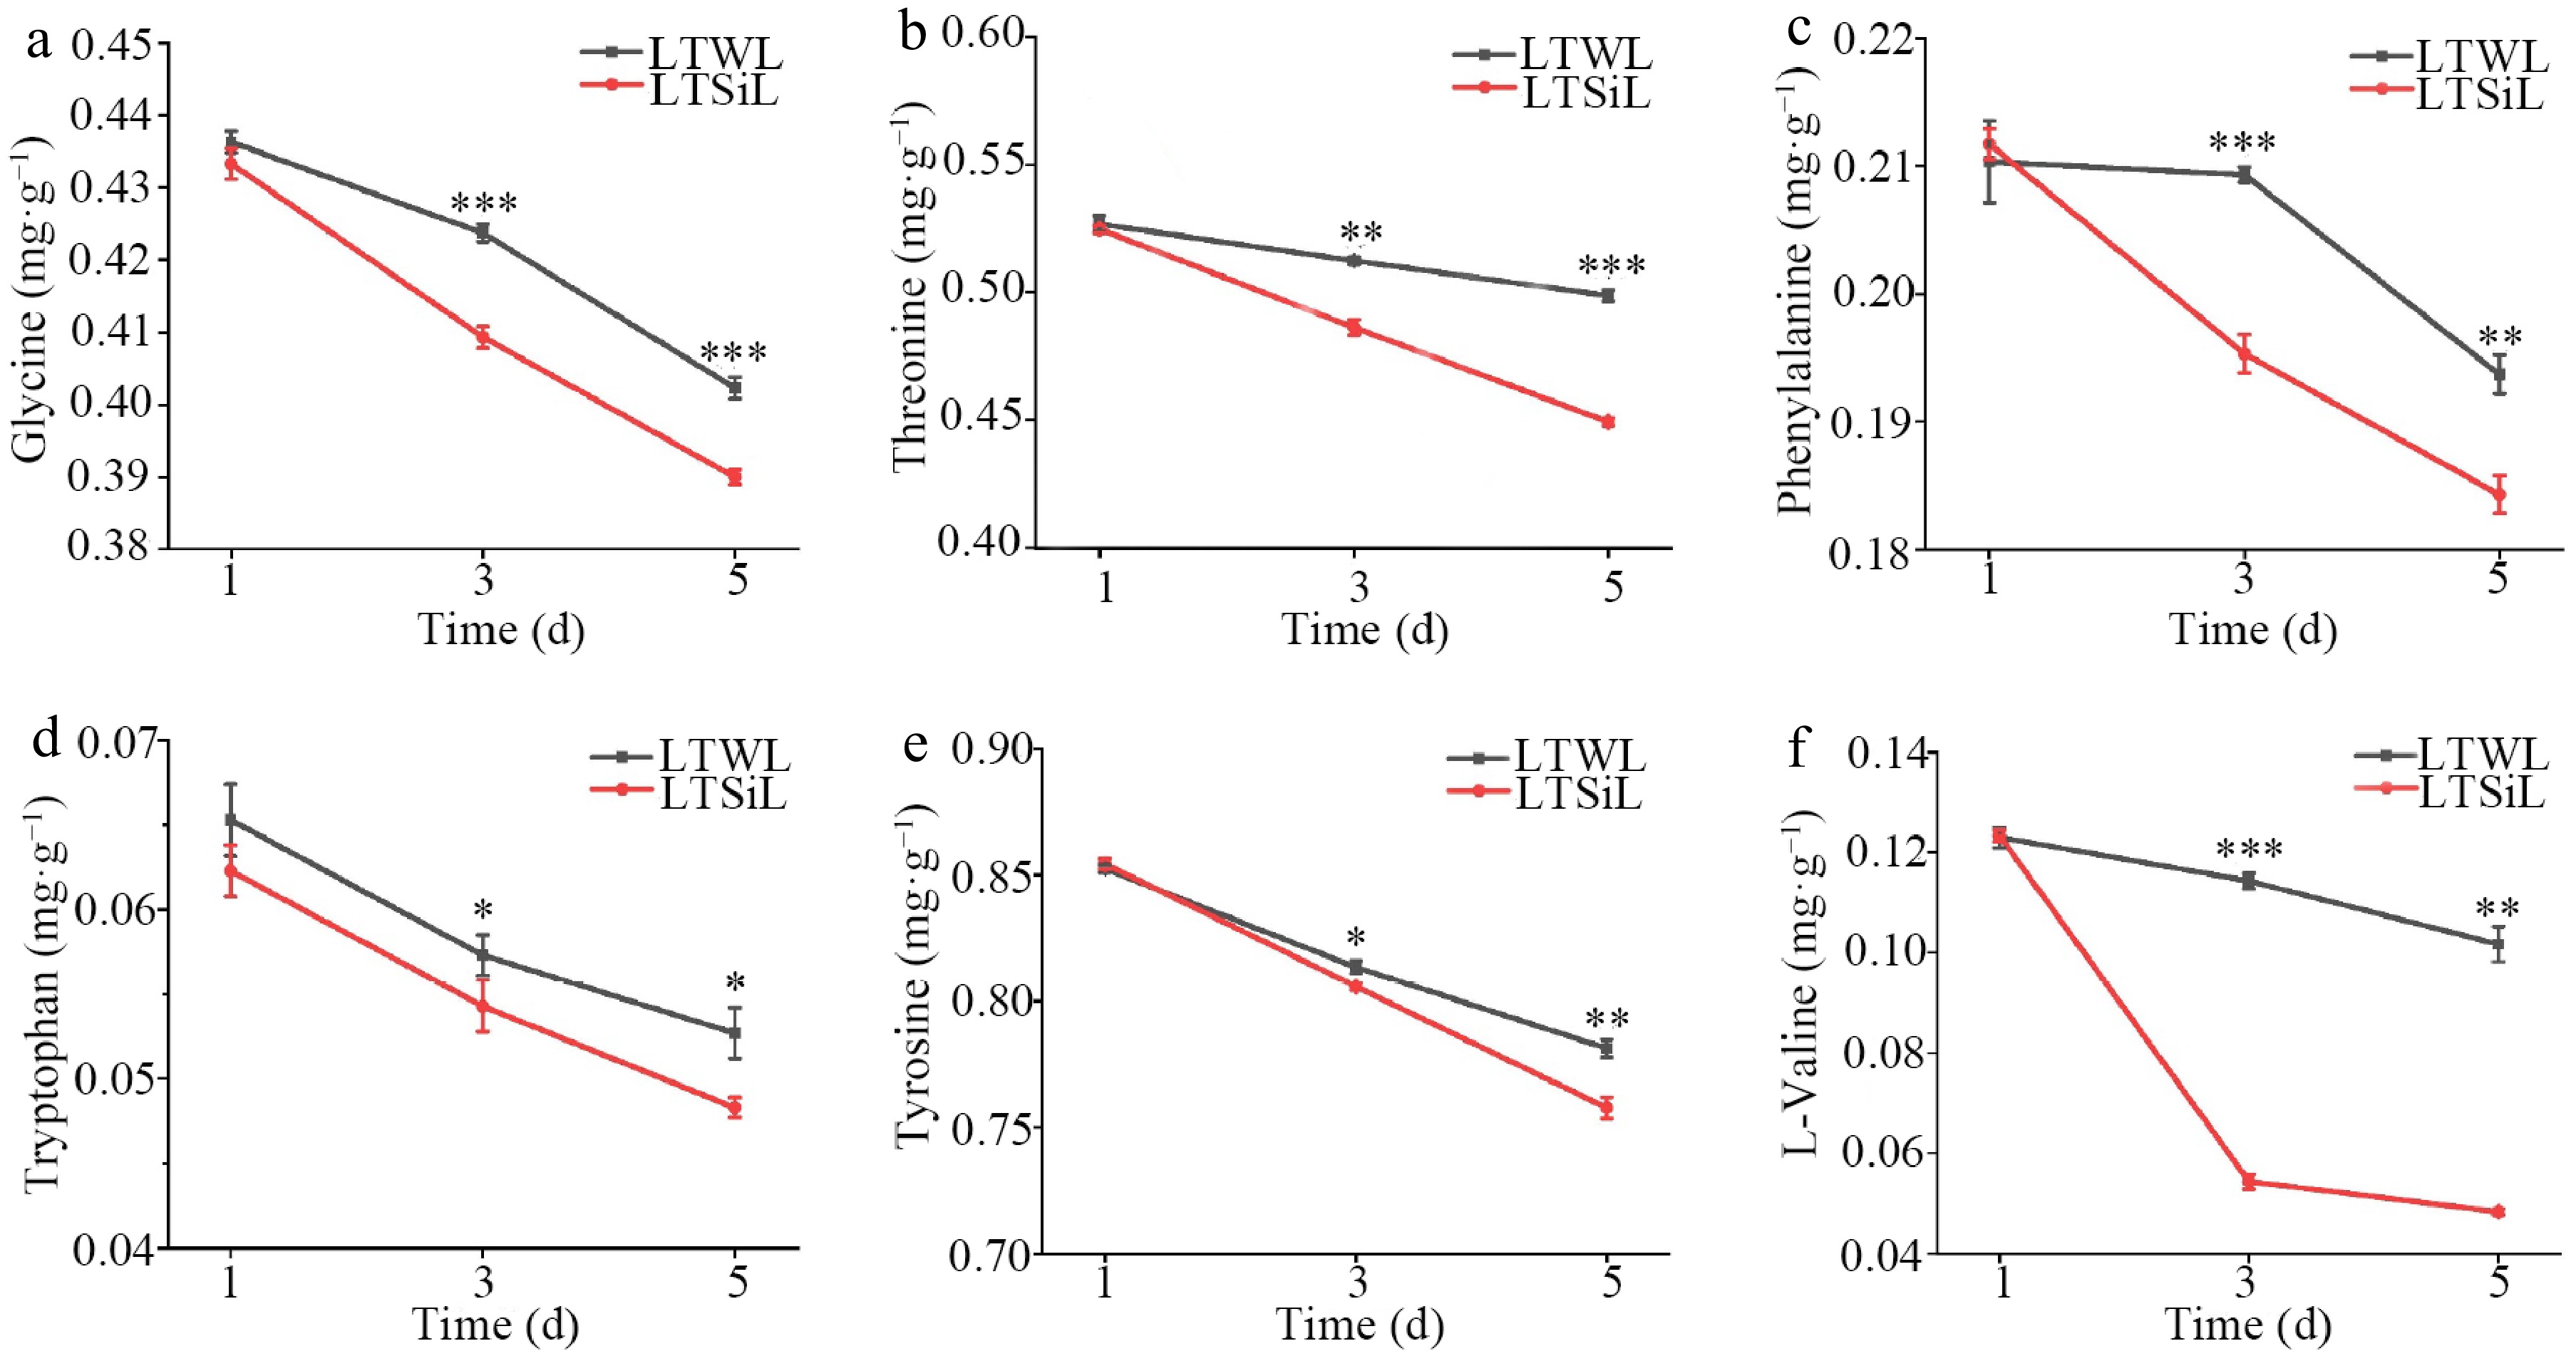
Figure 3.
Amino acids associated with physiological changes in the leaves of tea plants with / without silicon-amelioration under 4 °C. (a) Glycine (Gly) content. (b) Threonine (Thr) content. (c) Phenylalanine (Phe) content. (d) Tryptophan (Trp) content. (e) Tyrosine (Tyr) content. (f) Valine (Val) content. LTSiL: the leaves with silicon-amelioration under 4 °C; LTWL: the leaves without silicon-amelioration under 4 °C. X-axis of (a)−(h) represents cold stress time. Y-axis of (a)-(g) represents substance content. The error bars represent means ± SD from three replicates.
-
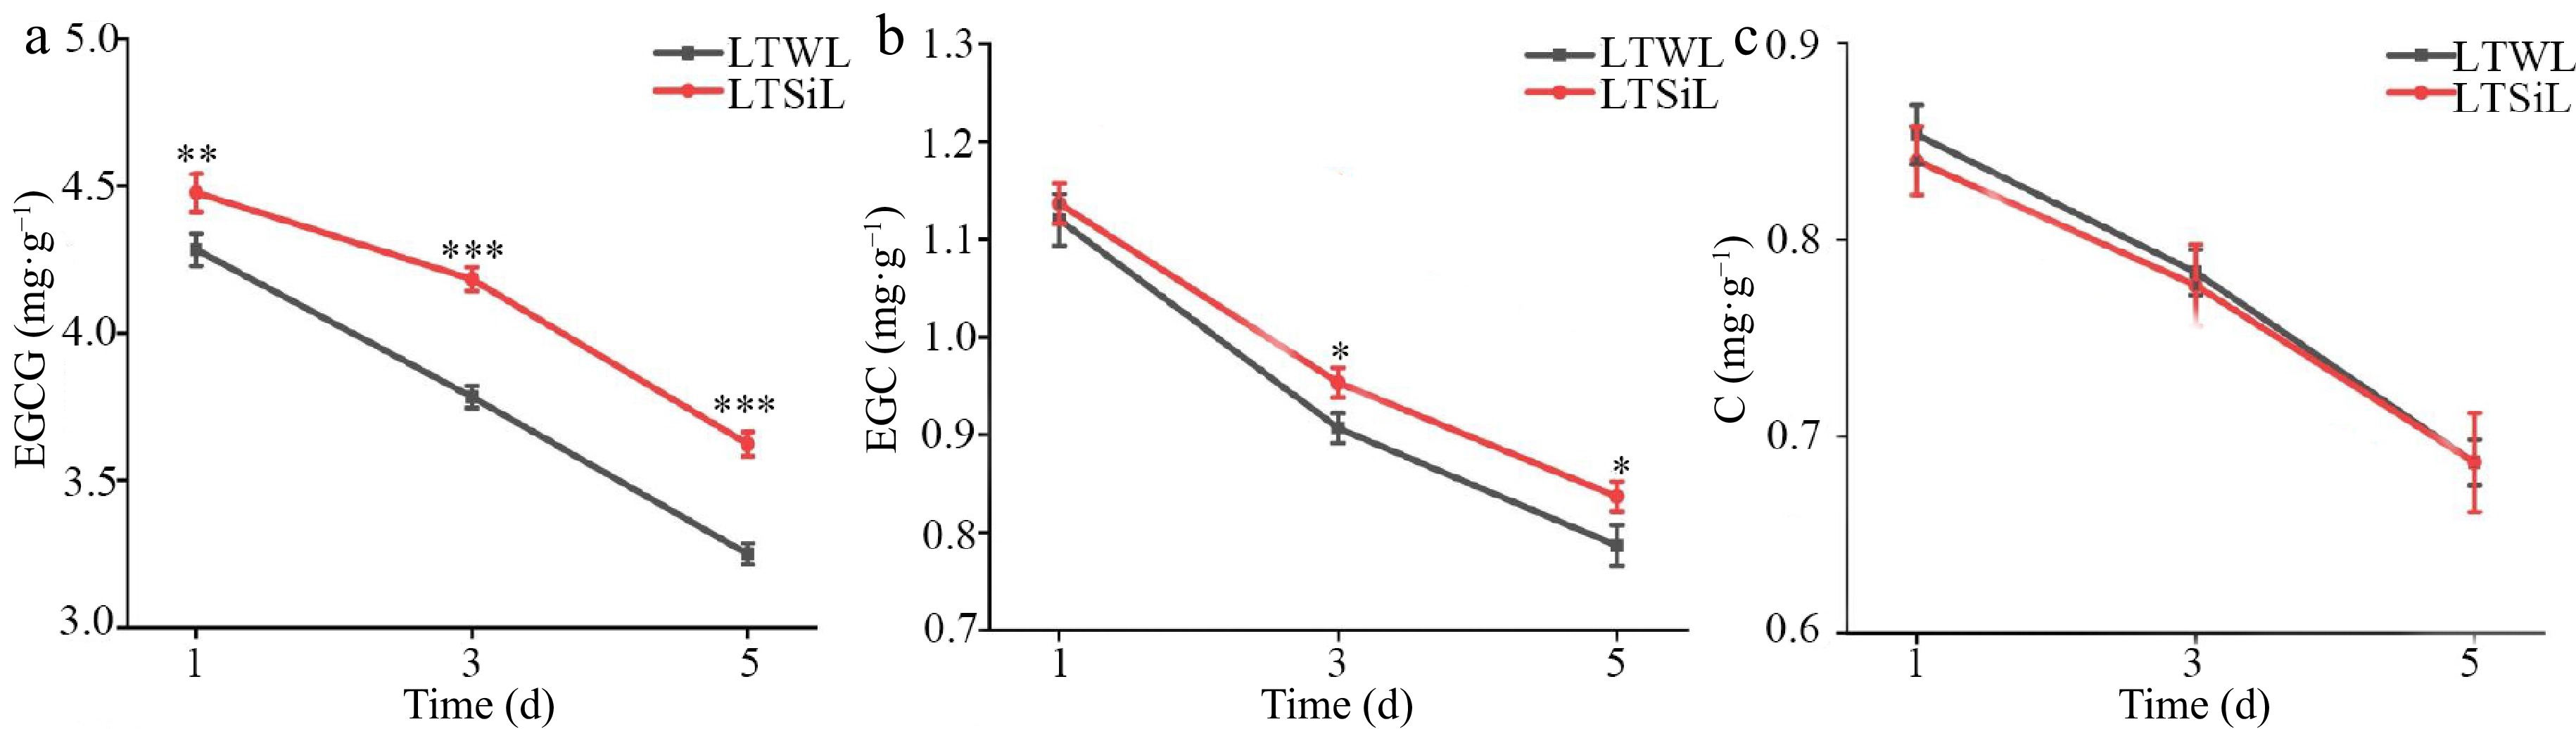
Figure 4.
Catechin associated with physiological changes in the leaves of tea plants with / without silicon-amelioration under 4 °C. (a) Epigallocatechin Gallate (EGCG) content. (b) Epicatechin Gallate (EGC) content. (c) Catechin (C) content. LTSiL: the leaves with silicon-amelioration under 4 °C; LTWL: the leaves without silicon-amelioration under 4 °C. X-axis of (a)−(f) represents cold stress time. Y-axis of (a)-(g) represents substance content. The error bars represent means ± SD from three replicates.
-
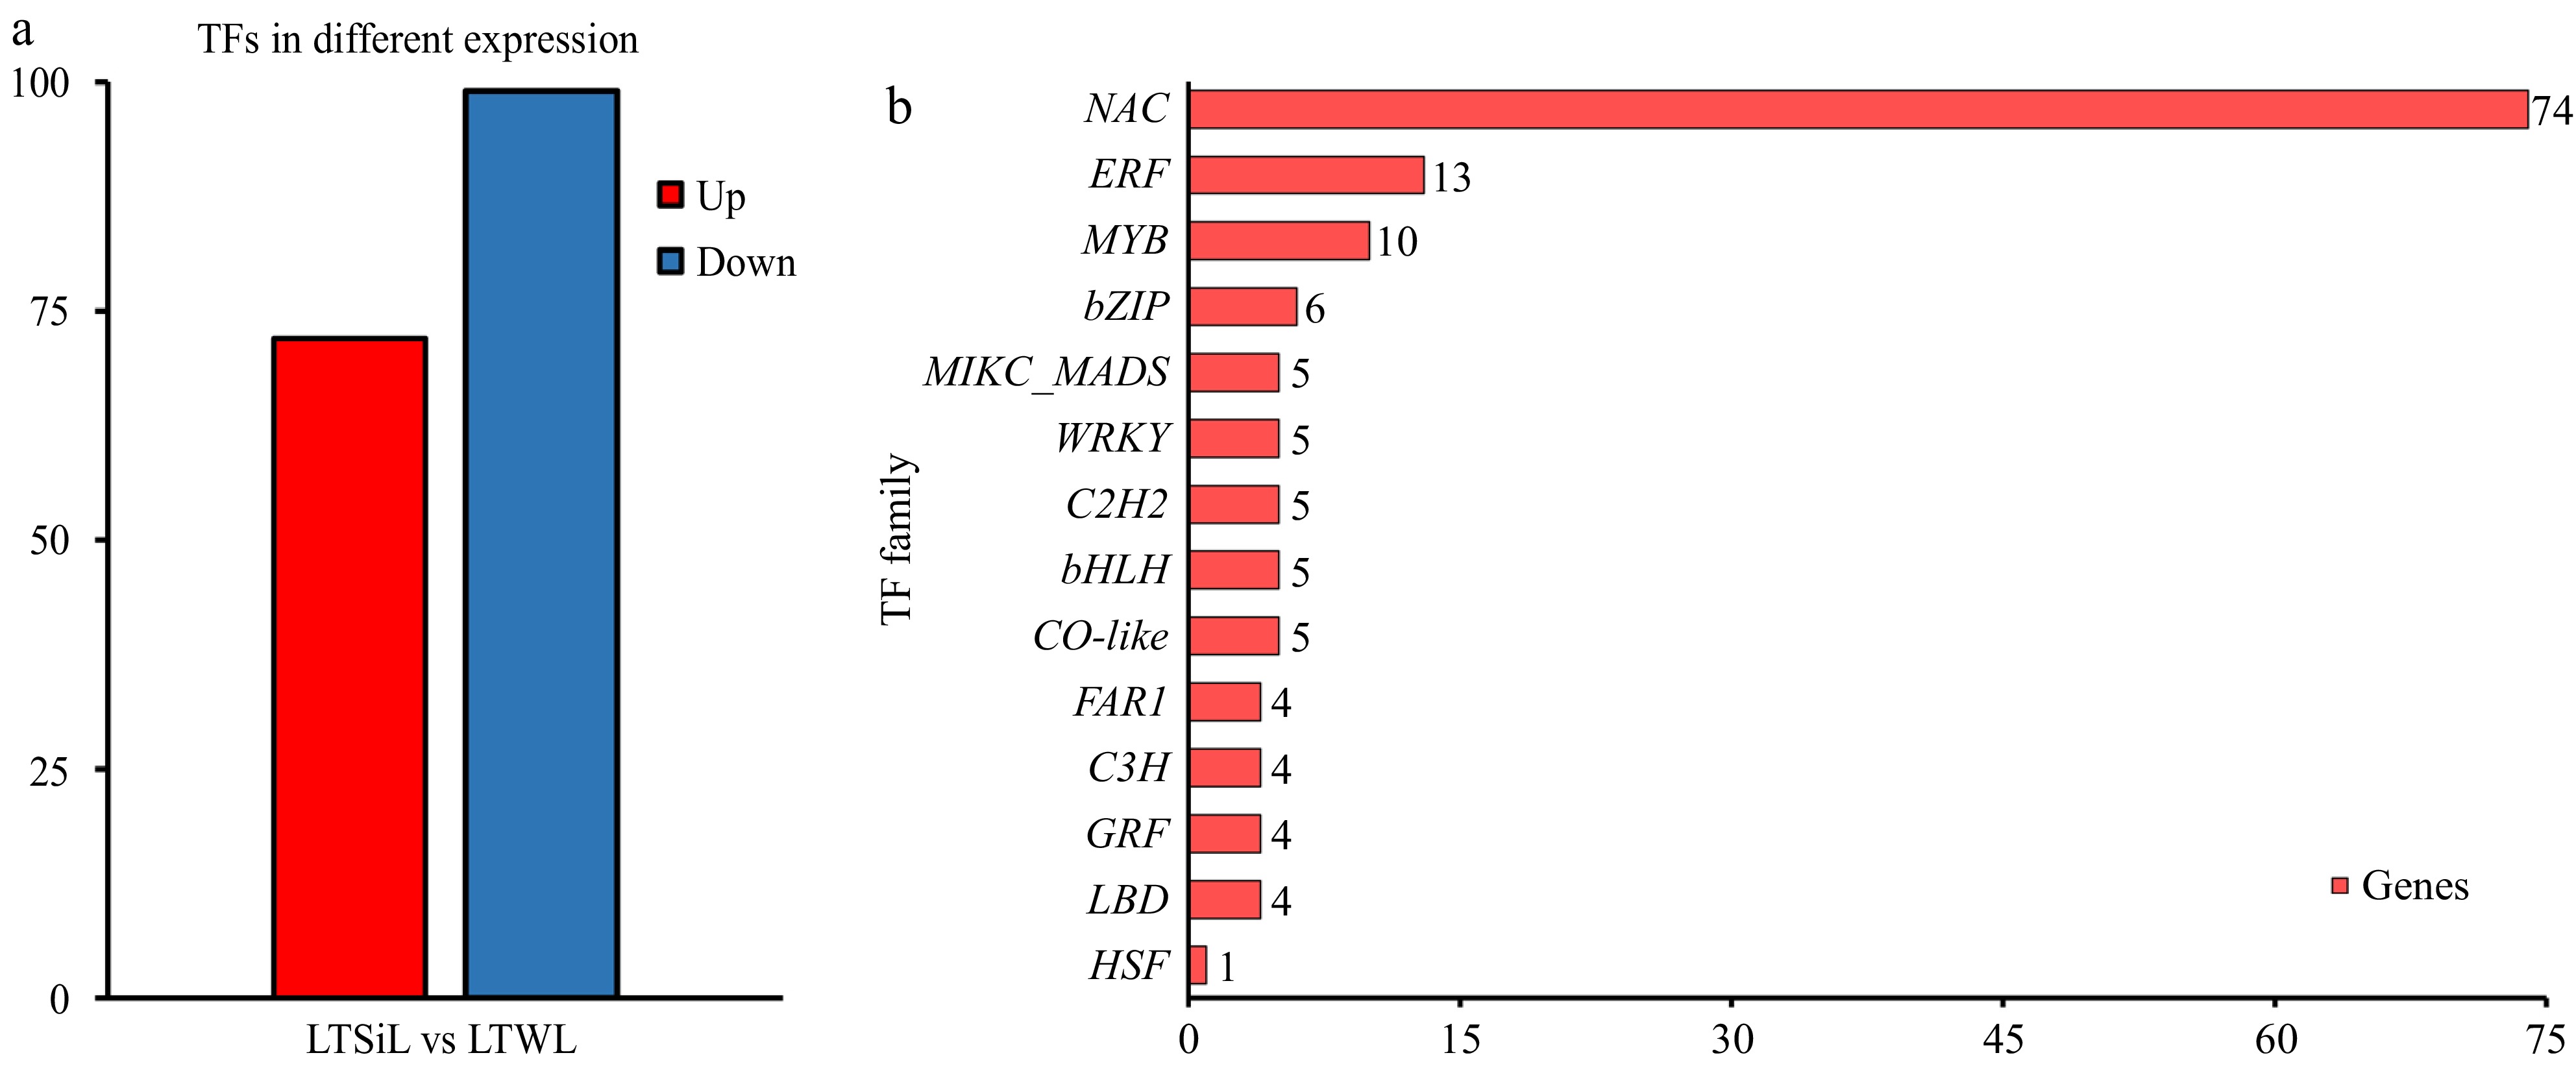
Figure 5.
Overview of the transcription factors differentially expressed in tea plants under 4 °C treatment. (a) The number of TFs identified in the pairwise comparison of LTSiL vs LTWL in tea plants. (b) The top 15 TF families for LTSiL vs LTWL that responded strongly to cold treatment. X-axis represents gene number and Y-axis represents the top 15 transcription factor families.
-
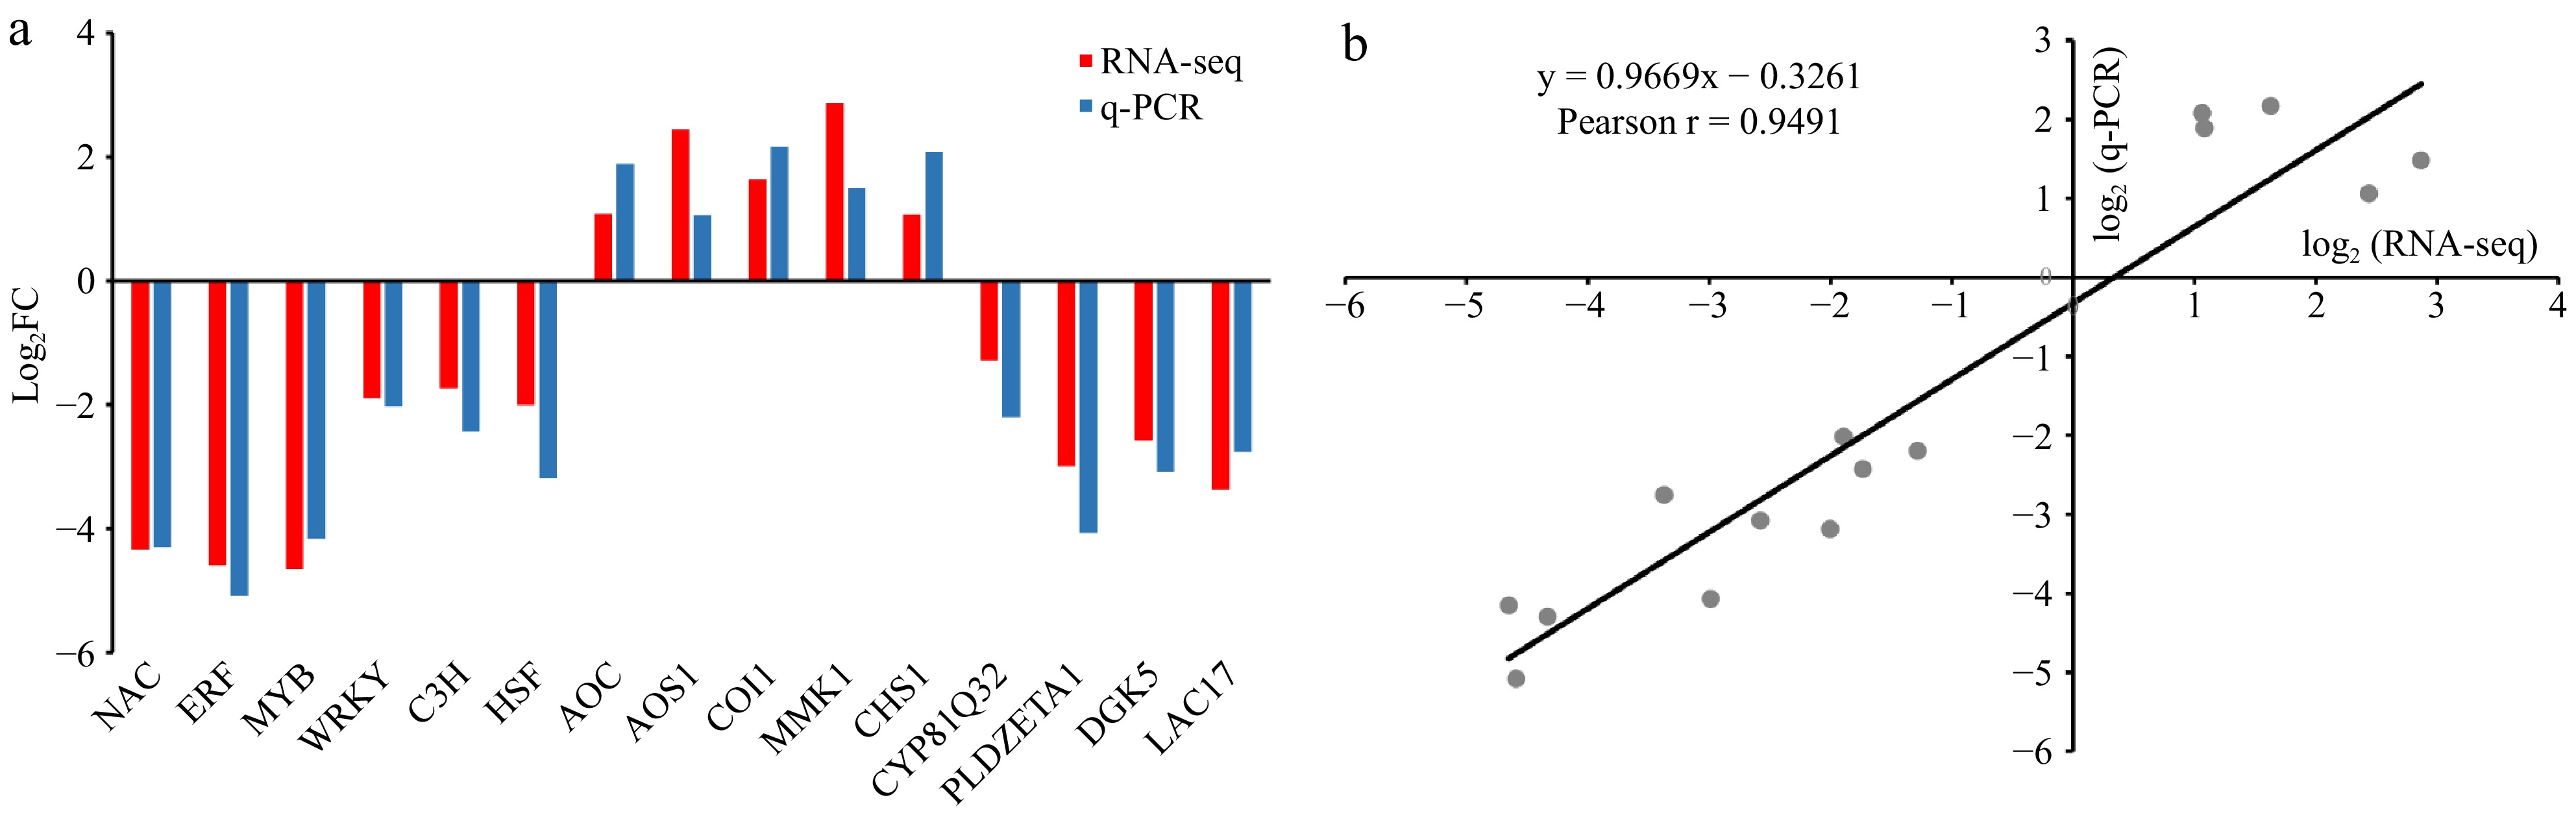
Figure 6.
Expression patterns of 15 DEGs of tea plants under cold stress by qRT-PCR. (a) Expression patterns in LTSiL vs LTWL. All relative expression values were shown with log2 (fold change) on the Y axis, X-axis are genes. (b) Correlation between RNA-seq data and qRT-PCR detection. Each RNA-seq expression data was plotted against qRT-PCR data and subjected to linear regression.
-
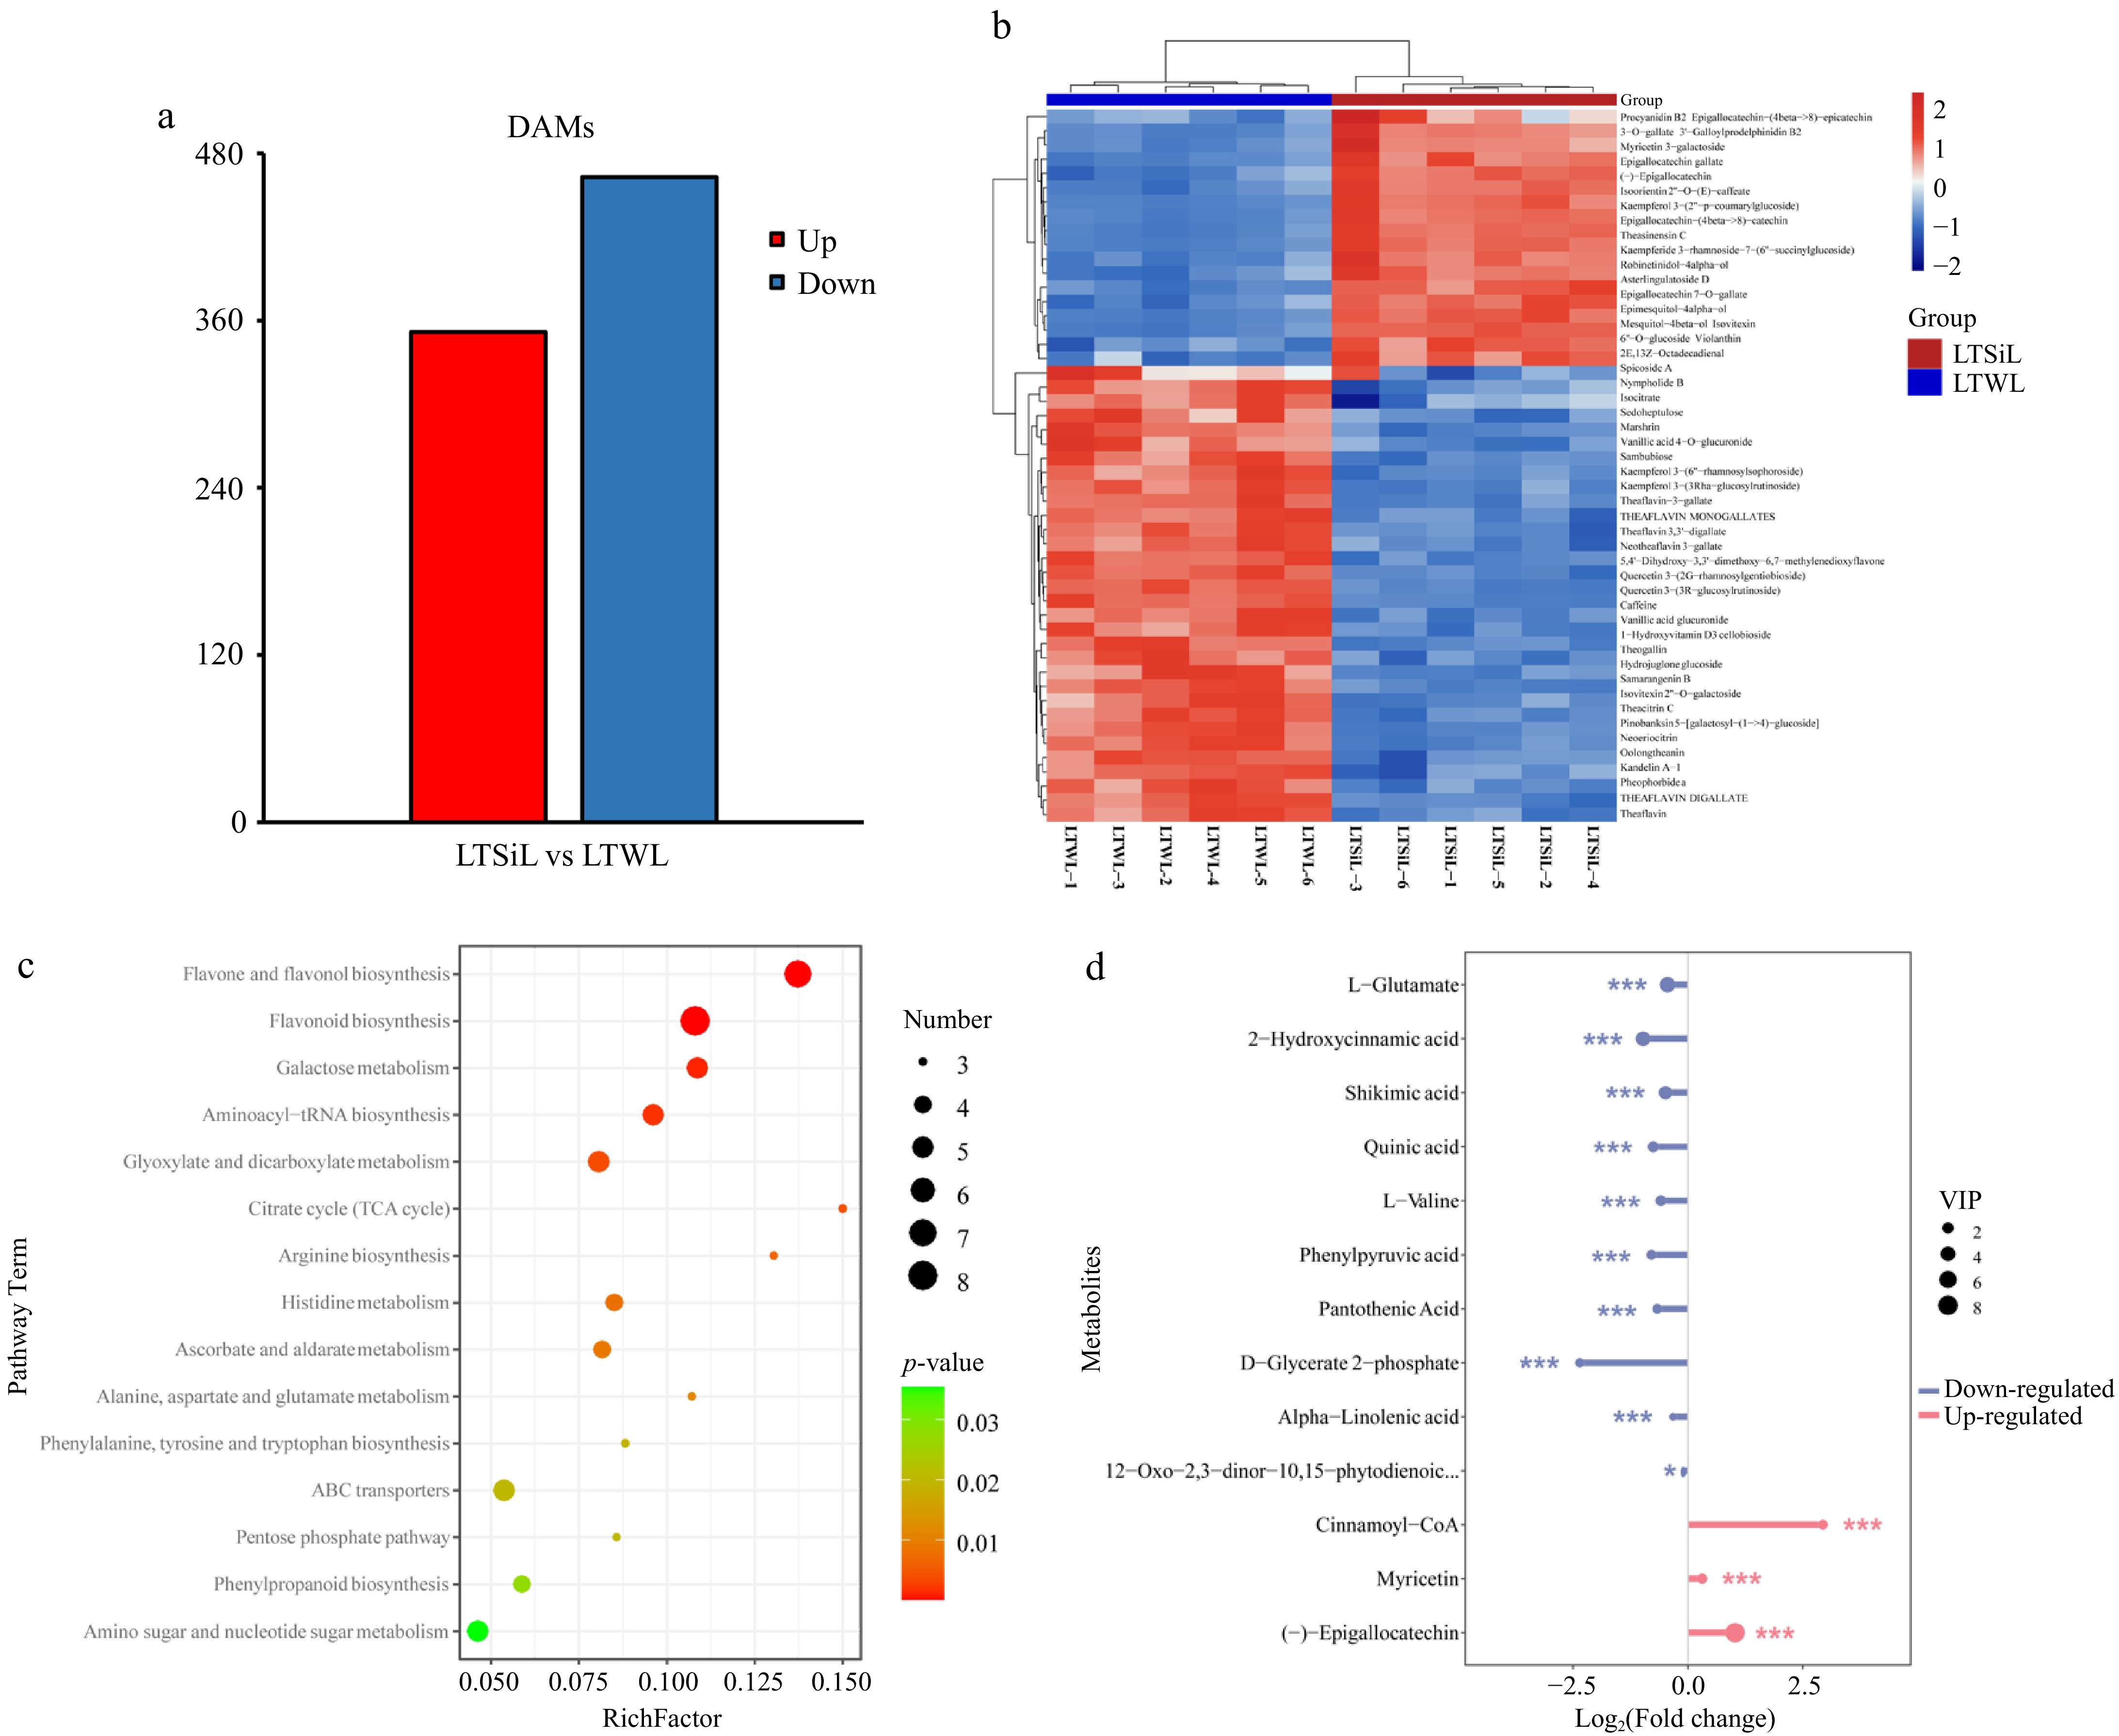
Figure 7.
Overview of metabolite analysis of tea plants subjected to 4 °C treatment. (a) The number of DAMs identified in the pairwise comparison of LTSiL vs LTWL in tea plants. (b) Hierarchical clustering analysis of the DAMs in LTSiL and LTWL. The abscissa indicates sample names and hierarchical clustering results; the ordinate indicates DAMs and hierarchical clustering results. 1, 2 and 3 refer to the three replicates. R Red color indicates high expression; blue color indicates low expression. (c) KEGG analysis of LTSiL and LTWL. X-axis represents Rich factor. The greater the Rich factor is, the greater the degree of enrichment is. The larger the point is, the greater the number of differential genes enriched in the pathway is. The redder the color of the dot is, the more significant the enrichment is. (d) Analysis of key metabolites between LTSiL and LTWL under cold treatment. X-axis represents types of differential metabolites. Y-axis represents differential metabolites fold change value.
-
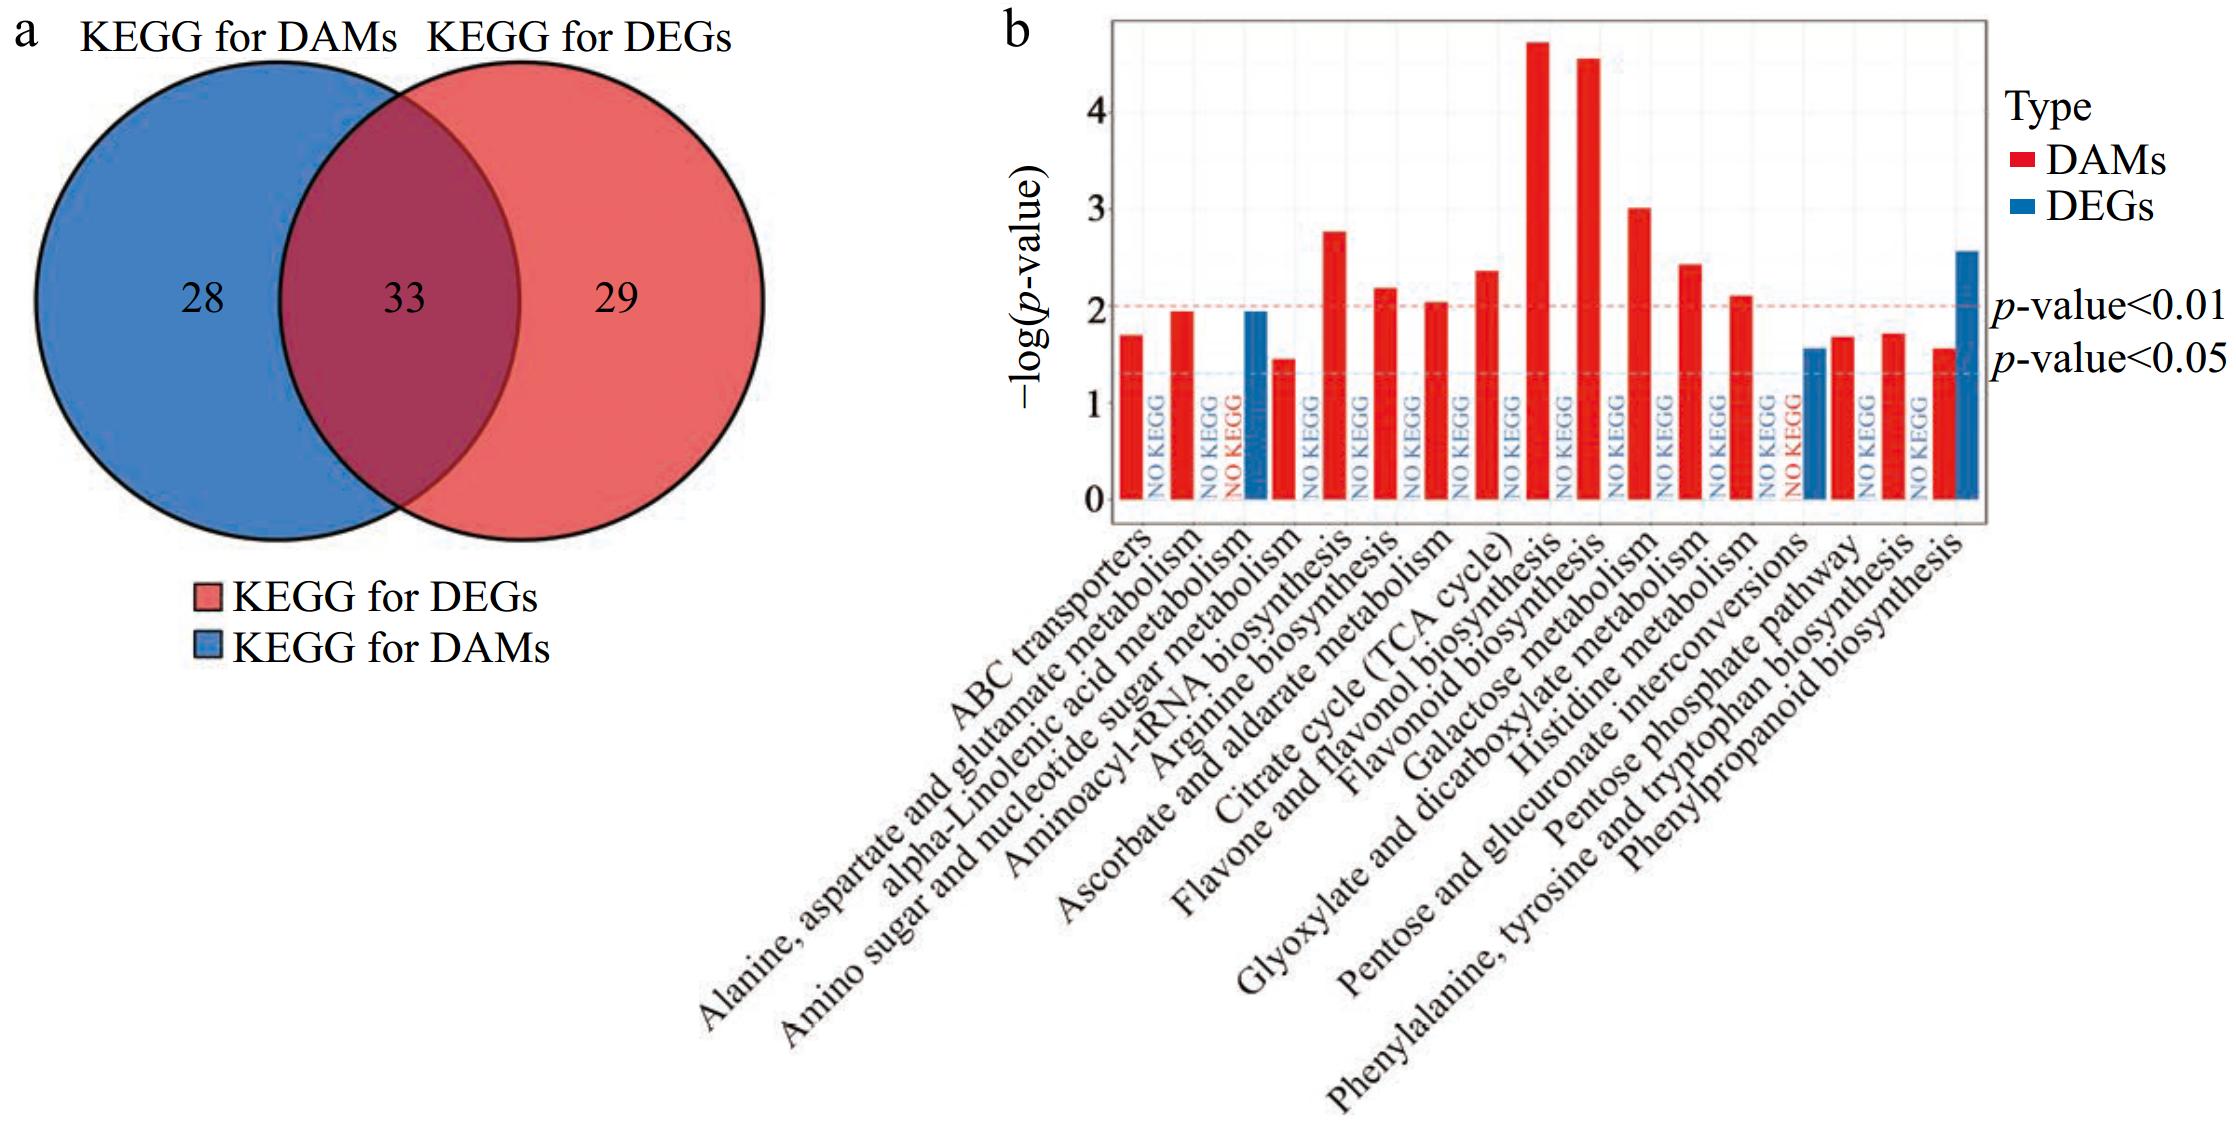
Figure 8.
Conjoint analysis of transcriptomic and metabolomics data. (a) Venn analysis of KEGG pathways for DEGs and DAMs. (b) Statistics of all KEGG pathways for DAMs and/or DEG with a p < 0.05 (b) in LTSiL vs LTWL.
Figures
(8)
Tables
(0)