-
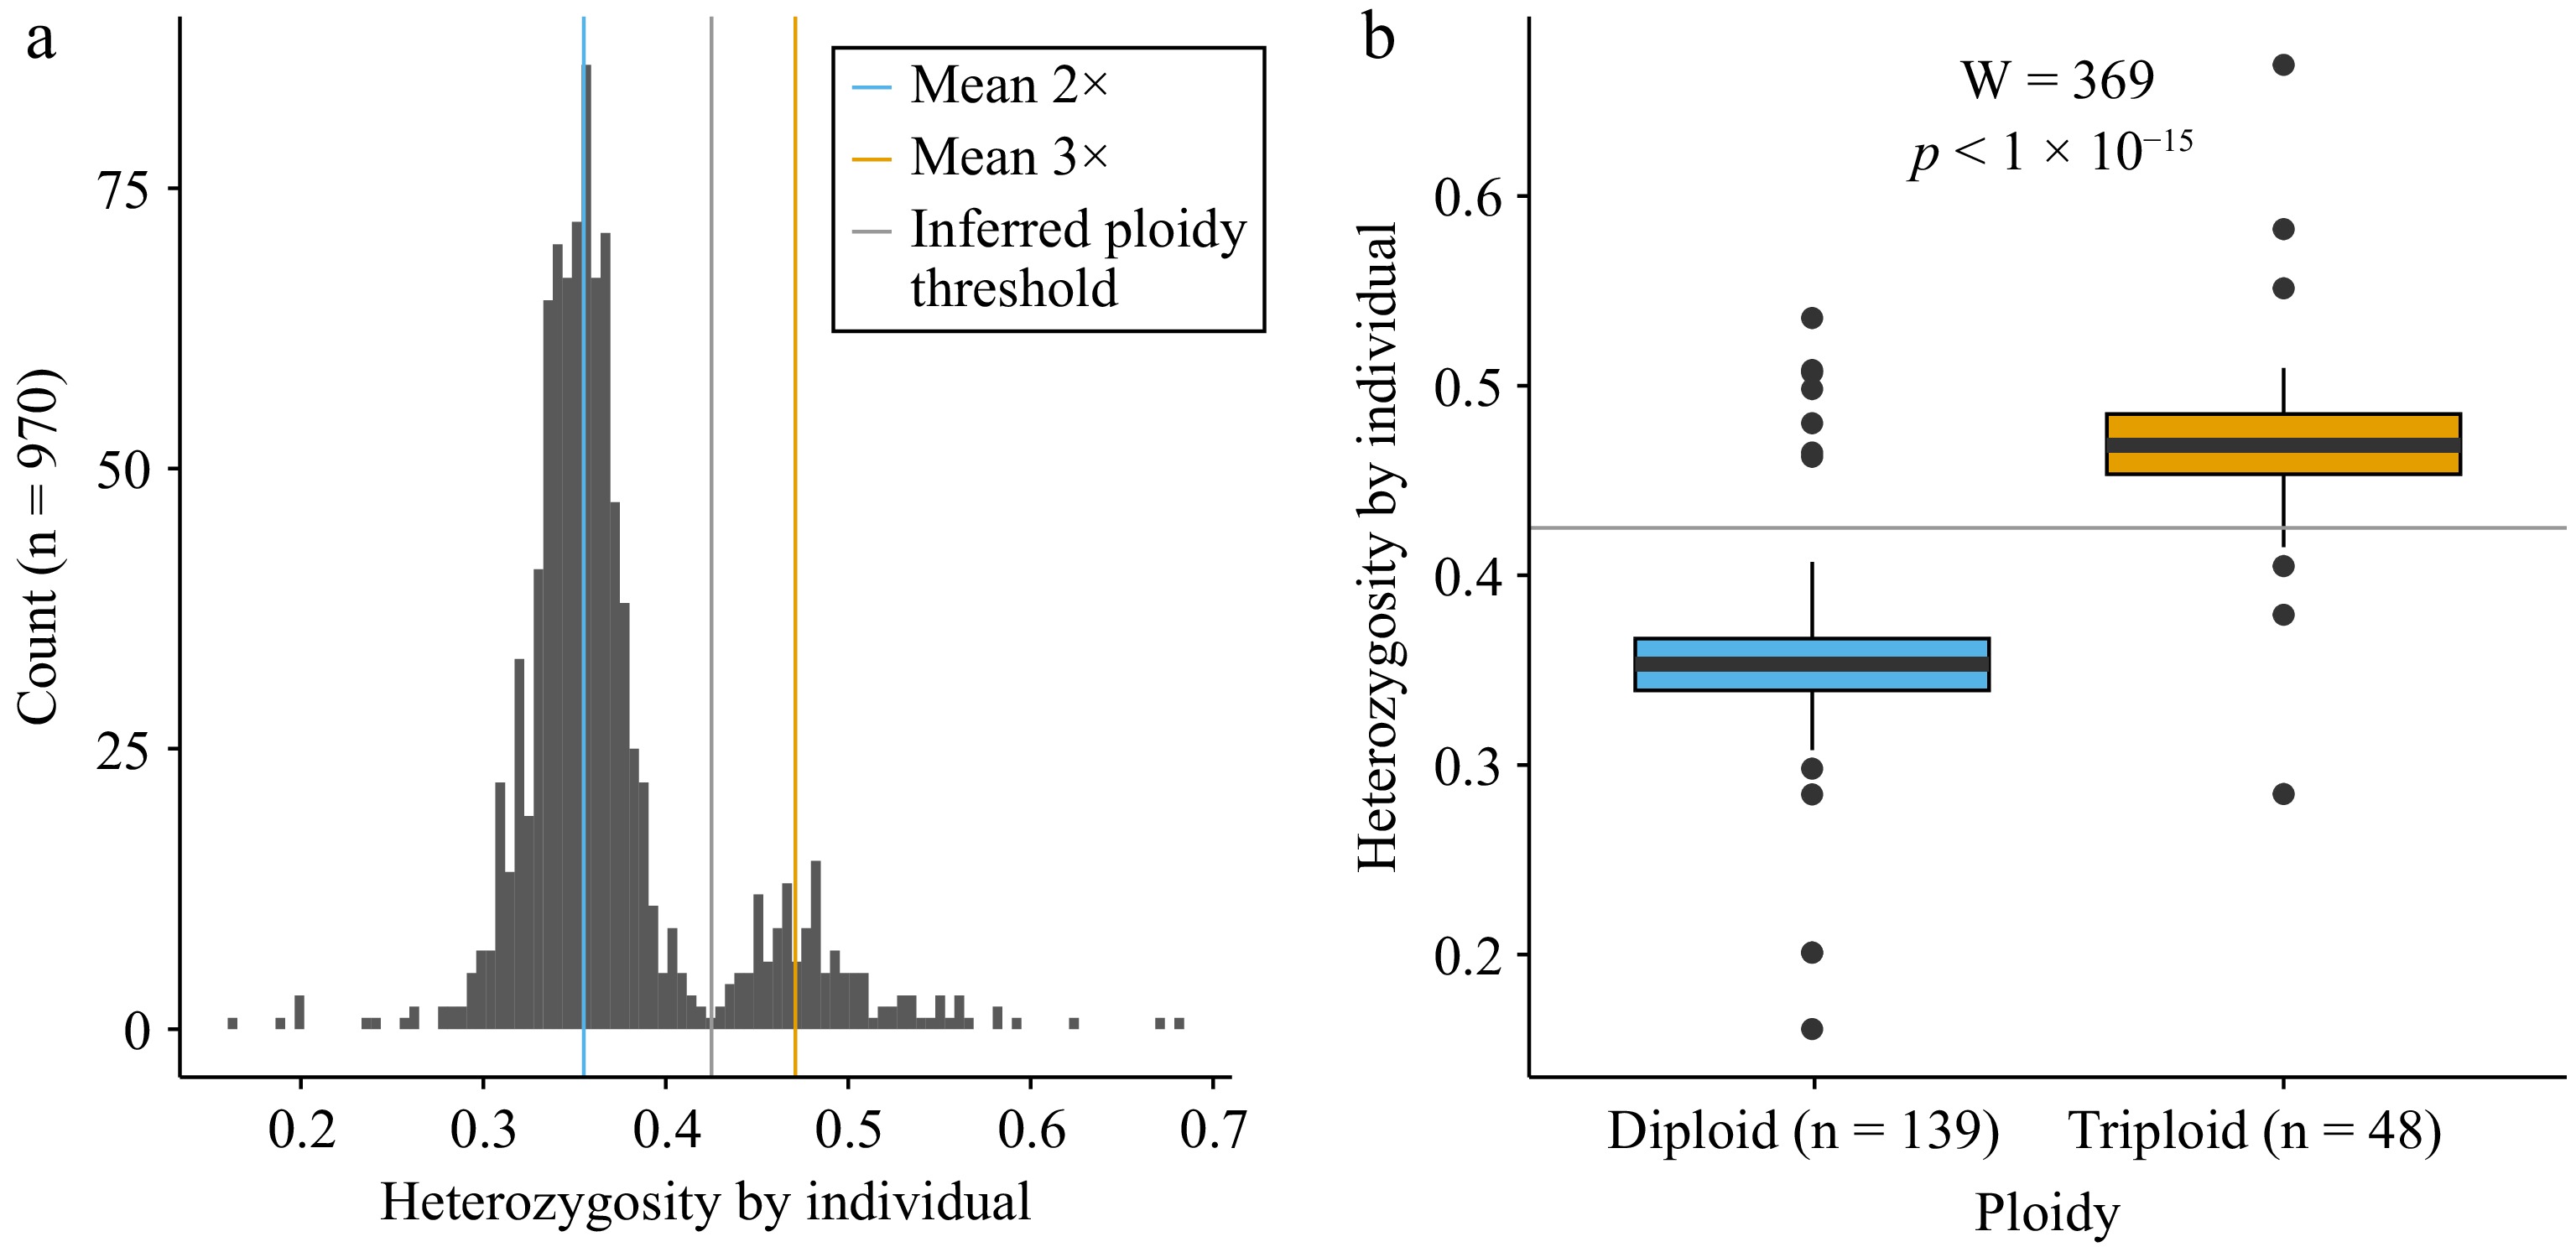
Figure 1.
Heterozygosity and ploidy for accessions from Canada's Apple Biodiversity Collection. (a) Histogram of heterozygosity by individual for all accessions genotyped (n = 970). A blue vertical line indicates the mean value of the diploids (2×), as determined using data from the USDA NPGS Apple Collection. The orange vertical line indicates the mean heterozygosity value for triploids (3×) based on data from the USDA. The grey vertical line indicates the inferred ploidy threshold used as a cut-off between the two ploidy levels. (b) Boxplots showing heterozygosity by individual for known diploids (blue, n = 139) and triploids (orange, n = 48) with the horizontal grey line indicating the inferred ploidy threshold between the two ploidy levels.
-
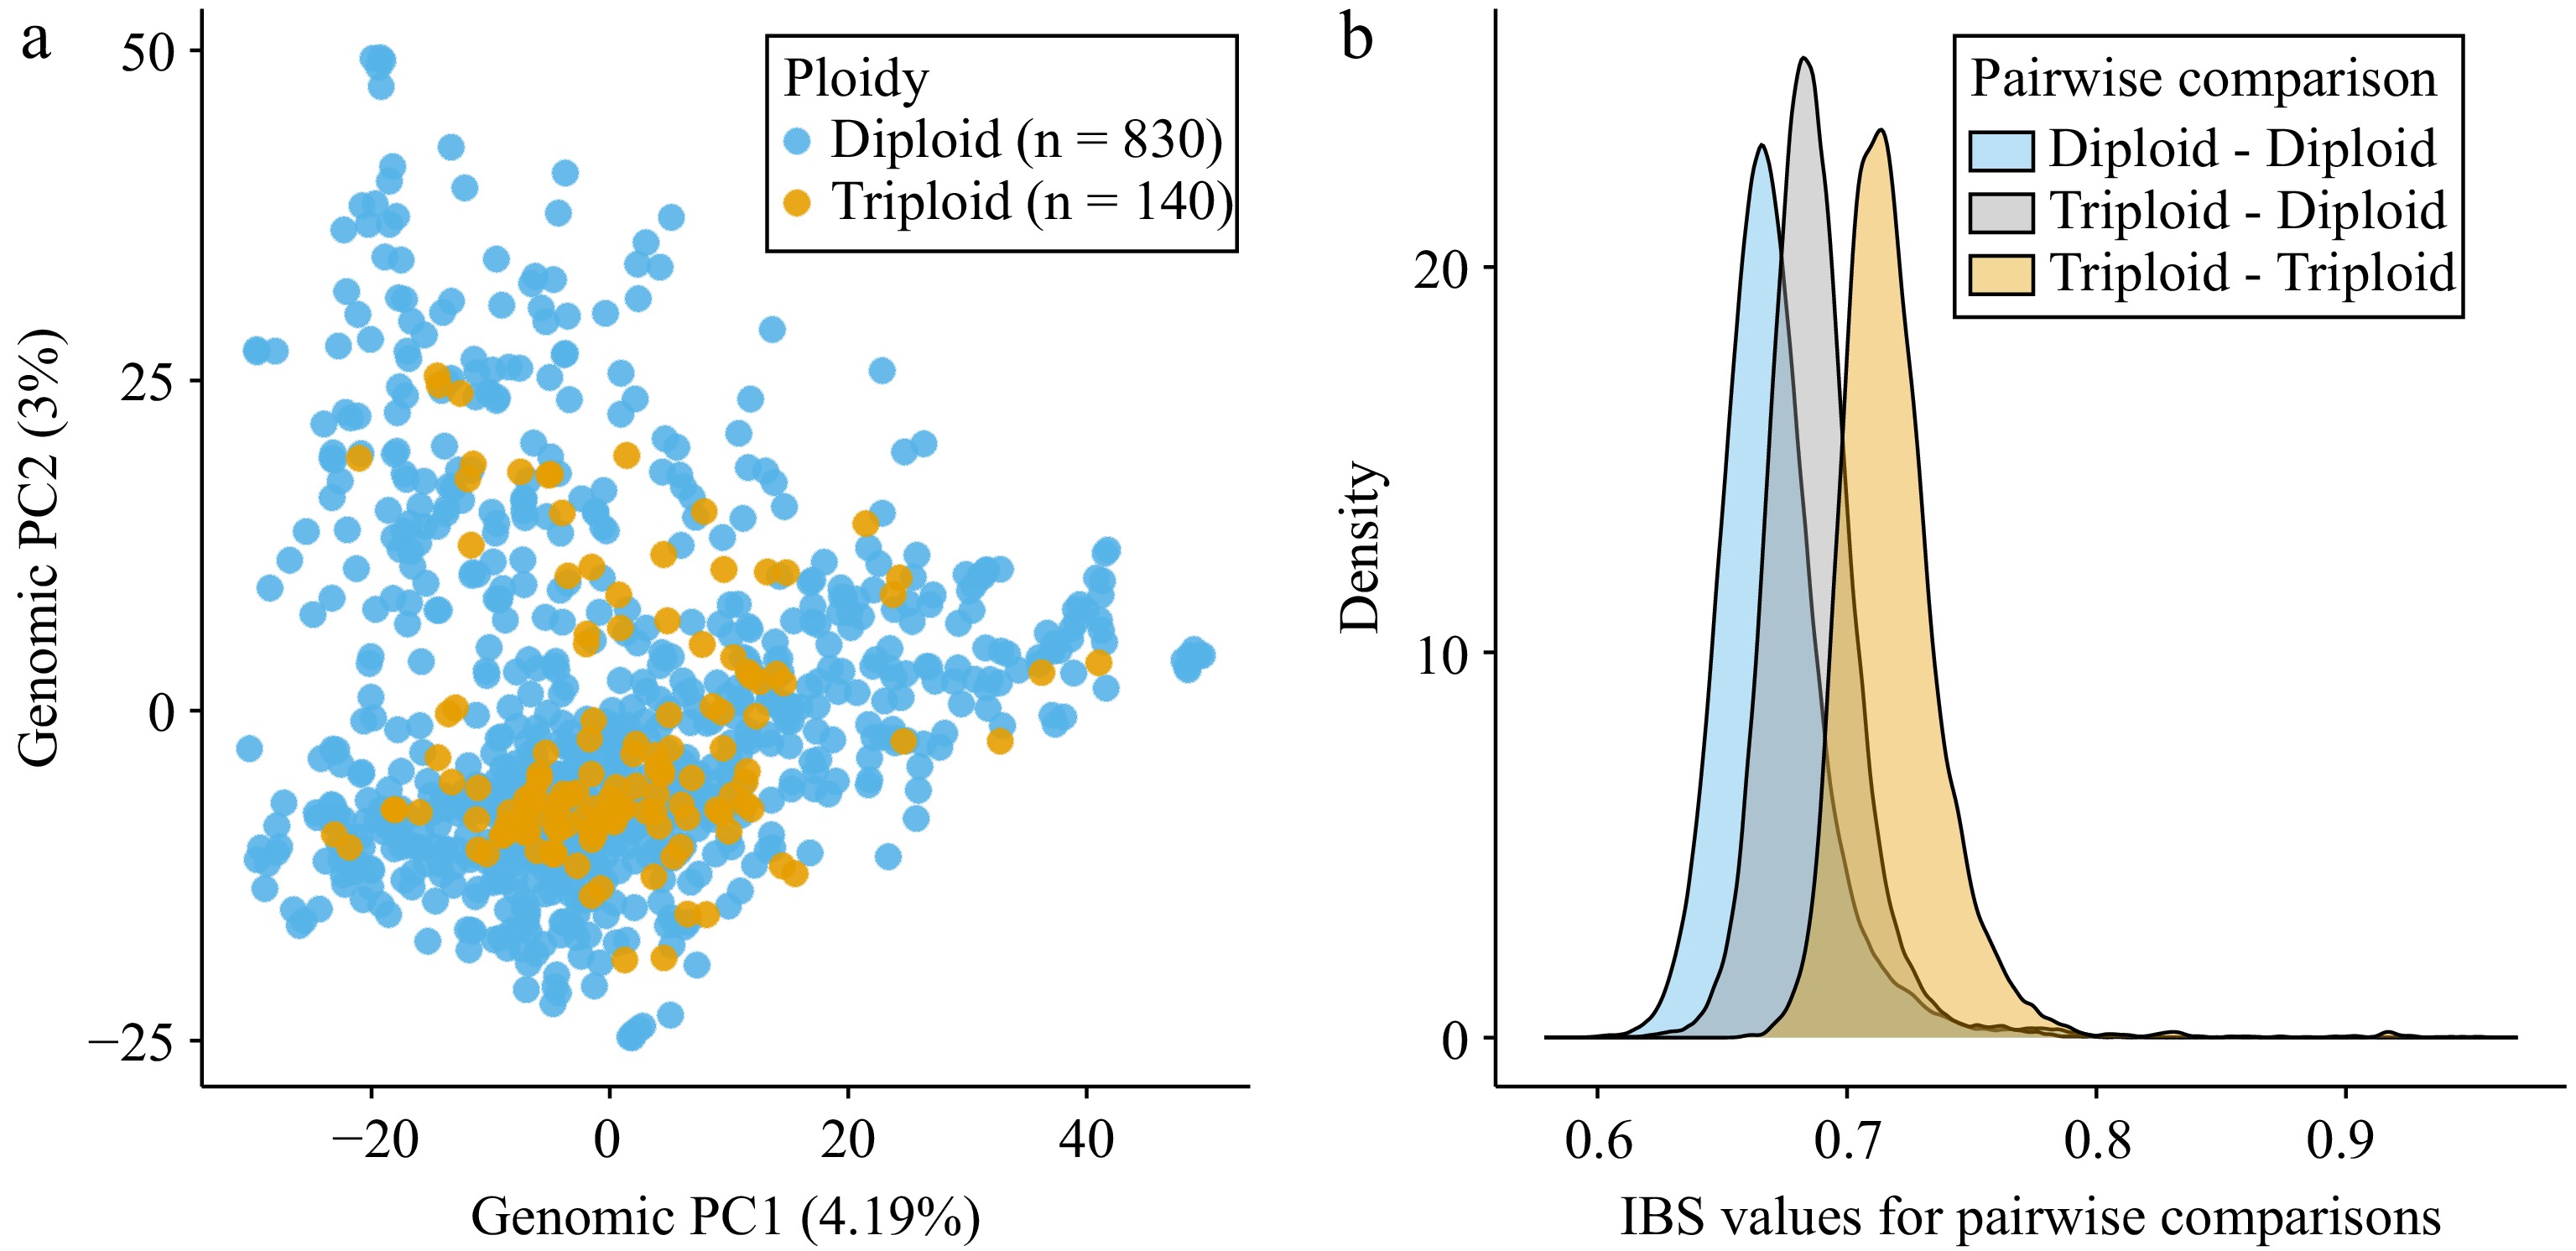
Figure 2.
Genetic similarity among diploid and triploid accessions as determined using genomic data. (a) Principal components analysis (PCA) performed using 51,823 single nucleotide polymorphisms (SNPs). Principal component 1 (PC1) and principal component 2 (PC2) are shown with the percentage of variance explained by each PC indicated in parentheses. Each dot indicates an accession and is labeled by the inferred ploidy level, either diploid (blue) or triploid (orange). (b) Density plots showing IBS (identity-by-state) values for each pairwise comparison. IBS values were calculated based on the average proportion of alleles shared at the genotyped SNPs (105,524 SNPs). The blue curve represents all pairwise comparisons between diploids to other diploids, the gray curve represents all comparisons between diploids and triploids, and the orange curve represents all comparisons between triploids to other triploids.
-
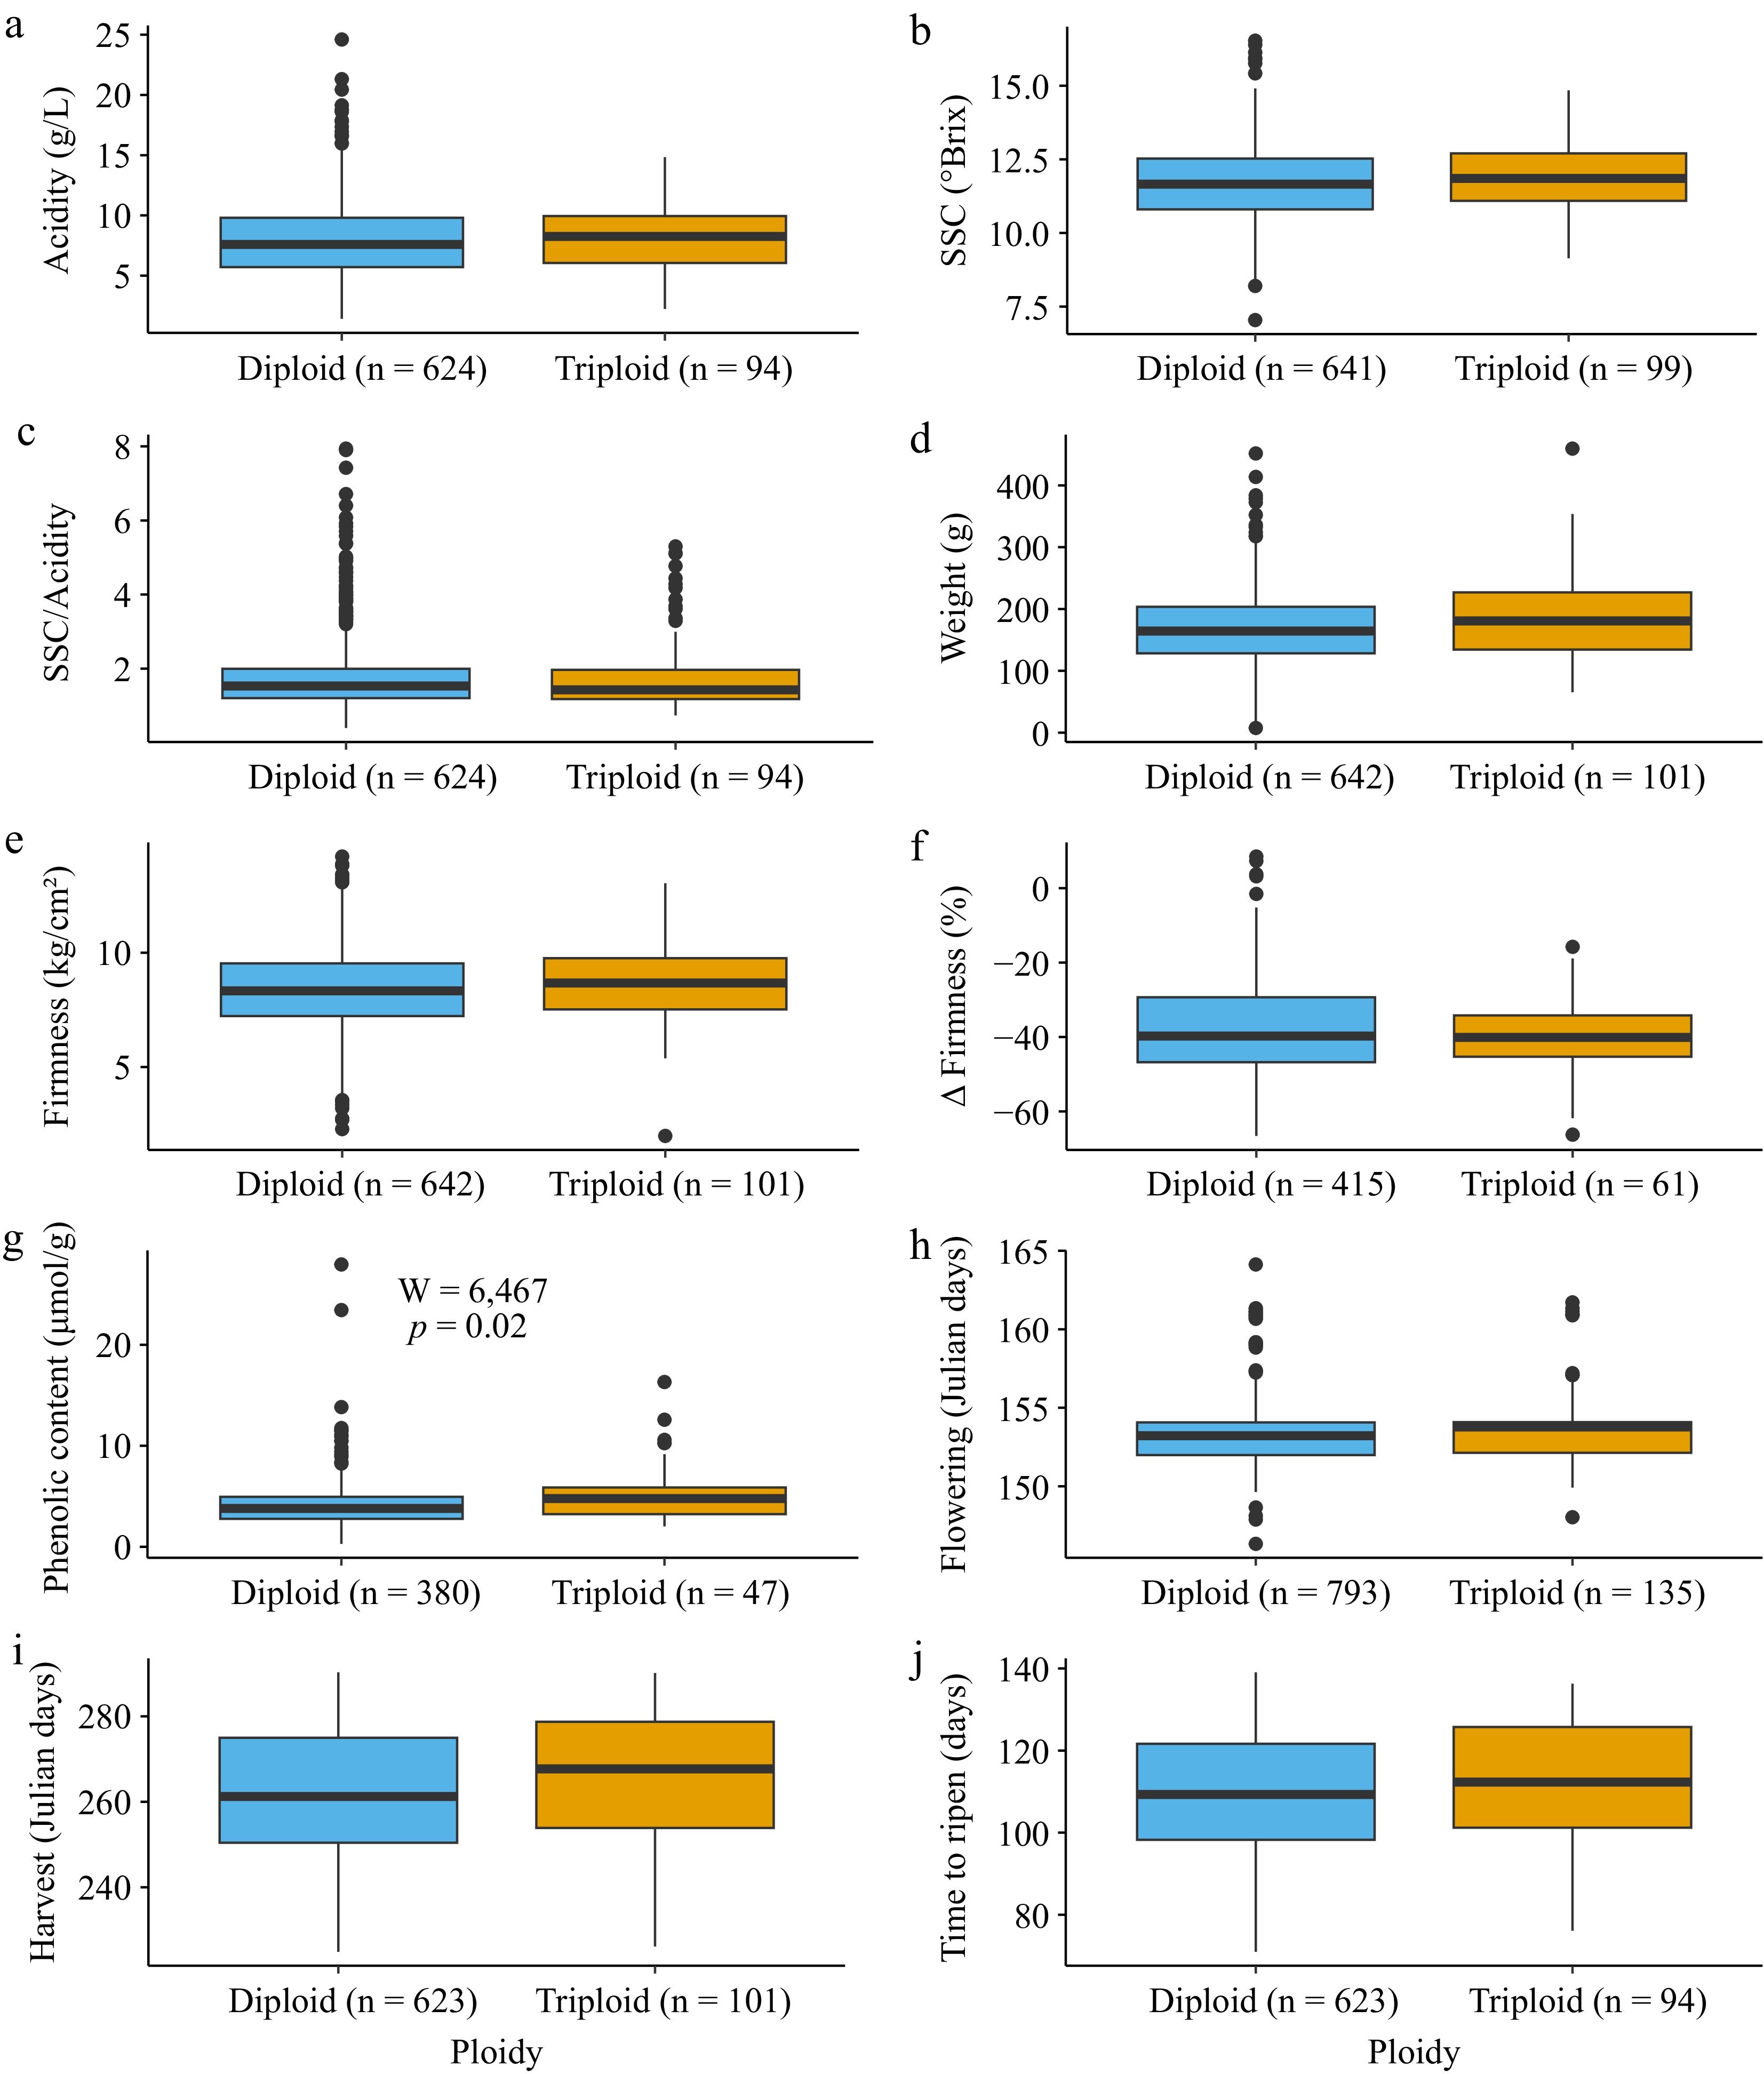
Figure 3.
Boxplots showing phenotype values for inferred diploids (blue) and triploids (orange) for the 10 traits evaluated. The number of accessions in each group is reported beside the ploidy level in all the graphs on the x-axis. A Mann-Whitney U-test was performed to compare trait values between diploids and triploids, and the resulting p-values were Bonferroni-corrected for multiple testing. The test results are shown only for the trait where there was a significant difference between ploidy levels after multiple testing corrections. The following traits are shown: (a) acidity, (b) soluble solid content (SSC), (c) SSC divided by acidity, (d) weight, (e) firmness, (f) change in firmness, (g) phenolic content, (h) flowering date, (i) harvest date, and (j) time to ripen.
-
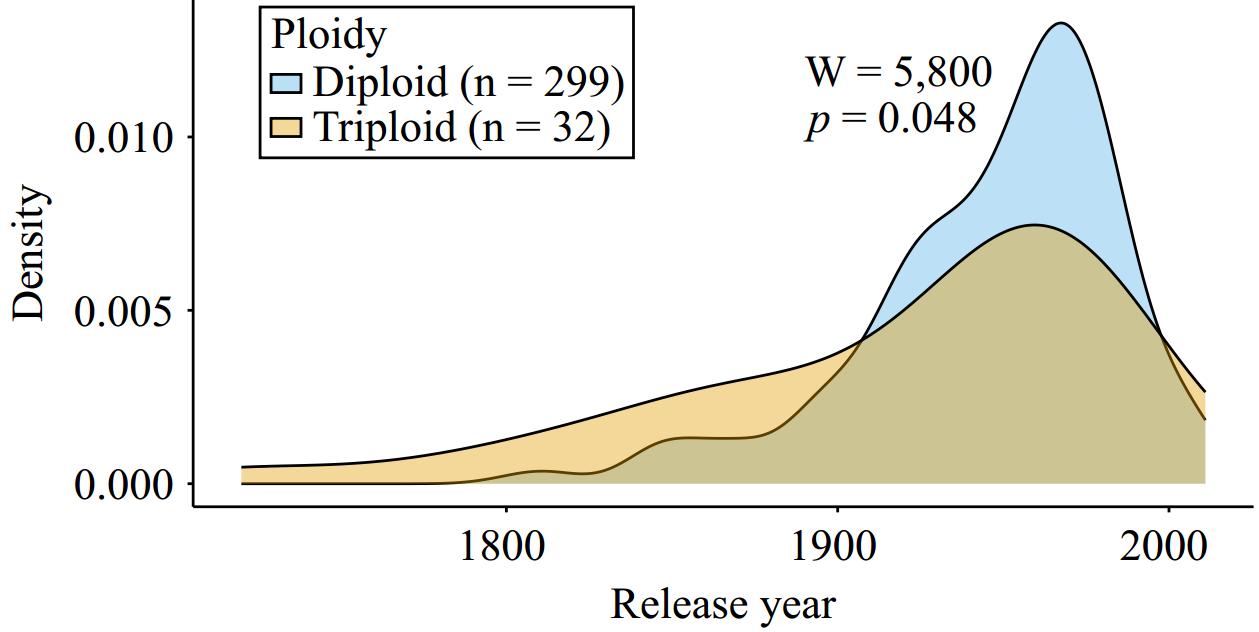
Figure 4.
An overlapping density plot showing the date of release (when known) for diploid and triploid apple accessions. The density distribution for diploids (n = 299) is shown in blue and triploids (n = 32) are shown in orange. A Mann-Whitney U-test was performed to compare release year across groups (W = 5,800, p = 0.048).
Figures
(4)
Tables
(0)