


-
The number of complete sets of chromosomes in the genome — known as ploidy level — can differ across and within plant species, and plays an important role in evolution, reproduction, and crop improvement. In plants, varying ploidy has been described, from haploid (1×) cotton[1] to octoploid (8×) strawberry[2], and beyond[3]. Ploidy can occur in even numbers of sets (diploid, tetraploid, octoploid) and odd numbers of sets (haploid, triploid). From the possible levels of ploidy, triploidy (3×) produces phenotypic advantages in many plant species. For example, triploid Populus have faster growth rates, larger leaves, and are more vigorous than their diploid counterparts[4]. While the mechanism underlying improved traits in triploids is not well understood, phenotypic improvements are suspected to be a product of increased organelle production, including chloroplasts, in vegetative tissues[4,5]. In crop species, some triploid varieties have been selected for unusual or novel phenotypes, such as high-yield cassava[6] and seedless mandarin[7], however triploid plants generally have decreased fertility[8]. Although there are examples of triploidy impacting vegetative growth and fertility traits, the degree to which triploidy produces phenotypic differences across a wide array of fruit traits in agricultural plants remains unclear.
Apple (Malus X. domestica Borkh.) is an economically important fruit crop and the focus of continuing breeding efforts worldwide. Most apple accessions are diploid, but triploids and tetraploids have also been reported[9−11]. Triploids are found among significant commercial varieties (e.g. 'Ribston Pippin', 'Mutsu', and 'Jonagold') and can constitute a substantial proportion of domesticated apple collections[12]. Triploid apple varieties are often cited as producing larger fruit, being more disease-resistant, and being more vigorous[9,13]. Contemporary breeding programs may intentionally incorporate triploid apple accessions[14], however, this is rare due to fertility-associated challenges[15].
Although some have documented improved phenotypes in triploid apple accessions[9], few large and comprehensive comparisons of diploid and triploid apple accessions have been conducted. Quantifying variation in fruit quality across apples of differing ploidy levels not only contributes to our understanding of the impact of ploidy variation on fruit quality, but can also assist in making informed decisions about the use of triploids for production. Here, we use ~100,000 single nucleotide polymorphisms (SNPs) to differentiate between diploids and triploids. Next, we analyze differences between diploids and triploids based on 10 key agricultural phenotypes and release date, identifying subtle differences in fruit quality and significantly different releases.
-
Canada's Apple Biodiversity Collection (ABC) is an orchard consisting of 1,119 different apple accessions located at the Agriculture and Agri-Food Canada (AAFC) Kentville Research Station in Nova Scotia, Canada. The trees in this collection were initially grafted onto M.9 rootstock in 2011 and then planted in May 2013. The orchard was managed to industry standards. A comprehensive description of the collection is available from Watts et al.[16].
Genomic data collection and analysis
-
The collection of genomic data and identification of SNPs for the apple accessions analyzed in this study was previously described by Migicovsky et al.[17]. Briefly, we performed genotyping-by-sequencing (GBS) using ApeKI and PstI-EcoT22I restriction enzymes and identified 278,231 SNPs across 1,175 apple accessions from the ABC. The number of accessions genotyped differs from the total number of accessions present in the ABC as additional accessions were initially included as backups, as described in Migicovsky et al.[17]. For this study, we first reduced the genomic dataset using PLINK (v1.07)[18,19] to only include the 970 M. domestica accessions harvested in either 2016 or 2017[16]. Next, we used a threshold of 0.15 minor allele frequency (MAF) to filter SNPs, resulting in 105,599 SNPs remaining. We removed SNPs with excess heterozygosity using a threshold of 90%, which removed an additional 75 SNPs for a total of 105,524 SNPs. We also generated a secondary SNP file by pruning the SNP set for linkage disequilibrium (LD) using PLINK (v1.07)[18,19] (--indep-pairwise 10 3 0.5), resulting in 51,823 LD-pruned SNPs.
We used the full SNP set of 105,524 markers to calculate heterozygosity by individual using PLINK[18,19] (--het) and plotted the resulting distribution. Next, we used data from the United States Department of Agriculture (USDA) National Plant Germplasm System (NPGS) Apple Collection, publicly available from the Germplasm Resources Information Network (GRIN)[20] which determined ploidy of USDA NPGS apple accessions using flow cytometry and was previously published in Migicovsky et al.[11]. Based on this information, we calculated the mean heterozygosity by individual for accessions labeled as either diploid (2×) or triploid (3×) by GRIN. We plotted these 'known' accessions based on ploidy (diploid/triploid) as boxplots and compared the two groups using a Mann-Whitney U-test (wilcox.test) in R version 4.1.0[21]. We set a threshold for suspected triploid accessions in the ABC, using the same method outlined in Migicovsky et al.[11], and labeled all ABC accessions as either diploid or triploid based on this threshold. For each accession, heterozygosity, USDA ploidy when available, and inferrred ploidy are all listed in Supplementary Table S1. We also calculated how many ploidy labels assigned using our method differed from the ploidy labels reported by the USDA using flow cytometry measurements.
Using TASSEL[22] we performed principal components analysis (PCA) using the LD-pruned set of 51,823 SNPs and plotted principal components (PCs) 1 and 2, labeling accessions by inferred ploidy level. Finally, we calculated a genome-wide average identity-by-state (IBS) pairwise identities matrix in PLINK (v1.07)[18,19] using all 105,524 SNPs and the --cluster --matrix options. Based on the IBS matrix, we plotted density distributions for IBS values between diploid-diploid pairs, diploid-triploid pairs, and triploid-triploid pairs. We used a Mann-Whitney U test to determine if the IBS values for triploid-triploid pairs differed from triploid-diploid and diploid-diploid comparisons. All data visualizations were performed using the R package ggplot2 (v3.3.5)[23] in R version 4.1.0[21].
Phenotype data collection and analysis
-
For this study, we evaluated the potential consequences of ploidy variation on trait variation using previously published trait (phenotype) data from Watts et al.[16]. Although Watts et al.[16] reported 39 phenotypes, we reduced our dataset to 10 phenotypes that we deemed to be of most interest for apple production. The traits selected were: flowering date, harvest date, time to ripen, weight, acidity, soluble solids content (SSC), the ratio of SSC to acidity, total phenolic content, firmness, and softening during 3 months of cold storage. Of these 10 phenotypes, all were measured in 2017, which was the year with a larger number of accessions harvested, except for flowering time (2016), and time to ripen (based on flowering time from 2016 and harvest time in 2017). Values for each are reported in Supplementary Table S1.
A complete description of phenotype data collection methods is available from Watts et al.[16]. All measurements collected before or at harvest were adjusted using a restricted maximum likelihood (REML) model. The REML model used 'check trees' as standards and adjusted values to reflect a single trait value for each accession (genotype). Fruit across replicates were combined in storage and therefore if multiple measurements were taken after storage, values were averaged by accession.
The flowering date was recorded as the day in 2016 on which more than 80% of the young branches had king blooms. In 2017, fruit were deemed ripe for harvest by assessing firmness, taste, starch, sweetness, change in background skin color, and flesh response to iodine spray. Time to ripen was calculated as the time between the flowering date from 2016 and the harvest date from 2017. All three phenology measurements were recorded in Julian days.
After harvest in 2017, fruit quality traits were collected based on 10 fruit. Fruit weight (g) was measured by taking the average weight of harvested fruit. Next, a quarter of each apple was juiced, and acidity (g/L) was measured by titrating 1 mL of juice mixed with 0.1 M of NaOH using the 865 Dosimat Plus (Metrohm). Phenolic content was measured using the Folin–Ciocalteu assay and reported in μmol/g fresh fruit. Soluble solids content (SSC) (°Brix) for the juice was also measured using the Pocket Refractometer (Atago, PAL-1). The trait SSC/acidity was calculated by dividing SSC by acidity. Lastly, firmness (kg/cm2) was measured by removing apple skin using a vegetable peeler and then using a penetrometer (Guss Fruit Texture Analyser, GS-14).
In 2017, after harvest, 10 fruits were placed into cold storage at 4 °C. After 3 months of storage, apples were brought back to room temperature, and the same methods were used to calculate firmness with a minimum of three and a maximum of 10 apples from each accession. Percent change in firmness (softening) was calculated by subtracting the firmness at harvest from the firmness after storage and then dividing it by the firmness at harvest and multiplying by 100. All the data were analyzed using R version 4.1.0[21] with data visualization performed using the R package ggplot2 (v3.3.5)[23]. For all 10 traits of interest, we performed a Mann-Whitney U-test to compare trait values between diploids and triploids. The resulting p-values were Bonferroni-corrected (multiplied by 10) to adjust for multiple testing.
Watts et al.[16] also recorded the release year for many of the named apple accessions included in the ABC. Release year is the year in which the named variety was released into commercial production or first mentioned in the literature/media. We incorporated these data into our analyses to determine if there was a difference in release year between diploids and triploids. First, we performed a Mann-Whitney U-test to compare the release year between diploids and triploids. Lastly, we calculated what percentage of diploid and triploid apples were released before or after 1900. The R code for all analyses is publicly available on GitHub (
https://github.com/zoemigicovsky/apple_ploidy ). -
To compare diploid and triploid apples, we first evaluated our ability to identify apple ploidy levels using the metric heterozygosity by individual, calculated based on over 100,000 SNPs genotyped using GBS. After filtering for MAF 0.15, plotting heterozygosity across accessions resulted in a bimodal distribution (Fig. 1a). We labeled the mean diploid and triploid heterozygosity by individual values based on accessions of known ploidy according to previously published data from the USDA[11]. Plotting the mean values indicated that the lower peak corresponded to diploid accessions (mean heterozygosity = 0.355) and the peak with higher heterozygosity values corresponded to triploid accessions (mean heterozygosity = 0.471). Based on this distribution, we set a threshold for the inferred diploid/triploid divide of 0.425. We also performed a Mann-Whitney U-test which determined that the two groups of accessions of known ploidy differed (diploid n = 139, triploid n = 48) significantly for heterozygosity by individual values (W = 369, p < 1 × 10⁻¹⁵) (Fig. 1b). Of the accessions labeled by the USDA, we labeled seven diploids as triploids and five triploids as diploids using our threshold. Our method resulted in a total of 12 out of 187 (6.4%) accessions having ploidy labels that did not concur with those previously reported by the USDA GRIN database. Based on our method, 830 (86%) of the apple accessions in the ABC are inferred diploid, while 140 (14%) are inferred triploid.
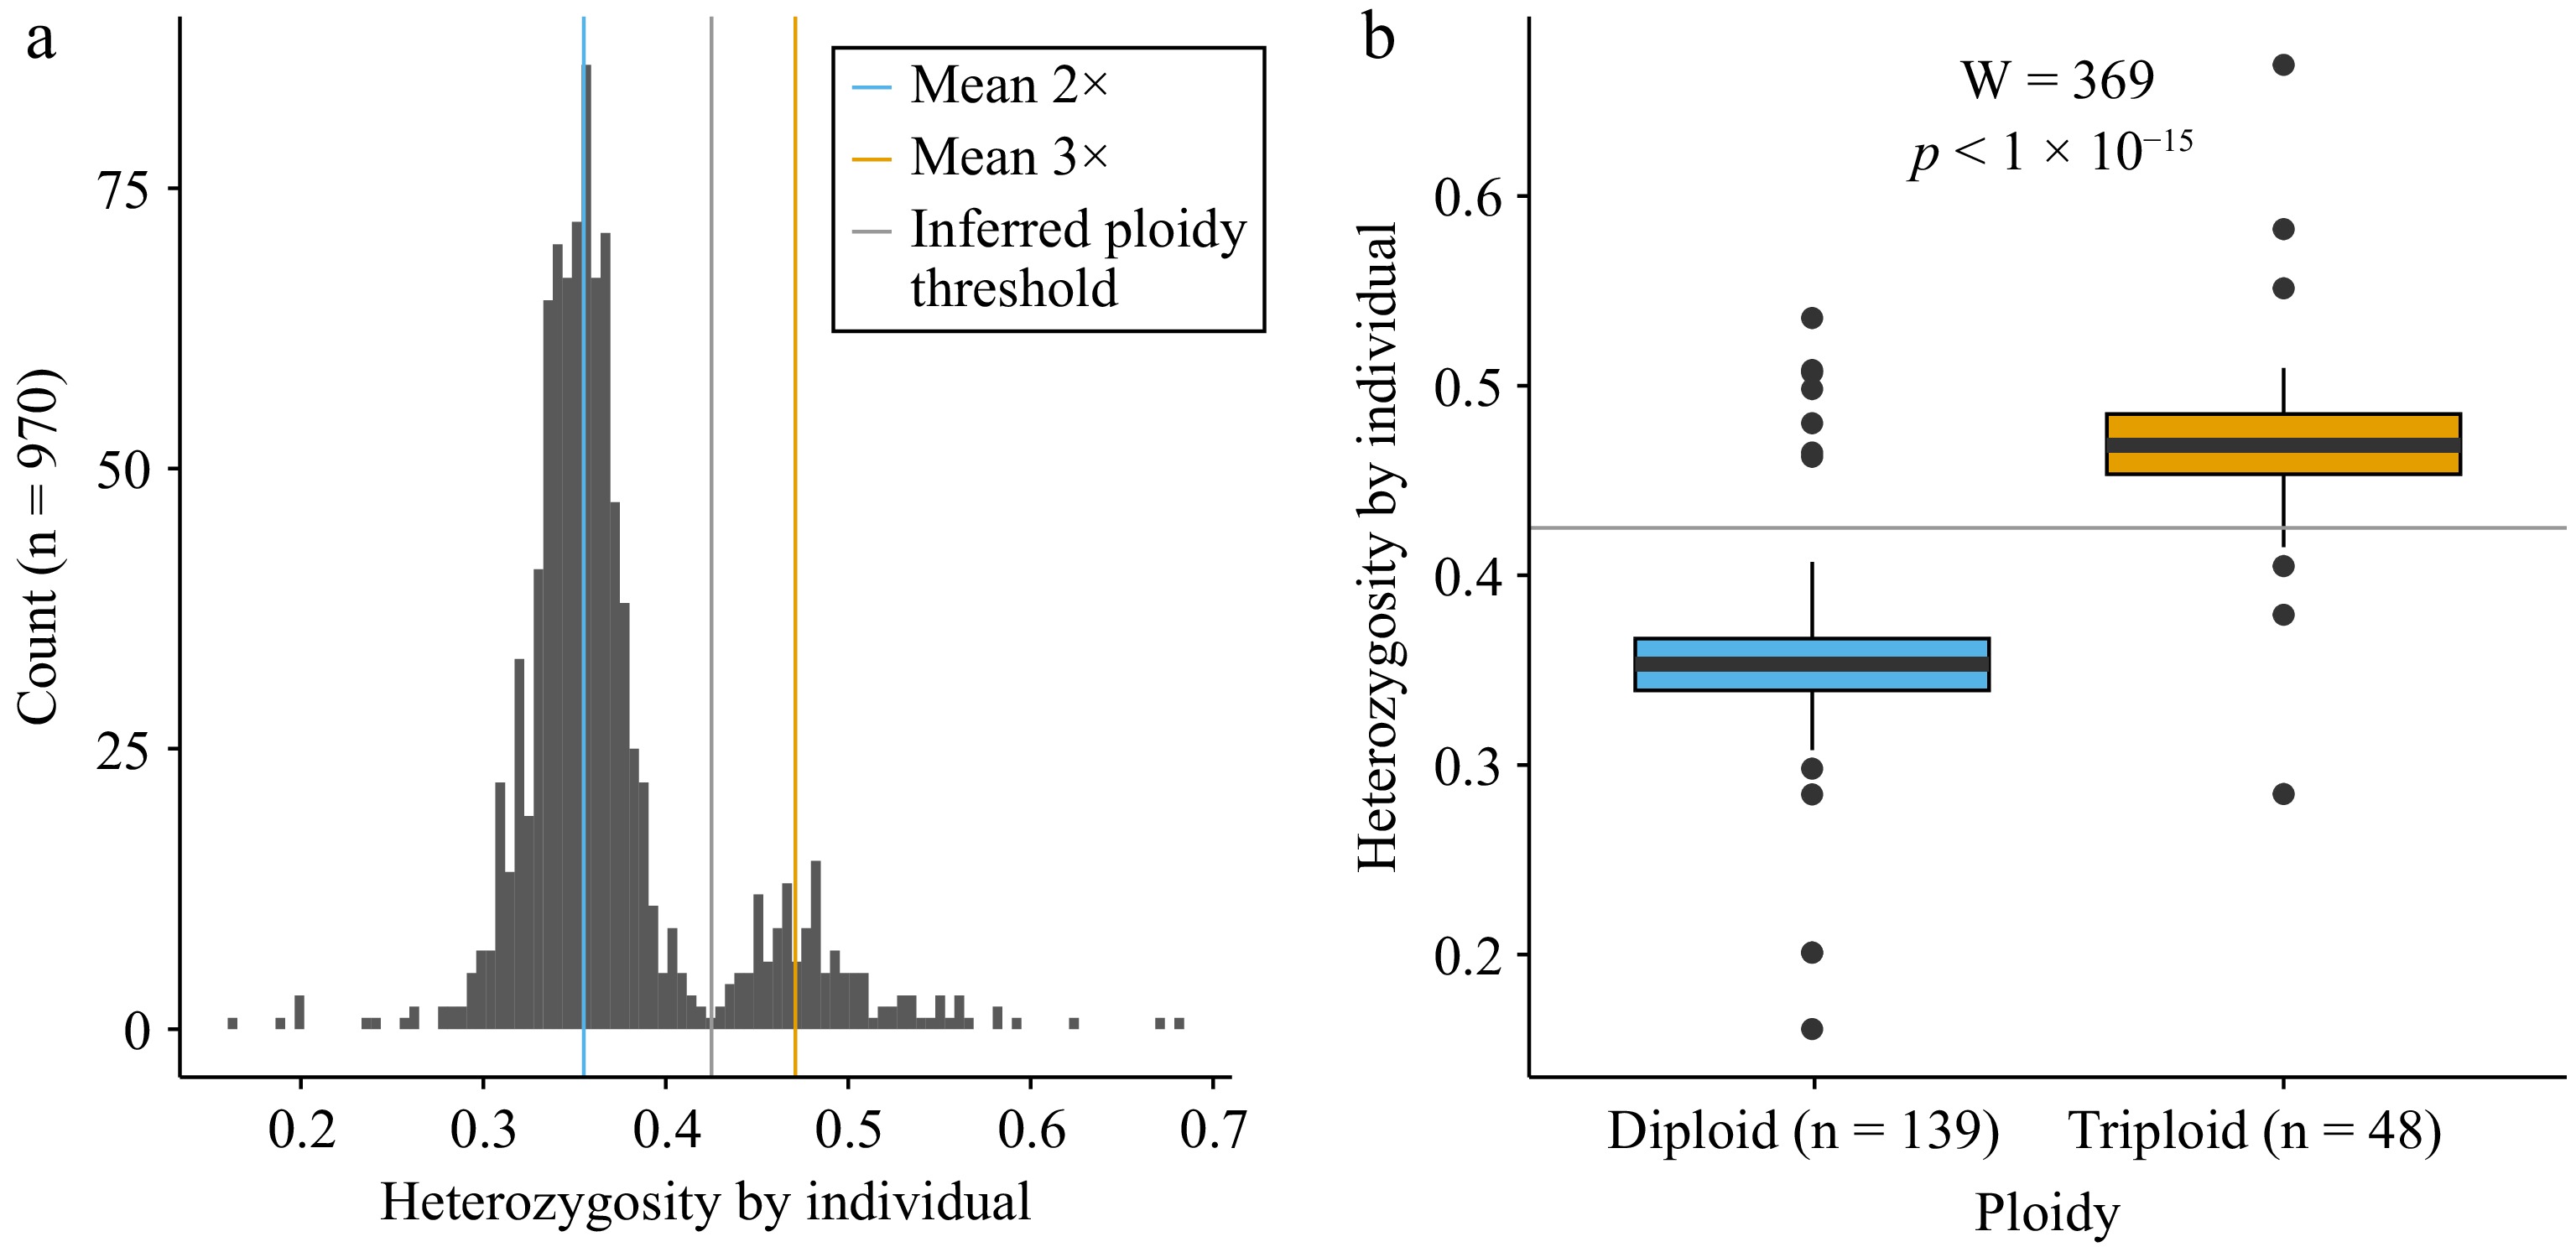
Figure 1.
Heterozygosity and ploidy for accessions from Canada's Apple Biodiversity Collection. (a) Histogram of heterozygosity by individual for all accessions genotyped (n = 970). A blue vertical line indicates the mean value of the diploids (2×), as determined using data from the USDA NPGS Apple Collection. The orange vertical line indicates the mean heterozygosity value for triploids (3×) based on data from the USDA. The grey vertical line indicates the inferred ploidy threshold used as a cut-off between the two ploidy levels. (b) Boxplots showing heterozygosity by individual for known diploids (blue, n = 139) and triploids (orange, n = 48) with the horizontal grey line indicating the inferred ploidy threshold between the two ploidy levels.
Genetic similarity among apple accessions of differing ploidy
-
After categorizing ABC accessions based on ploidy level (Fig. 1), we evaluated genetic similarity among and across diploid and triploid accessions (Fig. 2). First, we performed PCA on 51,823 single nucleotide polymorphisms (SNPs). Principal component (PC) 1 explained 4.19% of the variation in the genomic data, while PC2 explained 3.00% (Fig. 2a). Across PC1 and PC2, the values for accessions labeled as both diploids and triploids overlapped, clustering in the middle of the plot. However, the diploid accessions showed a greater range. For example, no triploid accessions had a PC2 value greater than 25.3, while some diploid accessions exceeded 40. In addition to PCA, we completed an identity-by-state (IBS) analysis which calculated what proportion of the 105,524 genotyped SNPs shared the same alleles for each pairwise comparison (Fig. 2b). We examined the distribution of these IBS values for all pairwise comparisons between two diploid accessions, all pairwise comparisons between two triploid accessions, and all pairwise comparisons between diploid and triploid accessions. Using Mann-Whitney U tests we determined that triploid-triploid comparisons had significantly higher IBS values than those of triploid-diploid (W = 112,369,979, p < 1 × 10⁻¹⁵), or diploid-diploid comparisons (W = 172,679,637, p < 1 × 10⁻¹⁵).
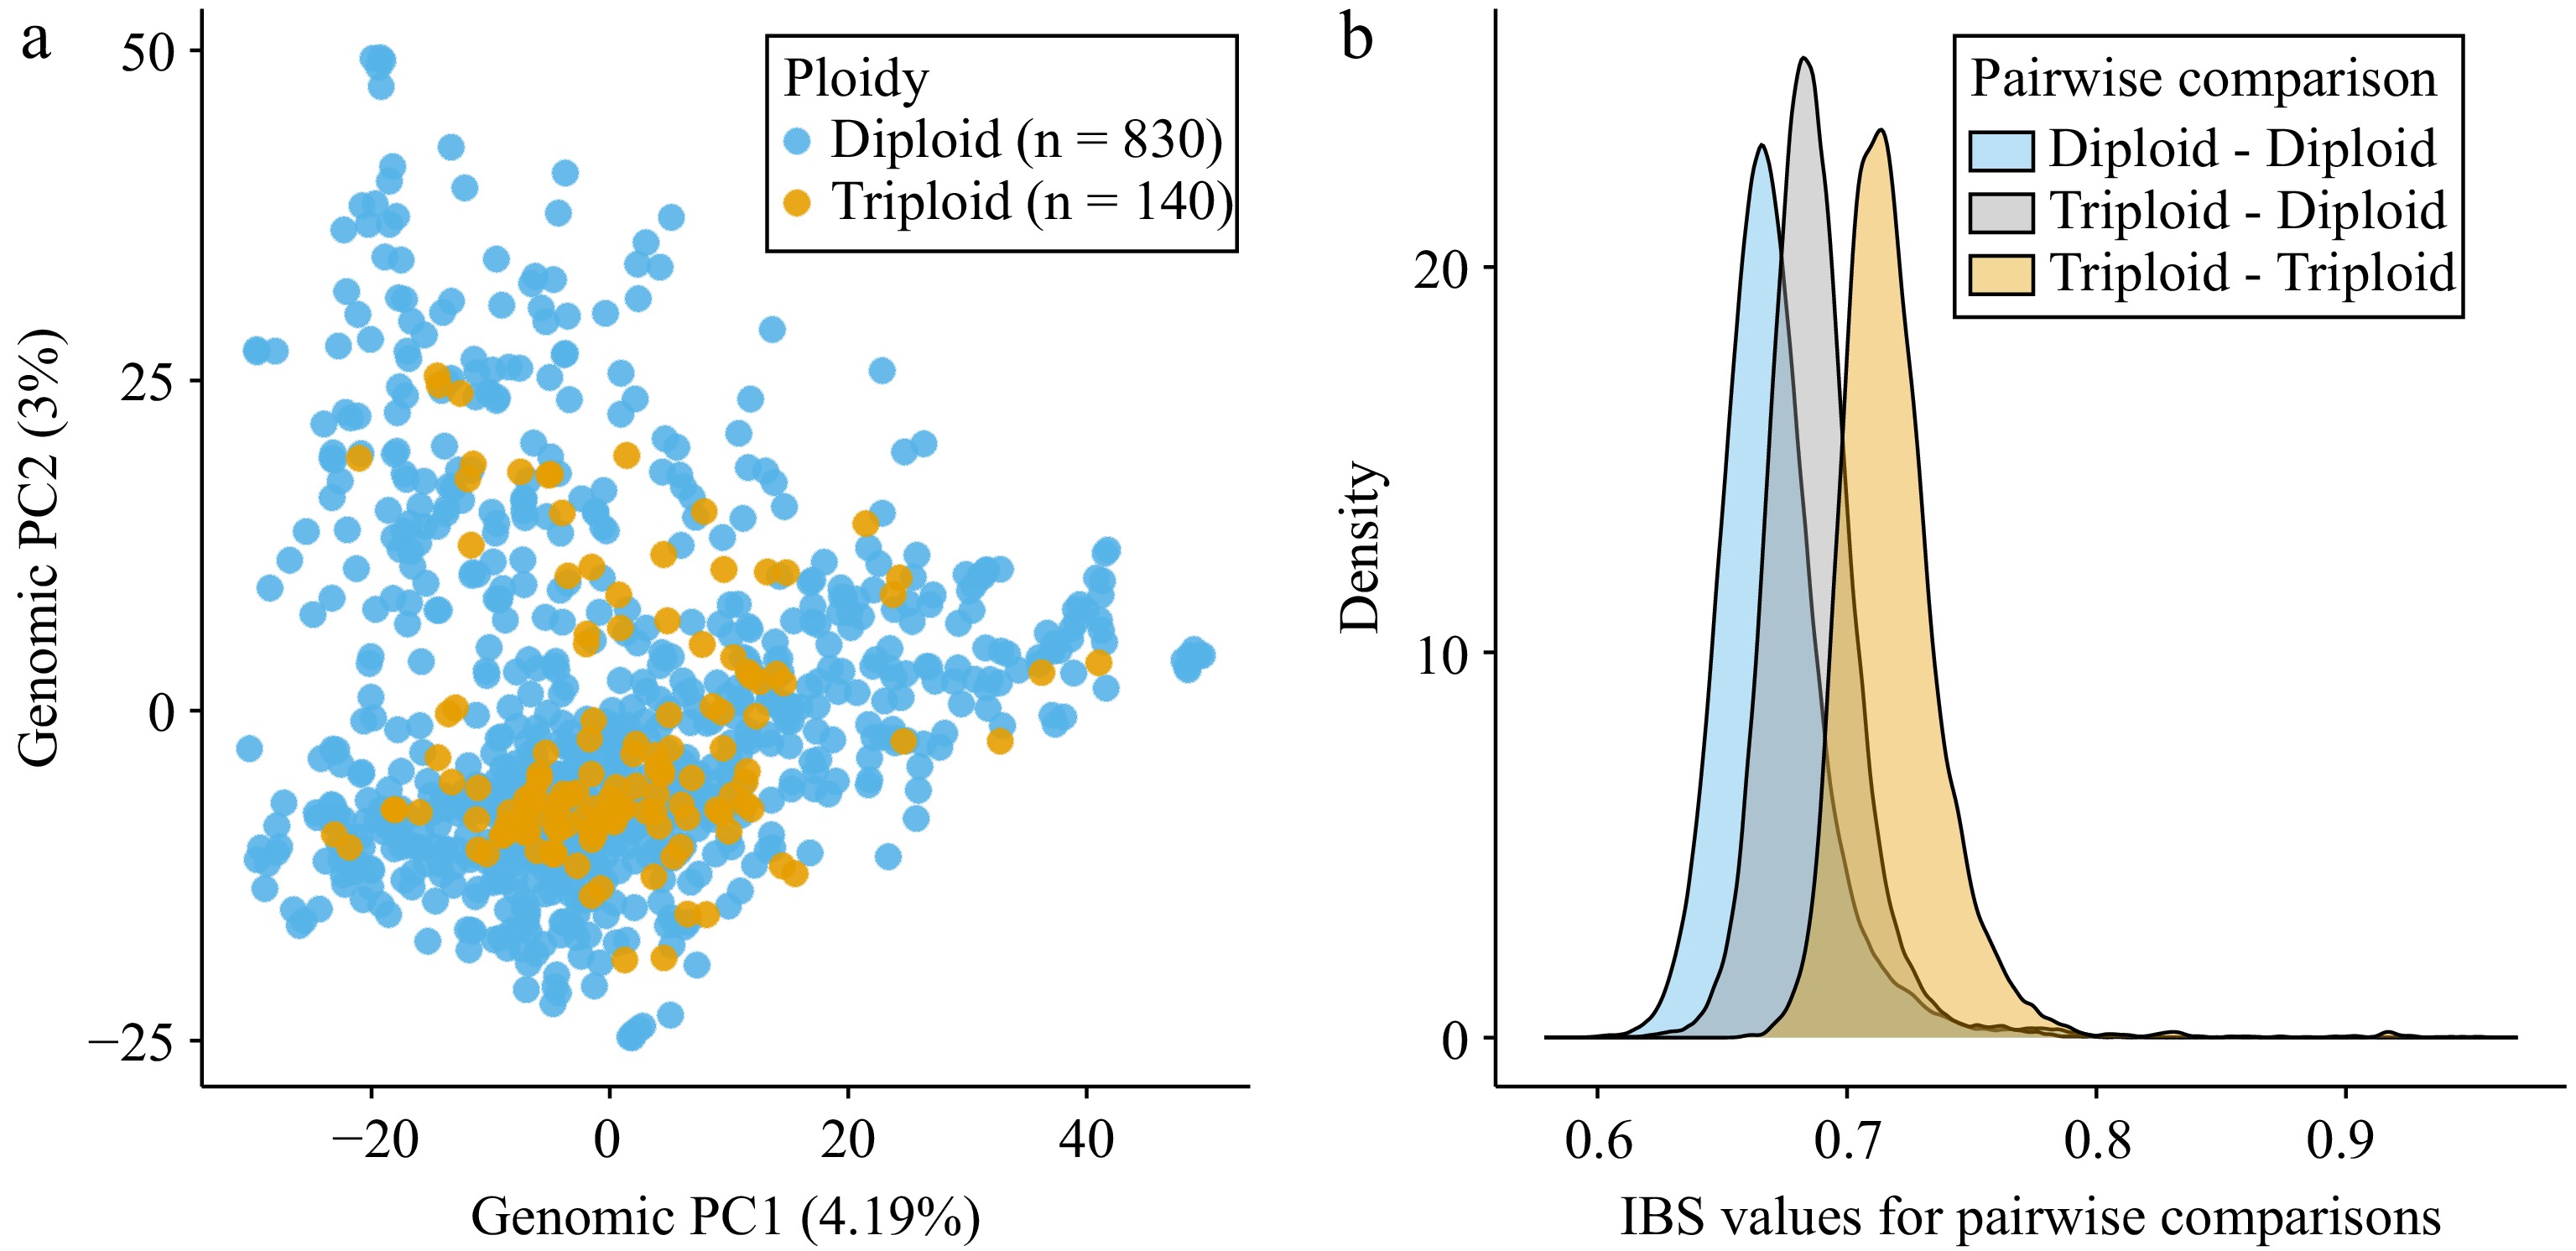
Figure 2.
Genetic similarity among diploid and triploid accessions as determined using genomic data. (a) Principal components analysis (PCA) performed using 51,823 single nucleotide polymorphisms (SNPs). Principal component 1 (PC1) and principal component 2 (PC2) are shown with the percentage of variance explained by each PC indicated in parentheses. Each dot indicates an accession and is labeled by the inferred ploidy level, either diploid (blue) or triploid (orange). (b) Density plots showing IBS (identity-by-state) values for each pairwise comparison. IBS values were calculated based on the average proportion of alleles shared at the genotyped SNPs (105,524 SNPs). The blue curve represents all pairwise comparisons between diploids to other diploids, the gray curve represents all comparisons between diploids and triploids, and the orange curve represents all comparisons between triploids to other triploids.
Trait variation across diploid and triploid apples
-
In addition to determining how genetically similar diploids and triploids are, we evaluated their phenotypic similarity across 10 traits of interest (Fig. 3). For each trait, accessions with missing data were omitted from the analysis. The total number of apple accessions included for each trait ranged from 427 (phenolic content) to 928 (flowering date). The count, mean, median, minimum, maximum, and standard deviation for each trait are reported in Supplementary Table S2. Using a Mann-Whitney U-test to compare diploids and triploids, four traits were significantly different between groups: triploid apples weighed more (W = 27,306, p = 0.01075), were firmer (W = 28,410, p = 0.04548), had a higher phenolic content (W = 6,467, p = 0.002033), and were harvested later (W = 28,310, p = 0.03431). However, after Bonferroni correction, the only between-group comparison that remained significant was phenolic content (p = 0.02).
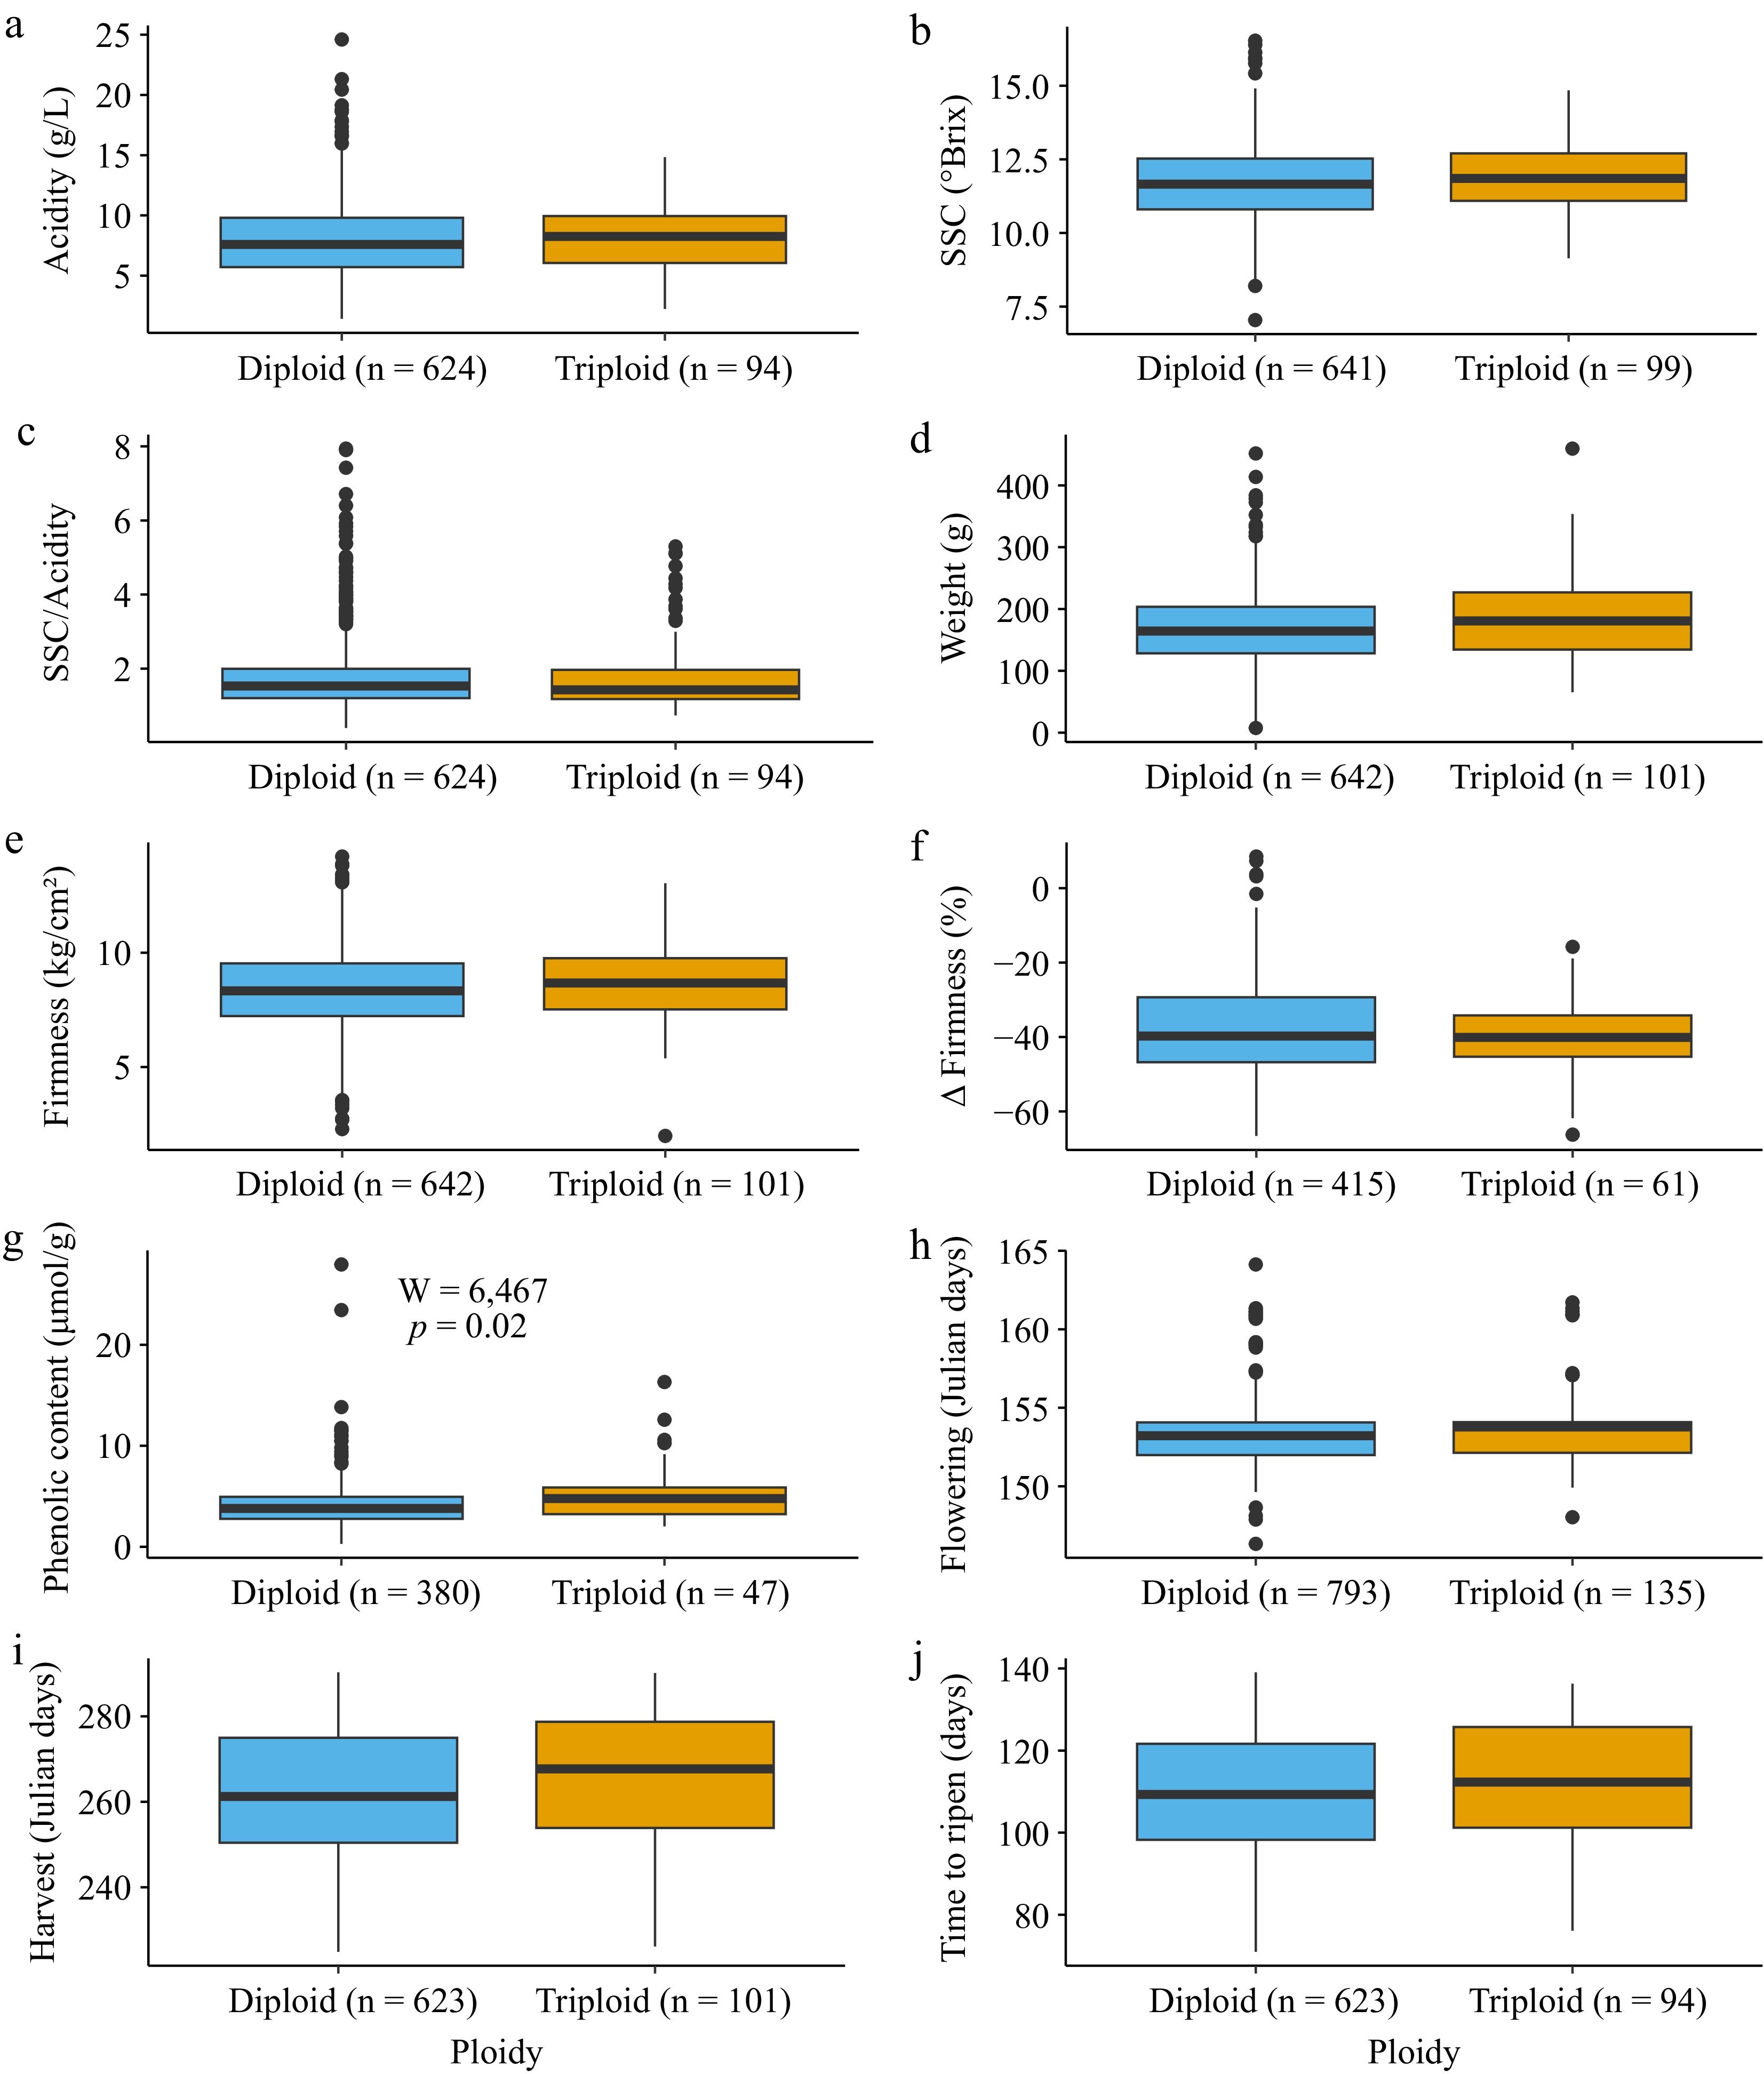
Figure 3.
Boxplots showing phenotype values for inferred diploids (blue) and triploids (orange) for the 10 traits evaluated. The number of accessions in each group is reported beside the ploidy level in all the graphs on the x-axis. A Mann-Whitney U-test was performed to compare trait values between diploids and triploids, and the resulting p-values were Bonferroni-corrected for multiple testing. The test results are shown only for the trait where there was a significant difference between ploidy levels after multiple testing corrections. The following traits are shown: (a) acidity, (b) soluble solid content (SSC), (c) SSC divided by acidity, (d) weight, (e) firmness, (f) change in firmness, (g) phenolic content, (h) flowering date, (i) harvest date, and (j) time to ripen.
Comparison of release year for apples of varying ploidy
-
Lastly, we examined the distribution of release years for diploids and triploids to determine if there was a difference between the groups (Fig. 4). The oldest diploid accession in our dataset was 'Lamb Abbey Pearmain', which was released in 1804, and diploid apples had an average release year of 1947 and a median release year of 1957. In comparison, the oldest triploid, 'Ashmead's Kernel', was released in 1720 and the average release year for triploids was 1919 while the median was 1947. Overall, the release year was significantly later for diploid apples than for triploids in our collection (W = 5,800, p = 0.048).
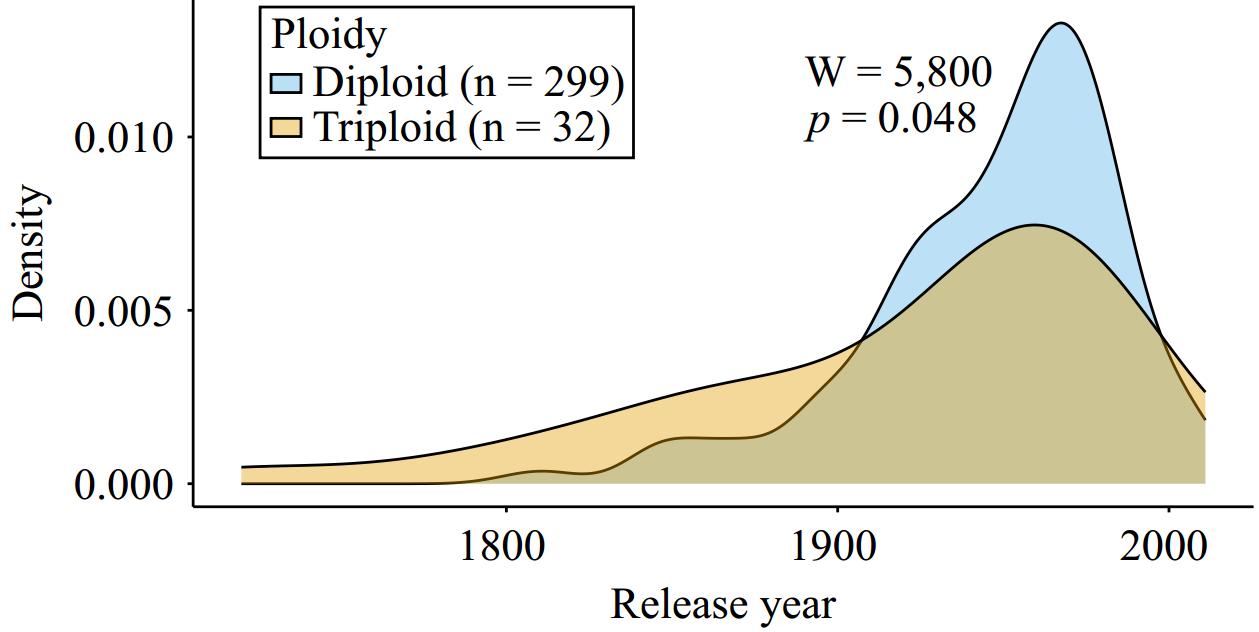
Figure 4.
An overlapping density plot showing the date of release (when known) for diploid and triploid apple accessions. The density distribution for diploids (n = 299) is shown in blue and triploids (n = 32) are shown in orange. A Mann-Whitney U-test was performed to compare release year across groups (W = 5,800, p = 0.048).
By comparing accessions from before or after 1900, we determined that 34 out of the 299 (11%) diploids with release data were released before 1900, while 10 out of the 32 (31%) triploids were released before 1900. Thus, among the accessions in our collection with available release date information, triploids are 2.75 times more likely than diploids to have a release date before 1900.
-
Ploidy level may impact trait variation including vegetative growth and fertility. Apples of varying ploidy have been used in breeding programs and production and understanding the impact of triploidy on apple fruit quality traits is important for making informed decisions. To make a direct comparison between diploids and triploids, we categorized apple accessions from the ABC as either diploid or triploid based on heterozygosity (Fig. 1a). Heterozygosity can be used to differentiate between diploid and triploid in plant samples[24] and is a reliable proxy for ploidy in apple[11,25]. In our study, less than 6.5% of samples with known ploidy were incorrectly categorized based on heterozygosity when compared to previous classification by flow cytometry. In these cases, it may be that our method has inaccurately identified ploidy level or that the accession measured in this study or in previous work was mislabeled. However, the high degree of accuracy provides further support for the use of heterozygosity thresholding as a cost-effective and efficient method for categorizing diploids and triploids using GBS[24,25]. Indeed, for samples in which flow cytometry ploidy data were available, heterozygosity differs significantly between diploids and triploids (Fig. 1b), similar to previous work in kiwifruit (Actinidia kolomikta) and aspen (Populus tremuloides)[24,26].
Although this analysis supports the use of overall sample heterozygosity for accurately distinguishing between diploid and triploid accessions, previous work determined this method was unable to distinguish between diploid and tetraploid apple accessions[11], which exist in apple populations[9,10,14] including the USDA NPGS Apple Collection[11] which largely overlaps with the ABC. This finding may be a result of apple tetraploids being primarily autotetraploids[11]. Although some tetraploid apples have been documented to have phenotypes that are significantly different from diploid counterparts[27,28], the impact of tetraploids in the current study is unclear.
The bioinformatics pipeline[17] used to identify SNPs removed SNPs that were not biallelic, therefore removing triallelic SNPs. As a result, triallelic SNPs, which would only have been present in triploids and assisted in determining ploidy level, were not included in this study. Although the heterozygosity thresholding used here appears to be an accurate proxy, future work could use flow cytometry to more accurately identify ploidy level prior to comparison of trait variation across apple accessions of varying ploidies.
When examining diploid and triploid apples across the first and second genomic PC, triploids show a smaller range of variability in comparison to diploids (Fig. 2a). This may be attributable to the smaller size of the triploid samples (N = 140) in comparison to the diploids (N = 830), with accessions with more extreme values being rare and therefore more common among diploids given the larger sample size. It is possible that with a larger group of triploids or a larger amount of genetic information triploids would capture a similar genomic range. Future work should consider additional genetic information such as the inclusion of triallelic SNPs or whole genome sequencing to more accurately assess the genetic differences between apples of differing ploidies.
The triploid apple accessions measured in this study form a smaller group that captures less genetic variability within the larger population (Fig. 2a) and this finding is supported by our IBS analysis (Fig. 2b). IBS values are significantly higher in triploid-triploid comparisons than they are between diploid-diploid or triploid-diploid comparisons. Thus, by this measure, two triploid accessions will be more genetically similar than two diploids, or a triploid to a diploid from the collection. This result may be due to the increased heterozygosity of triploids when measured using biallelic markers. Triploids have higher heterozygosity by individual values and being more heterozygous means they have more opportunity for alleles to match by state with other triploids. In addition, all three IBS distributions show considerable overlap, indicating that, for example, some diploids are as similar to triploids as some triploids are to each other.
Trait variation across diploid and triploid apples
-
In addition to a genomic comparison between diploid and triploid apples, we leveraged existing trait data published for the ABC[16] to compare phenotypic differences between apples of varying ploidies, identifying subtle but insignificant differences in most cases (Fig. 3). Across the 10 traits examined, only phenolic content differed significantly between groups after Bonferroni correction for multiple testing (Fig. 3g). Prior to correcting for multiple testing, there were measurable differences in fruit weight, fruit firmness, and harvest date between groups, indicating that these differences are subtle and not statistically significant. Although there are some accounts of triploids producing larger[9] and firmer fruit[29], after multiple test corrections, we did not detect significant differences between diploid and triploid apples for these traits. However, the trends observed between diploids and triploids in the present work, while statistically insignificant, do agree with previous findings.
Two possible factors can be considered in the context of our results. First, the trees in our study were approximately 6 years old at the time of data collection for most traits. It is possible that ploidy-dependent differences are less apparent for relatively young trees and become more pronounced as trees age. Secondly, the trees in our study were all grafted to M.9, a dwarfing rootstock[30], which could have reduced vigor in the inferred triploid trees. However, vigor was not measured, and inferred diploids were grafted to the same rootstock. We are unable to assess if there was a triploid-specific rootstock effect on the traits we did measure but future work could explore the consequences of grafting on trees of varying ploidy.
Our findings suggest that across a large and diverse germplasm collection, apples of varying ploidy do not differ significantly across numerous agriculturally important traits. The lack of significant benefit for triploids, combined with reduced fertility[8,31], provides supporting evidence for the reduction in the release of triploid apples (Fig. 4), as there is limited measurable benefit to the use of triploids in apple production.
Across the 10 traits compared between diploids and triploids, the only trait that significantly differed between groups was phenolic content, which was higher in triploid accessions (Fig. 3g). To date, there are conflicting reports on the influence of triploidy on the production of fruit metabolites. For example, one comparison between diploids and triploids from apple breeding programs noted no differences in the production of fruit metabolites[9]. However, a recent investigation of acidity in cider apples found that triploid cider apples were higher in titratable acidity on average than their diploid counterparts[32]. Increased acidity in triploids was suspected to be due to the extra copies of genes related to acid production, particularly those at the malic acid Ma1 locus[32]. Similarly, the increase in phenolic content observed here may be a product of increased copies of genes in the biosynthetic pathways that produce phenolic compounds in triploids[33,34]. Although this may explain the difference in phenolic content across apples of varying ploidy, it is worth noting that, for example, SSC did not significantly increase in triploid apple fruits despite additional copies of genes responsible for SSC production. An alternative explanation for the observed differences in phenolic content may be the significantly earlier release dates of triploid accessions (Fig. 4). Previous work identified decreasing phenolic content with more recent apple varieties[16] and differences in phenolic content between diploids and triploids may be a reflection of this trend. Regardless of the explanation for the differences, triploid apples with higher phenolic content could be useful for cider production in the future, particularly if they also have higher acid production[32].
Finally, while the phenotype data from the ABC population are extensive[16], there are phenotypes such as leaf shape and size, stomatal size, plant height, and plant vigor that may differ between diploids and triploids, as seen in other tree species[4,35,36]. Differences in disease resistance would also be valuable to assess, as there is evidence that polyploids may have greater resistance than diploids to some pathogens[37]. In the future, a more detailed comparison of plant phenotypes may uncover important phenotypic differences attributable to ploidy.
Variation in release date when comparing diploid and triploid apples
-
Triploid apples have been commercially released and grown for over 200 years (Fig. 4). Indeed, the earliest apple release recorded across the 331 accessions examined here was a triploid released 84 years before the earliest diploid. The inferred triploid accessions with reported release years examined here were released significantly earlier than inferred diploid accessions (Fig. 4). Our work provides further evidence that contemporary breeding programs are primarily releasing diploid apple varieties: in contrast to diploids, triploid varieties were nearly three times as likely to be released before 1900. The difference in release date seen here is likely at least partially attributable to difficulties related to fertility[8,15] and the infrequent use of triploid apples in breeding programs, particularly if triploidy offers no significant improvement to agricultural traits, as suggested by our analysis.
-
By examining genomic and trait variation across over 900 unique apple accessions, we were able to compare inferred diploid and triploid apples. We provide further evidence that heterozygosity can be used as a reliable method for estimating ploidy level. Our work suggests that across diverse apples, triploids are not significantly different from diploids for nine agriculturally important traits. However, we did identify significantly higher phenolic content in triploid accessions, indicating that although differences between diploids and triploids are subtle, there is still measurable variation that may be desirable in certain contexts, such as for cider production. In summary, our work suggests that contemporary commercial breeding programs are typically releasing diploid varieties and there is limited benefit to the use of triploids in apple production.
We thank Sophie Watts (Dalhousie University) for useful input on this article. We also appreciate the feedback of two anonymous reviewers which strengthened the manuscript. Zoë Migicovsky was supported by funding from the Canada Research Chairs program and the Natural Sciences and Engineering Research Council of Canada (NSERC).
-
The authors confirm contribution to the paper as follows: study conception and design: Greaves E, Myles S, Migicovsky Z; analysis and interpretation of results: Greaves E, Davies T, Myles S, Migicovsky Z; draft manuscript preparation: Greaves E, Davies T, Migicovsky Z. All authors reviewed the results and approved the final version of the manuscript.
-
All data and code are publicly available on GitHub (https://github.com/zoemigicovsky/apple_ploidy).
-
The authors declare that they have no conflict of interest.
- Supplementary Table S1 Assigned apple ploidy for 970 apple accessions examined in this study.
- Supplementary Table S2 Summary of phenotype data included in this study.
- Copyright: © 2025 by the author(s). Published by Maximum Academic Press, Fayetteville, GA. This article is an open access article distributed under Creative Commons Attribution License (CC BY 4.0), visit https://creativecommons.org/licenses/by/4.0/.
-
About this article
Cite this article
Greaves E, Davies T, Myles S, Migicovsky Z. 2025. Comparing diploid and triploid apples from a diverse collection. Fruit Research 5: e008 doi: 10.48130/frures-0024-0041 

Comparing diploid and triploid apples from a diverse collection
- Received: 14 July 2024
- Revised: 13 December 2024
- Accepted: 23 December 2024
- Published online: 21 February 2025
Abstract: Apples (Malus X. domestica Borkh.) are an economically important fruit species and are primarily diploid, although other ploidy levels exist. The impact of ploidy on agricultural traits in apple is not well understood but is an important factor to consider for breeding and production of apples. We used heterozygosity to infer ploidy for 970 apple accessions from a diverse collection. Next, we contrasted inferred diploid and inferred triploid apples across 10 agriculturally important traits. After correction for multiple testing, we determined that triploids have significantly higher phenolic content, but do not significantly differ from diploids for any other trait. We also determined that triploid varieties have significantly earlier release dates than diploids, suggesting that contemporary breeding programs primarily release diploid varieties. Ultimately, our results provide evidence that phenotypic differences between trees of differing ploidy are subtle and often insignificant and that there are limited measurable benefits to the use of triploids for apple production.
-
Key words:
- Ploidy /
- Apples /
- Heterozygosity /
- Breeding /
- Polyploidy /
- Horticulture