


-
Almond is an important worldwide nut crop, with a significant portion of production occurring in California, where 647,497 hectares are dedicated to their cultivation. The kernel is the edible portion of the nut and contains a variety of chemical compounds contributing to nutritional and postharvest value. Almonds are high in unsaturated fats (44%−61% fat by weight) and over 90% of the total lipid content of the kernel is made up of oleic and linoleic acids[1,2]. Among the various tree nuts, almonds have the highest vitamin E (tocopherol) content, per 100 mg of raw almonds, α tocopherol of 34.9 mg[3,4] and they contain phytochemicals such as phenolics which protect against oxidative stress[5].
Unshelled almonds have a shelf-life of 12 months, however shelling and processing of almonds, such as roasting, decreases shelf-life due to chemical and physical alterations during the roasting process[2]. Shelf-life is controlled by the chemical composition of the almond kernel and its storage environment. Almonds are low in moisture, 3%−6%, which helps minimize the oxidative chemical and enzymatic reactions that cause rancidity. Monounsaturated fatty acids, like oleic acid, are less susceptible to lipid oxidation during postharvest storage, in contrast to polyunsaturated fatty acids, like linoleic acids, which readily react with oxygen to cause quality problems. Lipid degradation in almond can be caused by either enzyme-catalyzed hydrolytic cleavage or oxygen driven oxidative lipid cleavage. Enzymatic hydrolysis occurs when there is an increase in moisture content, activating enzymes that subsequently lead to lipid cleavage. Further oxidation of the cleaved lipids then results in the development of a rancid product[6]. Consequently, lipid oxidation causes degradation and generates byproducts, like peroxides and aldehydes, that are known to produce off-flavor and smells such as hexane and nonanal. Volatiles such as benzaldehyde, phenylethyl alcohol, and benzyl alcohol contribute to positive flavors, while hexanal and pentanal have negative flavors[7]. Quantitation of volatiles associated with rancidity has been used to characterize rancid flavor[8]. Phenolic compounds are concentrated in the almond seed coat and contain antioxidants (flavonoids) and defense response chemicals (tannins). The most abundant phenolic compounds in the whole almond are proanthocyanidins, hydrolysable tannins and flavonoids[9].
There are accelerated methods to observe lipid oxidation which include the active oxygen method, Schaal Oven method, and Rancimat method[10]. The Rancimat method was developed by Hadron & Zurcher[11] to measure oxidative stability and has been used extensively in the determinations of oxidative stability of oils and fats[12]. This method uses heat and oxygen to speed up the oxidation causing the production of volatile organic compounds while the other two methods evaluate peroxide formation.
The use of molecular markers in genetic studies and breeding programs have become routine. Genotype-by-sequence (GBS) is low cost per sample, high-throughput, NGS-based that uses targeted restriction enzymes[13]. The result are high-density SNPs that can be used for population genetic studies, germplasm characterization, breeding and linkage and association mapping. Kompetitive Allele Specific PCR (KASP) is used for SNP genotyping based on dual FRET (Fluorescent Resonance Energy Transfer). Once SNPs have been identified to be in association with a trait via genome-wide association, the region surrounding the SNPs, usually 100 bp on each side can be used to design primers for KASP assays which can then be used to screen parent or progeny to determine if they have that allelic variant.
From a breeding standpoint and according to industry needs, it would be desirable to have a cultivar with extended shelf-life go to market and be used in a variety of foods and candy confections. A previous study performed by Font i Forcada et al.[1] evaluated a biparental population 'Vivot' × 'Blanquerna' for genetic loci responsible for variation in almond kernel composition and found associations with tocopherol and stearic acid. The objective of this study was to evaluate a breeding population for lipid composition desired for extended shelf-life. We hypothesize that a higher oleic acid and tocopherol content will result in a higher oxidative stability index with the rancimat. Here, we collected phenotypic measurements across two years, and performed genome-wide association for eight almond families, common cultivars, and peach accessions. Further biochemical analysis was performed on a subset of samples to evaluate chemical compositions of both shorter and extended shelf-life individuals. Lastly, we aimed to develop KASP molecular markers and test and validate those markers on an unrelated of set of individuals to be applied for future marker breeding.
-
Almonds trees were grown at Wolfskill Experimental Orchards in Winters, CA, USA. Kernels were hand harvested from August to September after hull split in 2019 and 2020 from mature trees aged 7–10 years. Kernels were dried in almond dryers and stored inshell in a 0.18 ± 0.4 °C refrigerator with 82.8% ± 2.2% humidity until use.
A panel of 270 unique almond trees, 260 in 2019 and 240 almond trees in 2020 (Supplementary Table S1) were screened utilizing a 892 Professional Rancimat (Metrohm USA, Riverview, FL, USA) to determine which genotype had high or low susceptibility to kernel rancidity. The rancimat is an instrument that accelerates the oxidation process by applying heat and air flow, and by providing an estimate of the oxidative stability of foodstuff. The air flow rate was adjusted to 20 L/h and the heating blocks were set to 120 °C. Almond kernels were first stored in a Binder (Tuttlingen, Germany) moisture chamber set at 22 °C and 45% relative humidity for a period of 2 weeks, or when the moisture content of kernel was held constant. Almond kernels were dark roasted, following industry standards, at 152 °C in a Moffat (Winston-Salem, NC, USA) turbofan oven model E3205 for 15 min and the tray was turned halfway through the roasting. Four kernels per tree were ground into a fine powder with a KitchenAid (Benson Harbor, MI, USA) spice grinder BCG211OB, then sifted through a 20 µm sieve. Ground powder (0.4 g) was measured with an Ohaus Scout SPX balance (Parsippany, NJ, USA) and placed into a glass reaction cuvette. There were four biological replicates of each genotype. The weighed sample in the cuvette was placed in the open wells of the rancimat. Fifty mL of double filtered deionized water were used in the measuring vessels. Briefly, the rancimat is controlled by StabNet computer software (Metrohm USA, Riverview, FL, USA) where an algorithm determines the break point, or induction time, in the rancidity curve, which is the time until a defined conductivity change has been achieved. The heated kernel sample emits volatile compounds which fill the measuring vessel and change the conductivity of the water. An electrode measures the change in conductance throughout the run, thereby measuring rancidity indirectly.
R package 'emmeans V 1.8.9'[14] was used to calculate the adjusted means of two years, where the fixed effects were year and genotype. The model for Eqn (1) was used:
${\rm Y_{ijk}= {\text μ} + g_{i} }+ y_{\rm j} + {\text ε}_{\rm ijk } $ (1) where, Yij stands for the k-th observation of the genotype i in the year j, μ is the constant overall mean, and εijk is the random error term with mean of 0 and a variance σ2ε.
Narrow-sense heritability (h2) was estimated using data from 264 trees across eight families by dividing the estimated additive genetic variance by the total phenotypic variance. The families ranged between two genotypes and 118 genotypes and are shown in Supplementary Table S1.
To further identify the lipid composition, kernels from 21 individuals that were interesting; exhibited rapid or delayed rancidity were chosen to perform a targeted analysis, including free fatty acidity, fatty acid profiles via gas chromatography mass spectrometry (GC-MS), phenolics/antioxidants via high-performance liquid chromatography (HPLC), and volatiles (GC-MS).
Moisture and total fat analysis
-
For moisture analysis, 40 g of milled sample flour was transferred into a 600 mL beaker and dried in an oven at 105 °C until a constant weight was reached. Afterwards, samples were kept in a desiccator to reach room temperature, and reweighed. Fat from the milled samples were extracted by Soxhlet standard extraction mode of the Buchi extraction system (E800, Buchi Labortechnik AG, Flawil, Switzerland) with n-hexane for 50 extraction cycles and 30 min rinsing[15]. Each sample was analyzed in triplicate.
Fatty acid profiling
-
The fatty acid composition of oil samples was determined as methyl esters by gas chromatography/mass spectrometry according to Tapia et al.[16]. Aliquots of 0.1 g of sample were diluted in 1mL of n-hexane and agitated for 10 s. Subsequently, 0.1 mL of a 2N KOH solution in methanol was added and mixed in a vortex for 2 min. After the solution turned clear and transparent, 500 µL of the upper phase, containing the fatty acid methyl esters, was decanted, and diluted with n-hexane to a final volume of 1 mL and analyzed within 12 h from preparation. Samples were analyzed using a gas chromatograph (7890A, Agilent Technologies, Palo Alto, CA, USA) equipped with a split injector and a flame ionization detector. A ZB-23 capillary column (20 m, 180 µm, 0.2 µm) was used. An initial column temperature of 80 °C was used for 0.5 min, then programmed to 175 °C at the rate of 65 °C/min, and finally to 230 °C at the rate of 7 °C/min. At each stage of programming, the temperature was held for 0, 0.5, and 5 min, respectively. The injector and detector were held at 250 and 260 °C, respectively. A sample of 1 µL was injected. Peak areas of fatty acids and their quantification were performed using Agilent open Lab ChemStation for Windows. Identification of fatty acid methyl esters was carried out using a mix of 37-component fatty acid methyl esters purchased from Supelco (Sigma-Aldrich, St. Louis, MO, USA). Each sample was analyzed in triplicate. Individual fatty acids were expressed as the percentage of total fatty acids. Each sample was analyzed in triplicate.
Tocopherol extraction and analysis
-
Extraction was performed according to the method of Gimeno et al.[17] with some modifications. Oil (40 µL) was briefly vortexed in 160 µL of hexane. Six-hundred µL of methanol and 200 µL of internal standard solution (α-tocopherol acetate in ethanol, 300 µg/mL) were added. The sample was vortexed for 1 min and centrifuged (1,788.8 × g force, 5 min, Beckman GS-15R). Samples were stored at −20 °C to allow the separation between oil and organic phase. The organic extract was filtered (0.45 µm, nylon) and analyzed using UPLC-DAD (ultra-performance liquid chromatography-diode array detector). A blank followed by a standard mix (δ-tocopherol, γ-tocopherol, and α-tocopherol) was run after every 15 samples. The analysis was performed on an Agilent 1290 Infinity II LC system with a diode-array detector using an Agilent ZORBAX Eclipse Plus C18 column (3.5 µm, 3 mm × 100 mm). The mobile phase was methanol : water (96:4) with 20 µL injection volume and flow rate of 1.0 mL/min. The total run time was 12 min with DAD signal recorded at 292 nm. Tocopherols were identified by their retention time in comparison with the standards. Each sample was analyzed in triplicate.
Extraction and evaluation of total phenols
-
Phenols were extracted using a method adapted from conditions described in previous studies[18]. A double extraction of 0.4 g of ground kernel in n-hexane (6 + 4 mL) are vortexed for 2 min followed by 5 min ultrasound and centrifuged at 2,000× g for 10 min. Then, 0.4 g of the previously combined extract were extracted using 20 mL in two extractions (10 + 10 mL) of MeOH : H2O : HCOOH (80:20:0.1), with 2 min vortex followed by 5 min ultrasound and centrifugation at 2,000× g for 10 min. The supernatant was collected, and the solid residues were re-extracted a second time as described above. The extracts were combined and membrane-filtered through cellulose filters (0.45 µm pore size; Macherey-Nagel, Düren, Germany). Total phenolic compounds from the extracts above were quantified by the Folin-Ciocalteu method[19] using a calibration curve of gallic acid and expressed as gram per kilogram of kernel. Each sample was analyzed in triplicate.
Genotyping
-
Genotyping-by-sequencing (GBS) was performed with DNA samples from the genome-wide association study (GWAS) panel (Supplementary Table S2) using ApeKI as a restriction enzyme. A custom python script was used to run gbstrim (
https://github.com/kdm9/gbstrim ) in batches to trim reads to a maximum length of 93. Stacks 2[20] was used to clean data by truncating reads to obtain expected amplicon lengths. Bowtie2 v2.4.0[21] was used to index genome and align reads to almond 'Nonpareil' genome V1.0 (www.rosaceae.org/Analysis/13738196 ). SAMtools 1.12[22] was used to convert sam files to sorted bam files. Freebayes 1.3.6[23] was used for SNP variant calling. Filtering was performed in VCFtools[24] with the following parameters: for mapping quality (minimum 80%), allele balance, mean read depth (minimum 7, maximum 25), minor allele count (minimum 3), minor allele frequency (MAF) (minimum 0.05), missing SNPs (maximum (0.85 per genotype), read mapping quality score (minimum 20), and read depth differences between forward and reverse strands (maximum 100-fold), removing indels, selecting only bi-allelic SNPs, and removing trees with more than 50% missing data. Imputation was performed in Tassel 5[25] with the LinkImpute LD-KNNI algorithm based on k-nearest neighbor genotype imputation method[26] with default parameters. Population structure for the families in this study was evaluated with R package 'LEA'[27]. Linkage disequilibrium (LD) decay was evaluated for each chromosome using an LD window of 500 kb and an average R[2] value of 0.186.Genome-wide association
-
Models Bayesian-Information and Linkage disequilibrium iteratively nested Keyway (BLINK)[28] and Fixed and Random Model Circulating Probability Unification (FarmCPU) algorithm in R package GAPIT 3[29] were used with input phenotypic data as the adjusted means for 2019 and 2020 induction times for 264 individuals. Both BLINK and FarmCPU use a multi-locus model for performing genome wide testing of markers. BLINK uses two fixed effect models iteratively: testing each marker with multiple associated markers used as covariates which takes population structure into account and the selection of covariate markers used as a control for spurious associations rather than using kinship. FarmCPU implements a generalized linear model (GLM) where principal components (PCs) are added as covariates to scan for significant markers. Kinship relationships, dendrogram and principal component analysis were calculated in GAPIT 3[29]. The number of PCs to add as covariates in the multivariate model was defined using the function model selection implemented in GAPIT, once the initial PCA and scree-plot was evaluated for the maximum number of PCs to add. A minor allele frequency (MAF) was set threshold of 0.05. The input file with marker genotypes can be found in (Supplementary Table S3).
Validation of KASP markers
-
For each SNP that was significantly associated with induction time, SAMtools 1.12[21] function faidx was used to retrieve a 100 bp sequence containing the SNP (50 bp upstream and 50 bp downstream). That sequence was analyzed using Kraken software (LGC Limited) to design primers for a KASP assay.
The newly designed KASP assays were applied to DNA samples from 55 individuals that were on the GWAS panel in order to first validate the rancimat run times and genotypes, and another 52 individuals that were unique to the GWAS analysis (cultivars, advanced selections, and seedlings from the breeding program, Supplementary Table S2). Additional rancimat data was collected for the 52 individuals so that their genotype could be compared with their induction times for accuracy.
The KASP genotyping was conducted on SNPLine (LGC Limited) platforms according to the manufacturer's instructions. Results were analyzed using Kraken (LGC Limited) software.
-
Data collected from almonds harvested in 2019 had an overall shorter rancimat run time than almonds harvested in 2020 and data collected in those years were significantly different (p < 0.001) (Fig. 1, Supplementary Table S1). For the induction time adjusted means of both years, the shortest run time was 3.62 h while the longest run time was 20.46 h and the mean was 11.34 h and the median was 11.35 h. Narrow-sense heritability for induction time was found to be 0.586. Crosses 'Winters' × 00,2-3 had progeny with the shortest induction times (9,9-15, 9,9-467, 10,1-314, 10,1-104), and 'Tardy Nonpareil' × 95,1-26 had progeny (12,5-400). Crosses that had either 'Ferragnes' or 'Nonpareil' as one parent had progeny with the longest induction times (10,10-82, 10,10-157, 10,9-295, 10,9-148, 10,7-277, 10,7-400, 10,3-36) (Supplementary Table S1).
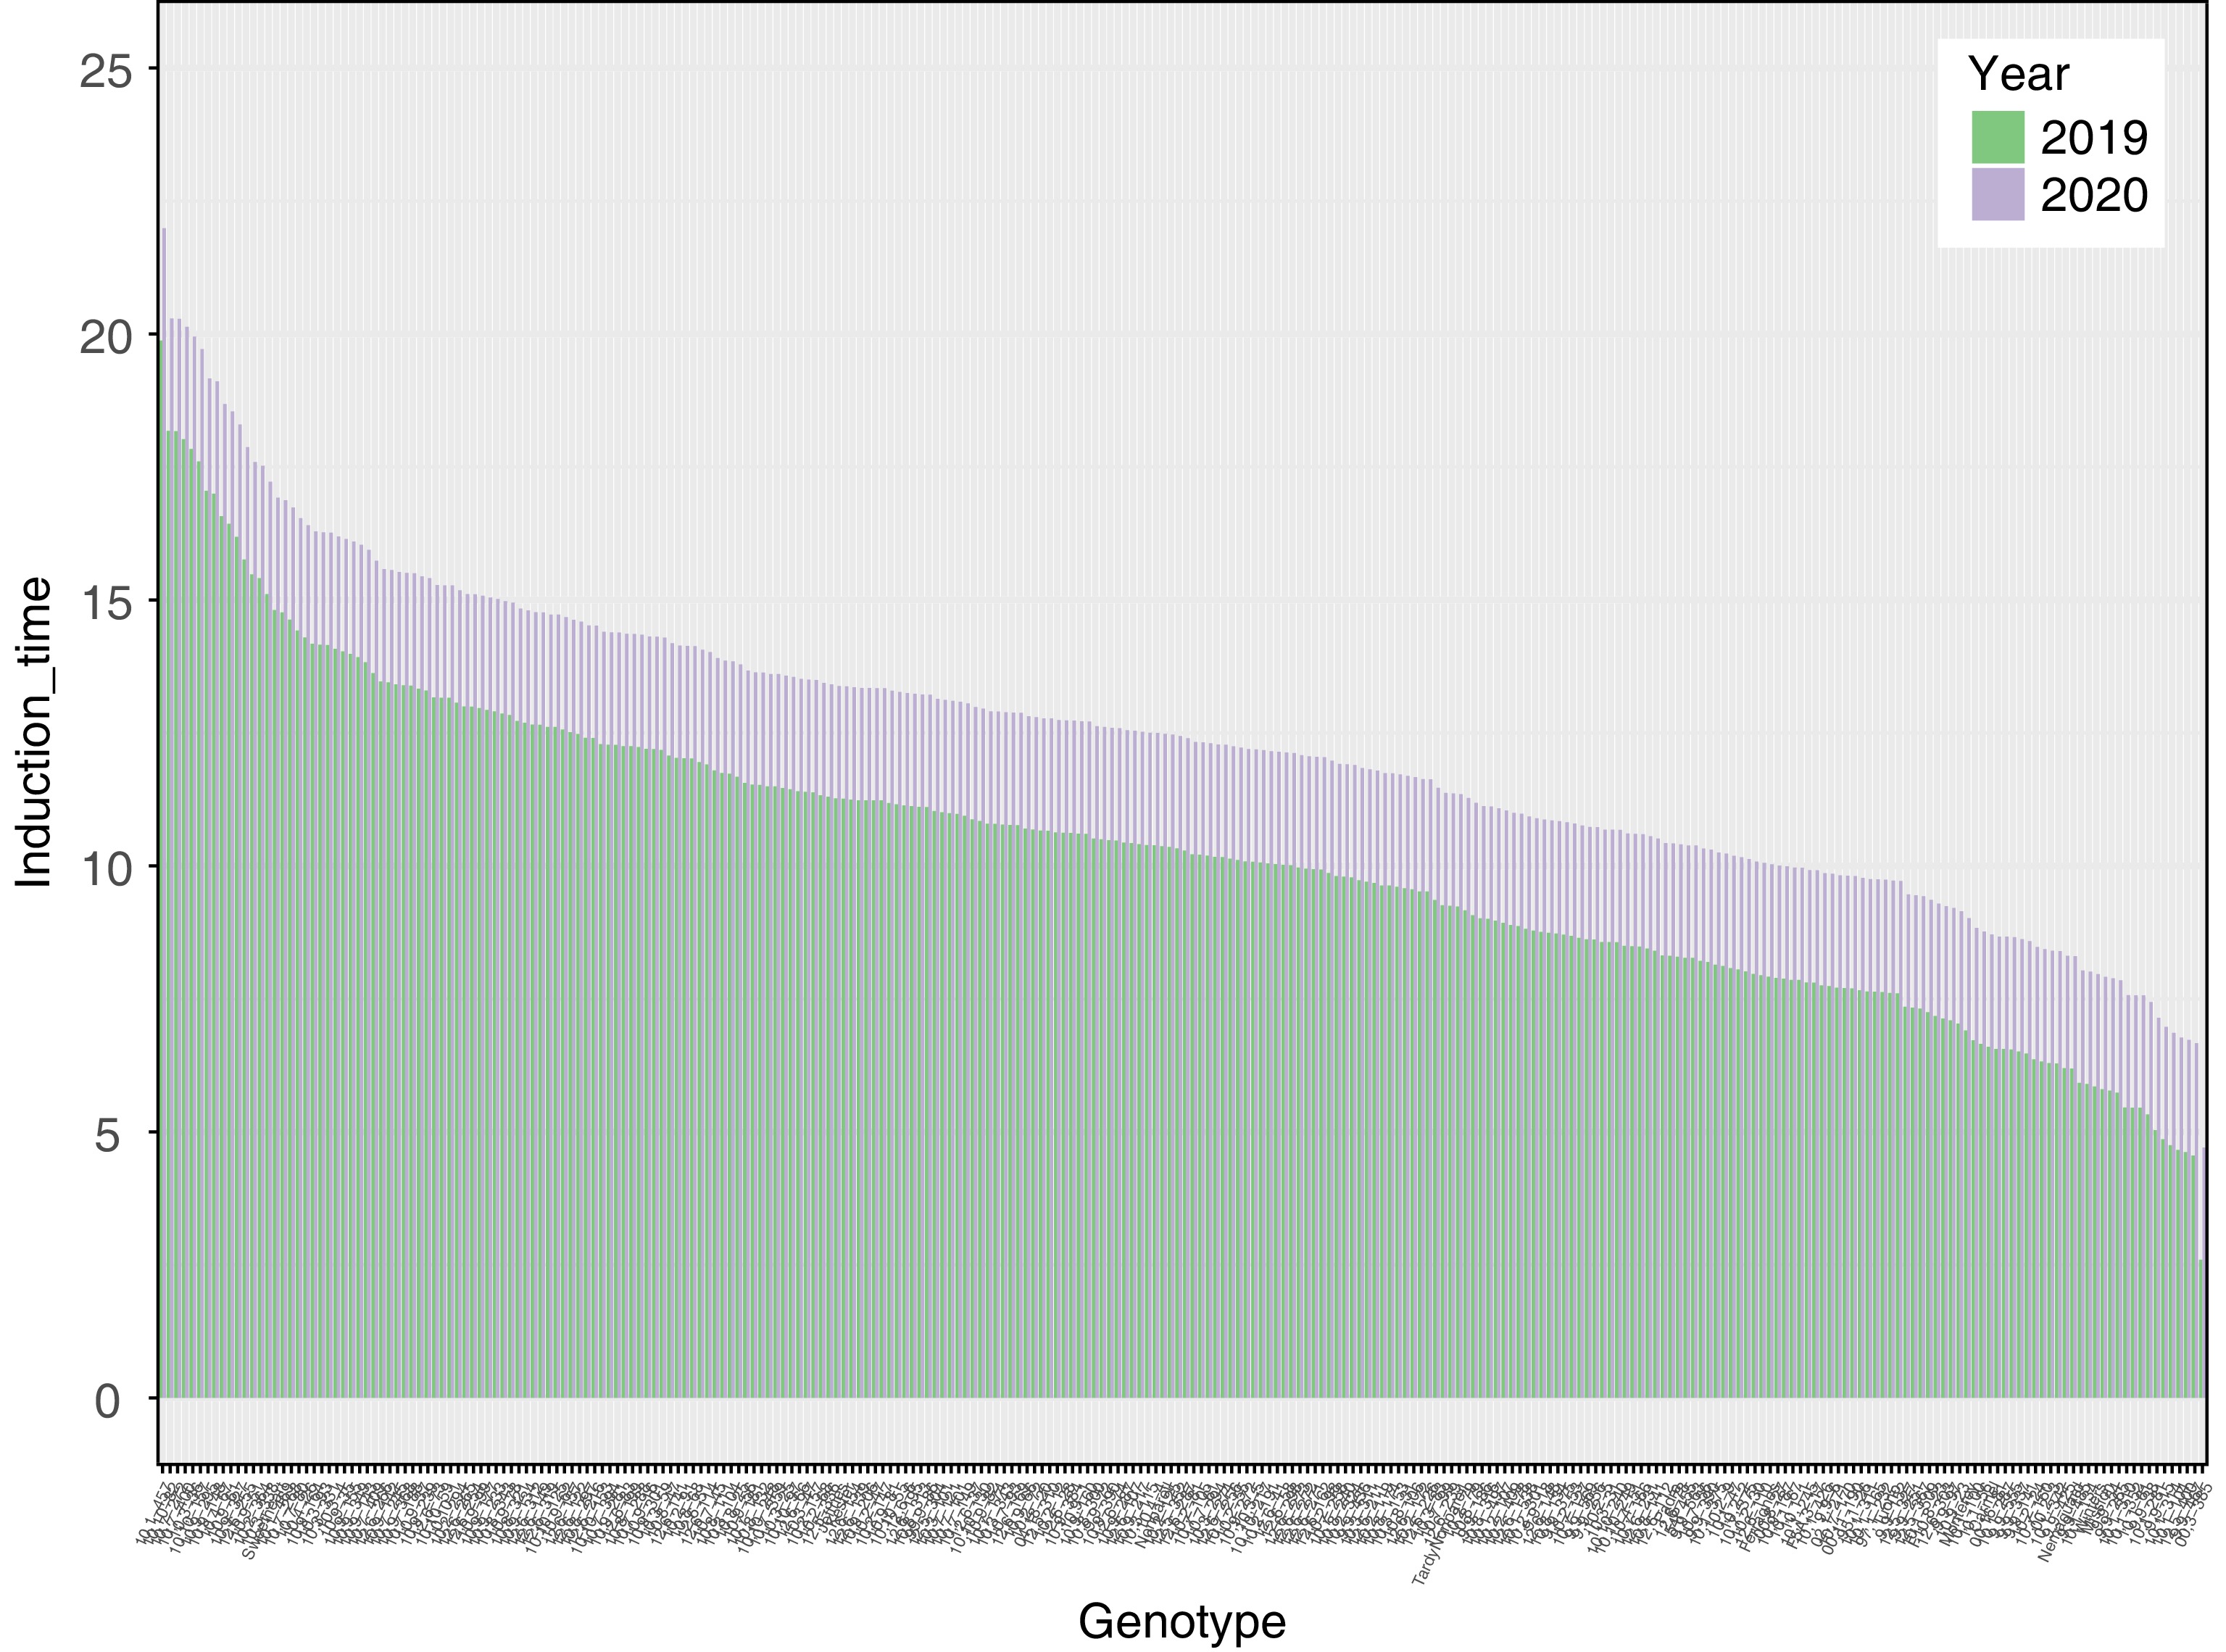
Figure 1.
Induction time (stability index) for two years of harvest. Induction time was calculated with a rancimat machine for 2019 and 2020 on roasted almond kernels.
Biochemical analysis
-
Induction time with the rancimat had a positive correlation with fatty acids C18:1 (r = 0.78, p = 0.0) and C18:0 (r = 0.63, p < 0.001), while a negative correlation was found for α-tocopherol (r = −0.52, p < 0.001) (Supplementary Fig. S1).
In ANOVA for fat content, there was a significant interaction between genotype and year (p = 0.01), year was significant (p < 0.001) (Supplementary Fig. S2a) and the state (raw or roasted) was significant (p < 0.001). Total fat content for selection 10,8-297 in 2019 was 57.16% (raw), and 58.72% (roasted) which corroborated with a higher induction time (12.46 h) (Table 1, Supplementary Table S2). In 2020 selection 10,9-78 (roasted) had highest fat content of 68.16% and 10,2-409 (raw) had highest fat content of 79.54% which also corroborated with longer induction times, 14.99 h and 13.88 h respectively (Table 1).
Table 1. Summary of low and high values for chemical composition. Phenolics, fat content, α-tocopherol and induction time were measured on raw and roasted almonds for two years, 2019 and 2020. The letters indicate the genotype at the bottom of the table.
Year Physical state Statistic Phenolics (mg/kg) Fat content (%) Alpha-tocopherol (mg/kg) Induction time (h) 2019 Raw Low 2,757.26a 47.04h 210.94a High 8,692.92b 57.16i 717.35l Mean 6,080.73 51.87 430.24 SD 2,792.99 3.86 172.76 n 8 8 12 Roasted Low 3,805.05c 51.53e 166.18g 5.15a High 10,100.10b 58.72j 547.03l 14.81h Mean 7,333.63 55.61 397.38 10.39 SD 2,384.46 3.31 105.92 2.62 n 8 8 12 260 2020 Raw Low 1,217.34d 48.81a 246.77k High 8,038.48e 79.54k 418.24l Mean 3,666.11 54.9 336.84 SD 2,168.95 6.21 56.59 n 16 16 9 Roasted Low 2,984.06f 52.77f 230.13k 7.61f High 10,973.69g 68.16d 380.89l 14.88e Mean 5,352.89 59.22 284.68 12.33 SD 2,438.25 4.21 49.45 3.41 n 16 16 9 240 The letters indicate the genotype listed here at the bottom of the table. a: 10,1-104, b: 12,5-310, c: 'Winters', d: 10,9-78, e: 10,9-239, f: 'Tuono', g: 10,8-297, h: 'Sweetheart', i: 10,10-82, j: 10,7-160, k: 10,2-409, l: 'Nonpareil'. Total phenolic content of raw almond kernels ranged between 1,217.34–10,912.97 mg/kg, and for roasted almond kernels was 1,828.82–10,973.69 mg/kg (Fig. 2a, Supplementary Table S3). ANOVA revealed that the state (p < 0.001) and year was only marginally significant (p = 0.04), but there was a year by individual interaction (p < 0.001) (Supplementary Fig. S2b). Table 2 displays what selections/cultivars had high and low values for phenolics, fat content, α-tocopherol as compared to induction time.
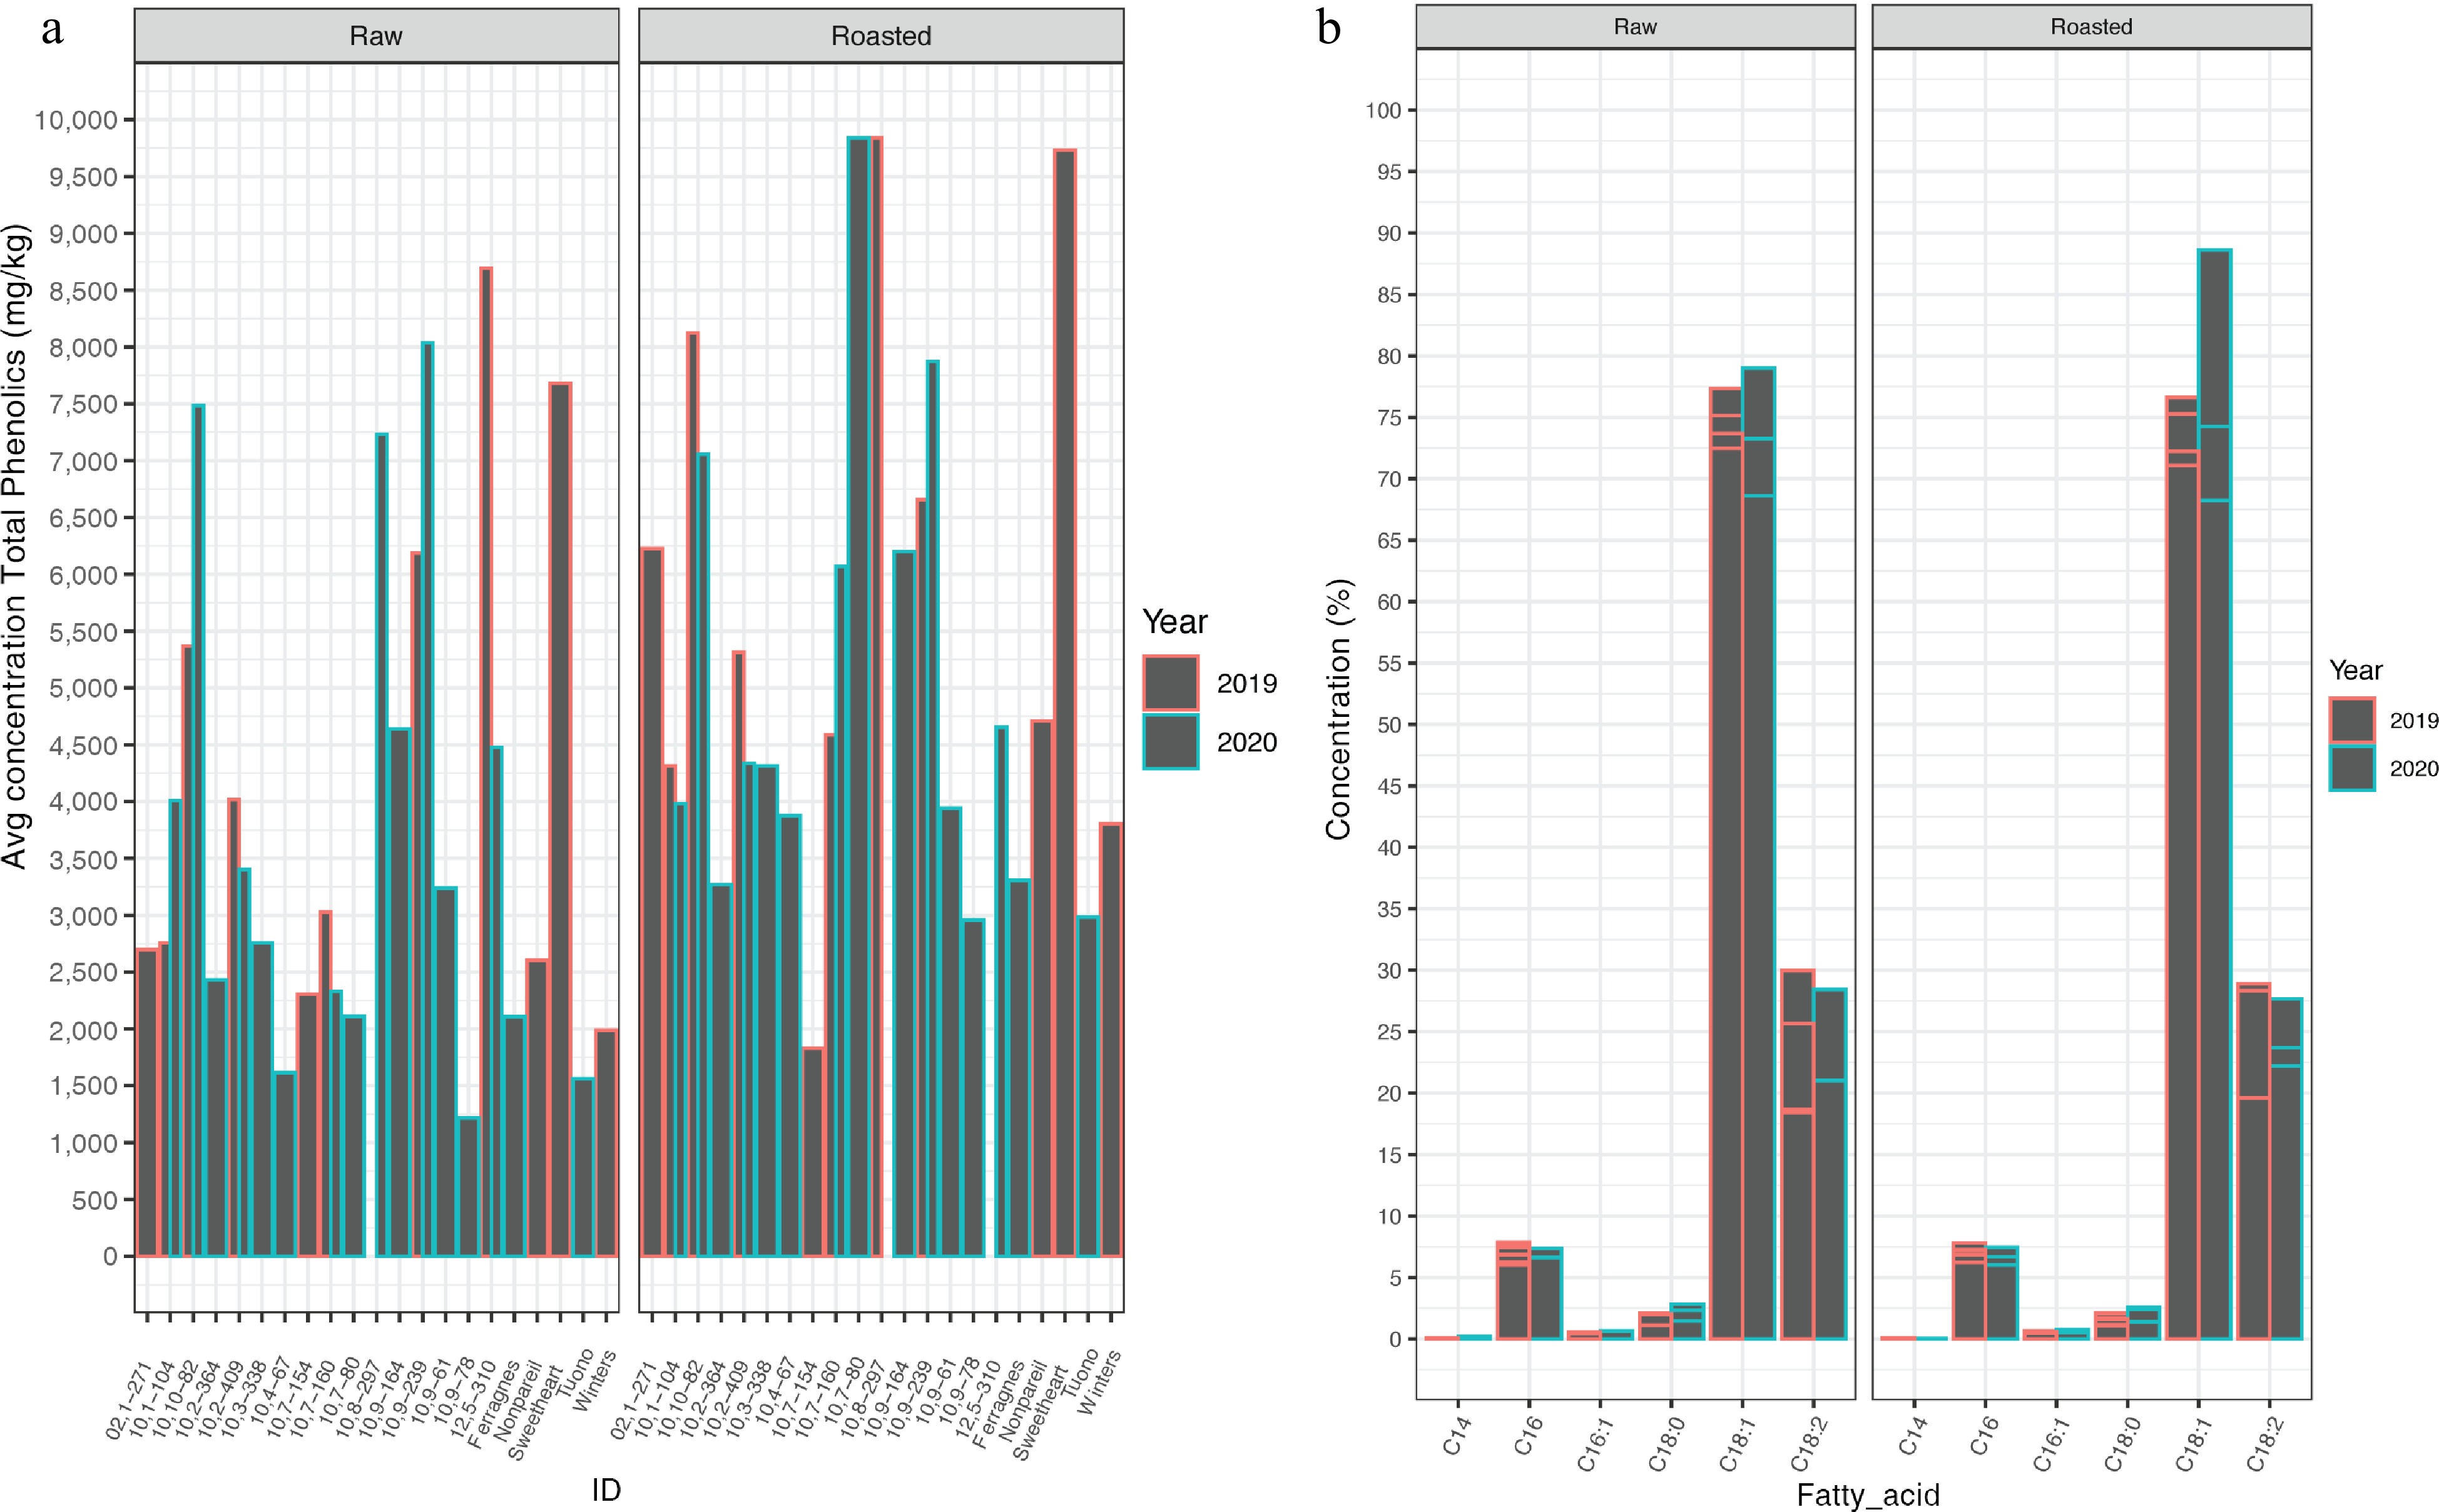
Figure 2.
Phenolics and fatty-acid profiles. (a) Mean phenolics (mg/kg) found in each 21 cultivar/selection for raw and roasted kernels in 2019 and 2020. (b) Percent concentration of total fatty acids found in 21 cultivar/selections for raw and roasted kernels in 2019 and 2020. C14:0 myristic acid, C16 palmitic acid, C16:1 palmitoleic, C18:0 stearic acid, C18:1 oleic acid, C18:2 linolenic acid. Error bars shown for each individual within a fatty acid grouping.
Table 2. Marker-trait associations for induction time with rancimat.
SNP Chromosome Position p-value maf Effect R2 Genotypes Method SPDU1_38502966 PDU1 38,502,966 5.58 × 10−06 0.225 0.842 0.052 C:C; C:T; T:T BLINK 2019/2020 SPDU1_36802517 PDU1 36,802,517 3.93 × 10−07 0.130 1.880 0.026 FarmCPU 2020 SPDU2_20978318 PDU2 20,978,318 4.37 × 10−06 0.059 2.107 0.066 C:C; C:T BLINK 2019/2020 SPDU2_17974418 PDU2 17,974,418 2.26 × 10−07 0.050 −2.665 0.063 FarmCPU2020 SPDU2_20691448 PDU2 20,691,448 2.72 × 10−07 0.260 −2.067 0.073 BLINK 2019 SPDU5_1476952 PDU5 1,476,952 1.36 × 10−05 0.127 1.490 0.041 FarmCPU 2020 SPDU7_23358253 PDU7 23,358,253 1.77 × 10−06 0.075 −3.07 0.014 FarmCPU 2020 SPDU8_24707583 PDU8 24,707,583 4.22 × 10−05 0.224 1.58 0.019 FarmCPU 2020 SPDU8_22120179 PDU8 22,120,179 1.29 × 10−06 0.304 −1.206 0.031 GG; T:G; T:T FarmCPU 2019/2020 maf = minor allele frequency, R2 = phenotypic variance explained, Effect is the allelic effect on a phenotype, Method is the year or combination (emmeans) of the years and the model used. Fatty acid profiles were determined for the 14 individuals that had either high or low induction time (Fig. 2b, Supplementary Table S4): myristic acid (C14:0) was found to range from 0.01%–0.13%, palmitic acid (C16:0) was found to range from 4.92%–7.46%, stearic acid (C18:0) was found to be between 1.31%–2.84%, oleic acid (C18:1) was found to be in the range of 60.94%–79.94%, and linoleic (C18:2) was 12.31%–28.43%. There was no significant difference between years and the state of almond kernels for C18:1 (Supplementary Fig. S2c). In ANOVA for α-tocopherol, the state was significantly different (p < 0.001) (Supplementary Fig. S2d).
Volatile concentrations found in almond kernel were lower than in oil (Supplementary Fig. S3, Supplementary Table S5). For 2019 harvest benzyl alcohol, nonanal, benzaldehyde, o-cymene and alpha phellandrene were elevated in some samples. Alpha-phellandrene was found to be highest (1.534 g/kg) in 10,1-104 for roasted kernel sample. In fact, hexanal, ethylbenzene and D-limone were also elevated in this sample. D-limonene was found in raw and roasted 2019 kernels. For 2019 oil samples from raw kernels 10,2-409 was highest in benzyl alcohol (42.496 g/kg), and for roasted kernels, 10,10-82 was highest in nonanal (27.644 g/kg), benzaldehyde (25.809 g/kg) and o-cymene (9.894 g/kg). O-cymene was found in higher amounts in 10,2-409 (7.140 g/kg) for raw kernel. For 2020 kernels, benzaldehyde was detected in higher amounts for 10,10-82, 10,9-239, and 'Tuono' (raw and roasted). For 2020 kernel oil samples benzyl alcohol, nonanal, benzaldehyde and 2-hexenal were detected. Benzaldehyde was found highest in 10,7-160 (48.651 g/kg) for roasted kernel oil and 10,8-297 (35.167 g/kg) for raw kernel oil. Nonanal was found highest in 10,8-297 (59.072 g/kg) and 10,9-61 (58.33 g/kg). 2-hexenal was found higher in 10,10-82 (12.068 g/kg) and 10,7-160 (8.397 g/kg). O-cymene was found in many 2020 kernel oil samples in elevated amounts varying from 9.083–33.083 g/kg.
Selection 10,7-160 had highest amount of α-tocopherols (Supplementary Table S6) for both raw and roasted (455.20 and 436.12 mg/kg), while 10,8-297 had lowest α-tocopherol for roasted kernel (166.18 mg/kg) and 10,10-82 had lowest α-tocopherol for raw (210.83 mg/kg).
'Winters' had a low induction time of 5.63 h, low C18:1 of 64.70 ± 1.91 mg/kg, low phenolics of 2,897 ± 1,002 mg/kg and low α-tocopherol 505 ± 86.9 mg/kg. Selection 10,10-82 had high induction times (13.01 and 25.45 h), high in phenolics 4,587.50 mg/kg, high in C18:1 of 75.91% ± 0.90%, however roasting of this genotype caused high levels of nonanal (49.37 g/kg) and o-cymene (35.340 g/kg). 'Sweetheart' was found to be high in phenolics for raw and roasted kernels, and had a longer induction time.
Genotyping-by-sequencing (GBS)
-
In sequences generated by GBS, 94% was aligned to the 'Nonpareil' genome V1.0. The total number of SNPs that were obtained by GBS was 3,691,811 and after filtering was 2,293 with 264 individuals. Mean sequencing quality was found to be 640, mean sequencing depth was 8, mean missingness was 22%, mean depth/individual was 7−12, and mean minor allele frequency (MAF) was 0.05. LD decay extended long distances up to 420 kb: chromosome 1 − 97 kb, chromosome 2 − 133 kb, chromosome 3 − 420 kb, chromosome 4 − 102 kb, chromosome 5 − 35 kb, chromosome 6 − 149 kb, chromosome 7 − 428 kb, chromosome 8 − 34 kb (Supplementary Fig. S4). Population structure analysis revealed that the families in this study had six distinct grouping with admixture (Supplementary Fig. S5).
Genome-wide association
-
In multi-year analysis (2019 and 2020) marker-trait associations (mta) were found on chromosomes 1, 2, and 8 (Fig. 3, Table 2) for models Blink and FarmCPU. The variance explained for these are found in Table 2 (0.05, 0.06, and 0.03 respectively). For single year analysis (2019), mta was also found on chromosome 2, nearby the multi-year MTA and for the single year analysis (2020) MTA were also found nearby MTA on chromosome 1 and 8, with the addition of mta on chromosome 5 and 7. The MTA on chromosome 2 for FarmCPU model with 2020 data was in strong LD = r2 = 0.75 with the MTA on chromosome 2 found in the multi-year data with the BLINK model. A heatmap of kinship relationship reveals many kinship values were between 0.20–0.40 (Supplementary Fig. S3). The dendrogram displays the six distinct clusters the families are divided into. The smallest, most distinct cluster are the peach individuals (Supplementary Fig. S6a). The PCA plot shows the six grouping for the families (Supplementary Fig. S6b).
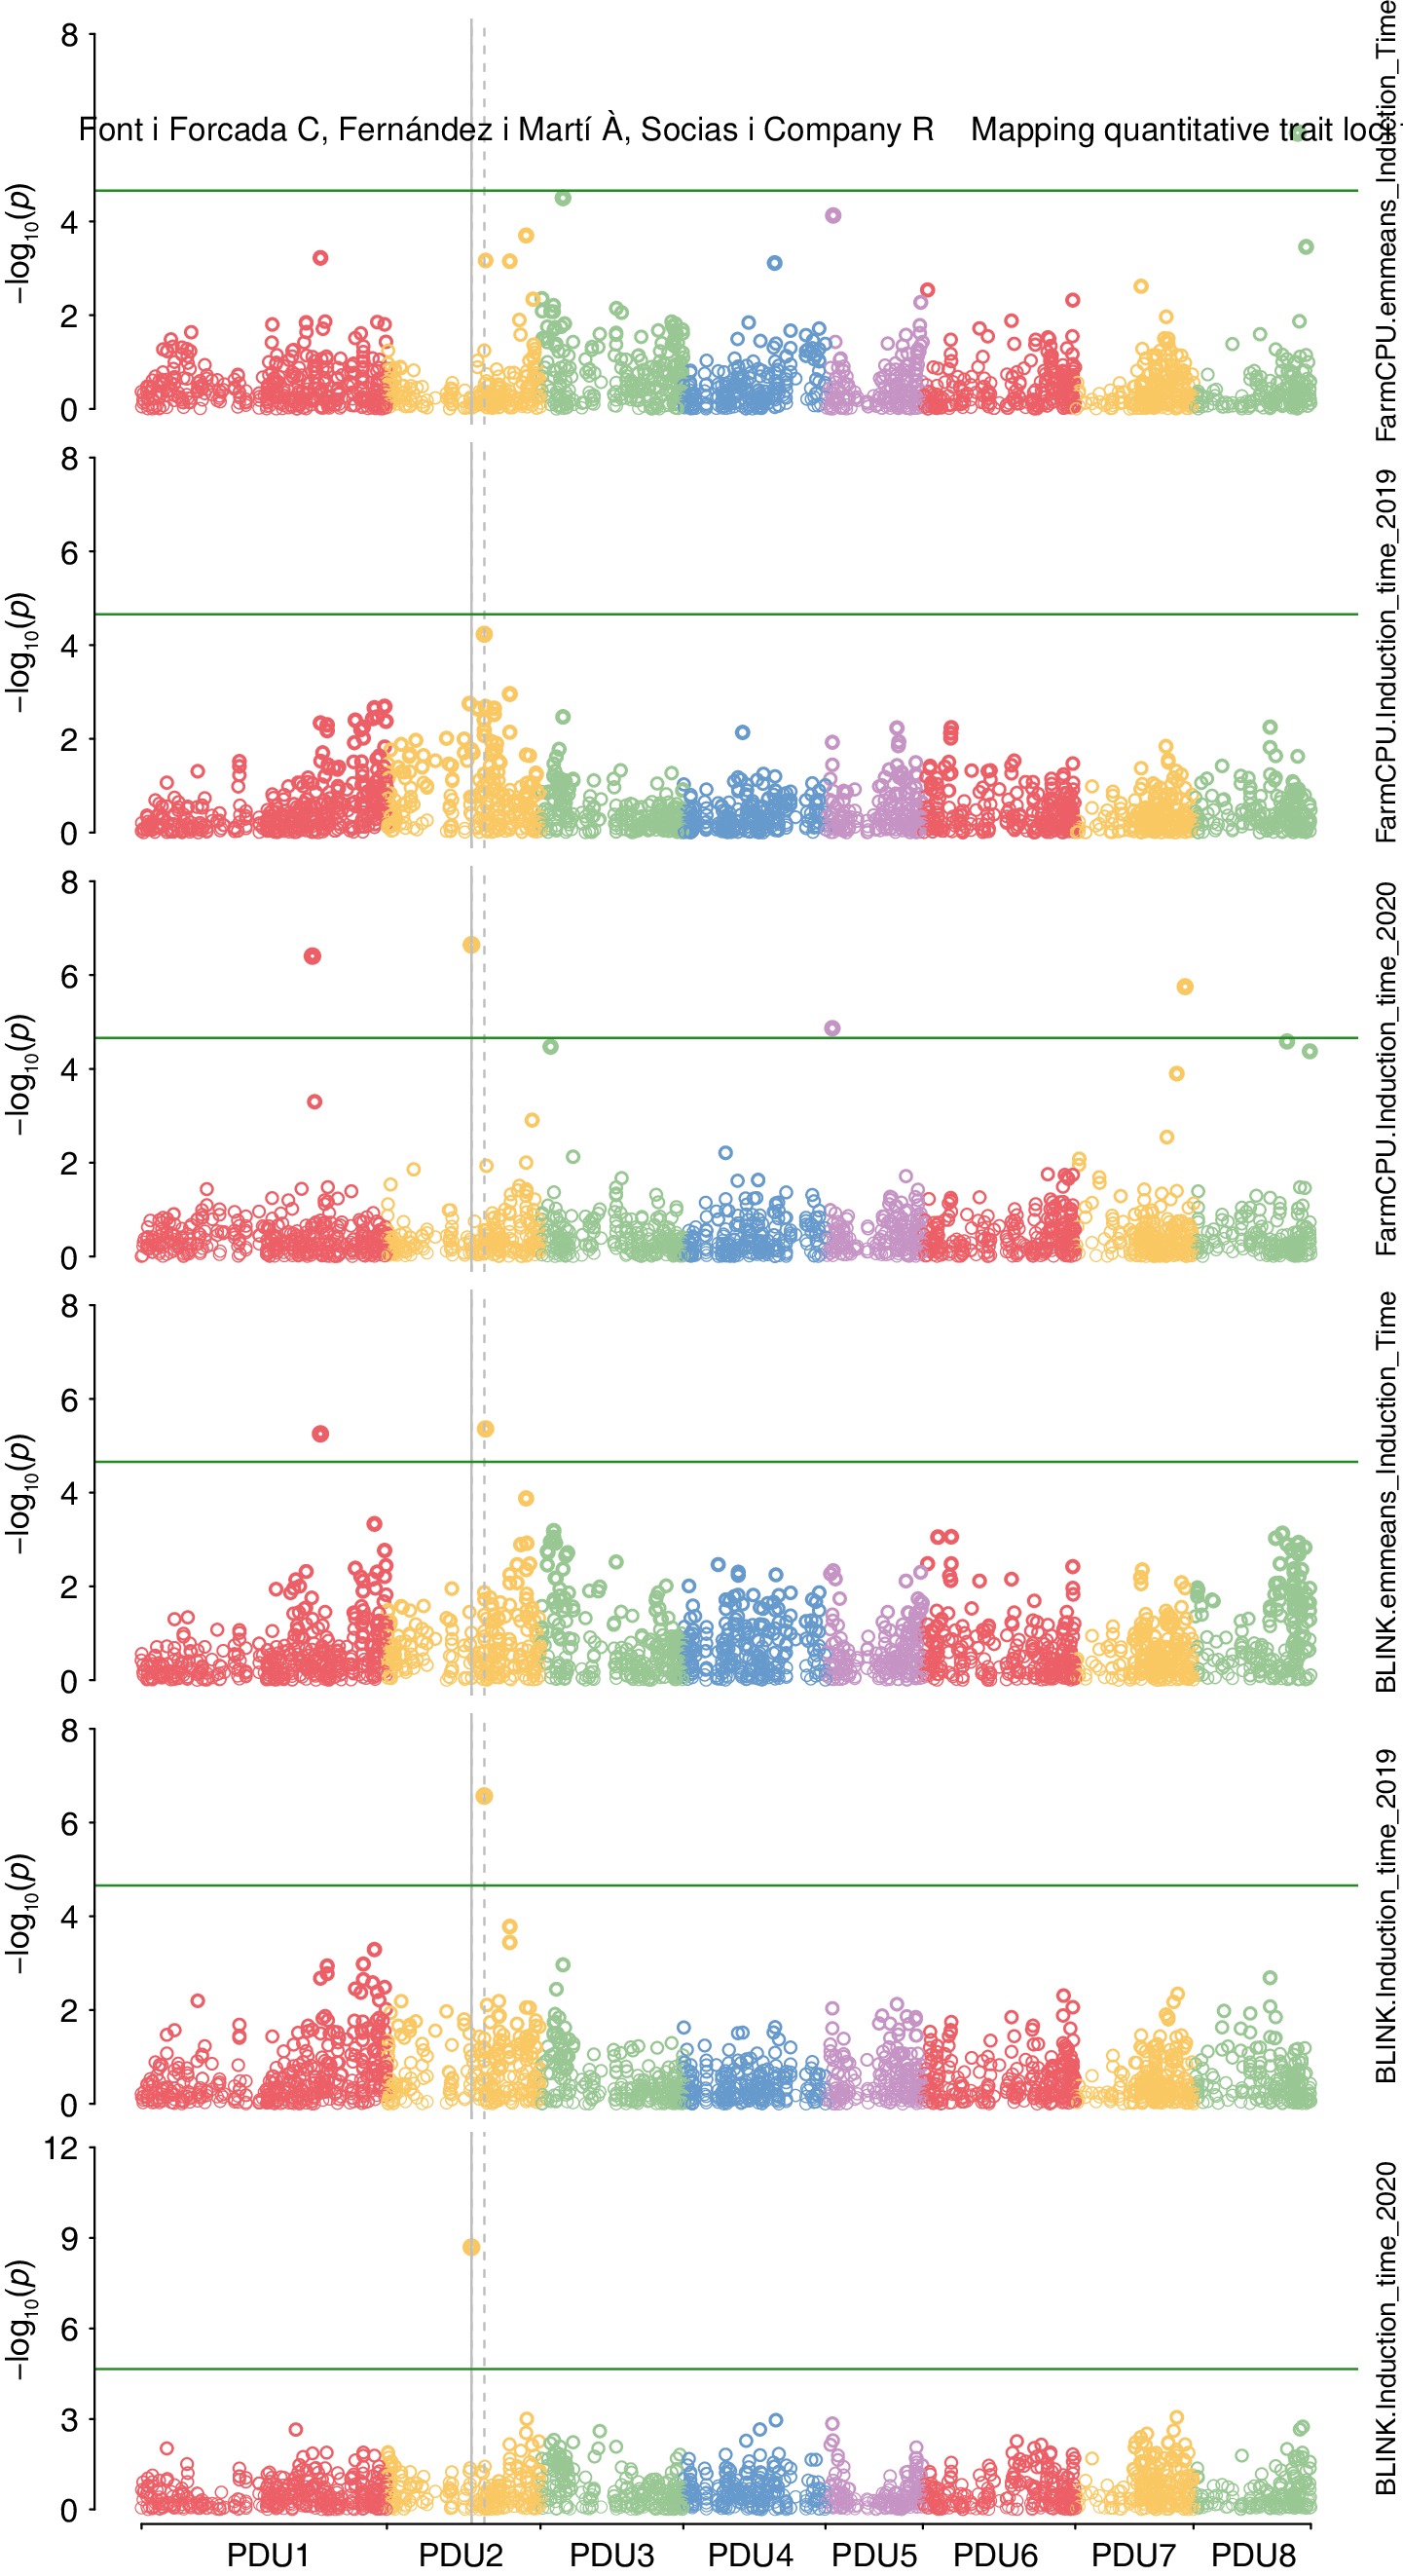
Figure 3.
Genome-wide association for induction time performed. Model Blink was used with an input of adjusted mean value of induction time for two years and single year analysis. Model FarmCPU was used with an input of adjusted mean value of induction time for two years and single year analysis.
Application of KASP assay
-
Three MTA were detected in both years. These were analyzed and converted to KASP assays. At SPDU1_38502966, almond kernels from trees with the T allele possessing genotypes C:T or T:T have longer induction times, therefore greater shelf-life (Fig. 4). At SPDU2_20978318, almond kernels from trees with the T:T genotype had longer induction times than C:C trees. Finally, at SPDU8_22120179, almond trees with the T:G genotype had longer induction times (Fig. 4). There were additive effects for SNPs found on chromosomes 1 and 2. Statistical differences were found between genotypic classes for SPDU1_38502966, SPDU2_20978318, and SPDU8_22120179 (p = 5.01 × 10−09, p = 0.005, p = 0.042 respectively).
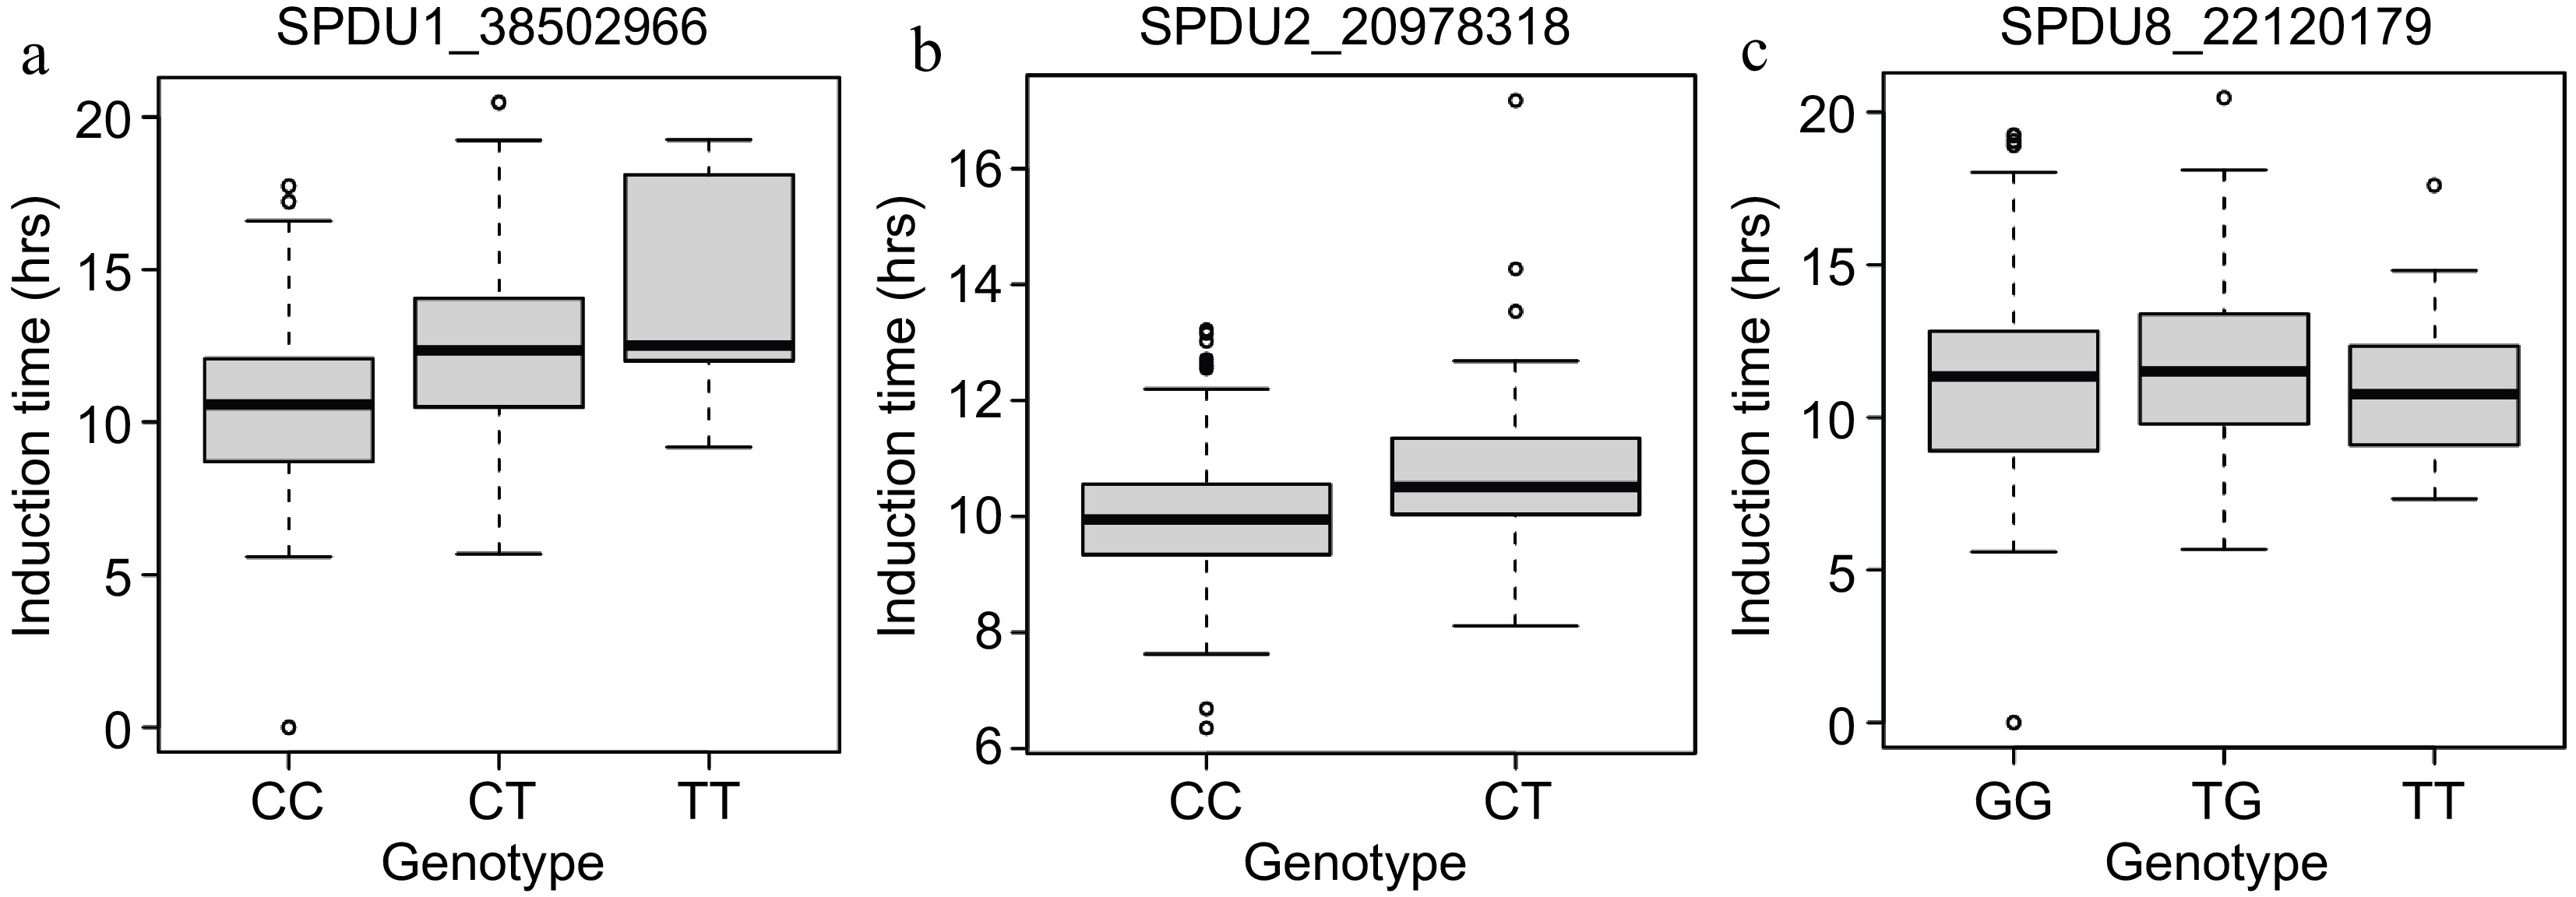
Figure 4.
Genotype plots for marker-trait associations. (a) SPDU1_38502966. (b) SPDU2_20978318. (c) SPDU8_22120179.
One-hundred seven individuals were used to check accuracy of the three KASP assays, which included 24 common almond cultivars (Supplementary Table S7). Fifty-two of these individuals were unrelated to individuals in the GWAS panel. One KASP assay was able to differentiate between genotypes within the validation panel with high confidence. SPDU1_38502966 genotyped correctly 73.43% of the time for C:C genotypes, that is the C:C genotype matched up with shorter induction times (< 9.88 h), and 69.56% for T:C and 44.44% for T:T making the T allele for longer induction times (> 9.88 h) (Table 3). Therefore, this marker correctly predicted phenotypes in 55.26% of the samples based upon induction times. SPDU2_20978318 only had two marker classes present in this panel; it genotyped 41.6% of the time correctly for T:C and 43.02% for C:C genotypes both for shorter induction times which showed no real discrimination between genotypes. SPDU8_22120179 genotyped 62.00% correctly for G:T genotypes, 52.94% for G:G and 75.00% for T:T, where the G allele is for longer induction times predicting the phenotype 90.24% of the time in the samples, and the T allele is for shorter induction times (Table 3, Supplementary Fig. S7). Genetic sequences for the KASP assays can be found in Supplementary Table S8, and full SNP dataset can be found in Supplementary Table S9.
Table 3. Classification of almond trees according to their SNP genotypes obtained with KASP markers and lipid stability classification.
SNP ID SNP
genotypeShelf-life/lipid stability classification Low High SDU1_38502966 C:C 47 17 T:C 7 16 T:T 4 5 SDU2_20978318 C:C 49 37 T:C 7 5 SDU8_22120179 G:G 16 18 G:T 31 19 T:T 12 4 The number of genotypes shown in each classification. Low is defined as any value below 9.88 (the mean), while high is any value above 9.88. -
Shelf-life stability as measured in this experiment by the induction time with the rancimat had a high positive correlation with oleic acid (C18:1) and a moderate correlation with stearic acid (C18:0). High oleic acid can provide greater oxidative stability[30]. For example, there has been an emphasis on breeding for high oleic rapeseed[31], for shelf-life stability. Almond fatty acids are comprised of mainly oleic (62%−80%), followed by linoleic (10%−18%), palmitic (0.5%−8%), and stearic (1%−3%) acids[32]. We did not observe a significant difference in fatty acid composition between raw and roasted kernels and year of harvest. This suggests that fatty acid composition is relatively unaffected by roasting and crop year. Oleic acid (C18:1), palmitic (C16:0) and stearic (C18:0) were found to be in this study within the standard range of previous studies[33,34]. C18:1 and C18:2 were slightly elevated to numbers in the literature, but inversely correlated with each other[33,35].
Raw almond kernels contain few volatiles, and levels increase in roasted almonds[36]. Hydroperoxides form when an oxygen is added to oleic acid at carbon 8, 9, 10 or 11. These decompose and lead to volatile products: C9 hydroperoxide results in nonanal, C10 hydroperoxide results in octane, 1-octanol, or nonanal[32]. In roasted almond oil nonanal was found in higher amounts, while 1-octanol was found, but in lower amounts. The decomposition of linoleic acid hydroperoxides results in volatile products hexanal and 2-heptenal at C12 and pentane, 1-pentanol and hexanal at C13[32]. We observed hexanal in 2019 in raw and roasted almonds and 1-pentanol in small amounts in both 2019 and 2020 raw and roasted almonds. Franklin et al.[2] characterized chemical and sensory changes of almonds that were in 12-month storage and similarly identified the following compounds as reported in Supplementary Fig. S4: organic acids acetic and hexanoic, high molecular weight alcohol 1-hexanol, 1-octanol, 1-pentanol, high molecular weight aldehyde 2-hexenal, benzaldehyde and nonanal, and terpenes 3-carene, alpha-pinene and o-cymene.
Almond phenols are contained within the skin where they cause almond color, astringency, and shelf-life preservation due to antioxidant and antimicrobial activity[37]. Flavonoids are polyphenolic secondary metabolites which are antioxidants located in the seed coat of the almond and are known to protect against oxidation of lipoproteins. Dark roasting was found to increase total phenolic content in our panel of almonds. Similarly, Chandrasekara & Shadidi[38] reported that high temperature roasting (130 °C), lower than the temperature we used, of cashew nut caused significantly higher total phenolic content than in raw cashew nut. Bolling[39] also found that the amount of phenolics differed among cultivars and years. In many cases, a higher amount of total phenolics contributed to an overall longer run time on the rancimat, however, this positive correlation between the two was weak. This could be due to the fact that the sample size for evaluating the correlation was only 21 individuals across two years and only roasted kernels were used. In order to get a better sense of true correlation, a larger panel of individuals would need to be evaluated.
Tocopherols are lipid-soluble antioxidants that can protect against oxidative stress[40]. We found that a higher amount of α-tocopherol did not contribute to a longer run time on the rancimat. This indicates other chemical compounds are at play in resistance to rancidity. We also found that there was a significant difference in α-tocopherol for raw and roasted almond kernels. Interestingly, there was a moderately negative correlation with induction time and α-tocopherol. A possible explanation is that α-tocopherol breaks down more rapidly in the presence of elevated temperatures (> 100 °C) as seen here in this experiment. Bruscatto et al.[41] found that amongst the different tocopherols in rice bran oil, α-tocopherol was found to be the least stable and degraded at temperatures of 100 °C and above.
Almond varieties and selections possess different chemical compositions which contribute to their shelf-life stability. 'Tuono', a self-compatible cultivar popular in Europe had lower phenolics, elevated nonanal, lower oleic acid and became rancid quickly. Similarly, cultivar 'Winters' had low phenolics, lower oleic acid, low α-tocopherol, and also became rancid quickly. 'Sweetheart' demonstrated that it became rancid over a longer period of time, had higher phenolics and higher oleic acid content. Both selection 10,10-82 and selection 10,8-297 showed promise as potential cultivars with extended shelf-life due to possessing higher oxidative stability across two years of data, high phenolic content, high oleic acid content, high amounts of nonanal and benzaldehyde, however were found to be low in tocopherols. In comparison, 'Nonpareil' had a moderate amount of phenolics, a high fat content, a higher oleic acid content and a moderate induction time.
In this experiment, we developed a fast and accurate method for measuring rancidity in roasted almond kernels. We then applied this dataset and using genotypic data obtained by GBS, we conducted GWAS. Similarly in almond, Goonetilleke et al.[42] implemented a GBS protocol for SNP discovery identifying 11,936 SNPs, genetic mapping and QTL mapping, whereas in this study we used more stringent filtering by identifying 2,293 SNPs. In addition, this study evaluated the kinship relationships of the families which many had high values indicating full-sibling or second-degree relationships. This is important in making selections for extended shelf-life as many individuals that were in the same families had similar induction times with the rancimat.
Our results found on chromosome 1 corroborate the results from two studies performed by Fonti i Forcada et al.[1,43]. The former study evaluated a biparental population 'Vivot' × 'Blanquerna' for almond quality and found QTLs on chromosome 1 for tocopherols and stearic acid at 38 cM at the lower end of the chromosome. The latter study evaluated a larger association panel of 98 almond accessions with SSR markers and also found a marker-trait association on chromosome 1. Both of these studies found large effect loci explaining trait variation, however in this experiment we found many small effect loci. The MTA we found on chromosome 1 was also towards the end of the chromosome.
The use of KASP assays have been gaining popularity particularly for marker-assisted selection of breeding populations to accelerate genetic gains[44]. We developed a KASP assay from a SNP marker that was discovered with GBS and found to be associated with the trait of interest. By applying the KASP assay to a diverse panel of materials we found that both SDU1_38502966 and SPDU8_22120179 were predictive of lipid stability, where the markers could be applied in an almond breeding program. This is based on its strong associations with phenotypic traits measured here, and on its validation using a KASP assay applied to a different panel of materials. The other KASP assays from mta on chromosomes 2 did not reveal strong predictive power and would not be recommended for routine screening. An additional study perhaps can further convert all MTA to KASP assays and screen unrelated individuals with a larger validation panel to identify if other markers are predictive of phenotype. Further studies might explore the functional genes for the SNP locations found in this study.
-
We presented a novel method for determining oxidative stability in almond kernels that showed a strong correlation with fatty acid C18:0. We found that higher phenolics, oleic acid and fat content contributed to lipid stability. Two selections and a cultivar from the UC Davis breeding program were identified to have extended shelf-life and therefore can be used in breeding lines. The KASP markers SDU1_38502966 and SPDU8_22120179 demonstrated utility to be used for screening individuals in a breeding program for extended shelf-life.
-
All data generated or analyzed during this study are included in this published article and its supplementary information files.
We want to thank student intern Wenzhu Zhang for his assistance with the rancimat machine runs and Alyson E. Mitchell for use of a moisture chamber and oven. This work was funded by the Almond Board of California, HORT 46.
-
The authors confirm contribution to the paper as follows: study conception and design: Sideli GM, Gradziel TM, Wang SC; data collection: Sideli GM, Allen BJ, Grilo FS; draft manuscript preparation: Sideli GM. All authors reviewed the results and approved the final version of the manuscript.
-
The authors declare that they have no conflict of interest.
- Supplemental Table S1 Mean induction time (hrs) for roasted almond kernels. 270 genotypes were assessed for two years of harvest, 2019, 2020. The mean and standard deviations are supplied for each genotype.
- Supplemental Table S2 Total fat content for raw and roasted almond kernels. Mean fat (g/100g) are displayed.
- Supplemental Table S3 Total phenolic compounds (mg/kg) for raw and roasted almond kernels. Means and standard deviations are provided for two years of harvest, 2019, 2020.
- Supplemental Table S4 Fatty acid profiles for raw and roasted almond kernels. Displayed in percents. C14:0 = myristic acid, C16:0 = palmitic acid, C16:1 = palmitoleic acid, C18:0 = stearic acid, C18:1 = oleic acid, C18:2 = linoleic acid.
- Supplemental Table S5 Volatiles identified in raw and roasted almond kernels. Abundance of each volatile is measured in mg/kg.
- Supplemental Table S6 Tocopherol content measured in raw and roasted almond kernels. Delta, gamma, alpha and total tocopherols measured for two years of harvest, 2019, 2020.
- Supplemental Table S7 Individuals included for each experiment; rancimat, GWAS, fatty acids, phenolics, fat content, volatiles, tocopherols and KASP.
- Supplemental Table S8 KASP marker sequences. Marker sequences for SNPs from chromosomes 1, 2, and 8.
- Supplemental Table S9 Marker data file in hapmap format. File used for genome-wide association in GAPIT 3.
- Supplementary Fig. S1 Correlation plots for biochemical data. (a). Phenolics, fatty acids, tocopherols, induction time and fat content are shown with correlations and significance. (b). Volatiles correlations with induction time.
- Supplementary Fig. S2 ANOVA tables. (a). Total fat content (b). Phenolics (c). Oleic acid (d). alpha tocopherol.
- Supplementary Fig. S3 Heatmap of volatiles identified in raw and roasted almond kernels. Abundance of each volatile is measured in mg/kg.
- Supplementary Fig. S4 LD decay plots. Shown for each chromosome across a 500kb window.
- Supplementary Fig. S5 Population structure plot. Calculated for 2,293 SNPs and 264 individuals.
- Supplementary Fig. S6 Kinship relationships and 3-D Principal Component Plot. (a). Heatmap with kinship values (0−2) with dendrogram for 264 individuals (b). Displays the distinct groupings for the sampled families.
- Supplementary Fig. S7 KASP plots for genotyping with KASP assays. Three KASP assays were tested on a panel of 107 genotypes. (a). SPDU1_38502966 (b). SPDU2_20978318 (c). SPDU8_22120179.
- Copyright: © 2025 by the author(s). Published by Maximum Academic Press, Fayetteville, GA. This article is an open access article distributed under Creative Commons Attribution License (CC BY 4.0), visit https://creativecommons.org/licenses/by/4.0/.
-
About this article
Cite this article
Sideli GM, Wang SC, Allen BJ, Grilo FS, Gradziel TM. 2025. A novel detection method for lipid stability in almond leads to the discovery of marker-trait associations. Fruit Research 5: e009 doi: 10.48130/frures-0024-0012 

A novel detection method for lipid stability in almond leads to the discovery of marker-trait associations
- Received: 14 July 2023
- Revised: 19 February 2024
- Accepted: 26 February 2024
- Published online: 03 March 2025
Abstract: Nut kernel rancidity is a significant postharvest concern because it compromises flavor and decreases shelf-life. Roasting of nut kernels changes the chemical structure and leaves the kernel more susceptible to rancidity. This is highly dependent upon the composition of the nut kernel. Almonds contain fatty acids and phenolic compounds which can reduce the effects of rancidity. Understanding the genetic basis of rancidity susceptibility can assist breeding efforts for superior almond varieties. In this study, a rancimat machine was used to measure the rancidity time in a panel of 270 almond trees over two harvest years. This panel represents seven almond families, common cultivars, and peach accessions. The rancimat uses a heat block and controlled air flow to rapidly accelerate the oxidation process from weeks or months to hours, which makes it feasible to measure rancidity. Marker-trait associations (MTAs) were made for both single-year and multi-year analysis using data generated from the rancimat and genotyping-by-sequence data. Stable MTAs were discovered on chromosome 2 for different models and years. Additional MTAs were found on chromosomes 1 and 8 which were in close proximity between years. Twenty-one almond trees, a subset of the original panel, that exhibited extended shelf-life from rancimat or exhibited a faster time to become rancid were further evaluation by biochemical analyses to confirm chemical composition. Three KASP marker assays were designed from these marker-trait associations and validated with a panel 52 almond genotypes for use in marker-assisted breeding. The markers developed from associated SNP on chromosomes 1 and 8 were found to be predictive of phenotype for shelf-life.
-
Key words:
- Almond /
- Lipid oxidation /
- Shelf-life /
- KASP markers